DOI:10.32604/cmc.2021.018525
| Computers, Materials & Continua DOI:10.32604/cmc.2021.018525 | |
| Article |
Automatic PV Grid Fault Detection System with IoT and LabVIEW as Data Logger
1Project Engineer, NWTF, Indian Institute of Technology, Kanpur, India
2Department of Computer Engineering, College of Computers and Information Technology, Taif University, Taif, 21944, Saudi Arabia
3School of Electronics and Electrical Engineering, Lovely Professional University, Jalandhar, India
4School of Computer Science and Engineering, Lovely Professional University, Jalandhar, India
5Department of Electronics and Communications Engineering, College of Engineering and Technology, Arab Academy for Science, Technology and Maritime Transport, Alexandria 1029, Egypt
6Department Electronics and Electrical Communications, Faculty of Electronic Engineering, Menoufia University, Menouf, 32952, Egypt
*Corresponding Author: Mamoon Rashid. Email: mamoon873@gmail.com
Received: 11 March 2021; Accepted: 16 April 2021
Abstract: Fault detection of the photovoltaic (PV) grid is necessary to detect serious output power reduction to avoid PV modules’ damage. To identify the fault of the PV arrays, there is a necessity to implement an automatic system. In this IoT and LabVIEW-based automatic fault detection of 3 × 3 solar array, a PV system is proposed to control and monitor Internet connectivity remotely. Hardware component to automatically reconfigure the solar PV array from the series-parallel (SP) to the complete cross-linked array underneath partial shading conditions (PSC) is centered on the Atmega328 system to achieve maximum power. In the LabVIEW environment, an automated monitoring system is developed. The automatic monitoring system assesses the voltage drop losses present in the DC side of the PV generator and generates a decimal weighted value depending on the defective solar panels and transmits this value to the remote station through an RF modem, and provides an indicator of the faulty solar panel over the built-in Interface LabVIEW. The managing of this GUI indicator helps the monitoring system to generate a panel alert for damaged panels in the PV system. Node MCU in the receiver section enables transmission of the fault status of PV arrays via Internet connectivity. The IoT-based Blynk app is employed for visualizing the fault status of the 3 × 3 PV array. The dashboard of Blynk visualizes every array with the status.
Keywords: Blynk app; IoT; LabVIEW; node MCU; PV array; RF modem; WSN
The photovoltaic industry has widened rapidly due to solar photovoltaic (PV) generation costs. Conversely, the implementation of a grid-connected PV infrastructure in developing countries has been facilitated by relevant government policies [1,2]. Many PV devices are currently in operation without any control function. This significant growth was not followed by system diagnosis, supervision, and fault detection, particularly PV systems with output power levels below 25 kW [3]. PV detection is a vital pillar of PV system performance and security [4]. The unclear fault causes power loss and may also lead to safety problems and fire dangers without identifying PV defects. The other factors which cause the PV system efficiency to reduce are shadow cast of trees, chimney, or buildings which influence the entire system output [5]. The effect of partial shading on solar PV power is a big concern for customers. By adjusting the PV solar modules’ settings, the effect of mismatch losses or partial shading will be reduced [6]. With wireless connectivity, the built device can track the defective PV remotely, and the LabVIEW generates a data logger in real-time. The system is equipped to supervise the voltage, current, and power of the PV array and transmit data to distant locations (Base Station) [7]. Automatic monitoring and fault detection for PAV focused on the PV device power failure analysis implemented in the MATLAB and Simulink environments.
The procedure involves the extraction parameters considering the environment irradiance and evolution of the module temperature. The measurement approach measures the depletion of the DC side’s output power and further capture losses (Lcm) [8]. To evaluate the PV array system’s nonlinear performance characteristics, since traditional safety systems are challenging to detect a range of defects, a method is proposed by Judgment Treaties (DT) for classifying and detecting the unnoticed failure [9,10]. The performance analysis for a sample of a UK-based domestic PV system in which five-minute average data on environment and performance is reported at two sites for up to 2 years of operation, which reveals an energy loss due to failures of 3.6%, 6.6%, 18.9% (the first year for sites A and B) and four distinct faults: zero efficiency faults, shading, non-zero efficiency, and non-shading faults [11]. The PSIM’s software package first developed a PSIM-based device simulation model of PV panels. It also introduced its V-I and P-V properties at variable surface temperature and isolation under regular operation. The simulation results show that the suggested error diagnostic system could detect the malfeasance corrections [12].
In the approach in [13], PV errors are being identified through indicators (residues) and a threshold value comparison of residuals. However, with the advancement of sensors and communication, the PV grid fault detection can be monitored and controlled from any location. The WSN-based PV array tracking system for real-time status uses the nF24L01 and ZigBee wireless communication [14]. The WSN based Node MCU method is used to detect PV systems’ defects in real-time [15,16]. IoT achieves real-time monitoring of PV arrays with the ZigBee network’s assistance [17,18]. For PV fault detection, a GPRS communication-based IoT system is implemented; it provides an opportunity to monitor from any remote location [19]. An IoT-based prototype is implemented for fault detection and monitoring of stand-alone photovoltaic systems (SAPVS) [20,21]. Cloud server and Raspberry-pi controller-based IoT platform are utilized to implement accurate monitoring and control the solar power and PV array [22]. In [23], the authors introduced a monitoring framework (MS) to calculate electrical and environmental variables to process instantaneous and historical data, enabling the estimation of plant productivity parameters. A 2 × 2 PV device with possible fault detection through voltage and current parameters embedded and real-time Data Logger, i.e., LabView, is integrated [24–26]. We systematically addressed all the proposed frameworks of the proposed low-cost data acquisition system and checked the proposed IoT Data Acquisition System (DAQ) under harsh environmental conditions over 28 days [27]. The IoT system for remote control of PV cells, which is based on RFID technology, measures the temperature of hot spots of the PV cells in real-time and transmits this information across the network via the SMTP protocol to central stations for proper action in the event of overheating anomalies [28]. A built-in health tracking unit installed in a grid-connected PV system is used to test the proposed solution. To detect any faulty module, each PV module is managed via WSN [29–31].
The significant contributions of our paper are:
• IoT-based fault detection and monitoring of 3 × 3 solar array PV system and a hardware system are implemented to automatically reconfigure the solar PV array from series-parallel (SP) to total cross-tied under partial shading conditions (PSC) based on Arduino system; to produce maximum power.
• LabVIEW is used to transmit faulty values of the PV array to the remote station through the RF modem for providing the status of the PV array.
• A cloud app is utilized for visualizing the data of the PV arrays.
The structure of the paper is organized as follows. Section 2 describes the system with the schematic circuit for the fault detection and monitoring of the PV array. Section 3 discusses the proteus model of the proposed system. Section 4 presents the real-time hardware implementation for the monitoring PV array. Section 5 shows the LabVIEW-based data logger of the proposed system and presents the cloud-based app for logging and controlling the PV arrays. Section 6 is devoted to the main conclusions of this work.
There are several fault detection techniques available over the solar PV arrays which are determining different parameters. In the embedded-based fault detection technique, multiple voltage sensors are placed along with the 3 × 3 PV array. These sensors are interfaced with the microcontroller unit. The analog output of these different sensors needs to be converted into the digital out as the controller can understand only digital language. The controller used is Arduino Mega having 15 analog read pins. The Analog to Digital Converter of Arduino Mega is 10 bits wide, i.e., it is having a resolution of 210 = 1024, and each voltage sensor is connected to a 5 V power supply. So, the sensor provides approximately 5 mV corresponding to the 1 level. So, the system is monitoring these levels. If there is full radiation, the analog levels are more than a predefined value, and if these levels reduce below, then we are considering it a binary value and creating a weighted value (WV) according to the radiation over the PV arrays as given in Eq. (1):
Now for each sensor, the system is getting a weighted value. Based on this obtained value, the system is deciding whether there is a shading effect or, mainly, over which PV panel shading occurs. The proposed system is capable of finding the fault that occurs in any panel of the PV array and, at the same time, monitoring the various parameters of the PV array system. The supervision and fault detection techniques are developed by using two different methodologies. The PV array comprises 3 × 3 arrays in which three panels are connected in series with each other, and the combination of such series connections are connected in parallel with each other. Now, for the fault detection, a voltage sensor is connected with each panel. Fig. 1 shows the architecture of the fault detection and the supervision system on the transmitting side.
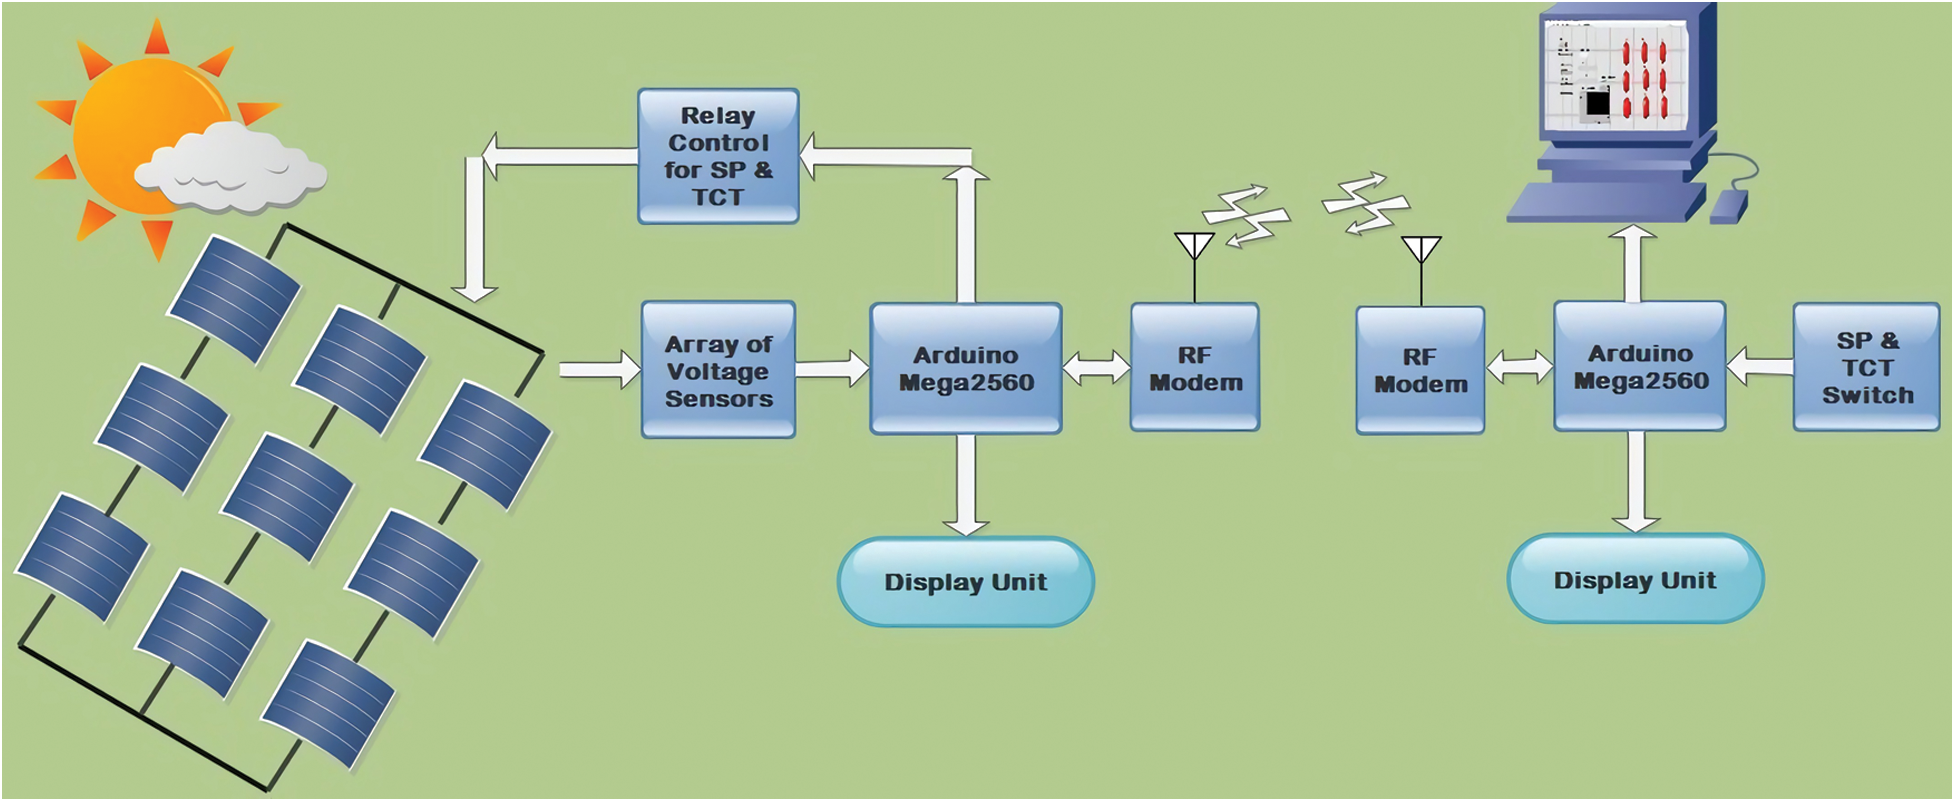
Figure 1: Architecture of the proposed system
For the fault detection, nine different voltage sensors are connected across the arrays, as shown in Fig. 2. Each panel has its voltage and current, and we are considering the voltage across each panel. The output of these voltage sensors is provided to the Analog-to-Digital converter of the Arduino Mega 2560. The voltage sensor’s output is analog, and the controller is capable of read-only digital value, so these values are converted into the digital value before processed by the controller. If the panel is working according to the rating, then the voltage sensor’s output provides a defined level that corresponds to the panel’s output. If the panel is not working or some fault occurs in the panel, this level reduces or becomes zero. From these levels, the controller decides whether the panel is working or not. The built-in program of the Arduino Mega 2560 reads these levels and converts them into weighted values using C language programming. This programming processes the whole data and provides a single numerical value. This numerical value takes change according to the fault that occurs in the panel, and each faulty panel has its different value, and for multiple fault panels, the value varies according to the total number of faulty panels.
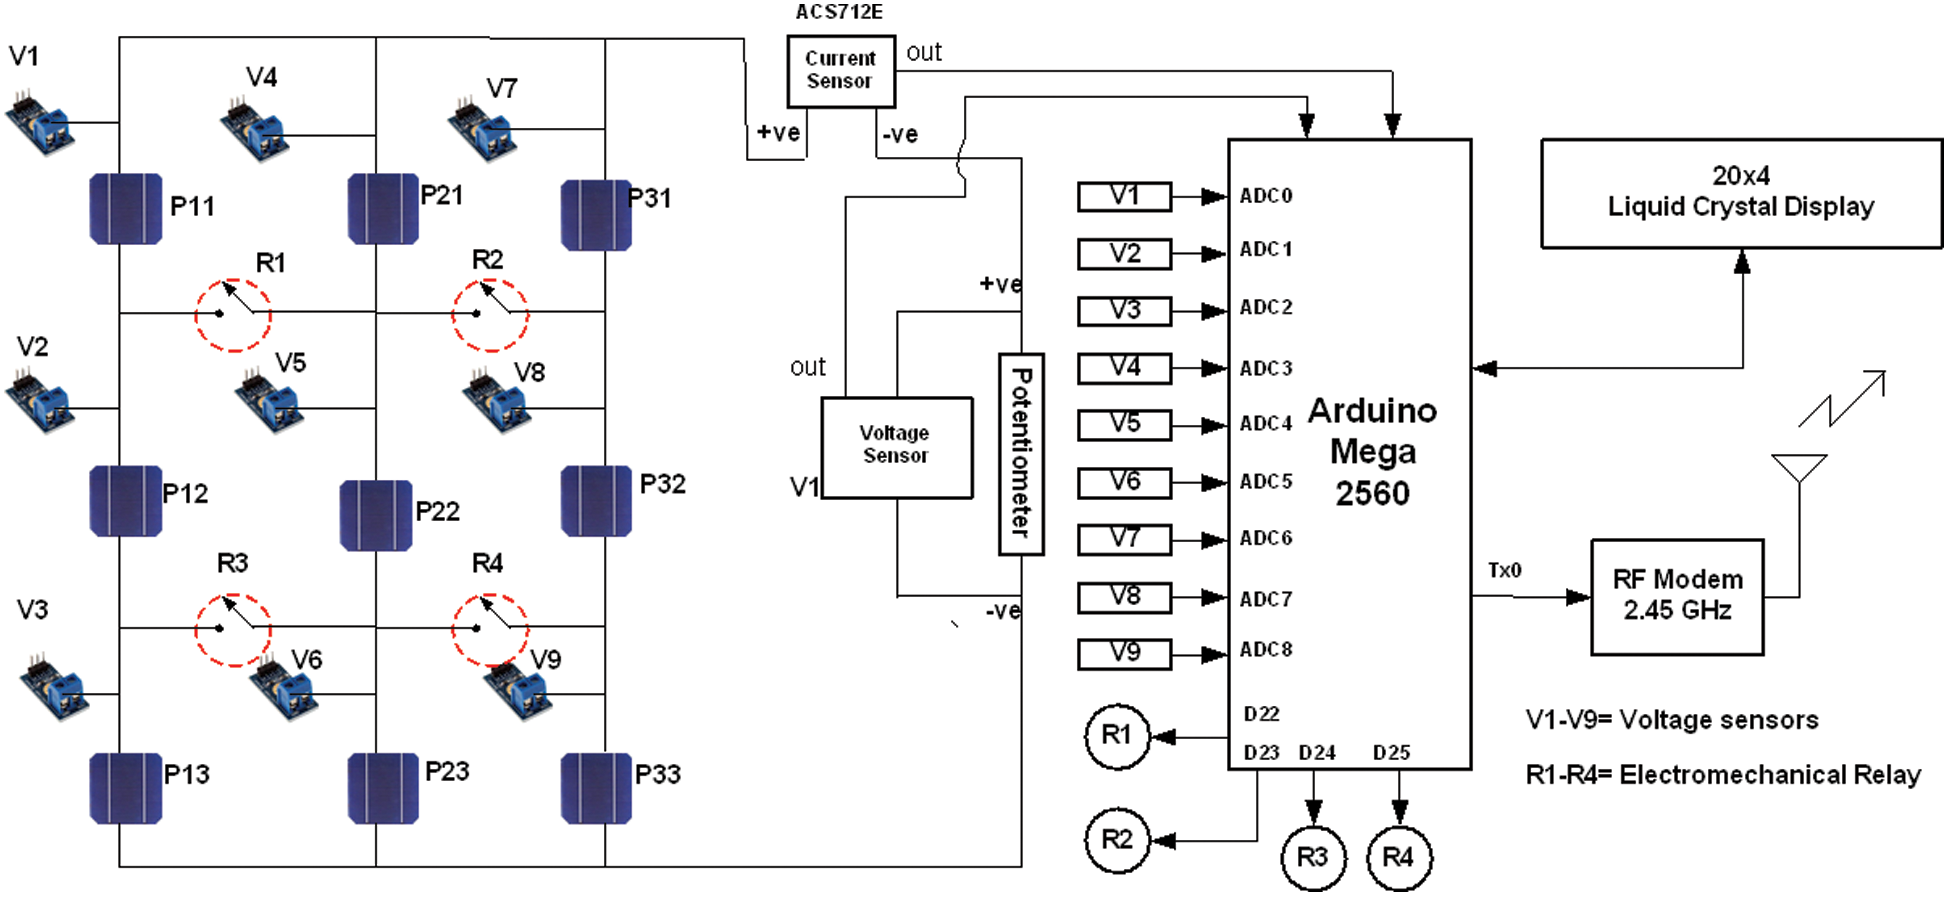
Figure 2: Schematic architecture of the transmission unit
The system monitors this value. If the value changes, then the system determines which panel fault has occurred, and corresponding to that value, it sends a character value through the RF Modem as shown in Fig. 3. The same controller-operated unit receives this character and decides according to the received value on the receiving side. Both transmitter and receiver are synchronized with each other in terms of coding, and fault detection protocol through the embedded coding. On the receiving side, the controller unit is interfaced with the LabVIEW through the Serial communication port, and LabVIEW is receiving the character data sent by the transmitter unit. The LabVIEW provides the visual display over the system through an Indicator bulb; Green indicates if a panel is working fine or becomes Red if any fault occurred in the panel.
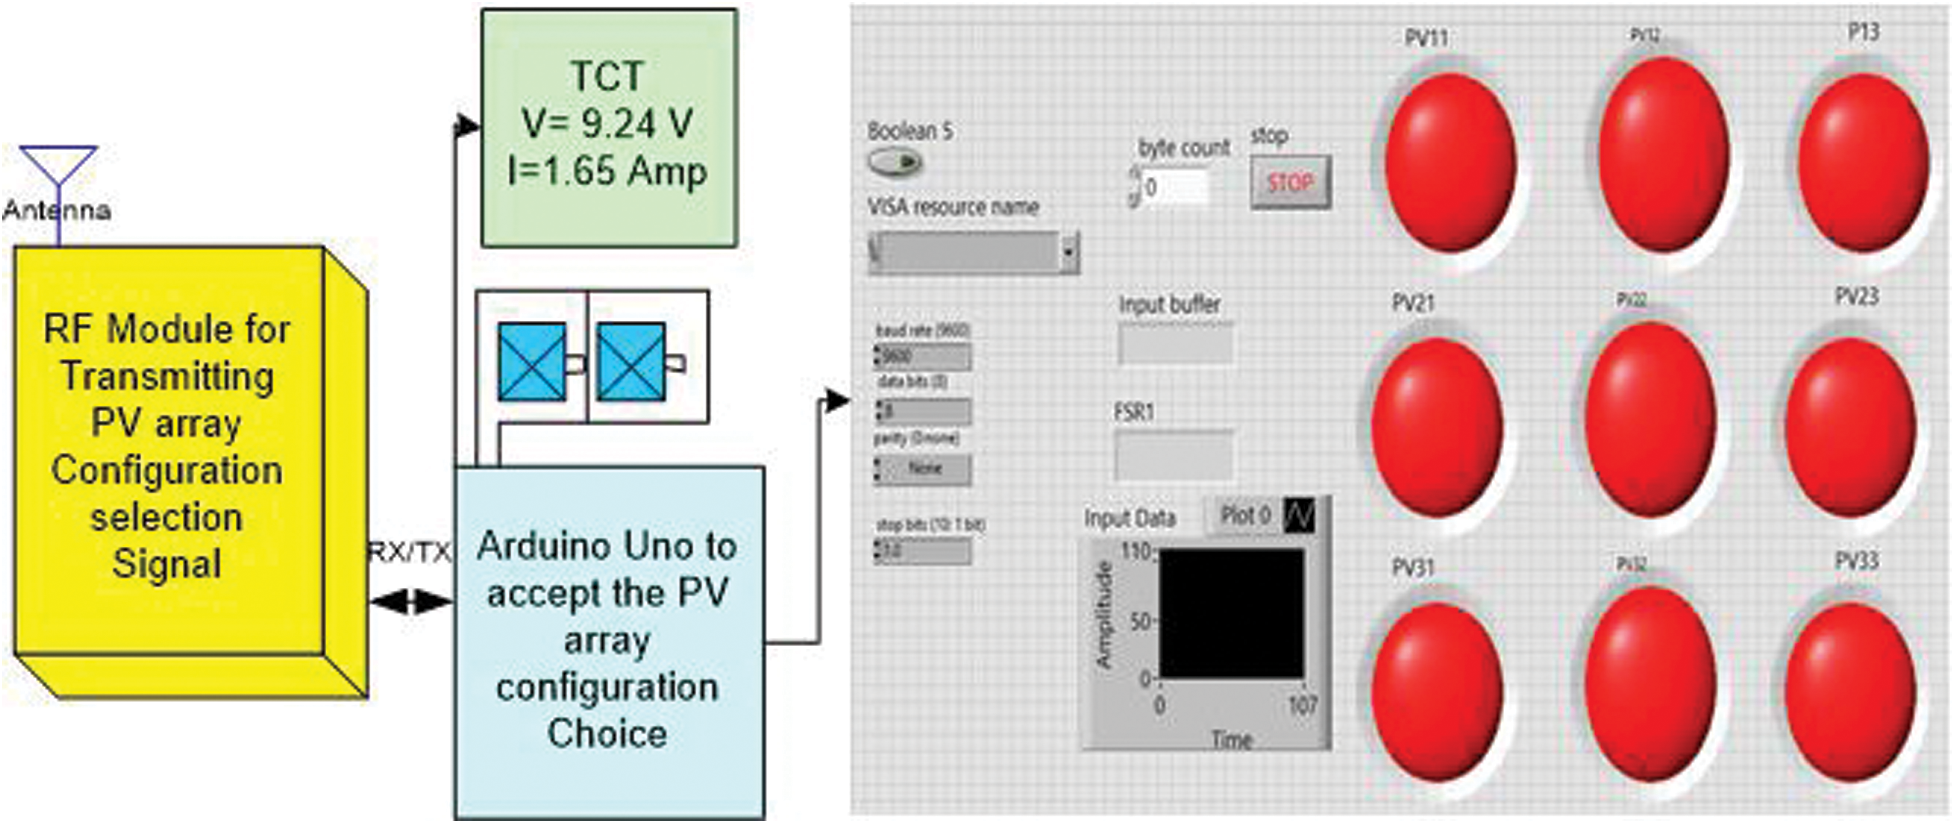
Figure 3: Schematic architecture of the receiver unit
3 Proteus Simulation of Proposed System
In the system’s actual implementation, the various parameters, connections, and other data are first to run over the proteus simulation, which provides the exact implementation procedure for the system. Fig. 4 shows the proteus model of the designed system and the voltage and current relation at various nodes that have been measured. The fault detection decision is taken via varying the light intensity through the virtual lamp taken in the simulation.
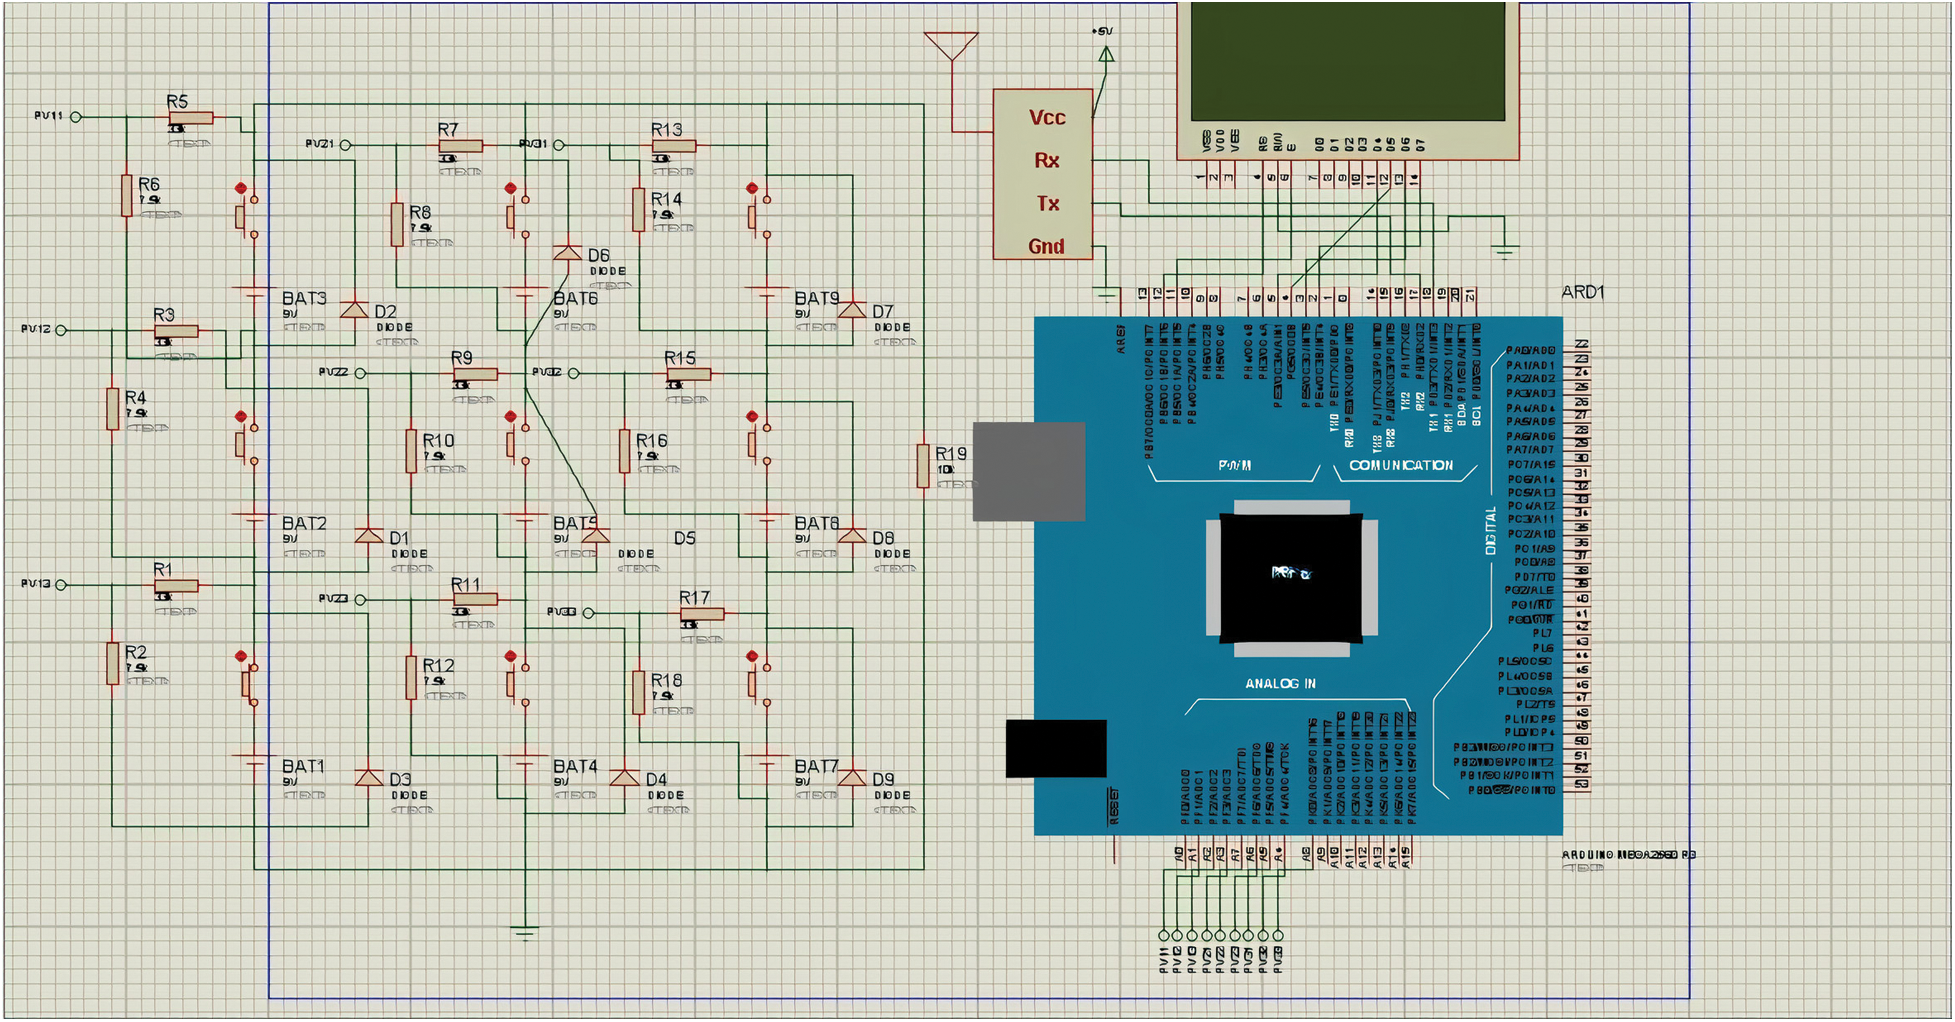
Figure 4: Proteus model of the system to detect the fault
The Arduino Nano is used on the transmitter side instead of the Arduino Mega due to the space congestion in the Proteus simulator. The panels are created using the LDR (Light Dependent Resistors), whose resistance depends on the light intensity. In the simulation model, the various virtual components are interconnected with each other, and a hex code is uploaded virtually to the Arduino unit, and results are calculated. Fig. 5 presents the receiver section’s simulation model, where the RF modem and NodeMCU are embedded in it for receiving the data from the transmitter section and logging the data to the cloud app.
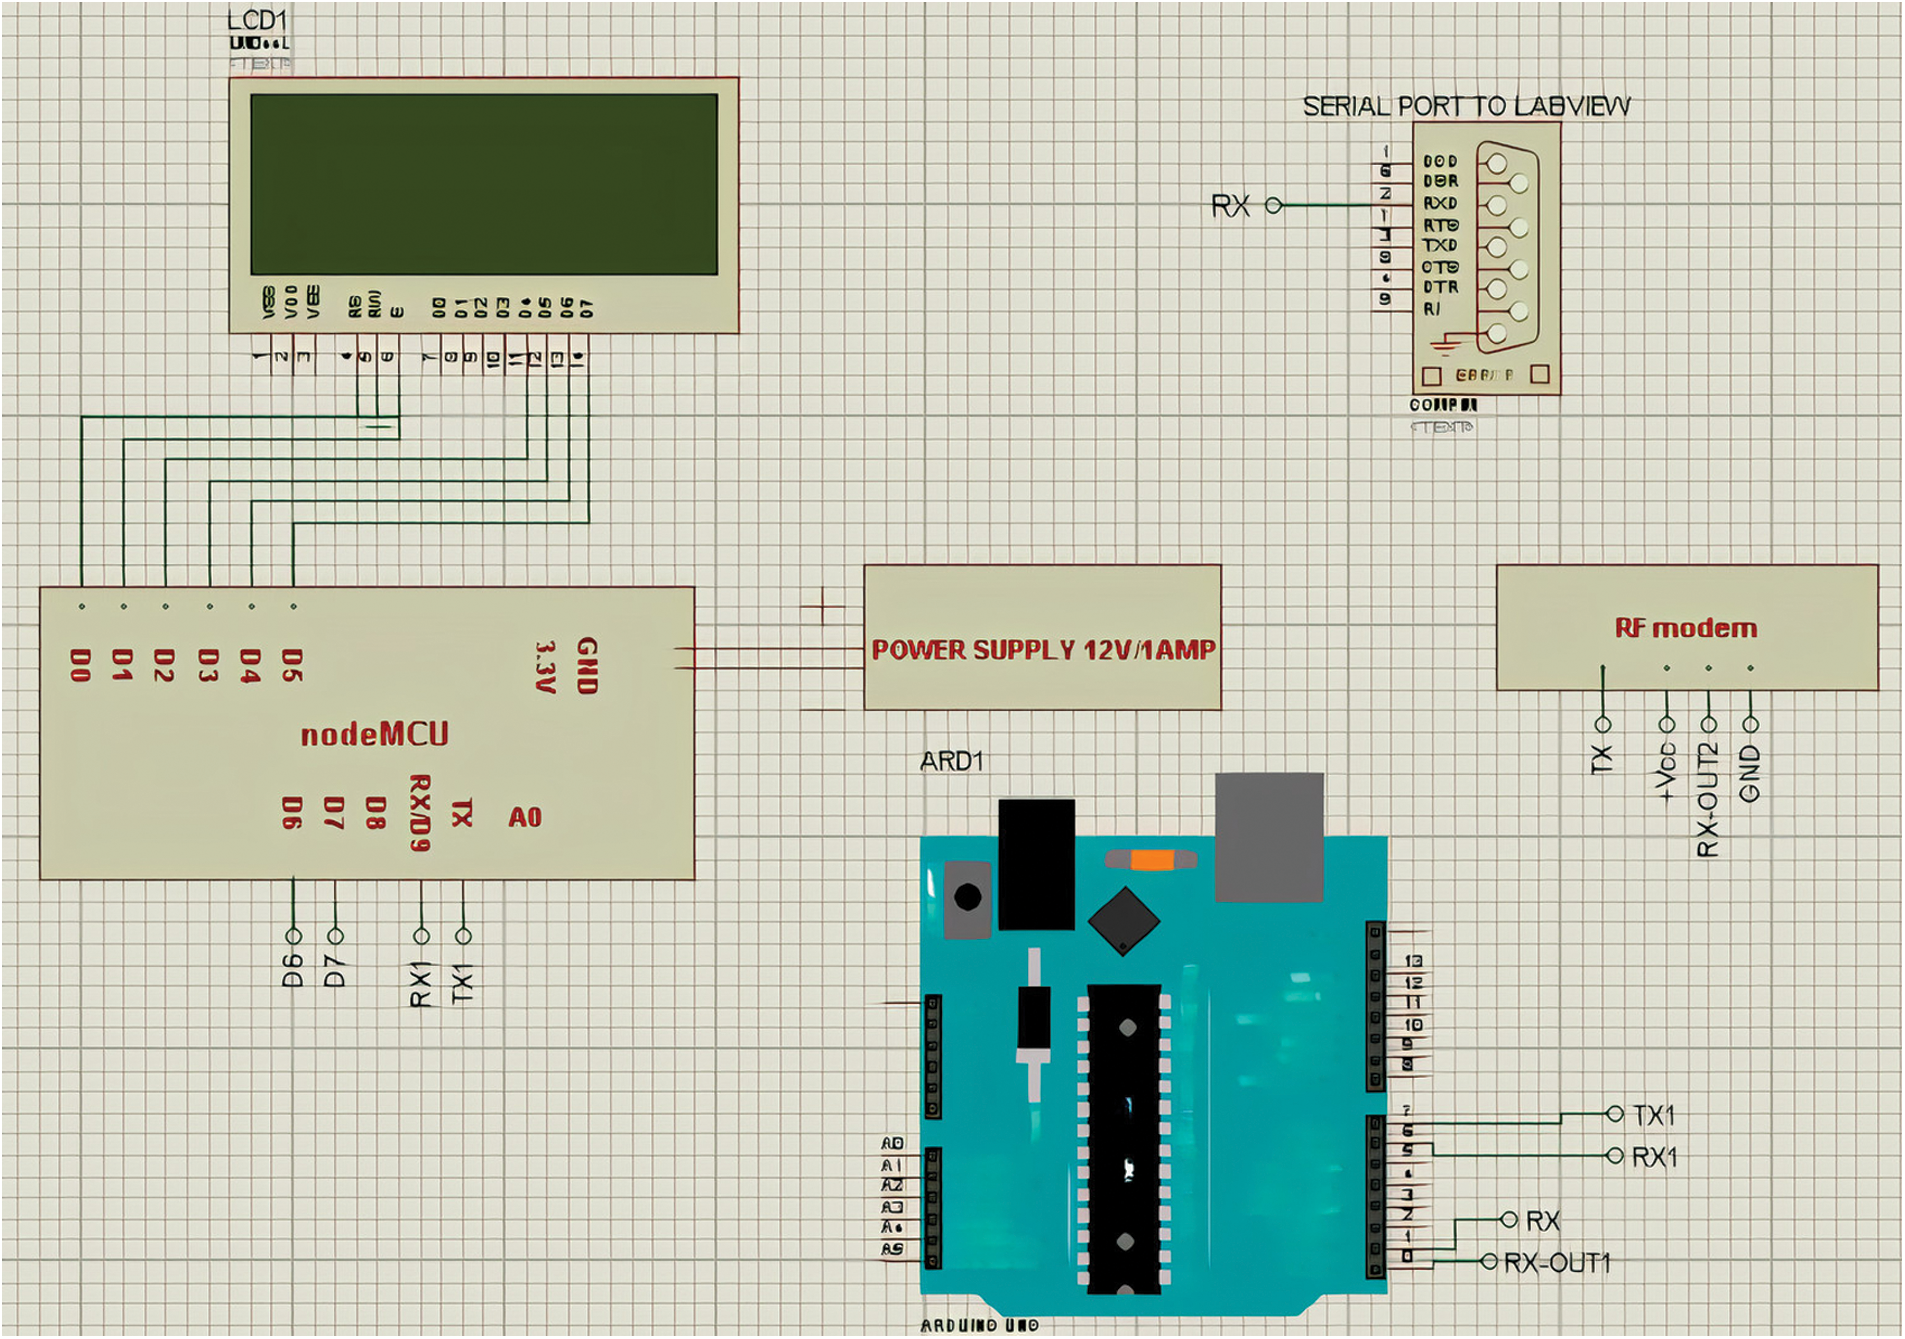
Figure 5: Proteus of receiver section with NodeMCU to send data on cloud app
In this section, we will discuss the real-time implementation of the proposed system. To build a system, we need to select the electronic components for developing the system. In this section, we mention the parameters that are required for converting analog into digital. Tab. 1 presents the complete specification of each component that is utilized for fault detection and monitoring.
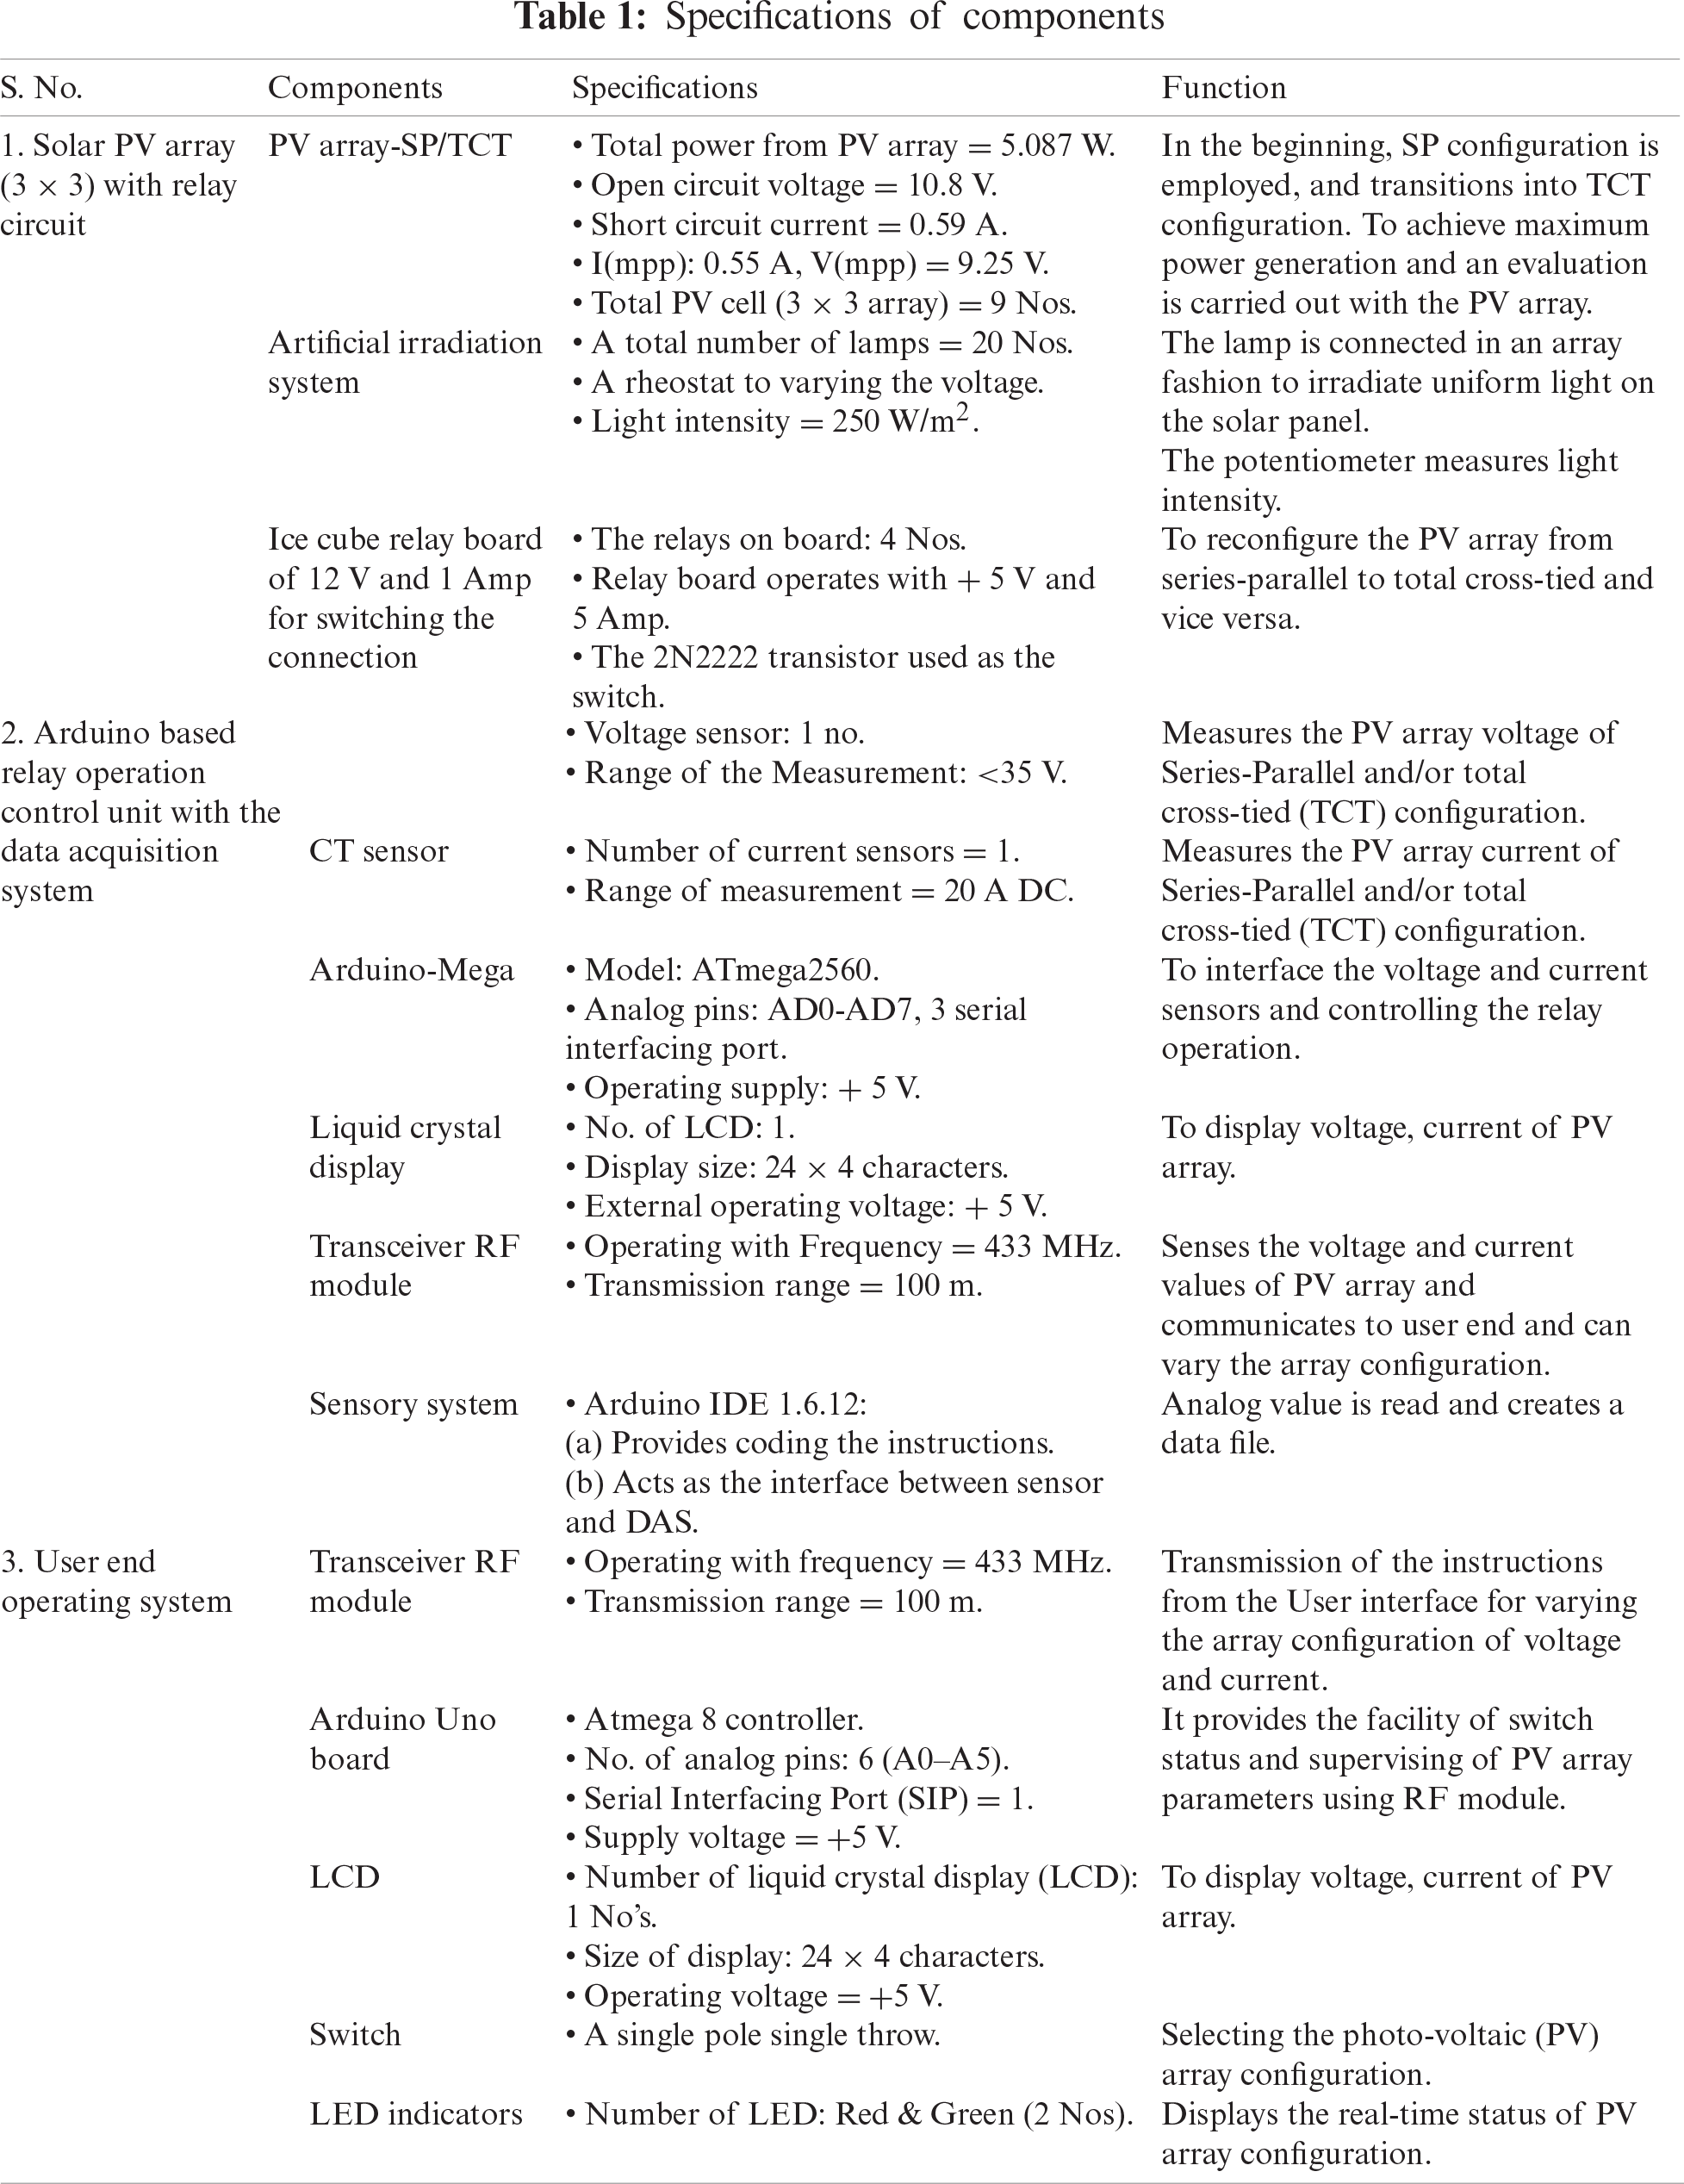
Fig. 6 shows the system’s hardware implementation where a 3 × 3 solar PV matrix is placed under the light source, and a development board is designed to interconnect the various solar panels with an extension that can be either in parallel or in series. An LCD (Liquid Crystal Display) is placed in the Development Board, which shows the data monitored. A voltage sensor and a current sensor is measuring the voltage and current of the system.
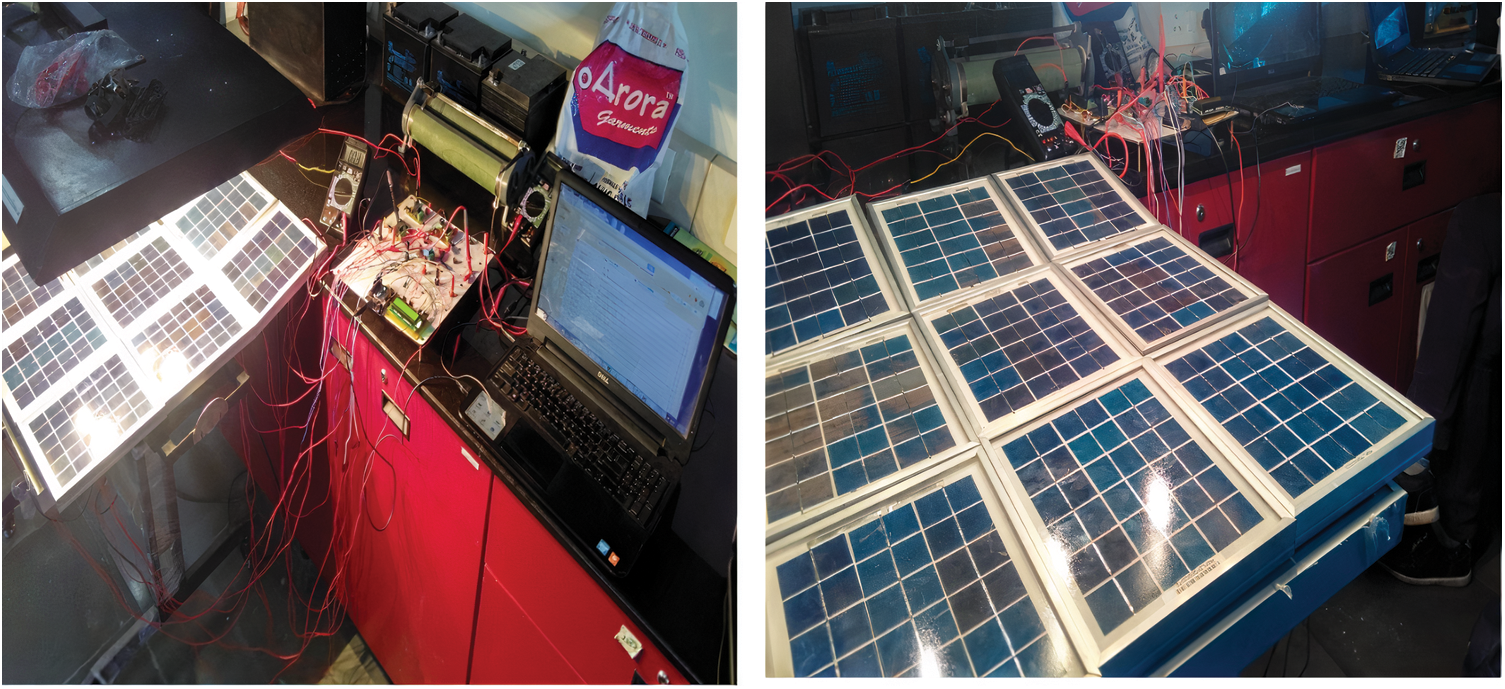
Figure 6: Real-time hardware implementation of model
The board has four relays that can be triggered either to SP mode or to TCT mode. A microcontroller can process the digital-only data, and the voltage sensors’ output is analog, so this voltage needs to be converted into analog by two methods i) External ADC chip and ii) Internal ADC converter of a microcontroller. The Arduino Mega 2560 having its internal ADC converter, which is 10 bits wide. We provide +5 V to the sensors, so its output varies from 0 to 5 V, which corresponds to the voltage across it and the Analog to Digital Converter pins of controller converts these voltages to a digital level as ADC of Arduino Mega is 10 bit, i.e., its resolution is 210 = 1024 levels. If the voltage sensor detects the maximum voltage that it can measure, its output pin provides 5 V, i.e., 1024 levels.
The sensor provides a controller that converts it into digital levels from the above relation, whatever the voltage is. The syntax in Tab. 2 shows the controller converts analog level to digital and provides the voltage or current value corresponds to these levels.
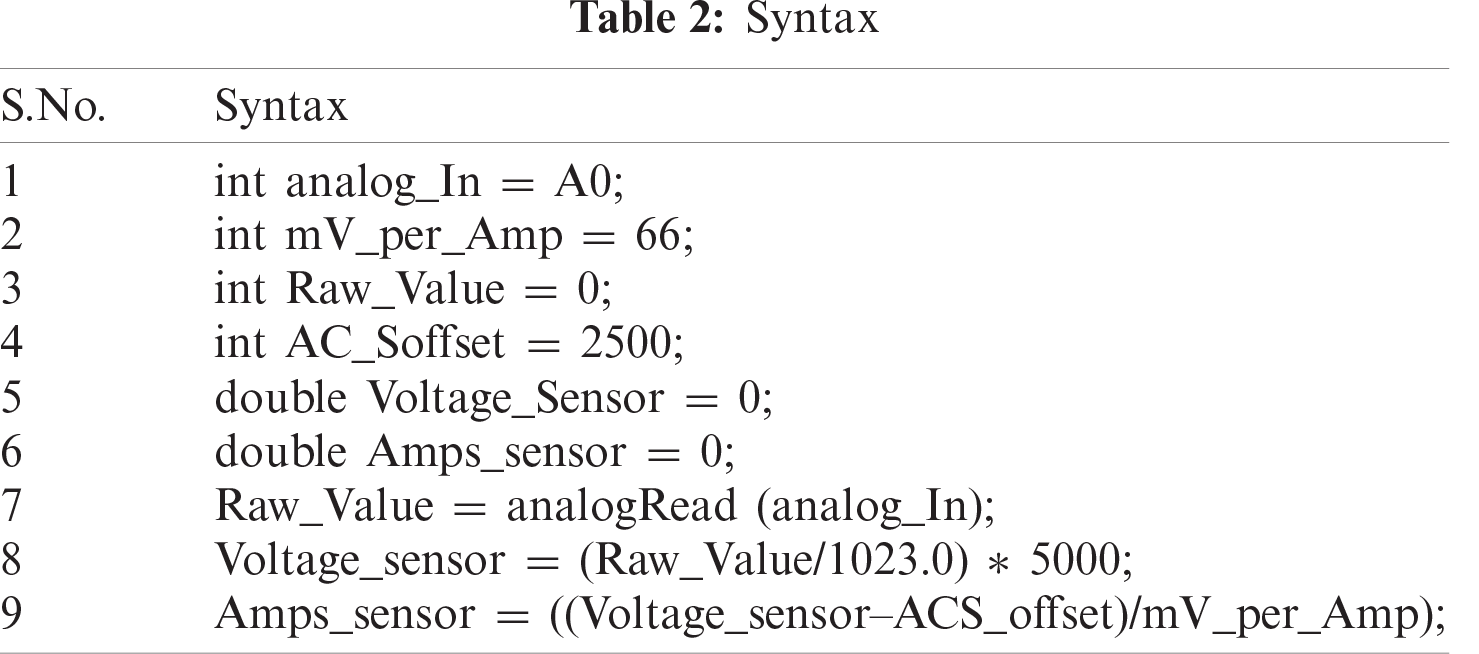
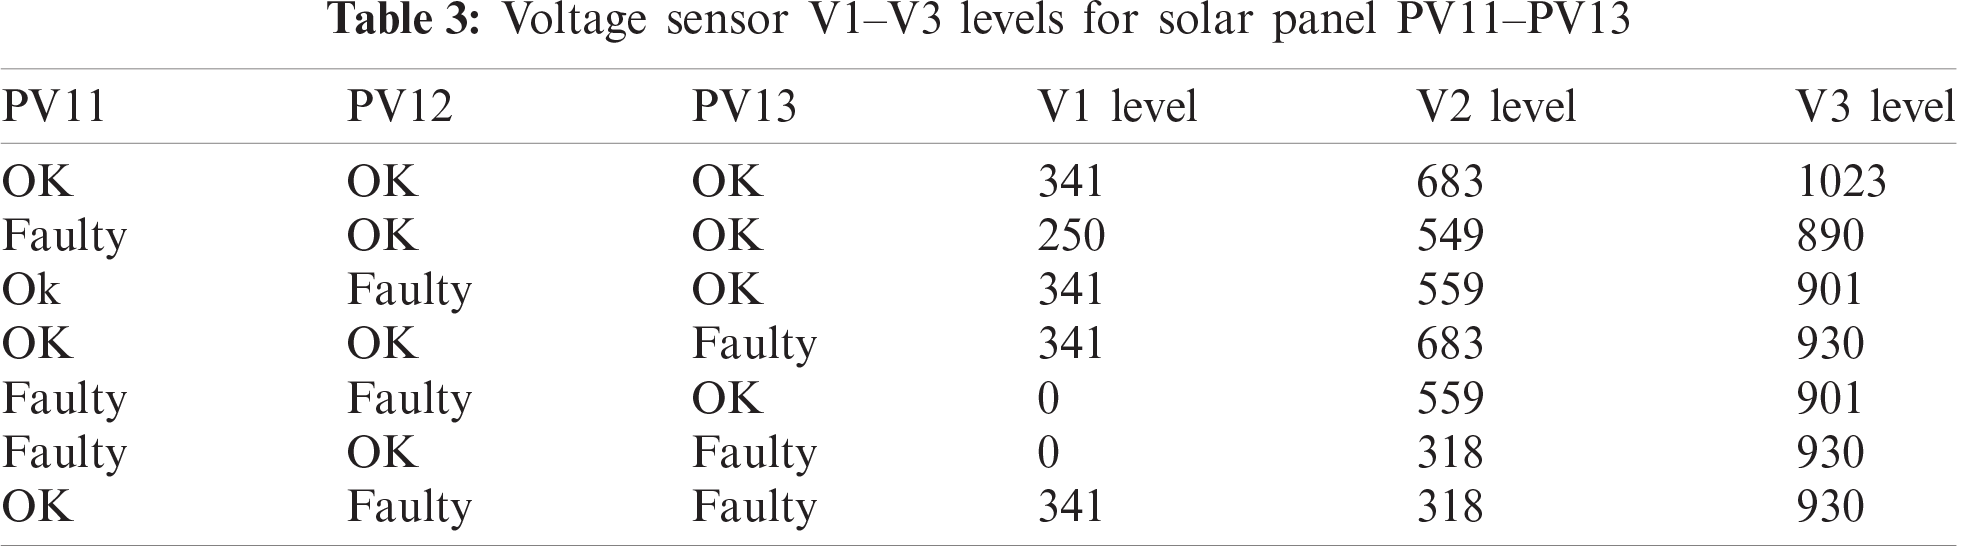
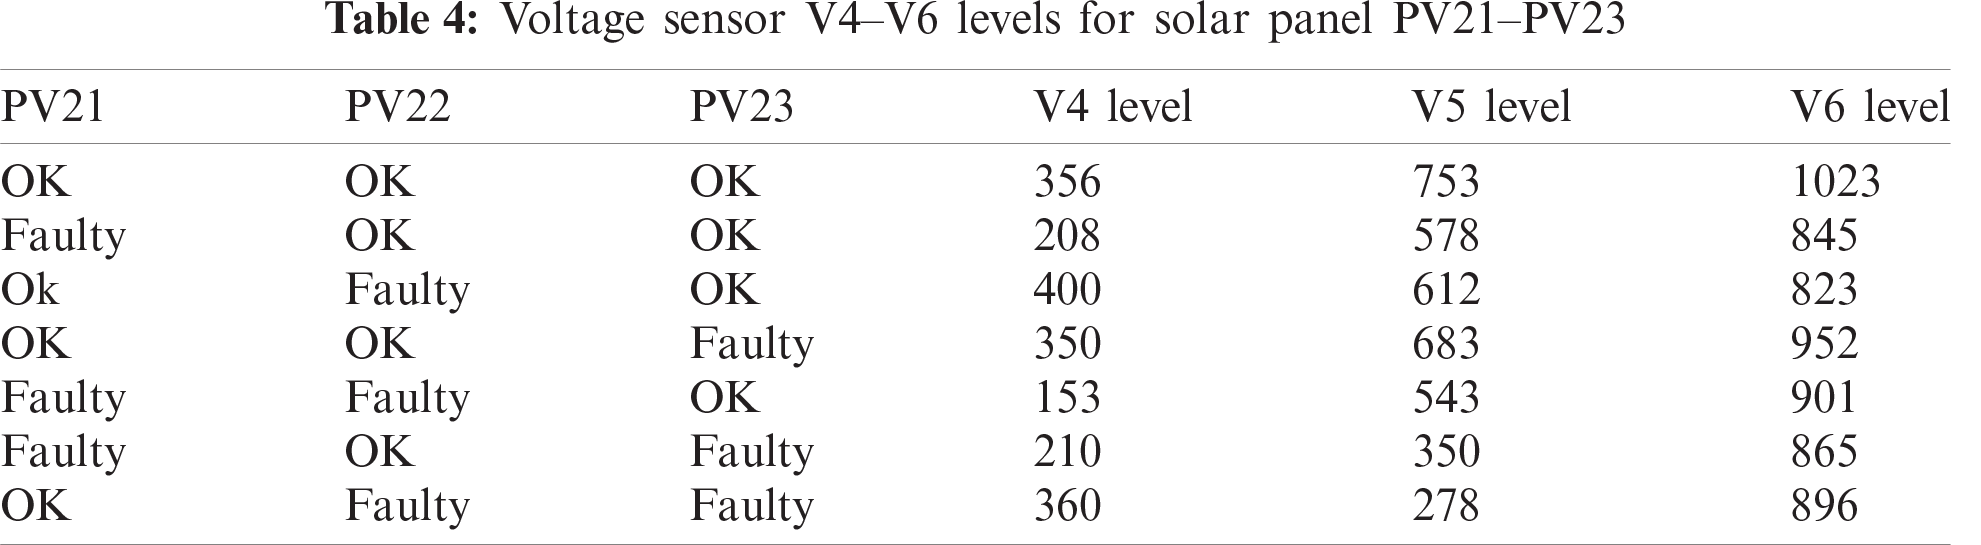
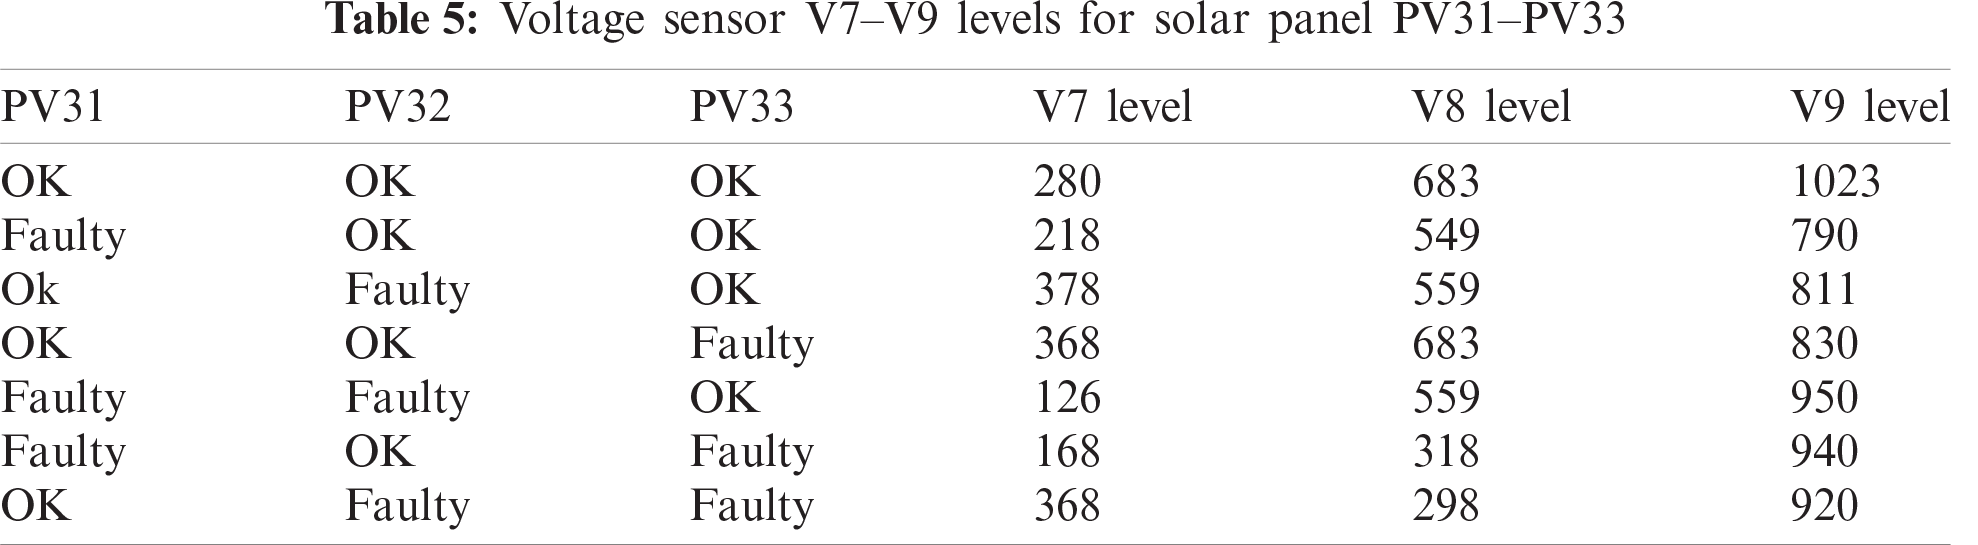
The voltage and Amps are the two final variables having the exact voltage and current of each panel. Tabs. 3–5 show the voltage levels of PV arrays presented in analog form using voltage sensors. The status of the PV array is presented in terms of binary output, namely OK, Faulty. If the voltage level is below 340, then the PV array is faulting it.
Virtual Instrumentation is a LabVIEW Software programming tool that consists of a front panel and a back panel. The icons represent the programming. The front panel demonstrates the controllers and the indicator, and block diagram illustrates the code in Fig. 7. The front panel handles the inputs and outputs, and the code diagram performs the work. The front panel of the LabVIEW consists of a digital indicator for a 3 × 3 solar PV array. The interfacing of LabVIEW with the external world is taken through the Serial VISA. Serial VISA is a software patch that creates a virtual path between the real-time hardware and the LabVIEW software. The serial visa selects the hardware’s serial port and receives serial data through the hardware’s port. The Serial Visa has the facility to select baud rate, Parity Checker, No. of data bits to be read, start, stop bit checker, and error control.
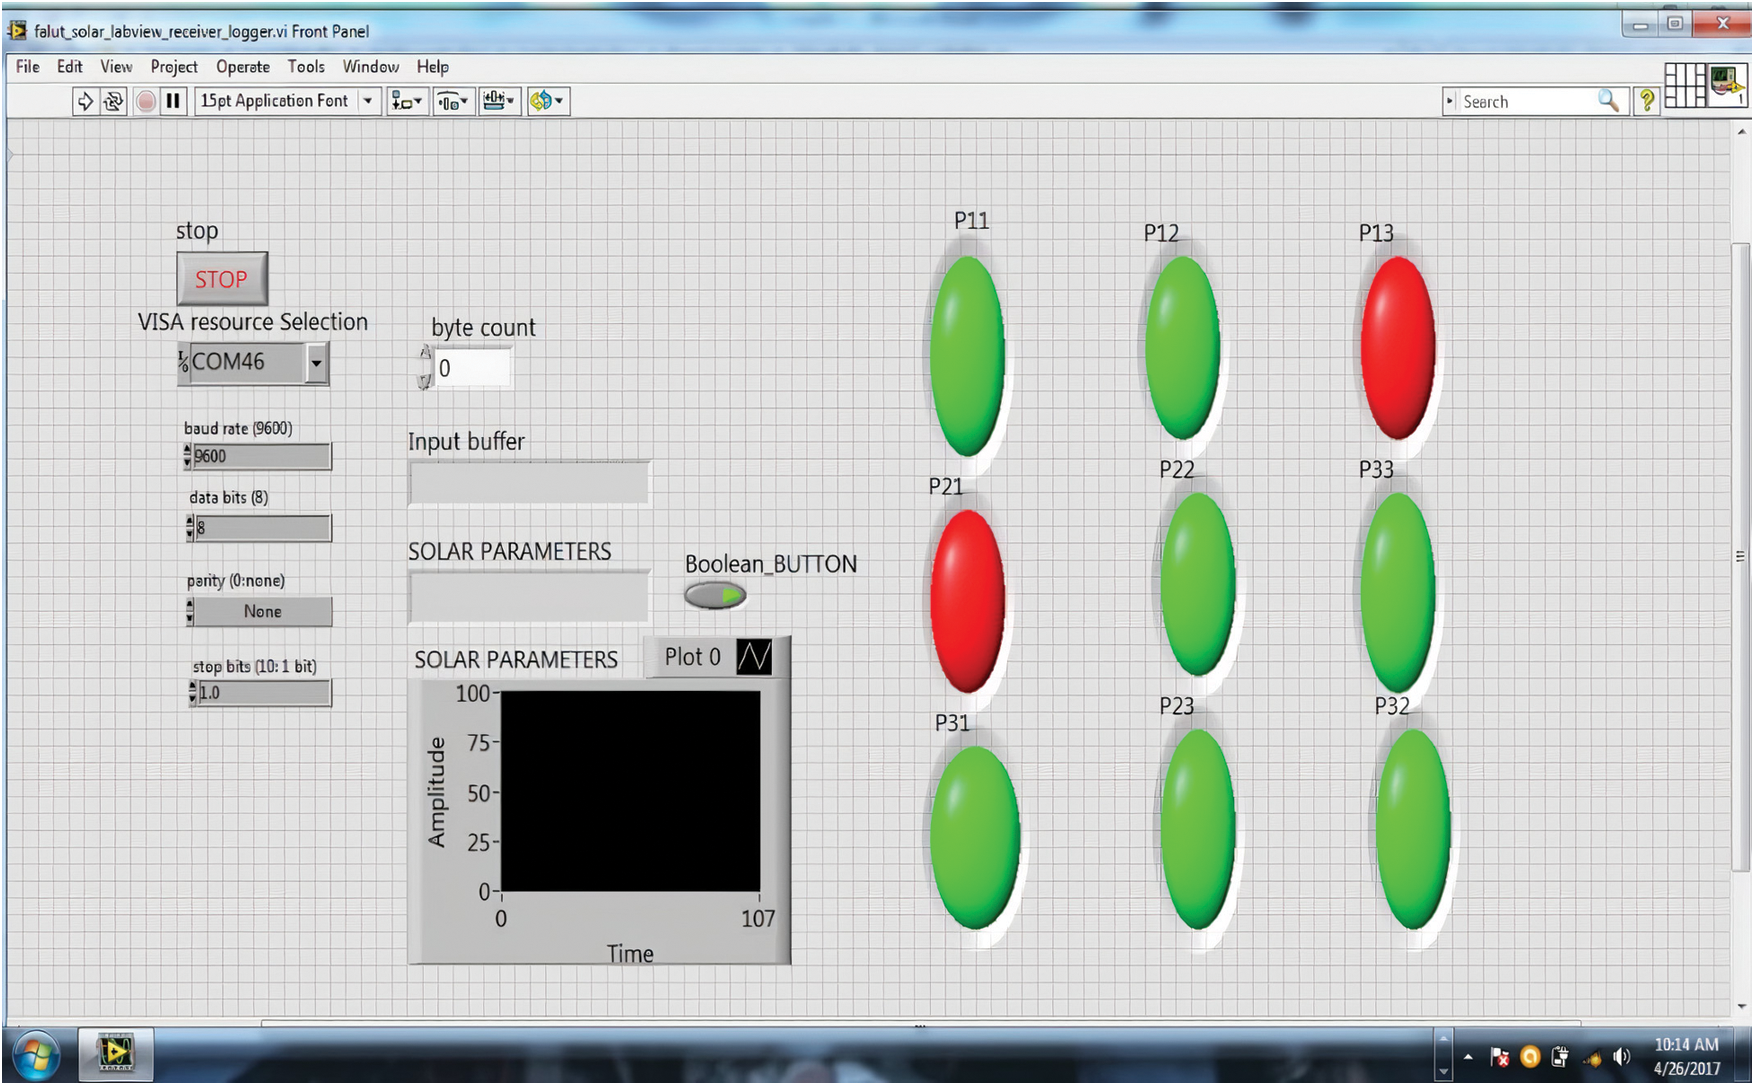
Figure 7: Front panel of LabVIEW as a data logger
Fig. 8 shows the block diagram of the LabVIEW, where data flow programming is done. The main program starts with the serial visa selection because it communicates with the external hardware, i.e., Arduino Uno. The Arduino Uno is operated and controlled through data serially, and this data is received by the computer port serially. The LabVIEW needs to know about the baud rate of the incoming data, whether there is parity or not, start bit or stop bit. These all terms are defined in the serial visa. After that, data is taken in the while loop to monitor the incoming data and acts corresponding to the data.
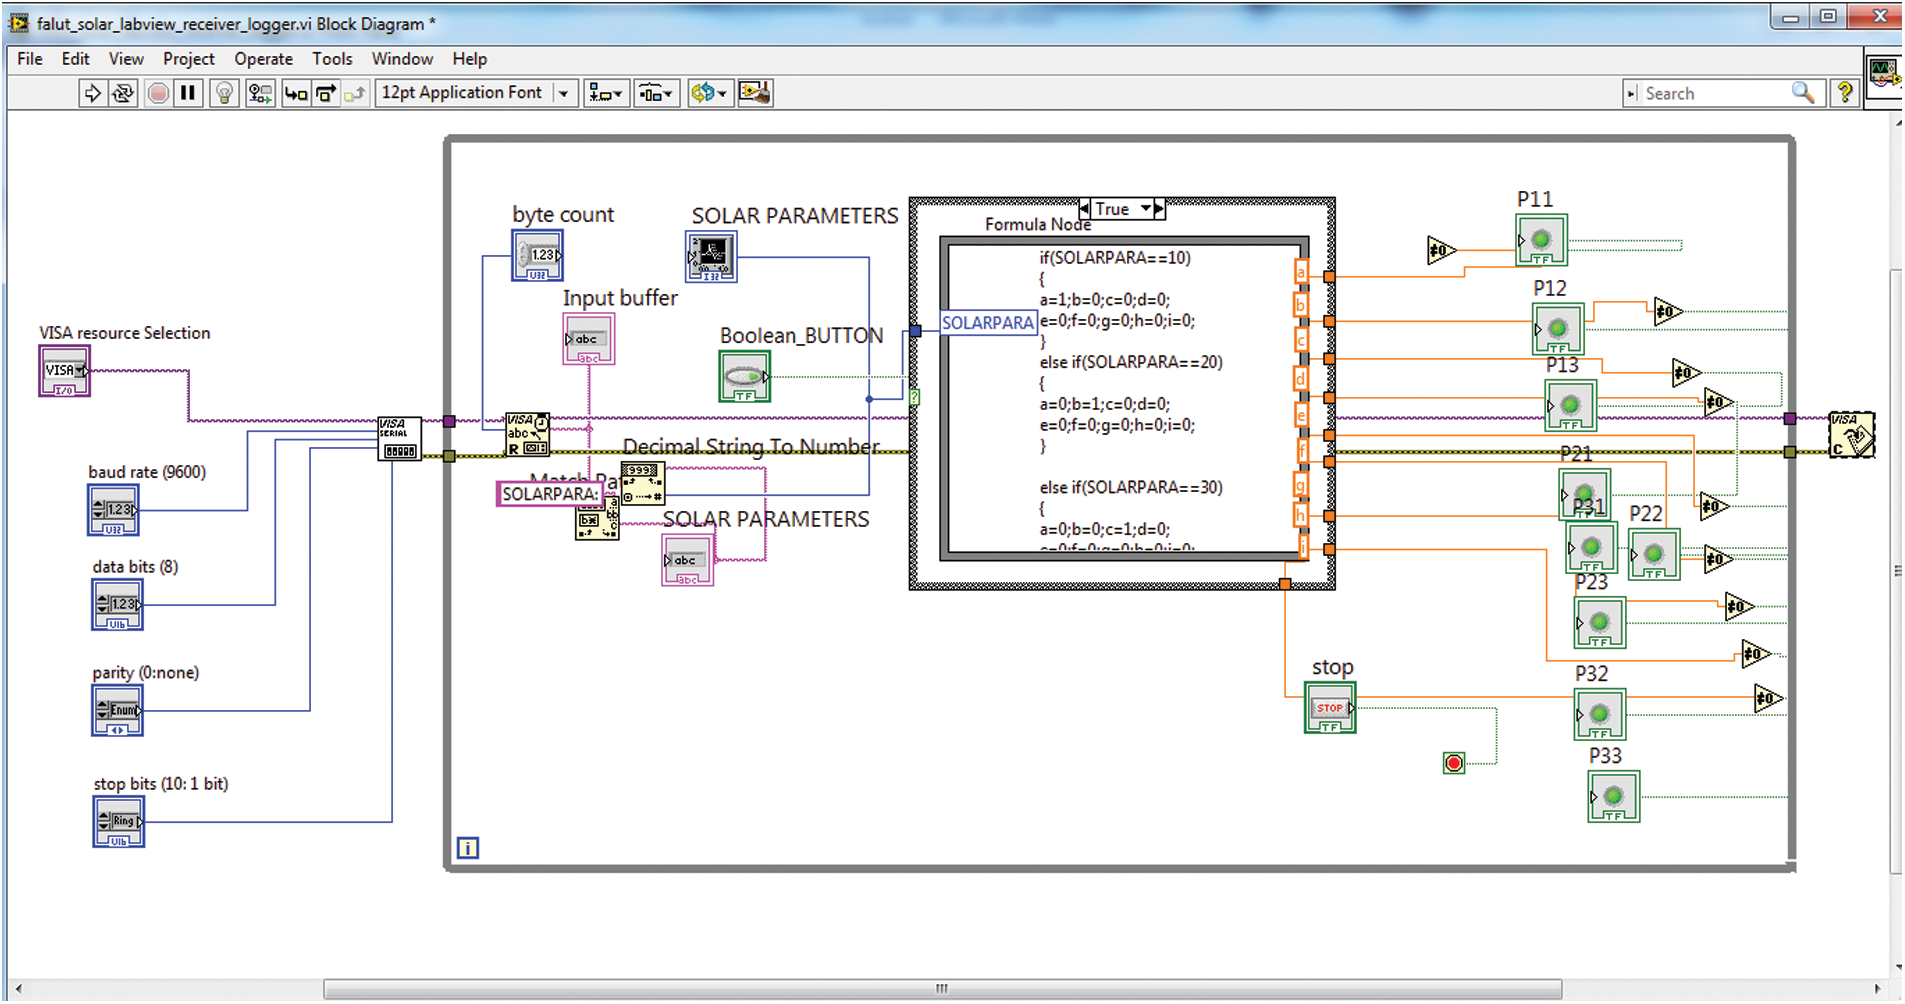
Figure 8: Block diagram of LabVIEW
Fig. 9 represents the IoT-based Blynk app’s dashboard, where the status of each array can be visualized with representations like PV11–PV13, etc. In two different dashboards, one can detect the condition of the arrays. The dashboard presents that fault is identified in the PV21 and PV 23 array, and the red color light is turn ON to represent the fault. The GPS coordinates of the PV arrays can be seen in the dashboard. Fig. 10 illustrates the two different dashboards, where one can visualize the condition of the arrays. The dashboard presents that fault is identified in the PV11 array and the red color light is turn ON to represent the fault. The GPS coordinates of the PV arrays can be seen in the dashboard to quickly identify that from which PV array the data is logged on the dashboard.
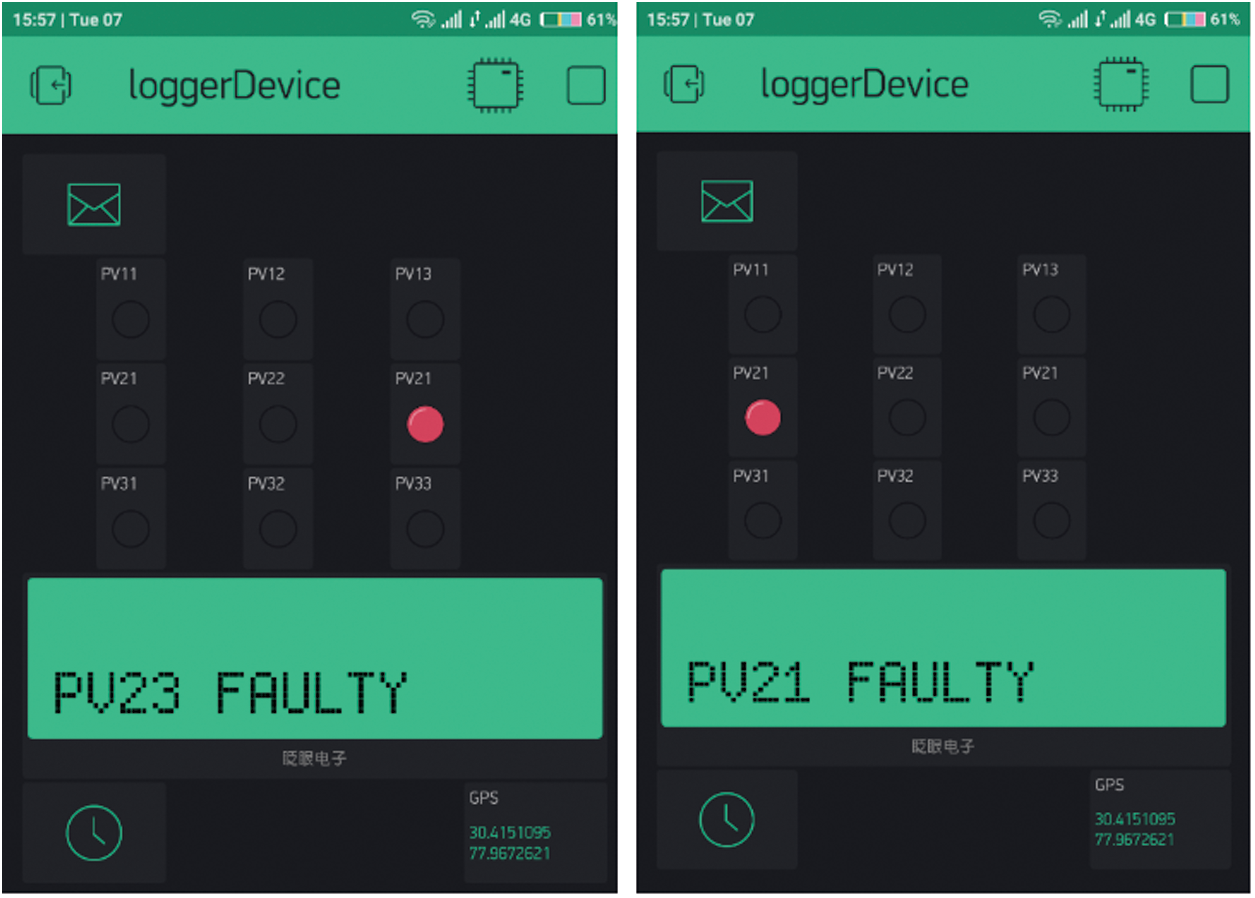
Figure 9: Snapshot of app developers to monitor the status of 3 × 3 solar array
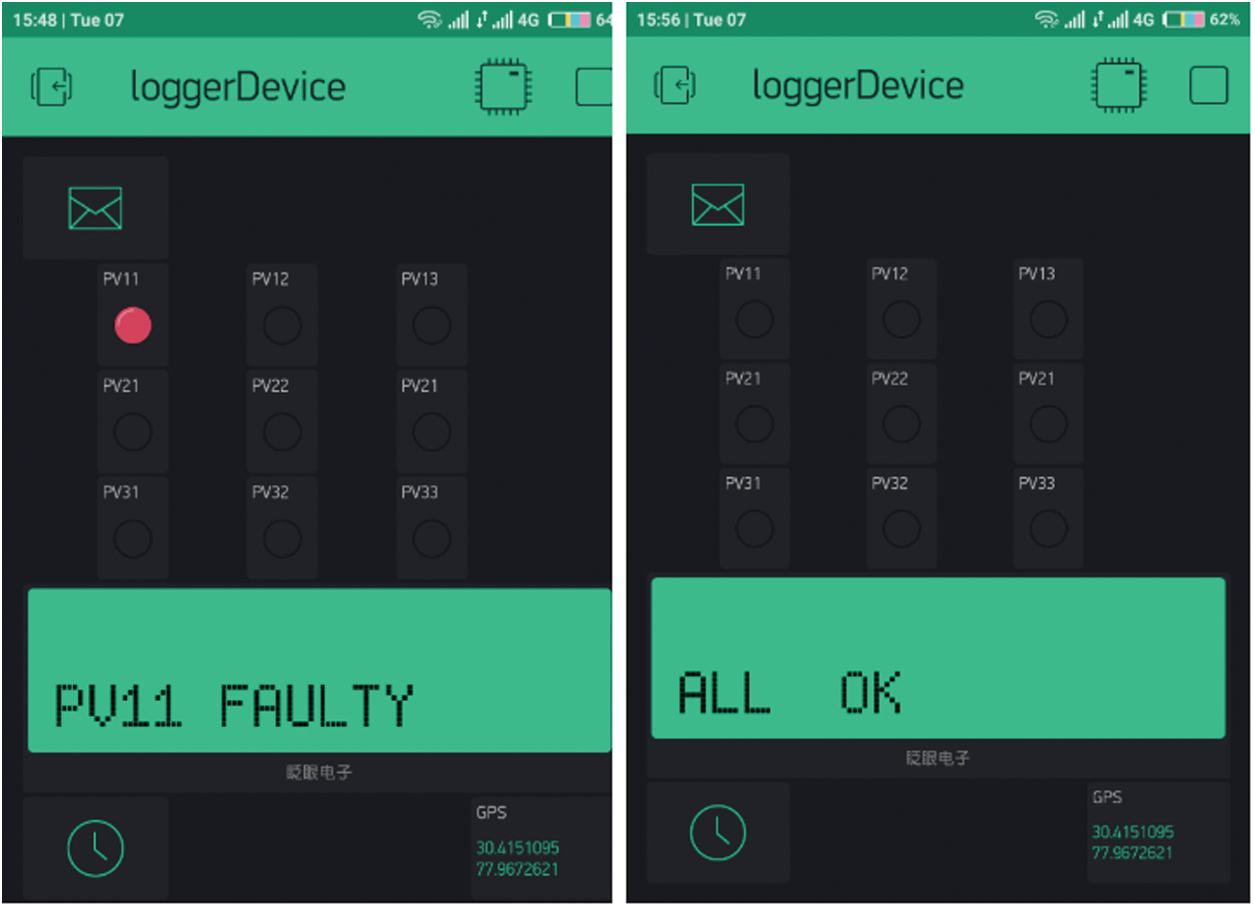
Figure 10: Snapshot of app developers to monitor the status of 3 × 3 solar array
A comprehensive investigation of the fault detection and shading effect with hands-on recognition through IoT on self-assembled 3 × 3 solar PV array modules is presented in this study. The extensive analysis has been carried out using voltage sensors connected across the PV array for fault detection and partial shadings effect through voltage and current sensors and hand-on recognition of solar PV array configuration with a wireless remote. The obtained results show that the PV modules’ fault analysis affects the output of various voltage sensors connected across the array, and shading causes net voltage and current reduction in the whole system. However, with a wireless RF modem’s assistance, the two main configurations carried out for SP and TCT show a significant improvement in the PV array performance. The Node MCU is employed for transmitting the status of the PV array on the IoT-based blynk app. An IoT-based Blynk app is also integrated so that the PV arrays’ status can be visualized remotely through internet connectivity.
Acknowledgement: The authors would like to acknowledge the support received from Taif University Researchers Supporting Project Number (TURSP-2020/147), Taif University, Taif, Saudi Arabia.
Funding Statement: This work was funded and supported by the Taif University Researchers Supporting Project Number (TURSP-2020/147), Taif University, Taif, Saudi Arabia.
Conflicts of Interest: The authors declare that they have no conflicts of interest to report regarding the present study.
 | This work is licensed under a Creative Commons Attribution 4.0 International License, which permits unrestricted use, distribution, and reproduction in any medium, provided the original work is properly cited. |