DOI:10.32604/cmc.2021.018517
| Computers, Materials & Continua DOI:10.32604/cmc.2021.018517 | |
| Article |
Cluster Analysis for IR and NIR Spectroscopy: Current Practices to Future Perspectives
1College of Engineering, IT & Environment, Charles Darwin University, Casuarina, NT 0810, Australia
2Defence Science and Technology Group, Edinburgh, 5111, Australia
3Energy and Resources Institute, Charles Darwin University, Casuarina, NT 0810, Australia
*Corresponding Author: Suresh N. Thennadil. Email: suresh.thennadil@cdu.edu.au
Received: 10 March 2021; Accepted: 11 April 2021
Abstract: Supervised machine learning techniques have become well established in the study of spectroscopy data. However, the unsupervised learning technique of cluster analysis hasn’t reached the same level maturity in chemometric analysis. This paper surveys recent studies which apply cluster analysis to NIR and IR spectroscopy data. In addition, we summarize the current practices in cluster analysis of spectroscopy and contrast these with cluster analysis literature from the machine learning and pattern recognition domain. This includes practices in data pre-processing, feature extraction, clustering distance metrics, clustering algorithms and validation techniques. Special consideration is given to the specific characteristics of IR and NIR spectroscopy data which typically includes high dimensionality and relatively low sample size. The findings highlighted a lack of quantitative analysis and evaluation in current practices for cluster analysis of IR and NIR spectroscopy data. With this in mind, we propose an analysis model or workflow with techniques specifically suited for cluster analysis of IR and NIR spectroscopy data along with a pragmatic application strategy.
Keywords: Chemometrics; cluster analysis; Fourier transform infrared spectroscopy; machine learning; near infrared spectroscopy; unsupervised learning
In the study of IR and NIR spectroscopy in the field of chemometrics, there is a well-established range of multivariate analysis techniques based on machine learning that have proved well suited to the chemical spectroscopy data [1]. These mature techniques include the supervised learning techniques of partial least squares discriminate analysis (PLS-DA) and linear discriminant analysis (LDA) for classification, and calibration using partial least squares regression (PLSR).
Cluster analysis is a technique that offers potential value for scenarios in the analysis of spectroscopy but has not reached the same level of maturity in its application to this domain. Cluster analysis is an unsupervised machine learning technique aimed at generating knowledge from unlabelled data [2]. While cluster analysis is commonly used for data exploration, there are other circumstances where it is valuable. These include applications when the class structure of the data is known to vary with time, or the cost of acquiring classified (labeled) samples might be too great, making obtaining the large data sets required for some supervised learning techniques infeasible [1]. The latter is often the case for data from spectroscopic chemical analysis.
While cluster analysis is a well-established domain and widely used across diverse disciplines, it would be wrong to assume its application would be clear-cut and simply procedural. It is a highly subjective domain, with many potential techniques whose success will vary depending on the characteristics of the data and the purpose of the analysis. Clustering is very much a human construct, hence, mathematical definitions are challenging and even the definition of good clustering is subjective [3]. Fundamental challenges for cluster analysis include [4]:
1. What features should be used for clustering?
2. How is similarity defined and measured?
3. How many clusters are present?
4. Which clustering algorithms should be used?
5. Does the data actually have any clustering tendency?
6. Are the discovered clusters valid?
These challenges and the data specific characteristics of clustering contribute to the reason why there is no universal “best” clustering algorithm [5]. However, those challenges do not mean that there cannot be suggestions for a better practice for conducting cluster analysis on IR and NIR spectroscopy data.
In this paper, we quantitatively survey 50 papers where cluster analysis is applied to IR and NIR spectroscopy data to understand current practice in this form of analysis. In reviewing the current approaches in clustering IR and NIR spectroscopy data, consideration and commentary is given to highlight potential issues in current practice.
We also draw on more than 25 papers and texts we have cited from the machine learning associated domains to identify techniques that could contribute towards an improved future practice in cluster analysis of spectroscopy. Special consideration is given to two important characteristics of the spectroscopy data:
1. High Dimensionality: A large number of measurements are taken at intervals across a spectrum for each sample. From the data analysis perspective, these form the variables or features. Depending on the type of spectroscopy and the specifics of the instrumentation, the number of features is typically in the hundreds or thousands for each sample. In other cluster analysis literature [6], 50 dimensions is referred to as high dimension data, yet spectroscopy data is typically significantly higher dimension than that. Hence, this high dimensionality needs special consideration in determining analytical approaches.
2. Low sample size: Spectroscopy and the associated instrumentation are typically used in laboratory situations. Collecting and processing samples can be an expensive process from the perspective of cost, time, and expertise. Hence, the number of samples is often relatively small, particularly from a machine learning perspective. This precludes the use of some cutting-edge cluster analysis techniques such as clustering with deep neural networks (deep clustering).
These characteristics present unique challenges that focus and somewhat limit the techniques suitable for cluster analysis of spectroscopy data. Hence, this paper presents a novel perspective specific to the needs of cluster analysis in IR and NIR spectroscopy while drawing on strong practices from the machine learning community. This culminates in a proposed analysis model or workflow to assist practitioners in ensuring rigor and validity in their cluster analysis.
An exhaustive review was conducted to collate 50 papers published between 2002 and 2020 where a form of cluster analysis is applied to data from IR and NIR spectroscopy data. 44 journal papers [7–50] and six peer reviewed conference papers [51–56] were surveyed. 38 of the papers utilize FTIR spectroscopy (in the mid IR or IR band) and 15 of the papers utilize NIR spectroscopy.
The papers surveyed cover a range of application domains including food and agriculture (30 papers) [7–9,12–14,16–18,20–22,24–26,28,34–37,39,41,44,45,47,48,54], biomedical (15 papers) [10,11,15,19,24,25,30,32,38,40,42,51–53,56], industrial (3 papers) [29,43,49], and forensics (3 paper) [23,31,55].
The purpose of the majority of the papers is to demonstrate that an analytical testing technique, such as FTIR spectroscopy, paired with cluster analysis could discriminate between different classes of materials. Examples of these classes include cancerous and non-cancerous cells, provenancing of biological species such as tea varieties, fungi or bacteria, and contaminated materials such as counterfeit drugs or adulterated olive oil. Many of the papers subsequently extended this capability beyond cluster analysis through the application of other techniques such as supervised learning to develop classification models for classification of future unlabelled samples. Thirteen of the papers included comparison of multiple clustering techniques [14,19,26,30–32,35,40,41,44,51,52,56], with three papers presenting and evaluating a new clustering algorithm [19,35,41]. One paper presented an overview of spectral pre and post processing techniques and includes cluster analysis [10].
Several of the papers include analysis of additional types of analytical techniques such as Raman spectroscopy or gas chromatography-mass spectrometry (GC-MS), however, we will only include the NIR and IR aspects of those papers in this review.
In reviewing the 50 surveyed papers to understand the current state of cluster analysis of IR and NIR spectroscopy data, we focus on the aspects of analysis that we consider important for successful cluster analysis. Firstly, the traditional chemometrics aspects of pre-processing, feature selection, and principal component analysis are reviewed. Then the cluster analysis aspects are reviewed. In this part, we include techniques covering each of these aspects which are found in the classic and contemporary pattern recognition and machine learning literature but may not have been considered in the chemometrics literature. These include evaluating the data’s tendency to cluster, the similarity measure used for the clustering, the clustering algorithm itself, how the number of clusters were selected, and how the results were evaluated and quantified. For each aspect, justification for including this step in the analysis is presented and the potential pitfalls of not including it. This is then compared to the analysis within the surveyed papers to understand current practice and to highlight potential shortcomings.
In reflecting on these findings, potential reasons for this current practice are discussed. Finally, a proposed analysis model or workflow is presented for clustering of NIR and IR spectroscopy data that aims to ensure rigor and validity for future practitioners conducting cluster analysis.
3 Survey Results and Discussion
3.1 Pre-Processing and Feature Selection
Initially, we review the early steps in the analysis process where traditional chemometric techniques are applied before the cluster analysis. The aim of these traditional chemometric analysis stages is to improve the suitability of the data for clustering, hence improving the clustering outcomes. These include data pre-processing, feature selection, and principal component analysis. While the primary focus of this paper is on the cluster analysis, these traditional chemometric analysis components are crucial to the clustering outcomes and warrant investigation.
Data pre-processing methods are used to remove or reduce unwanted signals from data such as instrumental and experimental artefacts prior to cluster analysis. If not performed in the right way, pre-processing can also introduce or emphasize unwanted variation. Hence, proper pre-processing is a critical first step that directly influences the follow-on analysis in the workflow [57].
In reviewing the surveyed papers (summarized in Tab. 1), normalization (scaling and centering), baseline correction, vector normalization, Savitzky–Golay smoothing (with or without derivatives), and various forms of multiplicative scatter correction were commonly applied. However, there was no one technique that was applied to more than half the papers. There is no clear favored technique within the chemometrics community that is applicable to all the datasets or applications.
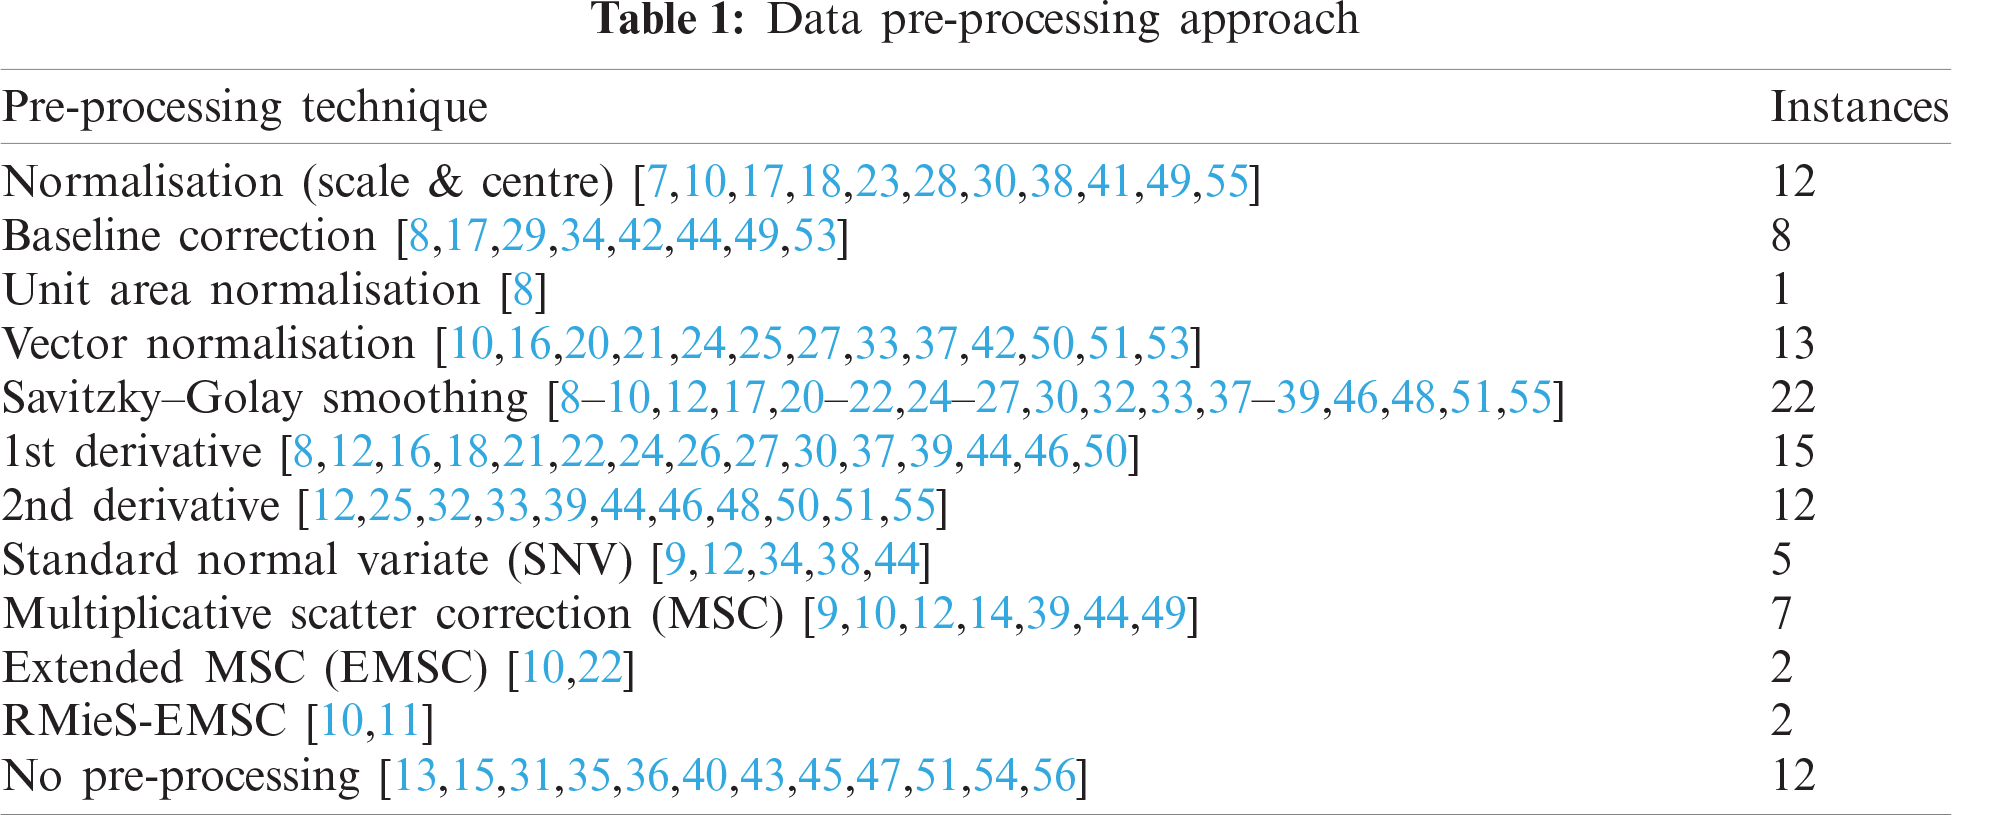
Lee et al. [58], in their review of contemporary data pre-processing practice for ATR-FTIR spectrum, highlight that careful justified selection of pre-processing practices is often ignored and hypothesize that users tend to follow conventional choices in literature or practices they are familiar with without supporting evidence. With this practice, researchers could potentially miss the most appropriate pre-processing methods for their specific data. If multiple pre-processing techniques are evaluated, this allows identification of the optimum technique for the specific characteristics of the researcher’s dataset [58]. During our review of the surveyed cluster analysis papers, it was observed that it was rare to include the evaluation of multiple pre-processing techniques, include a reason for application of a particular technique, or even the justification for the use of one technique over another. Despite the challenges and workload associated with evaluating pre-processing, this is clearly an area where practice could be improved.
It was also noted that 12 papers did not use any pre-processing and some explicitly stated that they were choosing to use no pre-processing, without giving a justified reason. This is generally discouraged as it forgoes the opportunity to correct the data for variations in equipment and measurement technique that may adversely impact the success of the later cluster analysis.
Feature selection, also known as variable selection or variable reduction, refers to selection of the useful variable that convey the relevant information within the data, and removal of those that may include noise or non-valuable information. Within NIR and IR spectroscopy data, the wavenumbers (or wavelengths) are the variables (or features). Hence, feature selection works to remove wavenumbers containing irrelevant data or noise from the dataset. This works to reduce the dimensionality of the data and focus on the information of value. In one of the surveyed papers, Gierlinger et al. [48] found that feature selection was essential in their application and they were unable to achieve class separation (discrimination according to species) when analyzing the full spectra.
The summary of feature selection approaches from the 50 surveyed papers is shown in Tab. 2. Of some concern was that 24 papers conducted their analysis on the full IR or NIR spectrum data with no feature selection applied to reduce the number of variables. Some papers did this as part of a comparison to clustering performance when implementing variable selection, but many papers only conducted analysis on the full spectra. While this simplifies the analysis process, it misses an opportunity to improve the data for the cluster analysis.
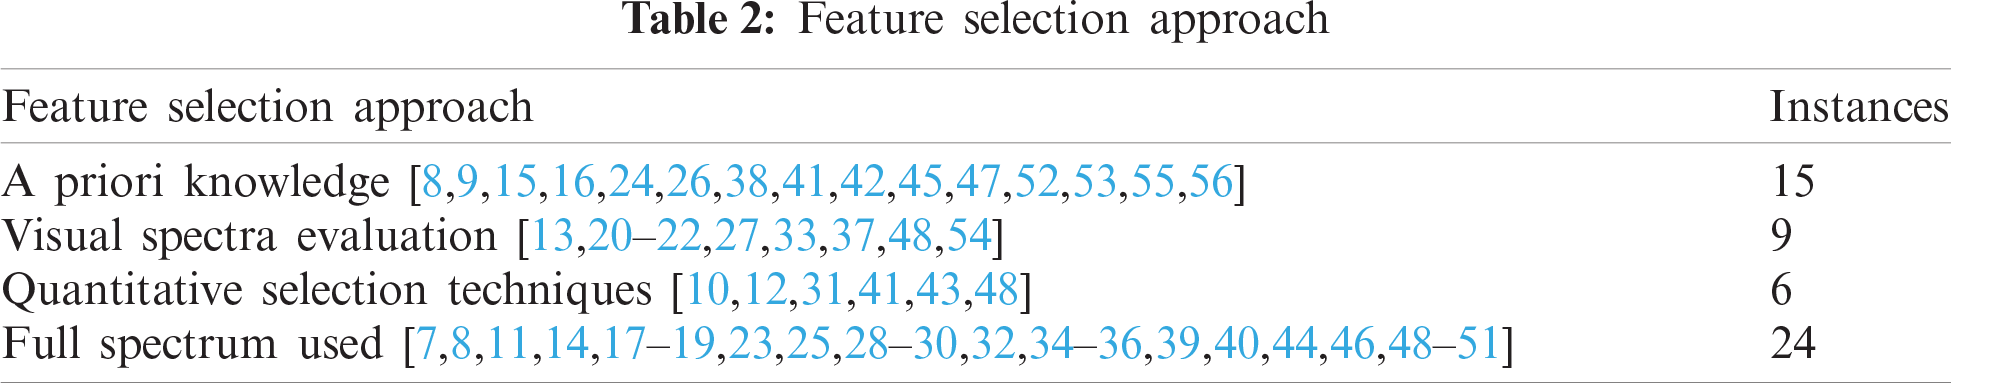
15 of the papers selected windows in the spectra based on a priori knowledge. This was typically knowledge of where in the spectra the “fingerprint” wavenumbers were to separate the spectra of materials they were investigating.
Nine of the papers selected windows of the spectra through visual evaluation of labelled spectra to see at what wavenumbers there was the maximum separation between the different samples’ spectra.
Only six of the papers used quantitative techniques for feature selection. One used a novel method based on an iterative variable elimination algorithm and a clustering quality index to select variables that maximize clustering quality [31]. Similarly, two of the papers used genetic algorithms as a computational heuristic search method to identify the wavenumbers to select to maximize the quality of the data [7,10]. The remaining quantitative selection techniques used PCA [41], Wavelets [43], and maximum variance [48] metrics. Ten of the papers compared multiple feature selections to evaluate and identify those which were the most beneficial for their cluster analysis [7,8,13,15,27,31,39,41,43,48].
With only six papers using quantitative methods, this highlights an opportunity to exploit techniques from the machine learning research domain. Within the machine learning community, feature selection is a significant domain of research. However, it is predominantly focused on supervised learning techniques which may not be applicable to unsupervised cluster analysis. Hence, care must be taken when choosing techniques to implement. The challenges of unsupervised feature selection are well explained by Dy et al. [59] with potential unsupervised feature selection techniques presented by Covões et al. [60], Boutsidis et al. [61], Dash et al. [62], Cai et al. [63], and Tang et al. [64]. Many of these techniques are included in the review by Alelyani et al. [65] of feature selection for clustering, and in a 2019 review and evaluation of unsupervised feature selection techniques by Solorio-Fernandez et al. [66]. Note however that these studies do not address the specific characteristics of spectroscopy data and either demonstrate techniques on relatively low dimensionality datasets [59,66], or are focused on domains such as social media data where large sample sizes are common [64]. This means some of these techniques may not be suitable for the small sample sizes and high dimensionality data that is typical in spectroscopy. Hence, spectroscopy specific feature selection for cluster analysis is an area requiring further research.
3.1.3 Principal Component Analysis (PCA) Usage
PCA is one of the classic dimension reduction techniques of chemometrics and was used in the majority of the surveyed papers. Its dimension reducing capabilities can be used for multiple purposes. One particularly applicable to cluster analysis is to reduce the data to two or three principal components to enable visualization of the data points in two or three dimensions. This enables easy visualization of the clusters that form and visual validation of the clustering. As shown in Tab. 3, 21 of the papers surveyed utilized PCA for this purpose. This was the most common use of PCA within the surveyed papers. This visualization aspect of PCA was also used in the evaluation in the results of the cluster analysis where clusters were visualized and compared to known class labels to evaluate the level of success in the clustering.
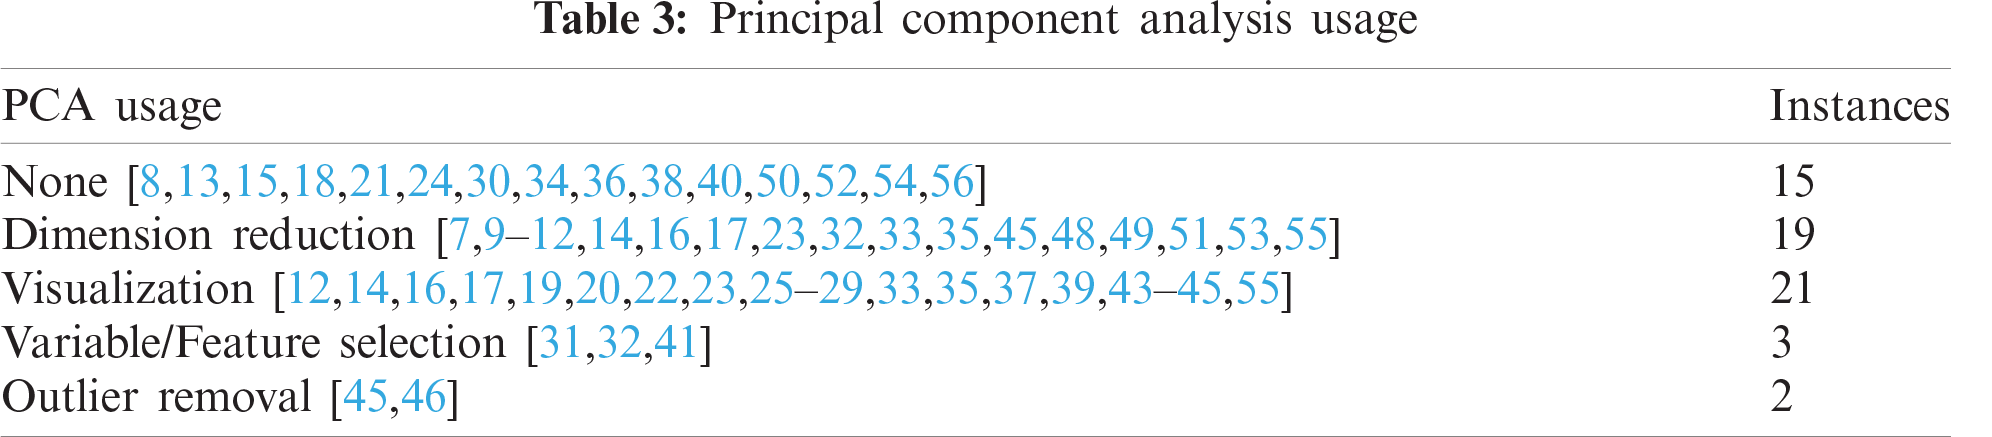
19 of the papers used PCA for its general dimension reducing capabilities. Applying PCA can dramatically reduce the number of dimensions in IR or NIR spectroscopy data while still retaining a high percentage of the information. This is effectively a form of feature extraction where the principal components from the PCA form the new variables. It was commonly observed for the typical 3500 dimensions (variables) in FTIR data to be reduced to 10 to 14 principal components while still retaining more than 99% of the original information. While this can speed analysis times and is an enabler for other analytical processes such as linear discriminant analysis, it is not clear from the works found in the literature whether dimension reduction using PCA leads to improved cluster analysis [67,68].
Of note, t-SNE (t-Distributed Stochastic Neighbor Embedding) [69] is an alternative dimension reduction and visualization technique which has been shown to produce better results than PCA [69–72]. While none of the papers reviewed used t-SNE in their cluster analysis, it could be worthwhile for practitioners to consider this technique.
The cluster analysis techniques used in the 50 surveyed IR and NIR analysis papers are now evaluated. In the domain of cluster analysis, there are common steps documented across the cited machine learning references that are typically applied to ensure validity and confidence in the outcomes of the cluster analysis. These form the sections of the following review.
As a starting point before any clustering is conducted, it is prudent to evaluate the data’s tendency to cluster (also referred to as clusterability). That is, the data exhibits a predisposition to cluster into natural groups [4]. The goal of clustering is to uncover real groupings within the data. However, clustering algorithms will divide data into any requested number of clusters, regardless of whether these clusters naturally exist in the data. Hence, evaluating the data’s clustering tendency is a valuable indicator that the follow-on cluster analysis will be valid, and the clusters aren’t purely random artefacts of the clustering process [6].
In reviewing the surveyed papers on cluster analysis of IR and NIR spectroscopy data, only one of the papers assessed their data’s clustering tendency. Zhang et al. [44] used the Hopkins statistic [73] to evaluate their data, finding it had a very low tendency to cluster, indicating that it does not contain natural clustering. This finding was supported when they applied the DBSCAN clustering algorithm [74] and found no logical reasoning or commonality of features within the clusters it produced.
Reasons for the lack of clustering tendency testing within the other papers may include the often simplistic and self-validating nature of the clustering that is being applied within many of the surveyed papers. Typically, the subjects being clustered were known groupings of materials such as different varieties of tea. Hence, clusterability may have been assumed and validated when cluster analysis delivered the expected results and correct clustering.
To have high confidence in the results of the cluster analysis and remove the possibility of delivering correct results by random chance, we recommend that a clustering tendency test is conducted. As with most aspects of clustering, there are multiple potential tests for clustering tendency and their effectiveness can be influenced by the characteristics of the data. Common techniques include the Dip test [75], the Silverman test [76] and the Hopkins statistic [73]. The Dip test and Silverman test are based on clusterability via multimodality where the null hypothesis of unimodality indicates that the data does not have evidence of cluster structure and should not be clustered. The Hopkins statistic tests clusterability via spatial randomness where the null hypothesis is randomly distributed data that should not be clustered. In considering which technique to use, Adolfsson, Ackerman and Brownstein found that “methods relying on the Hopkins statistics or the Silverman tests may be preferred when small clusters are of interest, while techniques using the Dip test may be desired when the application calls for robustness to outliers.” [6]. These are typical considerations and differentiation factors for many aspects of clustering practice.
3.2.2 Similarity Measures for Clustering
Since the goal of clustering is to identify clusters of objects that are similar, some measure of similarity is required. The similarity measure defines how the similarity of two elements is calculated. Similarity measure may be also referred to as a distance measure, although similarity measures can include correlation-based metrics.
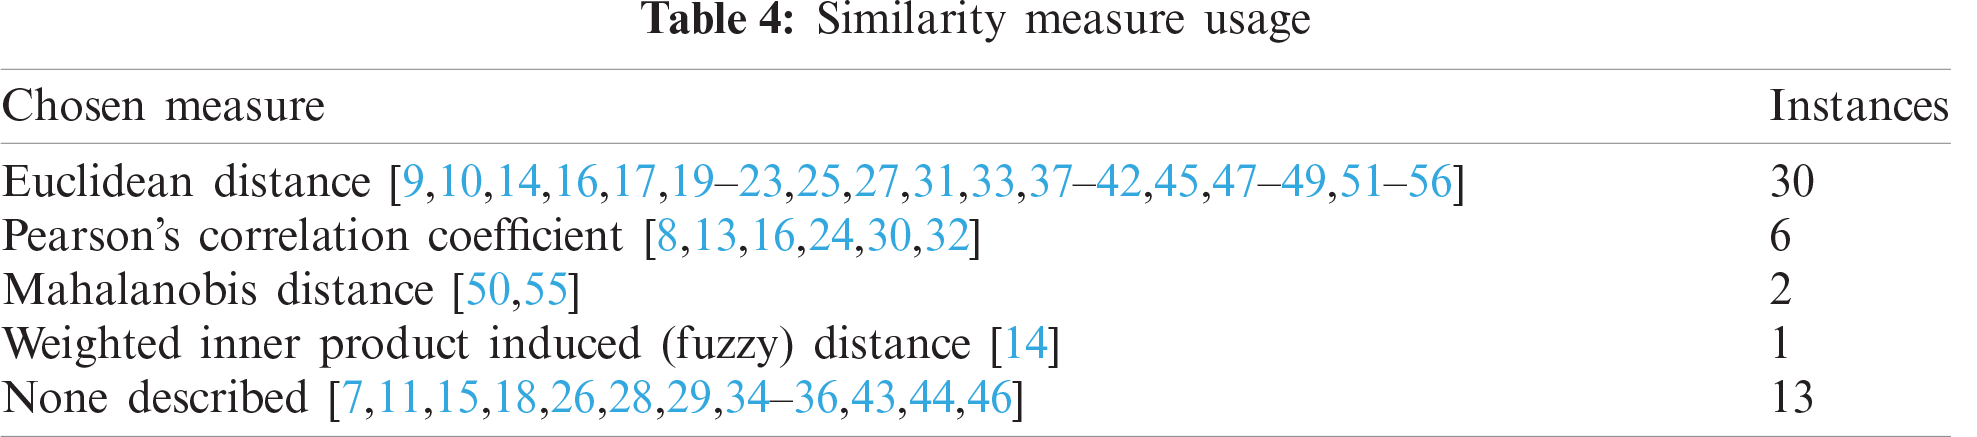
Within the papers surveyed, Euclidean distance was the most common metric used for comparing similarity, followed by Pearson’s correlation coefficient (Tab. 4). Many of the examples of Euclidean distance utilized squared Euclidean distance where the clustering algorithms use Sum of Squared Error (SSE), i.e., K-Means and Ward’s method Hierarchical Cluster Analysis. Thirteen papers did not describe the similarity measure used for their clustering.
3.2.3 Clustering Algorithm Selection
Numerous clustering algorithms have been proposed in the literature with new clustering algorithms continuing to appear. However, clustering algorithms can generally be divided into two forms; hierarchical and partitional [5]. They both work to minimize the within-cluster distances or maximize the between-cluster distances. Hierarchical techniques structure the data into a nested series of groups which can be displayed in the form of a dendrogram or a tree. Compared to hierarchical algorithms, partitional algorithms find all the clusters simultaneously and do not generate a hierarchical structure. Partitioning techniques include density-based, model-based, grid-based, and soft-computing methods [77].
In reviewing the clustering techniques used in the surveyed papers (Tab. 5), hierarchical cluster analysis was the most prominent with 38 instances. One potential reason for the extensive use of hierarchical clustering is due to it being well matched to the nature of the materials being tested. Biological samples such as the bacteria or plant varieties being tested in many of the surveyed papers form a natural hierarchy in their biological classification which may contain their species, genus and family. This allows for easy comparison to the dendrogram produced from hierarchical clustering and visual validation of the results.
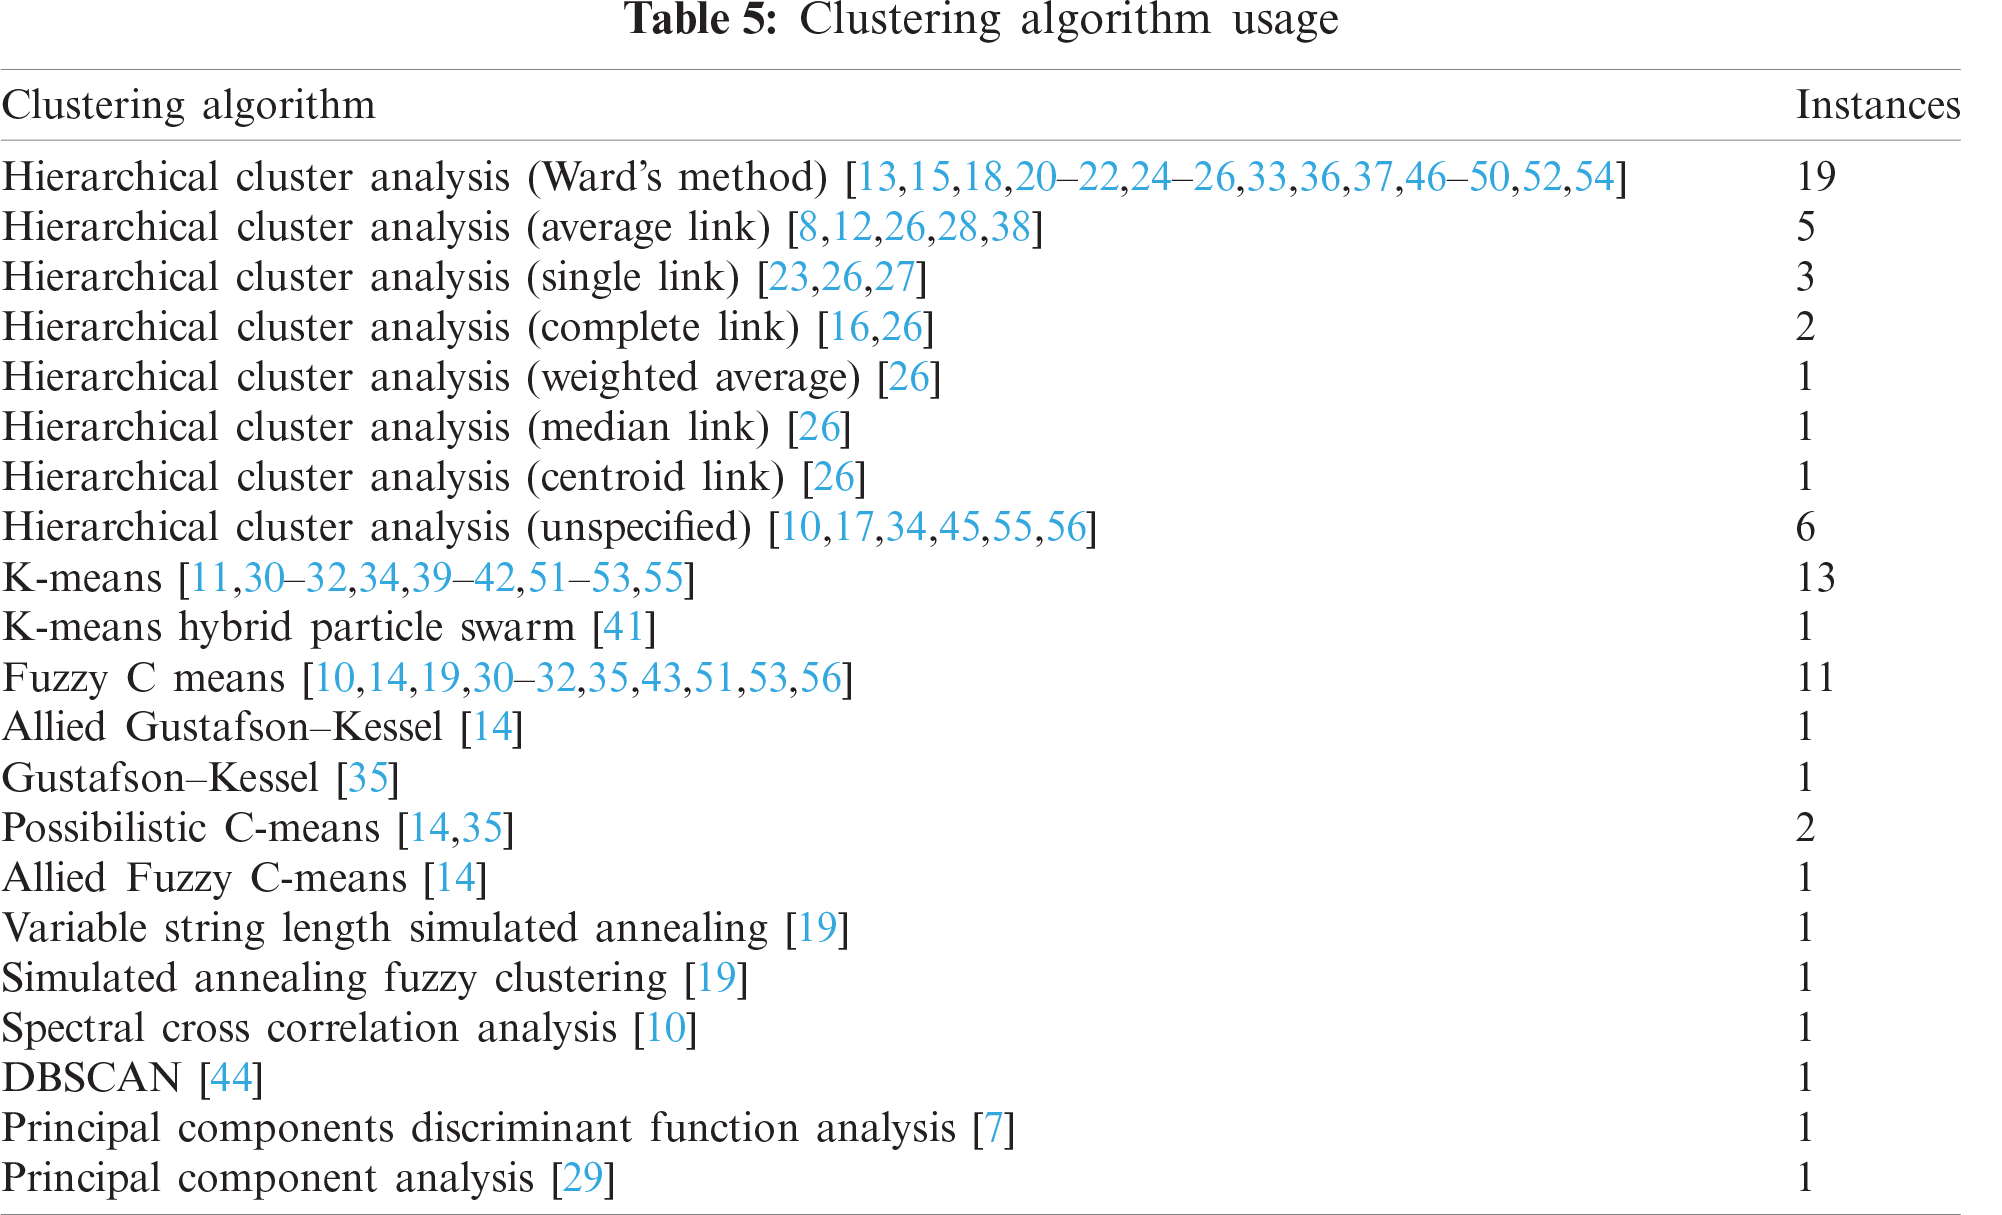
Variants of hierarchical clustering algorithms are differentiated by the rules they use to form the links between datapoints and hence, the clusters. Single link, complete link, average link and Ward’s method are four of the most popular [78] with Ward’s method being repeatedly demonstrated as the most effective [26,30,79] (in the context of those applications). Ward’s method was the most common technique used in the surveyed papers. We recommend that if alternative techniques to Ward’s method are being used, justification or a comparison should be included to explain their usage. Of note, six of the papers did not detail which linkage method was used. Defining the linkage method is crucial for hierarchical cluster analysis as different linkage types can deliver differing results. Not defining this impacts the reproducibility of the published results.
The fuzzy clustering techniques of Fuzzy C Means, Allied Gustafson-Kessel, Possibilistic C-Means, Allied Fuzzy C-Means, Variable String Length Simulated Annealing, and Simulated Annealing Fuzzy Clustering were the next most common technique group. K-Means clustering was also regularly applied to within the surveyed papers.
Nine of the papers surveyed made comparisons between various clustering techniques. One paper reviewed the linkage techniques for hierarchical clustering, concluding that Ward’s method gave the best results for their application [26]. Eight papers compared Hierarchical, K-Means and Fuzzy C Means clustering with one recommending hierarchical [30], one recommending K-Means [31], three recommending Fuzzy C Means [32,51,56] and three inconclusive [40,52,53] for their applications. Hence, no clear conclusion can be drawn as to a best general technique. Three papers [14,19,35] compared various means of fuzzy clustering but with no overlap between the fuzzy clustering variants they compare, no conclusions can be drawn.
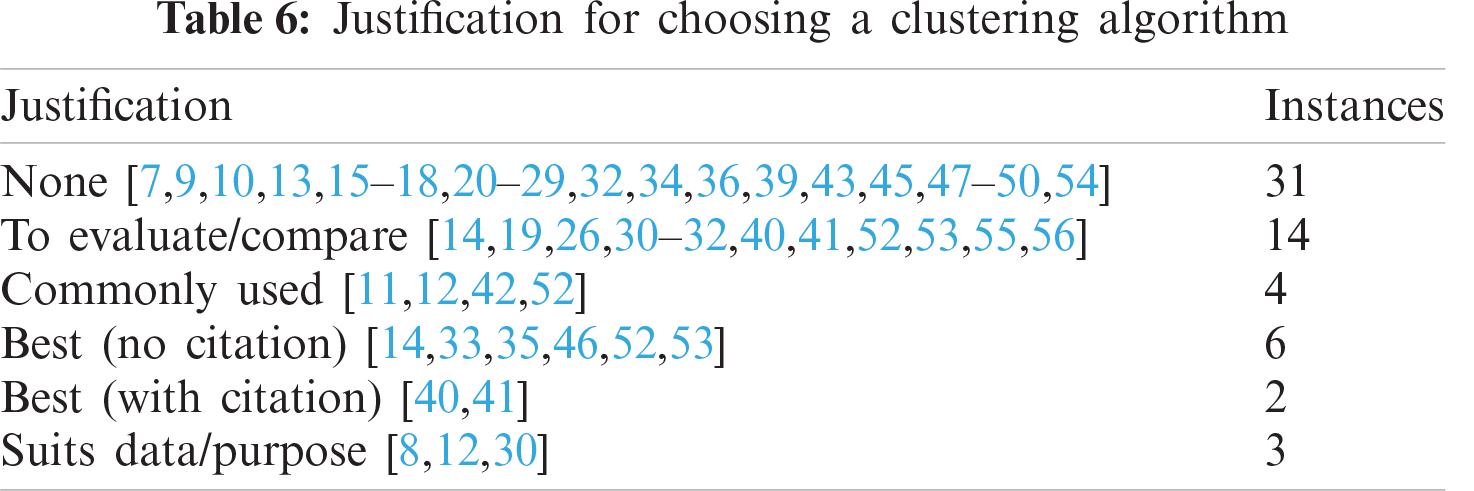
Based on these conflicting findings, it is clear that choosing a clustering algorithm for clustering IR and NIR spectroscopy data is not a simple decision. Yet, in reviewing the justifications provided in the papers for their choice of clustering algorithms (Tab. 6), twenty of the papers provided no justification for their choice of algorithm. A potential reason for the lack of justification is that many of the papers achieved satisfactory clustering with their chosen technique, negating the need for further investigation or evaluation. This is a pragmatic approach, although some explanation to the initial choice of algorithm would be of benefit to the reader. If satisfactory clustering is not achieved with the chosen algorithm, this then presents a strong driver for consideration and evaluation of alternative algorithms.
In looking to techniques prominent in other machine learning domains, clustering using deep neural networks (deep clustering) is emerging in prominence. As surveyed by Min et al. [80], these techniques may seem attractive for clustering of spectroscopy due to their ability to deal with the sparseness associated with high dimensionality. However, the typically low relative sample size of spectroscopy data is unlikely to meet the needs of the deep neural networks which are best suited to ‘big data’ and caution should be used unless large datasets are available. Typically, the hierarchical clustering, k-means clustering, and fuzzy-C clustering as found in our survey are well suited to spectroscopy data, and evaluation of those techniques can highlight which is best suited to the specifics of the subject dataset. Alternatively, to address the variability between these clustering algorithms due to data characteristics, clustering ensemble techniques as described by Strehl et al. [81] could be considered to fuse results from multiple clustering algorithms for robust clustering.
3.2.4 Predicting the Number of Clusters
One of the major challenges in cluster analysis is predicting the number of clusters (k) [4]. The input variables for clustering algorithms require an input that effects the number of clusters generated; either directly such as setting the k value for number of clusters the k-means algorithm, or indirectly such as setting the minimum density in a density-based algorithm which in turn effects the number of clusters. Hence, predicting the number of clusters correctly is important for correct and meaningful clustering and the associated analytical outcomes.
In reviewing the clustering techniques used within the 50 NIR and IR spectroscopy papers (Tab. 7), 30 of the papers did not even address the issue of predicting the number of clusters. It is assumed that these authors knew the number of classes of objects in their sample set (e.g., two for cancerous vs non-cancerous) and therefore felt it was not worth addressing. Similarly, 13 of the papers explicitly used a priori knowledge of their data set to manually set the number of clusters (e.g., knowledge that their data set contains 4 varieties of olive tree for olive-oil production). While this may have been sufficient for the purposes of their research (typically, that IR or NIR testing and clustering can correctly separate or differentiate samples), it can be limiting in the scope of their findings and the confidence in what can be drawn from their findings. To highlight this, if a random subset of their data was analyzed which happened to contain less classes of materials than the original set, using the original value of k clusters would result in incorrect clustering. A better practice would be to include a quantified prediction of the number of clusters as part of the analysis workflow. Being able to correctly predict the number of clusters (against a known value of k) is a good indicator of clearly separated clusters and provides confidence in the validity of the cluster analysis performed in the study.
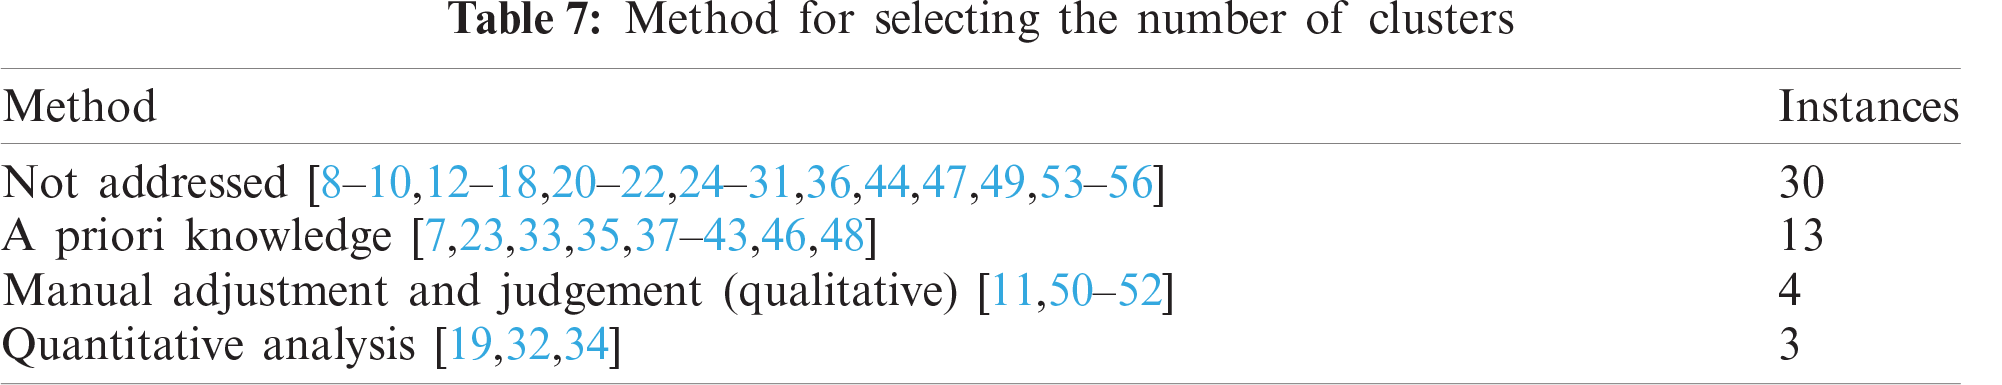
Of the remaining seven papers surveyed, four used qualitative analysis and three used a quantitative analysis to predict the number of clusters. The qualitative analysis papers visualized the clustering results for various values of k and used the analyst’s subjective judgement as to which produced the better clustering. This is particularly common for IR spectroscopic imaging applications. Since clustering is a very human centric concept and good clustering is somewhat subjective (particularly for FTIR imaging), this is a valid approach. However, quantitative approaches are preferred to minimize that subjectivity.
Three common quantitative techniques for predicting the number of clusters include the “Elbow” method, the Gap Statistic, and the use of internal cluster validation indices (such as the Silhouette score method).
In the elbow method, the total within-cluster sum-of-squares variation is calculated and plotted vs. different values of k (i.e., k = 1,…, 10). Where the slope of the plot changes from steep to shallow (an elbow) is the predicted number of clusters. While this method is simple, it can be inexact and sometimes ambiguous. The elbow method was used in one of the reviewed papers [34].
The Gap Statistic method aims at providing a statistical procedure to formalize the heuristic of the elbow method [82]. The gap statistic compares the total within within-cluster sum-of-squares variation for different values of k with their expected values under null reference distribution of the data. The estimate of the optimal number of clusters will be the value that maximize the gap statistic. This means that the resulting clustering structure is far away from the random uniform distribution of points.
A third technique to predict the number of clusters is through the use of internal cluster validation indices. This was the quantitative approach used in two of the reviewed papers (i.e., Xie-Beni cluster validity measure for fuzzy clustering [56] and Silhouette score for K-Means clustering [32]). Internal cluster validation indices calculate the “goodness” of clustering which is typically based on the tightness of the clusters and separation between clusters. One of the most common indices is the Silhouette score. The Silhouette score is calculated using the mean intra-cluster distance (a) and the mean nearest-cluster distance (b) for each sample [83]. The Silhouette score for a sample i is
The overall Silhouette score for a set of i datapoints is then the mean of the individual Silhouette scores. To use this to determine the correct number of clusters, the Silhouette score is calculated for varying numbers of k (i.e., k = 1,…, 10). The number of clusters k that produces the highest Silhouette score infers that it is the best resulting clustering and that is the correct number of clusters.
3.2.5 Cluster Evaluation and Validation
Since cluster analysis is an unsupervised learning task, it can be challenging to validate the goodness of the clustering and gain confidence in the clustering results [84]. Cluster validation is the formal process that evaluates the results of the cluster analysis in a quantitative and objective fashion [4].
There are two main types of validity criteria that can be applied: internal, and external. External validation measures use data external to the data used for clustering. This external data is typically in the form of ‘true labels’ such as classification labels used to evaluate the clustering. Internal measures evaluate the goodness of cluster structure without external labels to judge how good the clustering is and if the clustering is valid.
External validation was the dominant approach used in the reviewed papers, and it fits the purpose of the majority of papers: demonstrating that IR or NIR testing can correctly separate samples into classes where true labels for the samples are known. As summarized in Tab. 8, external validation approaches used included comparing true labels to the clustering labels in cluster plots, dendrograms, biomedical images, and numerical tables. When the clustering algorithm correctly separates the samples into clusters that perfectly match the true labels, then validation becomes a largely trivial task, as was the case for most of the papers.
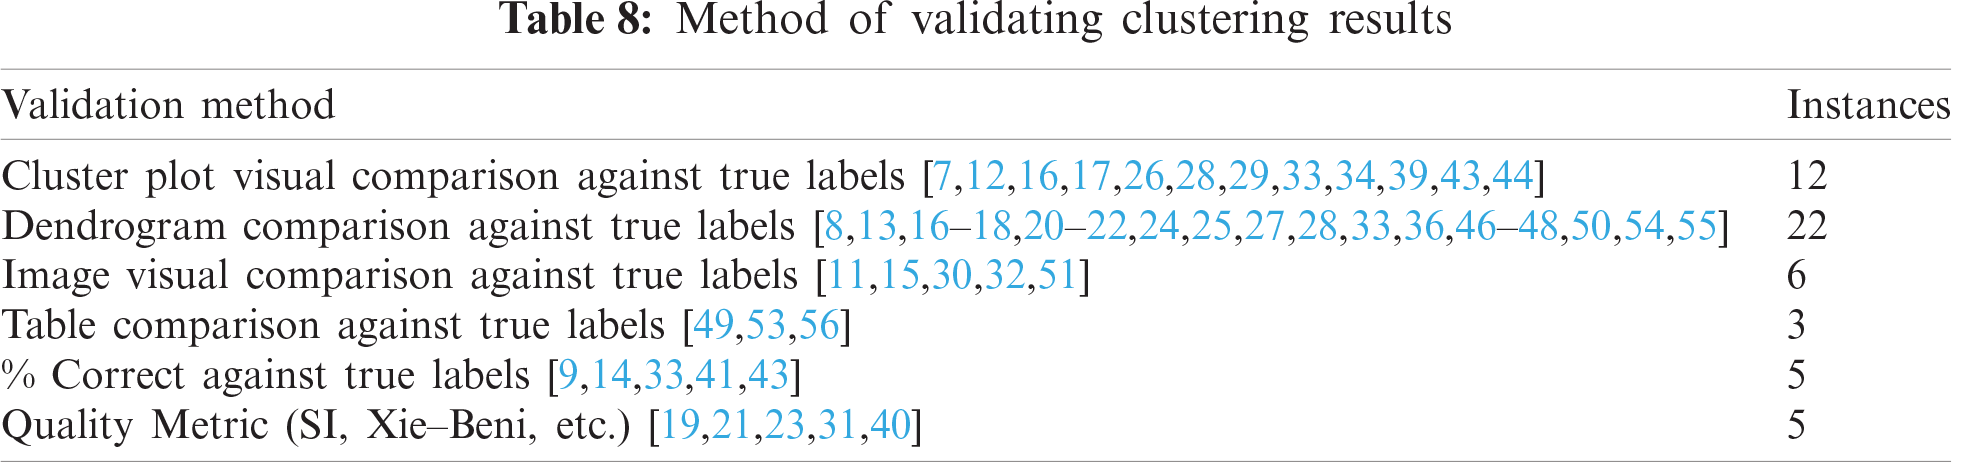
When clustering is only partially correct, the task of measuring this level of correctness is less trivial. Concerningly, five of the papers reported their results as a “percentage correct” against known labels. This is a notion that does not match the concept of clustering. The labeling generated from cluster analysis (unsupervised learning) are symbolic and based on similarity, so directly matching them to classification labels ignores a correspondence problem [81]. To highlight this, an example is considered where data points from one class are spread across two clusters: Are the points in one cluster correct and the other incorrect to provide a percentage? and which is the true correct cluster? Or are they all incorrect? This highlights why external validation indices are required which employ notions such as homogeneity, completeness, purity and alike.
As with most aspects of clustering, there are many potential validation indices that have been proposed. Desgraupes et al. [85] details 38 different internal and external evaluation indices and Xiong and Li review sixteen of them [84]. Two of the most common external indices are the V-measure [86] and the Adjusted Rand Index [87].
The V-measure or ‘Validity measure’ is the harmonic mean between the homogeneity (h) and completeness (c) of clusters. i.e.,
where a
The Adjusted Rand Index (ARI) [87] is a corrected-for-chance version of the Rand Index [88] which determines the similarity between two partitions as a function of positive and negative agreements in pairwise cluster assignments. As described in [89]: Given a partition U and a reference partition V, in Eq. (3), (a) accounts for the total number of object pairs belonging to the same cluster in both U and V; (b) represents the total number of object pairs in the same cluster in U and in different clusters in V; (c) is the total number of object pairs that are in different clusters in U and in the same cluster in V; and (d) is the total number of object pairs that are in different clusters in both U and V.
Internal cluster validation is used where the true labels are not known for evaluation or there is a desire to compare the quality of clustering generated by different clustering techniques [90]. Two common internal validation indices are the previously described Silhouette score (also called Silhouette index or SI) for traditional clustering, and the Xie–Beni index (XB) for fuzzy clustering techniques. In the papers reviewed, there was one instance of the use of SI when evaluating which selected wavenumbers resulted in the best quality clustering [31], and one use of XB where it was used to compare the quality of clustering from various fuzzy clustering algorithms [19].
In reflecting on the findings, we will primarily focus on the clustering aspects of the analysis presented in the surveyed papers. Here, shortcomings were observed (as previously highlighted) that may indicate a lack of familiarity with some of the complexities of clustering practice by some researchers using spectroscopy. These indicators include a lack of clarity in the explanation of the cluster analysis process, missing details such as the type of linkage used in hierarchical cluster analysis or the distance metric used, and cluster validation indices not being used for validation. This uncommonness of cluster validation indices is a significant difference to literature from the machine learning domain where quantified cluster analysis is more prominent.
This is not unexpected as while clustering is certainly not a new field, it is one with challenges, complexities, uncertainties and ambiguities that may not be appreciated by researchers where cluster analysis is not their primary area of research. There is limited conclusive literature available on clustering of spectroscopy data to support practitioners and the choice of best techniques can be dependent on the specific characteristics of the data being analyzed.
An additional potential contributor to the observed shortcomings is the chemometric software that is commonly used in association with IR or NIR data analysis. Many practitioners look for off-the-shelf solutions for their chemometric analysis [91] as was seen in our survey. Software packages such as OPUS (Bruker), Unscrambler (Camo) and PLS Toolbox are now including the capability to do cluster analysis such as hierarchical clustering or k-means. Hence this capability is becoming available to many users who use this software for chemometric analysis. However, the clustering capabilities in these software packages are currently limited to a small set of clustering algorithms and are missing the quantitative evaluation components such as tendency to cluster metrics, techniques for predicting of the number of clusters, or internal and external validation indices. These quantitative metrics remain niche analytical capabilities which are typically conducted with code developed in MATLAB, R or python.
Finally, the applications where clustering is being applied was simplistic in many of the surveyed papers. In an example where the aim of the research is to demonstrate IR or NIR spectroscopy can separate samples into k known classes, then cluster analysis was used with the number of clusters set to k and evaluation was done manually against the known labels. Hence, the use quantitative clustering metrics was not essential. While this cluster analysis does meet the researcher’s goals and demonstrates the capability of IR or NIR spectroscopy in that instance, the limitations of that simplistic analysis are not made explicit. e.g., Without predicting the number of clusters k, then the analysis is only valid for that number of classes and the findings cannot be assumed valid for a subset of that data where the number of classes may differ.
In order to add rigor to future cluster analysis conducted on IR and NIR spectroscopy data, an analysis model or workflow is now proposed. As presented in Fig. 1, the analysis model consists of four stages: (1) IR or NIR measurements of samples, (2) early stages of the traditional chemometric process to improve the data, (3) cluster analysis utilizing quantified metrics or indices to support analysis decision making, and (4) evaluation and validation of the clustering utilizing appropriate qualitative or quantitative techniques. Core to the application of each stage is the use of clustering indices to enable quantified evaluation and selection of appropriate techniques. Details of these techniques have been included earlier when reviewing current practice within the surveyed papers.
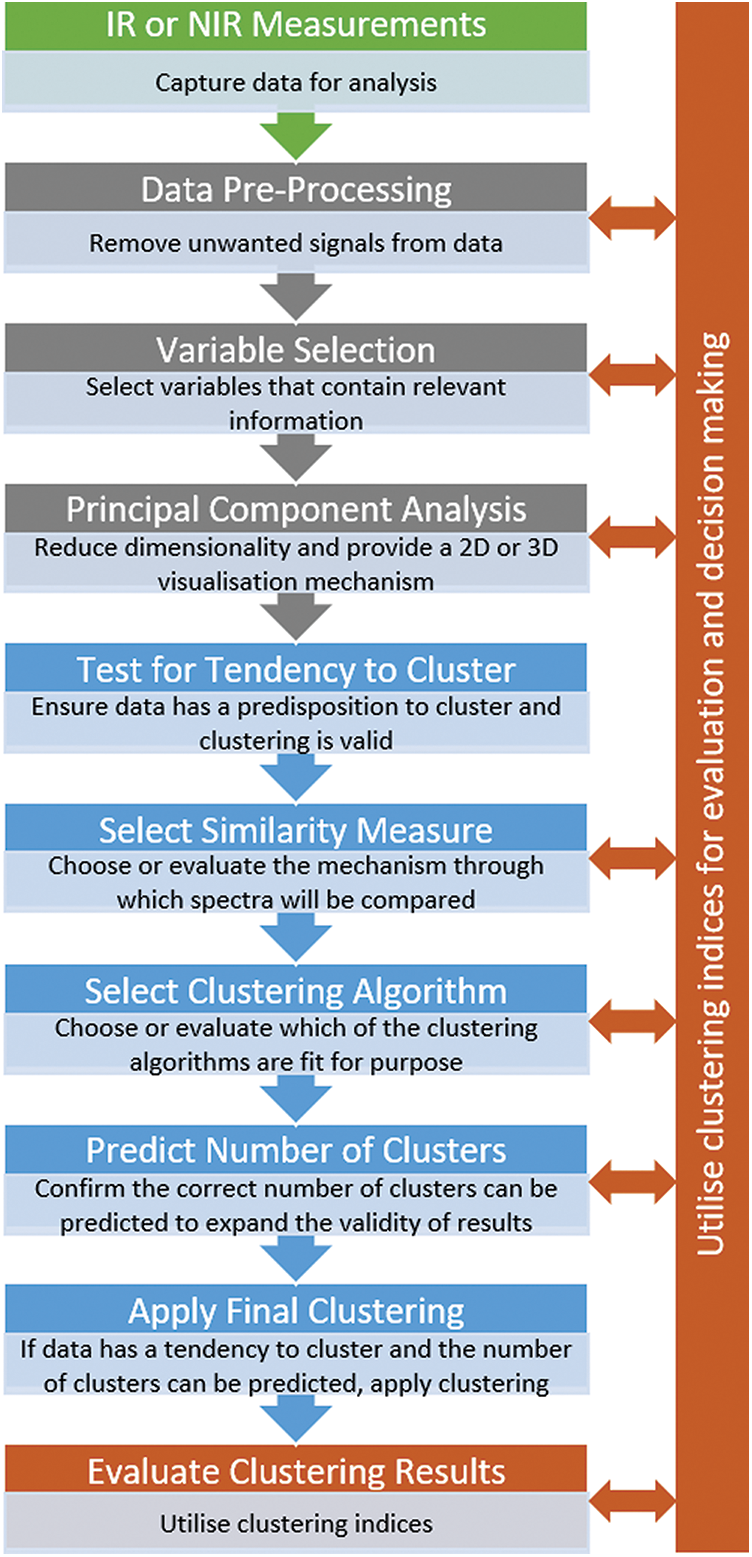
Figure 1: A proposed analysis model for cluster analysis of NIR and IR spectroscopy data
At this point, it is worth discussing the depth of analysis conducted at each stage of this analysis model. If full quantitative analysis and evaluation is conducted at each stage of the workflow, it could become a substantial and time-consuming package of analysis. i.e., application and evaluation of multiple pre-processing techniques, application and evaluation of multiple variable or feature selection techniques, PCA analysis, testing for tendency to cluster, application and evaluation of multiple similarity measures, application and evaluation of multiple clustering algorithms, application of quantitative clustering indices to predict the number of clusters, and application of clustering indices to evaluate the final results of the cluster analysis.
A pragmatic approach is suggested. Consideration should be given to the purpose of the analysis and its importance, i.e., early exploratory analysis may not warrant as much effort compared to a conclusive demonstration of a cancer detection technique aimed at wide spread publication. Similarly, consideration should be given to the data itself and the challenge it presents to cluster analysis. If the data can be visually seen to be well separated and sufficiently accurate clustering can be easily achieved, then it may not warrant the evaluation of multiple techniques to achieve improved data and clustering characteristics.
A streamlined approach may be to select common or familiar approaches for data pre-processing, variable selection, similarity measure, and clustering algorithm and then evaluate the results. If sufficiently accurate clustering is achieved with these selected approaches, it may not warrant refinement and evaluation in these areas. It is however recommended that clustering tendency is tested, and the number of clusters is predicted as these are valuable indicators in the confidence of the clustering results and its applicability. Additionally, if this streamlined approach is pursued, we encourage the analysts and authors to be explicit about this approach when publishing their results and to detail why those decisions were made.
If sufficiently accurate clustering is not achieved utilizing this streamlined approach, then that is a driver for more detailed analysis and evaluation at each of the stages of the analysis model with the final clustering indices scores as the metric against which results can be assessed. Similarly, if true labelled data is not available for evaluating the results of the cluster analysis, internal clustering indices will be the metric used for assessing the outcome of the overall analysis.
Of note, this potentially significant volume of analysis will have the most burden the first time the analysis model is implemented. If the workflow can be implemented in an analysis environment such as MATLAB, R or python, the time required for subsequent applications of this analysis model will be significantly less. Hence, if practitioners regularly intend to conduct cluster analysis and desire to have a rigorous methodology that delivers quantifiable results, establishing an extensive workflow with multiple stages of evaluation is likely to be worthwhile.
We have surveyed and reviewed 50 papers from 2002 to 2020 which apply cluster analysis to IR and NIR spectroscopy data. The analysis process used in these papers was compared to extensive literature from the machine learning domain. The findings highlighted a lack of quantitative analysis and evaluation in the NIR and IR cluster analysis. Of specific concern were a lack of testing for the data’s tendency to cluster and prediction of the number of clusters. These are key tests that can provide increased rigor and confidence, and widen the applicability of the cluster analysis
In a bid to improve on current practice and support researchers conducting cluster analysis on IR and NIR spectroscopy data, an analysis model has been presented to highlight potential future perspectives for the cluster analysis. The proposed analysis model or workflow incorporates quantitative techniques drawn from machine learning literature to provide rigor and ensure validity of the clustering outcomes when analyzing IR and NIR spectroscopy data.
Funding Statement: This research is supported by the Commonwealth of Australia as represented by the Defence Science and Technology Group of the Department of Defence, and by an Australian Government Research Training Program (RTP) Scholarship.
Conflicts of Interest: The authors declare that they have no conflicts of interest to report regarding the present study.
 | This work is licensed under a Creative Commons Attribution 4.0 International License, which permits unrestricted use, distribution, and reproduction in any medium, provided the original work is properly cited. |