DOI:10.32604/cmc.2021.017116
| Computers, Materials & Continua DOI:10.32604/cmc.2021.017116 | |
| Article |
Diagnosis of Leukemia Disease Based on Enhanced Virtual Neural Network
1Department of Information Technology, PSNA College of Engineering and Technology, Dindigul, 624622, India
2Department of Information Technology, K. Ramakrishnan College of Engineering, Tiruchirappalli, 621112, India
3Department of Biomedical Engineering, Saveetha School of Engineering, SIMATS, Chennai, 602105, India
4Electronic and Telecommunicacions Program, Universidad Autónoma del Caribe, Barranquilla, 08001, Colombia
5Department of Computational Science and Electronic, Universidad de la Costa, CUC, Barranquilla, 08001, Colombia
6Department of Mathematics, Faculty of Science, New Valley University, El-Kharga, 72511, Egypt
*Corresponding Author: José Escorcia-Gutierrez. Email: jose.escorcia23@gmail.com
Received: 21 January 2021; Accepted: 16 April 2021
Abstract: White Blood Cell (WBC) cancer or leukemia is one of the serious cancers that threaten the existence of human beings. In spite of its prevalence and serious consequences, it is mostly diagnosed through manual practices. The risks of inappropriate, sub-standard and wrong or biased diagnosis are high in manual methods. So, there is a need exists for automatic diagnosis and classification method that can replace the manual process. Leukemia is mainly classified into acute and chronic types. The current research work proposed a computer-based application to classify the disease. In the feature extraction stage, we use excellent physical properties to improve the diagnostic system's accuracy, based on Enhanced Color Co-Occurrence Matrix. The study is aimed at identification and classification of chronic lymphocytic leukemia using microscopic images of WBCs based on Enhanced Virtual Neural Network (EVNN) classification. The proposed method achieved optimum accuracy in detection and classification of leukemia from WBC images. Thus, the study results establish the superiority of the proposed method in automated diagnosis of leukemia. The values achieved by the proposed method in terms of sensitivity, specificity, accuracy, and error rate were 97.8%, 89.9%, 76.6%, and 2.2%, respectively. Furthermore, the system could predict the disease in prior through images, and the probabilities of disease detection are also highly optimistic.
Keywords: White blood cells; enhanced virtual neural networking; segmentation; feature extraction; chronic lymphocytic leukemia
White Blood Cells (WBCs) is a common name given for a collection of cell types in blood. These cells do not reveal any symptoms or important information during disease diagnosis. Generally, the critical issues in the diagnosis and treatment of leukemia are manual location recognition and automatic detection of different WBCs’ production. The hematopoietic system differentiates a considerable number of WBCs and it can be identified through microscopy. Leukemia can be classified as either severe or chronic based on its stage. Although normal and abnormal cell source systems are present in the body, the growth of the latter is slow and varies under different circumstances. Fig. 1 shows the types of blood cells during leukemia. Acute Lymphocytic Leukemia (ALL), Acute Myelogenous Leukemia (AML), Chronic Lymphocytic Leukemia (CLL) and Chronic Myelogenous Leukemia (CML) are the types of Leukemia reported so far. Among these types, the proposed model i.e., Enhanced Virtual Neural Network (EVNN) classification model is aimed at diagnosing chronic lymphocytic leukemia. The accuracy of the model should be checked to validate its effectiveness in detection and classification of leukemia. WBCs produce complex results during diagnosis which is its common feature. This occurs especially when low quality images of WBCs are used. Generally, there exists a large number of WBC detection and classification databases with high resolution blood smear images. In these images, only a small area of WBCs can be observed. So, reducing the background with the help of traditional methods is quite challenging. Further, conventional industrial and healthcare protocols are weak to resist noise and complex calculations. So, it is a challenge to design an automation system in medical image processing for identification and counting of blood components based on microscopic images. These immature chronic lymphocytic leukemic cells encircle other blood-producing cells in bone marrow. If a child’ bone marrow is not supplied with enough oxygen, it does not produce sufficient quantity of blood cells. So, the children become anemic and feel tired at most of the times. In the absence of sufficient quantity of platelets, blood does not get clot which results in persistent bleeding or internal bleeding too. In case, when WBCs are produced in insufficient quantities, the immune system fails to prevent foreign organisms such as bacteria, virus etc., from entering the body. Thus, it results in the development of a routine infection.
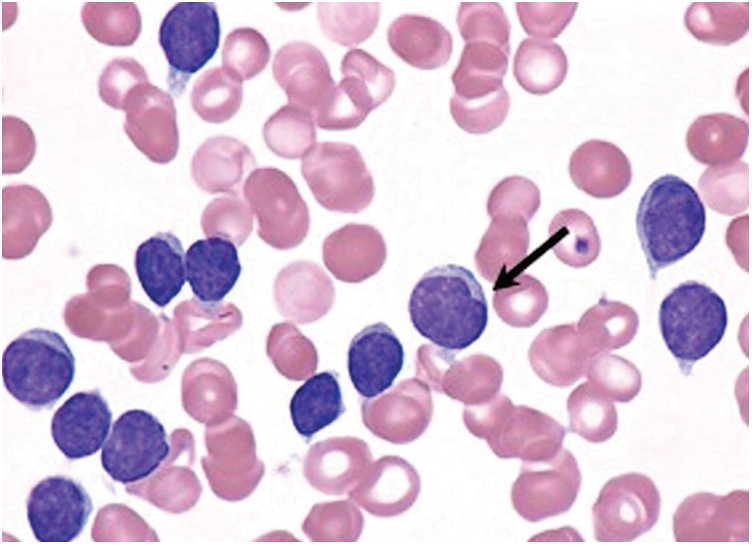
Figure 1: Chronic lymphocytic leukemic white blood cells
Various image processing methods have been proposed in research investigations conducted so far. Image processing plays an important role in diagnostic procedures. The objective of current research work is to apply image processing technique to develop a novel method i.e., automated leukemia detection system. Earlier, such image processing techniques have been used by medical professionals in which the blood samples are used in the diagnosis of Leukemia [1]. Image processing techniques require input image which is captured with the help of digital camera or scan light image in bitmap graphical format. The image contains noise and content and gets disturbed by function notifications in top color. There may be too many disturbances or noises present in an image which makes it shabby and blurred. This in turn harms the areas of potential interest. The background should be excluded and only the WBCs are to be considered. In this scenario, preprocessing is used as image contrast enhancement technique to improve the quality of image [2,3]. During preprocessing, RGB color plane is multiplied by color extraction, based on which either Red Blood Cells or WBCs, here the area of interest, are extracted from the background. Then, image Otsu method is used. After this process, mathematical morphology of the image is extended through the addition of pixels to image object boundary [4].
The study conducted earlier analyzed DNN (Diffusion Neural Network) algorithm and classified the extracted blood cell images under acute leukemia. Leukemia is a type of cancer characterized by abnormal growth of WBCs in bone marrow. The exact cause behind leukemia is unclear. However, its growth stages and rapid nature have already been investigated [5]. The study conducted earlier confirmed that leukemia is a result of grouping of lymphocytes affected by blood type (short-term leukemia and chronic leukemia). Between the types given above, the current study focuses on short-term leukemia which can further be divided into Acute Lymphoblastic Leukemia (ALL) and Acute Myeloid Leukemia (AML). Both types of leukemia can be diagnosed through microscopic analysis of blood cell images and increased number of blood cells in bone marrow. Manual detection and counting of such infected cells may produce errors. Regenerative neural network mechanism is used in the literature [6,7] to obtain all the properties of WBCs. WBCs safeguard the human body from viruses, bacteria and other pathogens. In disease diagnosis, the doctors should be well-versed about WBCs in terms of its count, type, shape and composition. It is important to maintain an optimum number of WBCs in blood, especially in case of hemorrhoid [8].
The success rate of the proposed method depends on the contrast between object and the background. The method proposed in the literature [9,10] is widely used in WBCs proliferation, because it contrasts the image background with White Blood Cells compared to biofilms. The specific performance of the monitoring test was evaluated externally. This was used to indicate both accuracy as well as recall values [9,10]. In accuracy (true positive and false positive), true positive value indicates the accuracy of all test results which are practical and is relatively known to be White Blood Cells. At the same time, accurate value obtained reflects the success rate of knowing the formula for each framed WBC (true state and false negative). When compared with other images of blood samples, WBCs have relatively high concentration values. In literature that dealt with Q-means protocol and its implementation [11,12], the process had three steps namely, pre-processing, packaging and post-processing. These steps are described in detail in the following paragraphs [13].
Pre-processing improves the quality of image by increasing its intensity. After contrast adjustment during early pre-processing, RBCs and cell cytoplasm are removed while only the WBCs are left in the image with some noise [14]. The content of WBCs is an important indicator of human health. In color blood cell films, fragmentation and recognition are two fundamental problems faced under automated White Blood Cell (WBC) recognition systems. Since WBCs are elliptical in shape, elliptical detection method can only detect those components which are elliptical in shape. However, segmentation and elliptical detection are time-consuming processes and are prone to provide biased results [15]. In literature [16], an effective optimization method was proposed for fragmentation and detection of WBCs. After comparison of other optimization methods in terms of detection, WBC automatic detection method was used. When Artificial Bee Colony (ABC) algorithm was used for RBCs (Red Blood Cells), optimization problem was faced. The experimental results proved that the proposed technology is reasonable in terms of accuracy and efficiency [17].
Previously, vector machines and other such automated segmentation methods are used in the segmentation of WBC images. Automated segmentation of cell nuclei has been performed in earlier studies based on unobtrusive color gram Schmidt, instead of filter and grayscale imaging. In this method, ambiguous C algorithm was considered as the basic element [18,19]. It is important to diagnose, count and classify human blood images into different cell types. However, it is challenging to cover a wide range of unresolved biological differences, within the limits of these processes and multiple imaging cognitive resolutions. Both identification and counting of original holographic WBC images should be accomplished by a new method which should be capable of classifying WBCs without error. It is to be noted that the physiology of an individual decides the composition of blood cells [20].
The proposed method intends to identify different types of WBCs in order to diagnose leukemia. There are four stages in this method such as preprocessing, segmentation, feature extraction, and classification. Preprocessing is the first stage in which the noise is removed and the quality of image is increased. Segmentation method allows the detection of white blood chronic lymphocytic leukemia through the segmentation of input image into different parts. This stage helps in identifying and classifying the type of chronic lymphocytic leukemia with the help of microscopic image processing technique. In this study, EVNN classification method was used in the identification of chronic lymphocytic leukemia. The accuracy of the results was tested for optimal performance in detection and classification of WBC images for leukemia. Fig. 2 shows the Enhanced Virtual Neural Network-based leukemia cell cancer diagnosis and classification framework.
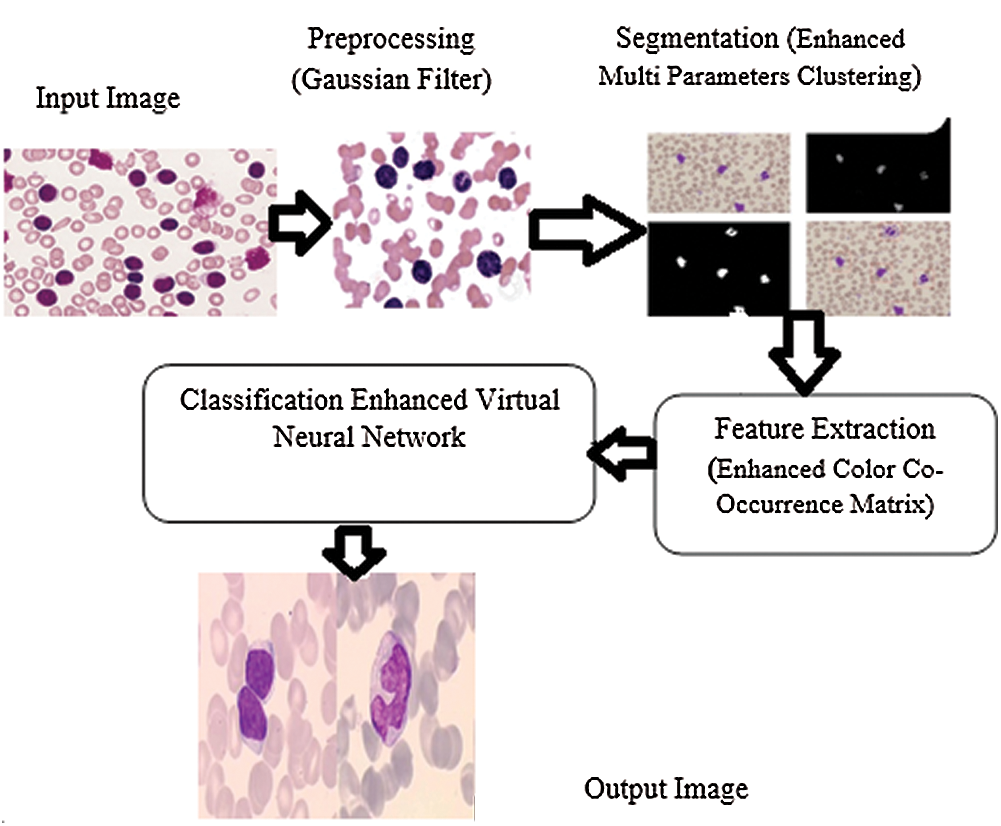
Figure 2: Framework for enhanced virtual neural network method
Preprocessing is a one-time procedure that removes the distortions in image and gains prominence in this process. Gaussian filter is used to change the weight at a damaged distance, according to Gaussian distribution. This two-staged filter is widely used since it protects the edges. The pixel in the center is filtered by its quality, whereas every pixel in the horizontal direction is amplified. This innovative pixel segmentation is the first level in main filter.
Gaussian equation is given herewith.
where:
σ represents Gaussian distribution constant, whereas (i, j) denote the intensity values of the pixel. There may be numerous disturbances or noises present in the image which are discussed in the upcoming sections. There are methods available to get rid of these noise peripherals. The image gets affected during image acquisition process, if not done properly. Therefore, it is necessary to preprocess the image to reduce the noise. Preprocessing is used to improve the accuracy and interpretability of the image.
Step 1: Start White Blood Cells input grayscale
Step 2: Preprocess the filter
Step 3: Resize the image in 200 × 200 resolution
Step 4: Compute multidimensional arrays with the filter
Step 5: Calculate the changed threshold image with global threshold that can be used
Step 6: Assign the saved images with VAR1 and VAR2
Step 7: For i = 1:1:var1 do for j = 1:1:var2 do
Step 8: Stop the process
3.2 Enhanced Multi-Parameters Clustering Algorithm Segmentation
Image segmentation is a process in which the image components are segregated under different groups. In this domain, numerous studies have been conducted with specific focus on clustered image segmentation. Enhanced multi-parameter clustering algorithm is the most popular one among the available methods. Image segmentation theory is hypothesized to improve the probability of rugged segment. Most image segmentation mechanisms are based on two basic features such as ‘clustering’ and ‘region-growing’ between which ‘clustering method’ is the most preferred one. The basic idea of region-growing method is to sample different intensity distances, according to an intensity value. Two closely-located points are obtained together for a compact and independent bunch of package material.
3.2.1 Enhanced Multi-Parameters Clustering Algorithm
Following is the list of steps followed in enhanced multi-parameters clustering algorithm.
Step1: Transform the image data into element depiction
Step2: Read the primary image data to get a depiction in white mass
Step3: Identify the cluster centers and their numbers
Step4: Assign new centroid and all other pixels to the same cell
Step5: Repeat the steps 1–4 until the maximum number of iterations is reached or all the cells obtained remain unchanged.
Step6: The processed image pixels are the final markers and the last allotment cell.
Step7: End
3.3 Enhanced Color Co-Occurrence Matrix-Based Feature Extraction
Feature extraction is one of the steps involved in image processing technique. This step determines the unique characteristics of an image with certain properties which makes it different from others. The extracted features should be characterized through feature spacing to provide input types based on the description of image properties. The current research work used eight different layout features for analysis. However, these functions were used in different classifications and subdivisions. Since image classification is performed for images, the feature is rated, on the other hand, based on whole image. Image segmentation is performed so that the features are rated for each pixel. The proposed method makes use of physical properties of the cells to improve the accuracy of diagnostic procedure. Enhanced Color Co-occurrence Matrix (ECCM) is one of the most widely used image analysis systems. Among eight textures, few are used in the classification of images such as second row of angles’ difference, entropy inversion moment, angle and other functions followed by kurtosis of the image. The features of the image are extracted in next steps. The features of the system ensure high success rate. The function, used in this work, is estimated from the formulas given below.
Second set angle is the sum of squares of gray dimensions in an image which is otherwise called as energy (or) uniformity. Stress ratings are not equal, while the power is usually high.
Energy
where p (I, J) corresponds to the probability matrix of input image.
Image local contrast is measured by this function. It is expected that the density of pixels remain similar, if the value decreases.
Here, Ng denotes the number of gray sizes of the original image.
Adjacent pixels are represented by gray color linear contact feature. This function denotes the relationship of statistics between the variables.
where
Homogeneity is one of the primary approaches which is calculated as given herewith.
In this equation, P (a, b) denotes the pixel value. Preprocessing and feature extraction processes are followed in medical image processing to classify the image intermediates and normal images as either normal or abnormal.
Average Filter Mathematical Average is a variant of filter and is mainly used in images with Gaussian Noise.
Here, average (x, y) value denotes the arithmetic mean time window.
Skewness denotes the feature of symmetric action system. The value can be negative or positive. If the image is exactly symmetrical, the value is usually zero.
Measuring whether kurtosis or data leakage is relatively flat and is normally distributed.
P = Number of layers for film thickness measurement
I = Thickness Measurement along Individual Layers
J = Mean Layer Thickness
Standard Deviation is a bad local measure and is a form of targeted Japanese aggression. The presence of electronic media or other symptoms such as the presence of differential objects or scattered correction can be cited as normal or average duration.
Here, the average value of the images is calculated, while the sum of functions is represented by Σ, X and N. Further, N corresponds to the number of images and the data points.
Variance is the difference between mean and the measured variables. Variance can also be defined as the value up to how far the gray value is spread across the input image.
Here, μ denotes that the whole picture has average value.
Gray Level Street Quantity Matrix distribution is represented by random entropy. Entropy gray levels are expected to be high as long as the image is approximate.
Here, the possible values are entropy ‘P’ of discrete variable ‘f’ which denotes the frequency of occurrence.
3.4 Enhanced Virtual Neural Network Classification
The most important advantage of Enhanced Virtual Neural Network Classification Algorithm (EVNN) is its fast training rate compared to multi-time network. Training can be done using Enhanced Virtual Neural (EVNN) detection and classification model. This results in the identification of specific morphology of WBCs so that its relative functions can be developed. In image processing technique, the performance of the method and classification accuracy are analyzed through four parameters such as accuracy, sensitivity, specificity and classification error of first-line monocytes and neutrophils. The last parameter remains higher compared to other three types. This might be attributed to the fact that the ratio in that area is a measure of circular shape. Like other cell types, single cells and neutrophils are very unique and non-circular in shape with area-ratio activity.
Fig. 3 shows a basic structure of Enhanced Virtual Neural Network architecture. In this figure, every node is connected with each other as a layer of network at all the points without fail. It contains hidden layer input (x), hidden and hidden-to-output layer (Y). The last weight matrix is then passed on through Softmax capacity to create a numeric esteem that orders a paired variable. The work is then used to review the structure and the outcome is expected. Besides, the flowchart of the EVNN model is shown in Fig. 4.
3.4.1 Enhanced Virtual Neural Network Classification Algorithm
Step 1: input X = (x1, x2…xn) denotes a matrix of n samples, y= (y1, y2…yn) as their corresponding output labels and maximum number of selected attributes.
Step 2: initialize function f (Xi) and population of fireflies, Xi.
Step 3: Update the weight of hidden layers as well as input weight.
Step 4: Calculate all the similarities between spatially adjacent regions and the average intensity of the image.
Step 5: Use the drop out for a number of times and average is obtained.
Step 6: Select the fittest individual and pass it to next generation directly. The rest of the individuals are selected based on the priority of probability. The selection probability of an individual can be expressed as follows
where N is the overall population size. F (i) is the fitness value of ith individual
Step 7: Implement the Enhanced Virtual Neural Network Classification Algorithm during when the centers are computed using the equations given earlier.
Step 8: Determine the cluster centroid, XJ and degree of fuzziness.
Step 9: Let J = 1 be the component connected to J = 1 in the previous iteration.
Step 10: End.
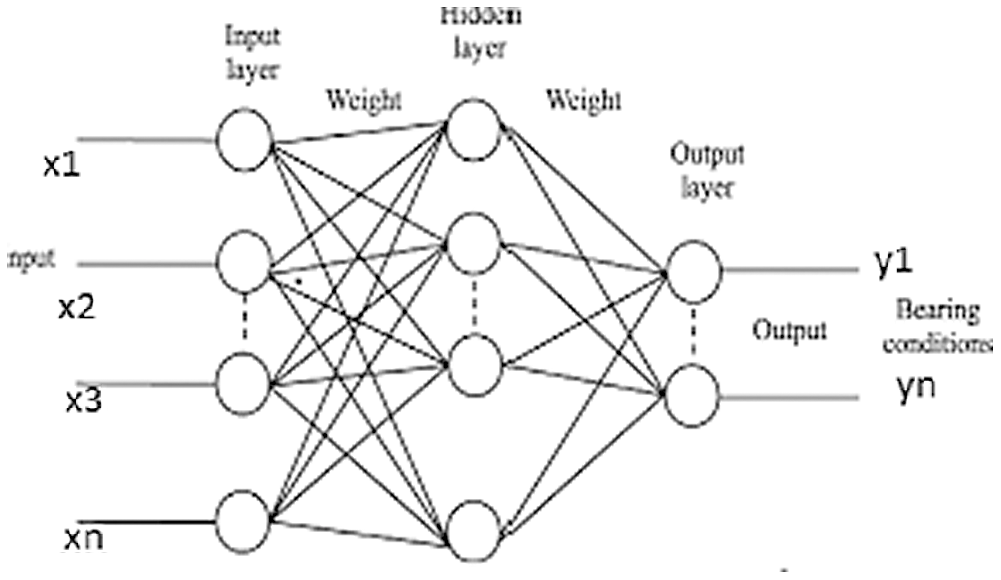
Figure 3: Enhanced virtual neural network
The identification of WBCs from imaging techniques is an advanced method. So, the output remains useful in identifying the precise types of WBCs. In this work, the authors proposed an automatic image segmentation and classification method for WBCs. This is the only way to obtain results from blood cell images. The input image was first segmented to segregate all the types of blood cells. Each dataset has different colors, since the specialists differ in blood cell image. Enhanced Virtual Neural Network Classification algorithm was implemented in MATLAB2017B in the current study. In the following section, both original image and the enhanced image are depicted together. The operation platform and regulations in the prediction method clarify the performance of implementation.
Fig. 5 shows the simulation results attained from the identification of WBCs through imaging. The current work assures the feasibility of developing an automated algorithm in the classification of WBC images. The proposed model i.e., Enhanced Virtual Neural Network Algorithm (EVNN) detected WBCs in blood cell images. Further, the proposed method achieved excellent accuracy and sensitivity.
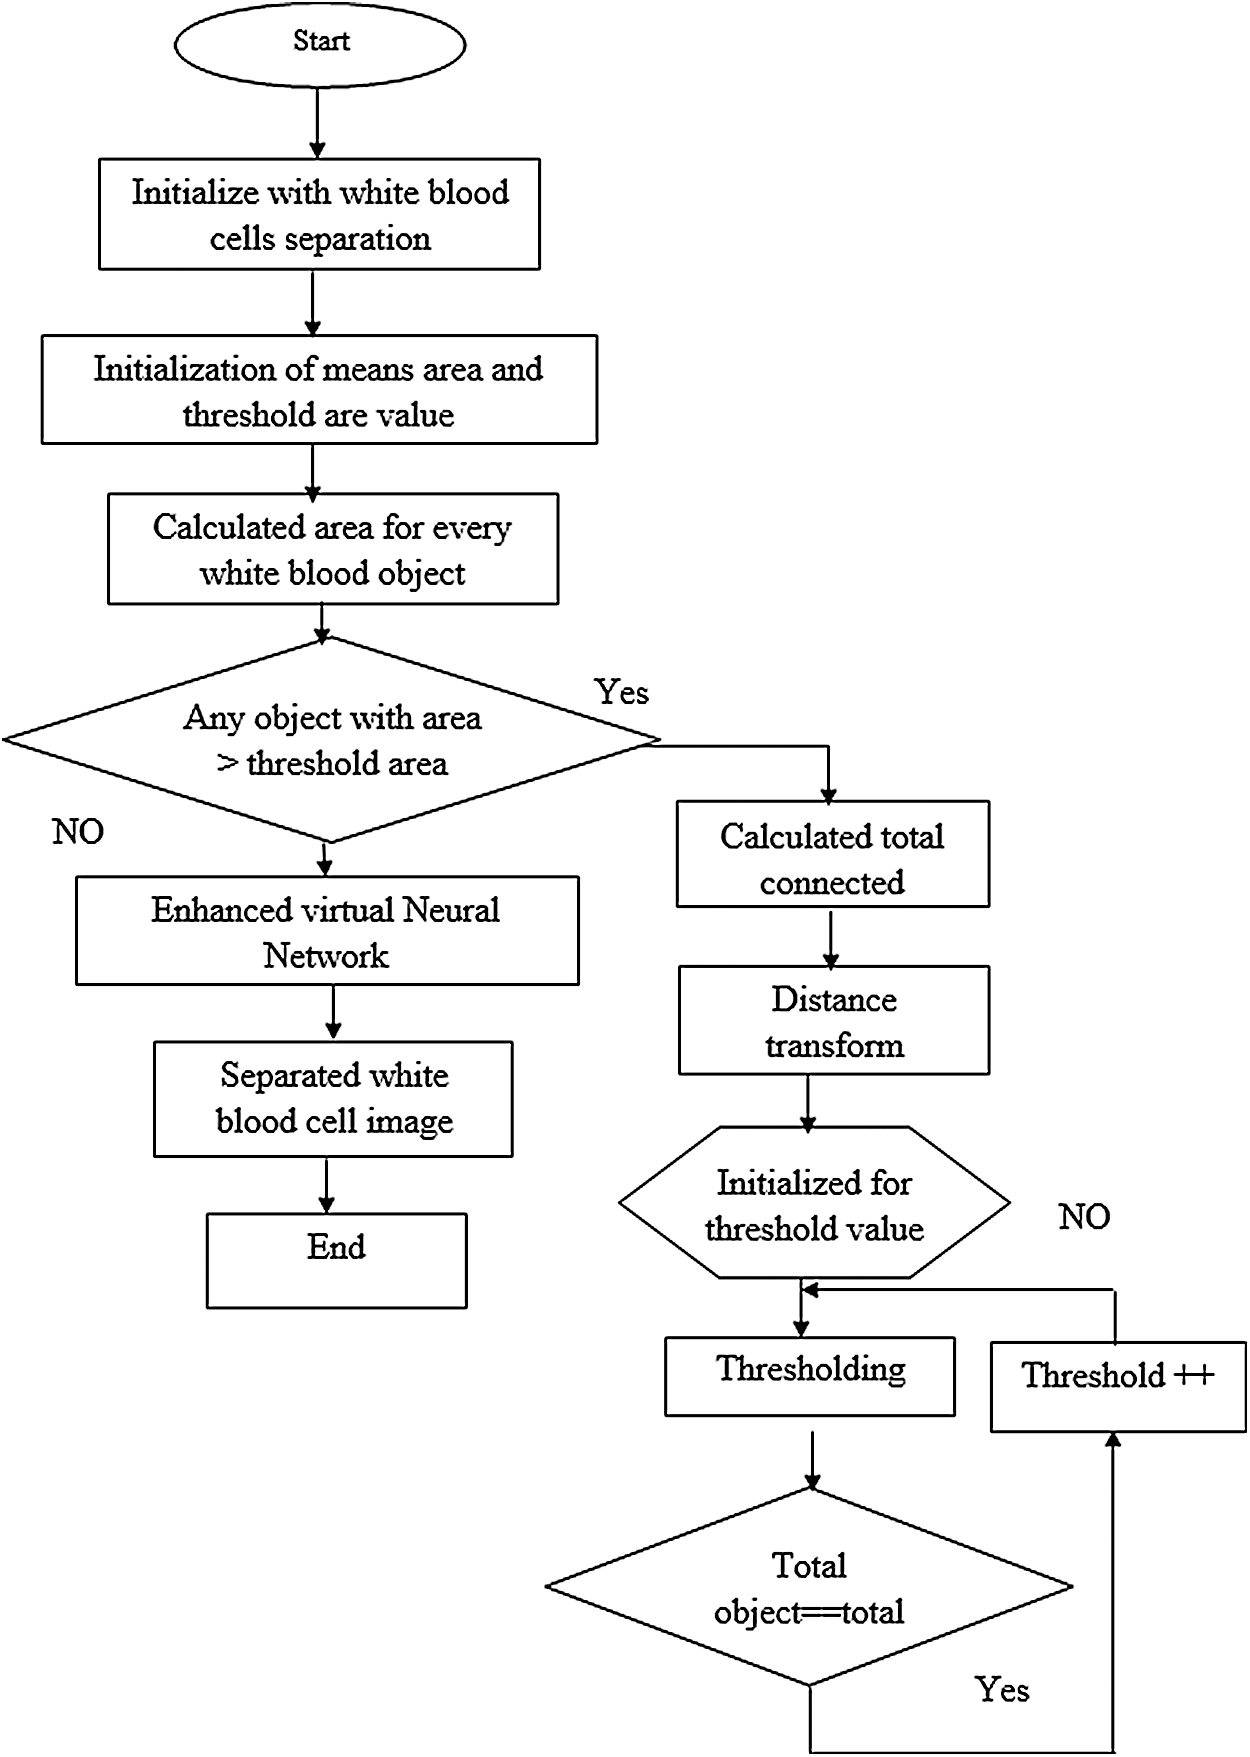
Figure 4: Enhanced virtual neural network flow chart
Tab. 1 shows the dataset for WBCs which has detailed information on evaluation parameters. Simulation software was fed with many images of leukemia-affected blood cells.
Tab. 2 shows the accuracy, sensitivity, specificity and error values of the proposed model in detecting leukemia. These images were first identified by the proposed method, when simulated in MATLAB.
Fig. 6 shows the comparison of results attained from existing methods against the proposed method in the identification of white blood cell cancer i.e., Leukemia. This comparison clearly establishes that the proposed system is significant compared to existing techniques such as ANN, SVM and PCA. The values achieved by the proposed method in terms of sensitivity, specificity, accuracy and error rate were 97.8%, 89.9%, 76.6% and 2.2% respectively. Fig. 7 shows the comparison of performance attained by the proposed system i.e., EVNN method and existing methods such as ANN, SVM and PCA in terms of error rate.
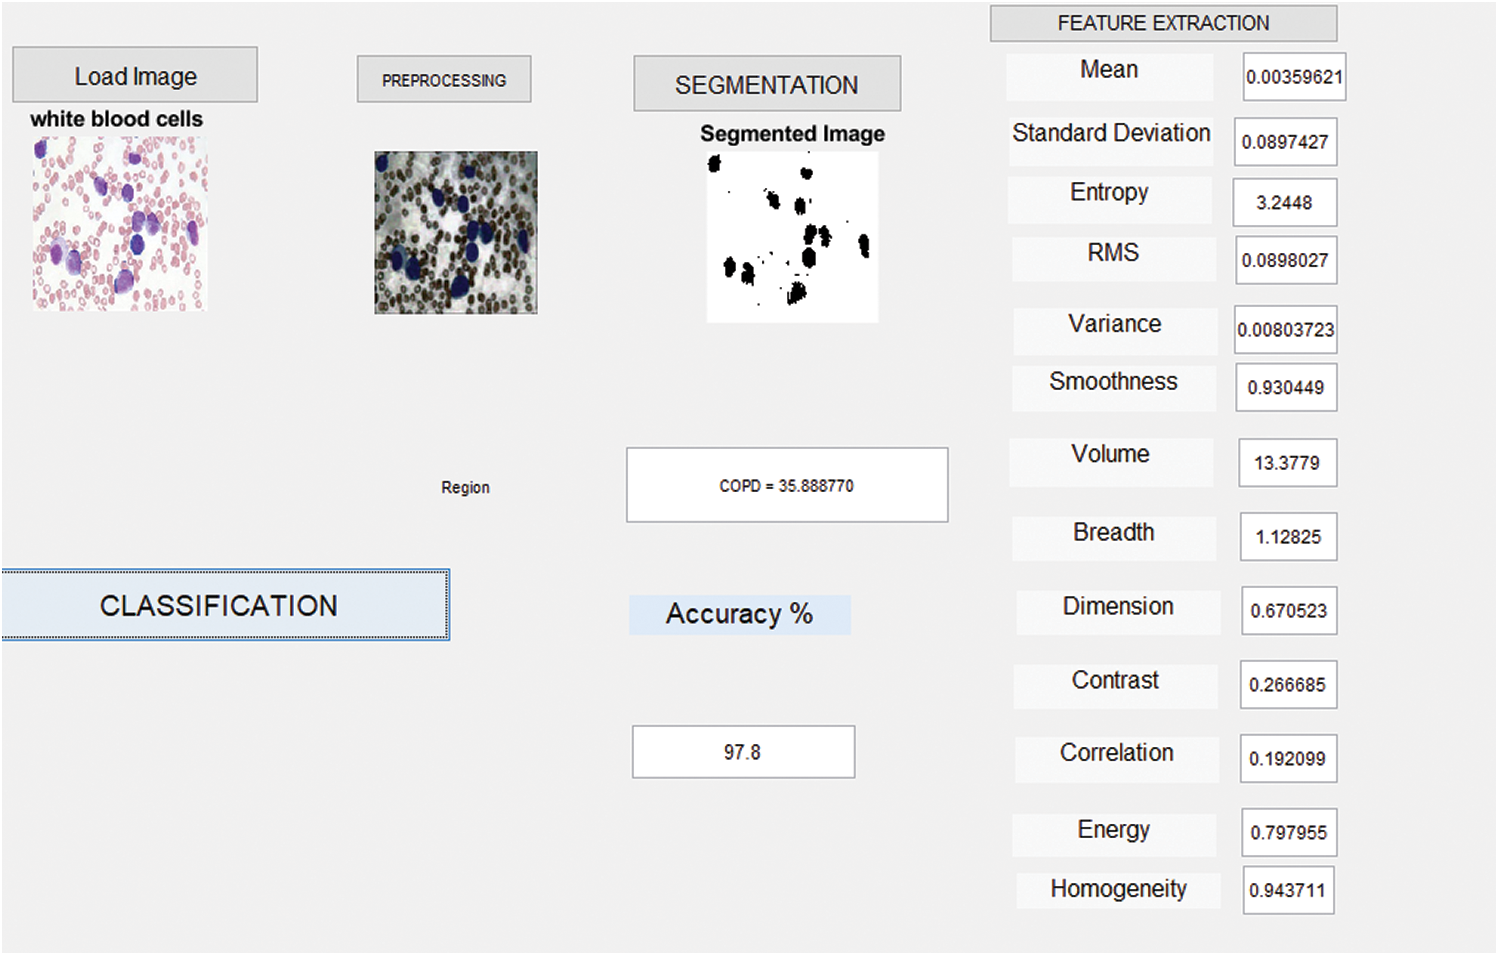
Figure 5: Detection results of WBC chronic lymphocytic leukemia
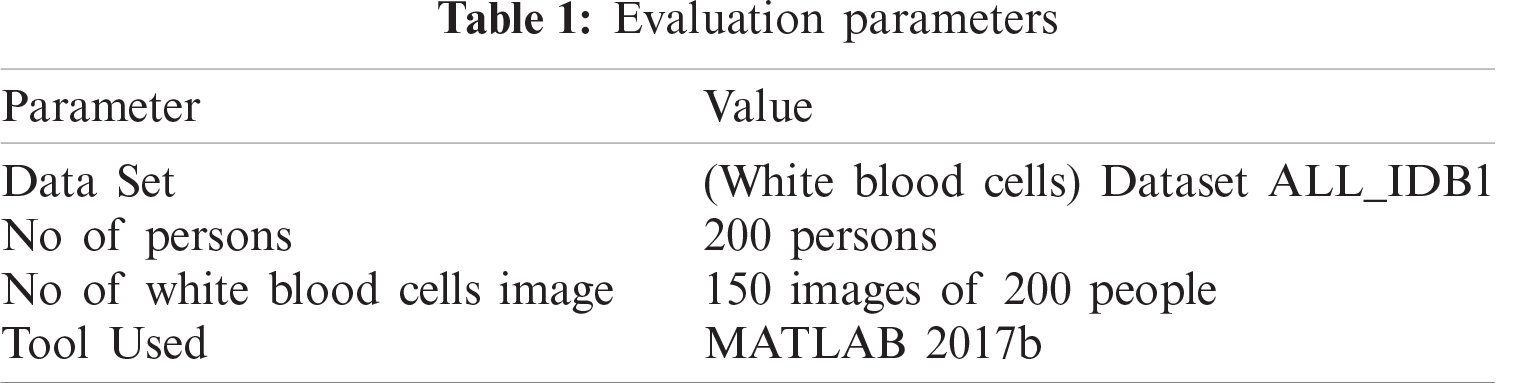
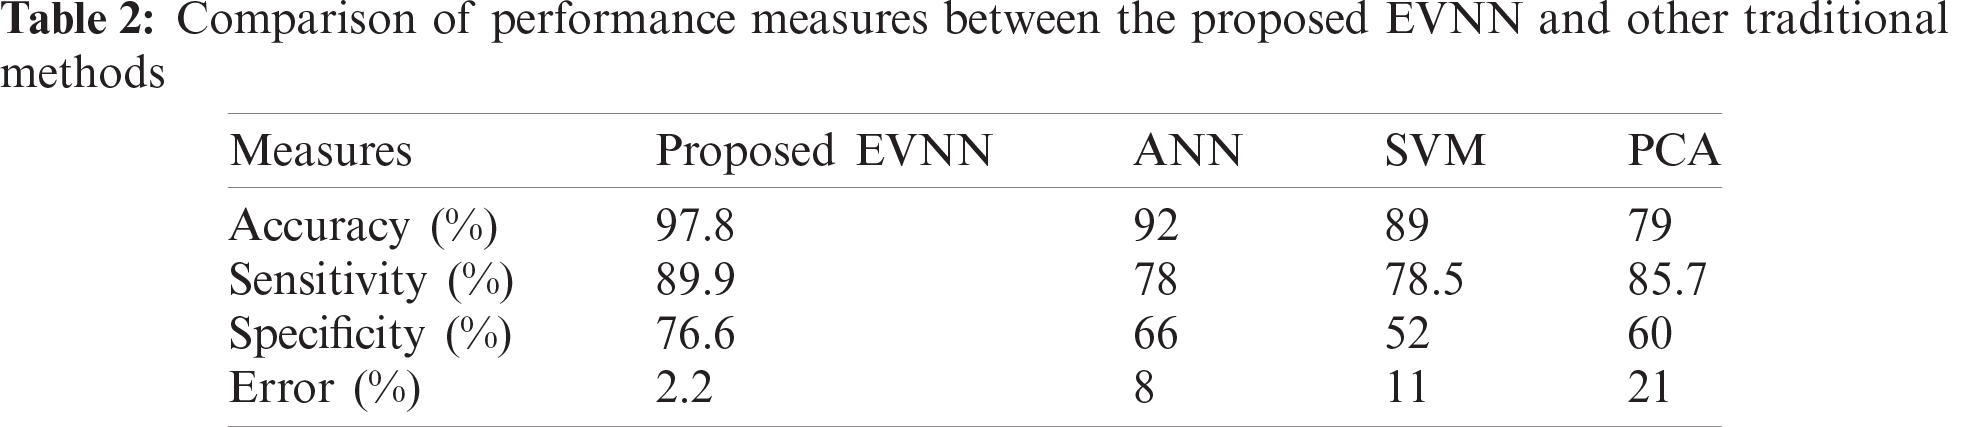
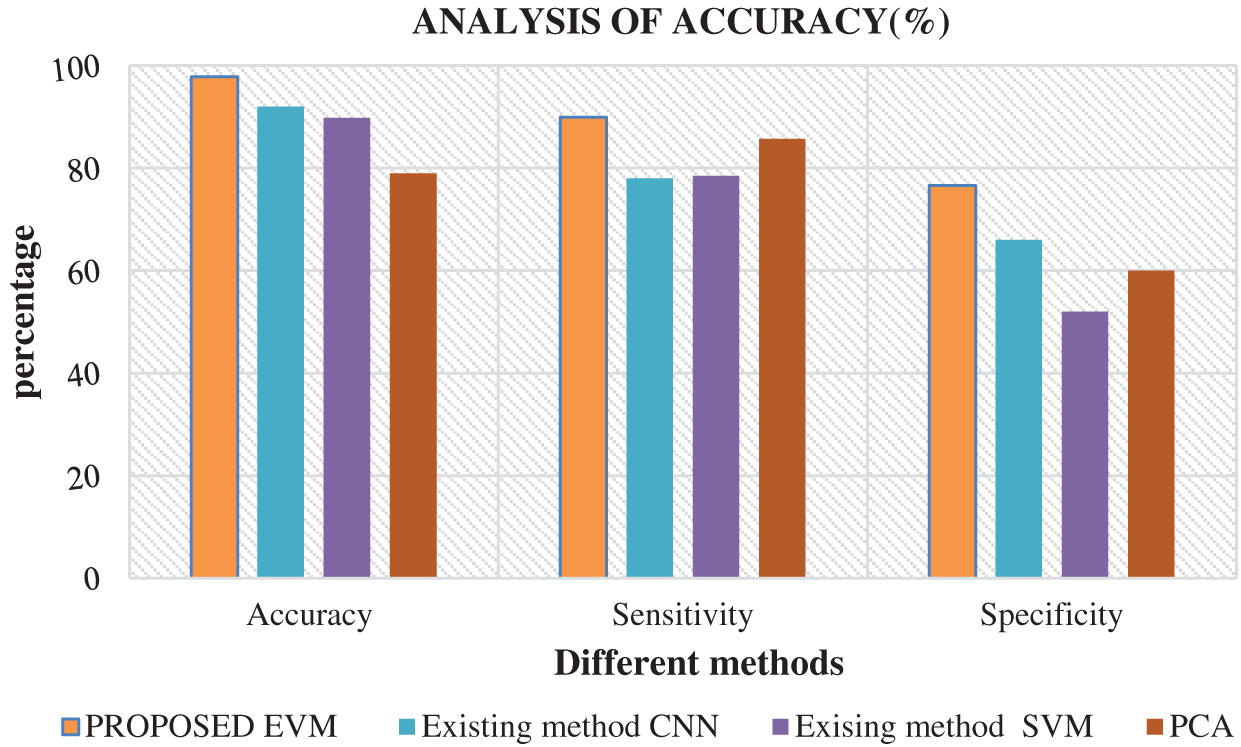
Figure 6: Analysis of accuracy in EVNN method
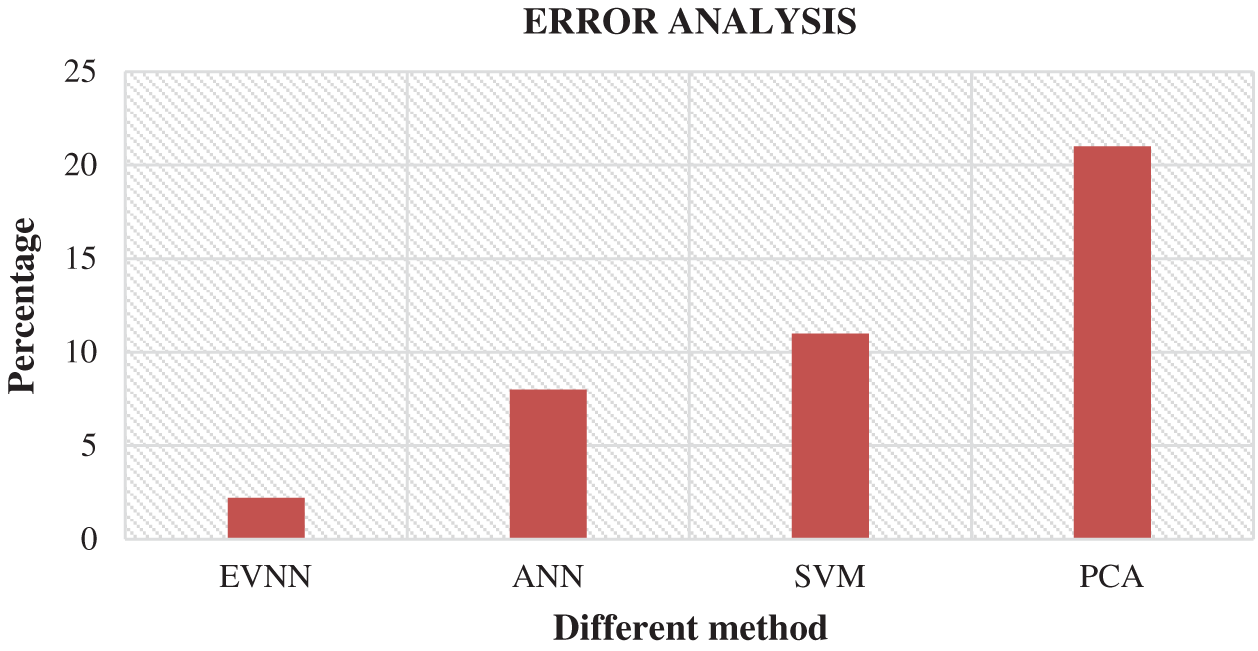
Figure 7: Error analysis for EVNM method
The current research work introduced Enhanced Virtual Neural Network method to diagnose White Blood Cell cancer i.e., leukemia and classify the disease based on medical images. This method is significant in detecting leukemia using WBC images based on following features; non-invasive sampling procedure, non-biased results due to difference in nationality, complete utilization of WBCs, usage of different parameters and multi-parameter clustering techniques. The proposed method yielded excellent results within the best possible time. Further, Enhanced Virtual Neural Network classifiers were used in this research to recognize different types of WBCs. The proposed model was found to be efficient in classification and was able to predict the disease earlier through images. The probabilities of disease detection and development were also highly optimistic. The classification method achieved 97.8% accuracy in comparison with other methods. Future researchers can expand the research work using different images from other standard datasets and use different scenarios.
Funding Statement: The authors received no specific funding for this study.
Conflicts of Interest: The authors declare that they have no conflicts of interest to report regarding the present study.
 | This work is licensed under a Creative Commons Attribution 4.0 International License, which permits unrestricted use, distribution, and reproduction in any medium, provided the original work is properly cited. |