DOI:10.32604/cmc.2022.021582
| Computers, Materials & Continua DOI:10.32604/cmc.2022.021582 | |
| Article |
Prediction of Cardiovascular Disease Using Machine Learning Technique—A Modern Approach
1Department of Computer Science & Engineering, Panimalar Engineering College, Anna University, Chennai, 600123, India
2Department of Basic Science, College of Science & Theoretical Studies, Saudi Electronic University, Riyadh-Male Campus 13316, Saudi Arabia
3Department of Computer Science & IT, JAIN (Deemed to be University), Bangalore, 560069, India
4Department of Computer Science and Information Engineering, National Cheng Kung University, Tainan 701, Taiwan
5Department of Mathematics, Graphic Era Hill University, Dehradun, 248002, India
6Department of Mathematics, J. C. Bose University of Science & Technology, YMCA, Faridabad, 121006, India
*Corresponding Author: Ramu Dubey. Email: rdubeyjiya@gmail.com
Received: 07 July 2021; Accepted: 23 August 2021
Abstract: Cardio Vascular disease (CVD), involving the heart and blood vessels is one of the most leading causes of death throughout the world. There are several risk factors for causing heart diseases like sedentary lifestyle, unhealthy diet, obesity, diabetes, hypertension, smoking and consumption of alcohol, stress, hereditary factory etc. Predicting cardiovascular disease and improving and treating the risk factors at an early stage are of paramount importance to save the precious life of a human being. At present, the highly stressful life with bad lifestyle activities causes heart disease at a very young age. The main aim of this research is to predict the premature heart disease based on machine learning algorithms. This paper deals with a novel approach using the machine learning algorithm for predicting the cardiovascular disease at the premature stage itself. Support Vector Machine (SVM) is used for segregating the CVD patients based on their symptoms and medical observation. The experimentation results by using the proposed method will facilitate the medical practitioners to provide suitable treatment for the patients on time. A sophisticated model has been developed with the current approach to examine the various stages of CVD and the performance metrics used have given effective and fruitful results as compared to other machine learning techniques.
Keywords: Machine learning; support vector machine; classification; cardiovascular disease
Based on the estimated facts, World Health Organization (WHO) had claimed that about 17.9 million men and women died from Cardio Vascular Disease (CVD) in year 2016, which is nearly 31% of the deaths worldwide [1]. Globally, CVD is the major cause of death in men and women who die annually from CVD [2]. It is also reported that one third of the deaths for people aged below 70 years occur by stroke and heart attacks [3]. Though there are leaping advances in medical field, it is still challenging to predict the heart disease in an earlier stage. Antenatal practices help in identifying the risk factors and modern technology is used to overcome the risk [4]. Still, the morbidity rate is very high due to the unpredicted and unexpected reasons. Currently, there are no proven and concrete interventions that reduce the risk of cardiovascular disease [5,6].
In cardiovascular disease, the data provided to the medical field is vast, multi-dimensional and critical, which makes it challenging and cumbersome to understand such extensive data. It is quite difficult to predict whether the patient has heart disease symptoms or not based on the patient's records [7,8]. Some of the typical symptoms for patients having CVD are chest pain, shortness of breath, radiating pain in the arms, left shoulders and elbows, discomfort while walking, high blood pressure, dizziness, nausea, fatigue, etc. while the risk factors causing CVD are cholesterol, hypertension, genetic or heredity, obesity, diabetes, dietary habits, aging, [9–11], etc. Life Style modifications with regular cardio friendly exercises followed by a heart-healthy diet, quitting smoking and alcohol intake, usage of tobacco, salt, sugar and fat intake can prevent CVD. Based on the analysis of worldwide data on CVD patients, it is noted that CVD affects even young men and women and therefore, requires prediction and prevention at the incipient stage itself.
The key objective of this research is to predict cardiovascular disease at an earlier stage. To envisage the detection of CVD at the incipient stage and intervene appropriately, Support Vector Machine (SVM) is used for classifying the patients depending on their symptoms and risk factors. By using these machine learning algorithms, it becomes easy to understand the nature and type of heart disease in all aspects.
The important aspect of this method is to train the machine to analyze a massive set of data with the known inputs and outputs, i.e., Supervised machine learning is applied [12]. The main objective of the work is to improve the accuracy of prediction of cardiovascular disease [13,14], which can help for preventive treatments and reduce the cases having CVD.
The rest of the paper deals with various sections viz.., the related works are discussed in Section 2, while in Section 3, the various stages of CVD are elaborated and the techniques involved for the prediction of cardiovascular disease are explained thoroughly. Section 4 highlights the Experimental results, Comparison of results using multiple techniques, Summarization of the methods and percentage of CVD based on the collected datasets. Finally, in Section 5, the conclusion of research and the thrust for more related research work is highlighted.
The clinical study was designed as a controlled clinical study, open-label [15]. To estimate the event-free rate, Kaplan-Meier has been used [16,17]. The logistic regression (LR) model reveals that a Coronary Artery Calcium (CAC) score of >=100 rather than a Cardio Ankle Vascular Index (CAVI) of >=9 had a higher predictive value for all cardiovascular events [18]. The absolute risk was calculated using charts and adjusted according to these notes. More than 20% chances of developing a cardiovascular event due to the prevalence of WHO/ISH of high CVD risk [19]. From the Receiver Operating Characteristic (ROC), a cross-sectional study was conducted. The risk of carotid arteriosclerosis was positively associated with CAVI [20].
The study includes neural networks, support vector machine, Decision Tree models, ID3 algorithm, and association rules [21]. To analyze the application of data mining algorithms, a study has been done [22]. Principal Component Analysis (PCA) is a method in which the large data set is reduced by PCA, wherein the original data is transformed into new dimensions. The bivariate model was used to find the relationship between two variables. In the future, the research can be extended by using different techniques like an outlier and link analysis used to associate rule mining on a large number of patients. Usage of various techniques and association of rule mining has been referred for many patients [23,24]. The methods used here are classification methods such as DT and SVM. The results present a better accuracy of 99.42% by using the decision tree, whereas the support vector machine gives an accuracy of 89% [25].
The KNN algorithm is based on the similarity measure and the distance has been evaluated [26]. To develop predictive models, machine learning techniques like SVM, DT and ANN are used. The main aim is to compare the three algorithms using the performance measure algorithms like sensitivity, accuracy, and specificity [27]. Nephritis of renal pelvis origin is a disease that affects the urinary system [28]. The machine learning algorithms used here are SVM, Naive Bayes, Logistic regression, J48, and one R. The highest accuracy is still unable to exceed the accuracy of 80% with the best performing algorithm [29]. The techniques used here are machine learning, such as logistic regression and classification trees [30].
Using ANN, the multi-layer feed-forward neural network with Levenberg-Marquardt learning algorithm was used on CVD and diabetes mellitus patients [31,32]. The proposed system's primary method was a neural network ensemble method.89.01% of classification accuracy has been taken from the Cleveland Heart Disease database [33]. Iris image was cropped from the region of interest, and the discrete wavelength transformation feature, statistical, texture is extracted from the area of interest [34].
In the proposed system, the main aim is to investigate the CAD system for breast cancer. The database used here was the Springer link (SL), inclusion and exclusion criteria [35]. Data mining methods, like feature extraction and selection, have been used. K means and SVM has been used for diagnosing tumors and extracting useful information [36]. Based on the classification technique, machine learning had been approached. For solving the classification of problems, the Genetically Optimized Neural Network (GONN) algorithm had been used [37]. In the proposed system, by using the data, the prediction of chronic disease has been done by using machine learning algorithms. MLT like KNN, SVM, decision tree and logistic regression has been used [38]. In the proposed research, the pre-processing techniques like removal of missing data, deletion of noisy data, if applicable, will fill the default values. The performance has been measured using methods like classification, sensitivity, accuracy and specificity analysis [39–41]. Advanced data mining techniques has been used to discover the relationship and hidden pattern. The dataset used here was the Iranian Center for Breast Cancer (ICBC) [42–44].
In the past several years, Cardio vascular disease (CVD) is one of the main contributing factors that cause innumerable fatalities worldwide. The medical condition that affects the heart and blood vessels is called CVD. Risk assessment and risk predictions have become essential in preventing CVD. Even though risk prediction tools are recommended, they are not adequately implemented in clinical practice. If the CVD patient is not properly assessed and intervened on time, there is every chance of resulting in fatality. To reduce the mortality rate and improve the heart health conditions, a new method is proposed. This proposed method analyzes the parameters (hypertension, diabetes, obesity, blood pressure, heredity), and also the typical and atypical symptoms associated with the heart patients. To identify and classify the stages of CVD affected patients, new classification methods are designed. The proposed classification methods have high accuracy in predicting CVD patients. It also has a fast-training process and therefore easy to indicate whether the patients are affected by CVD or not.
The various stages of CVD are shown in Fig. 1 constituting various stages as
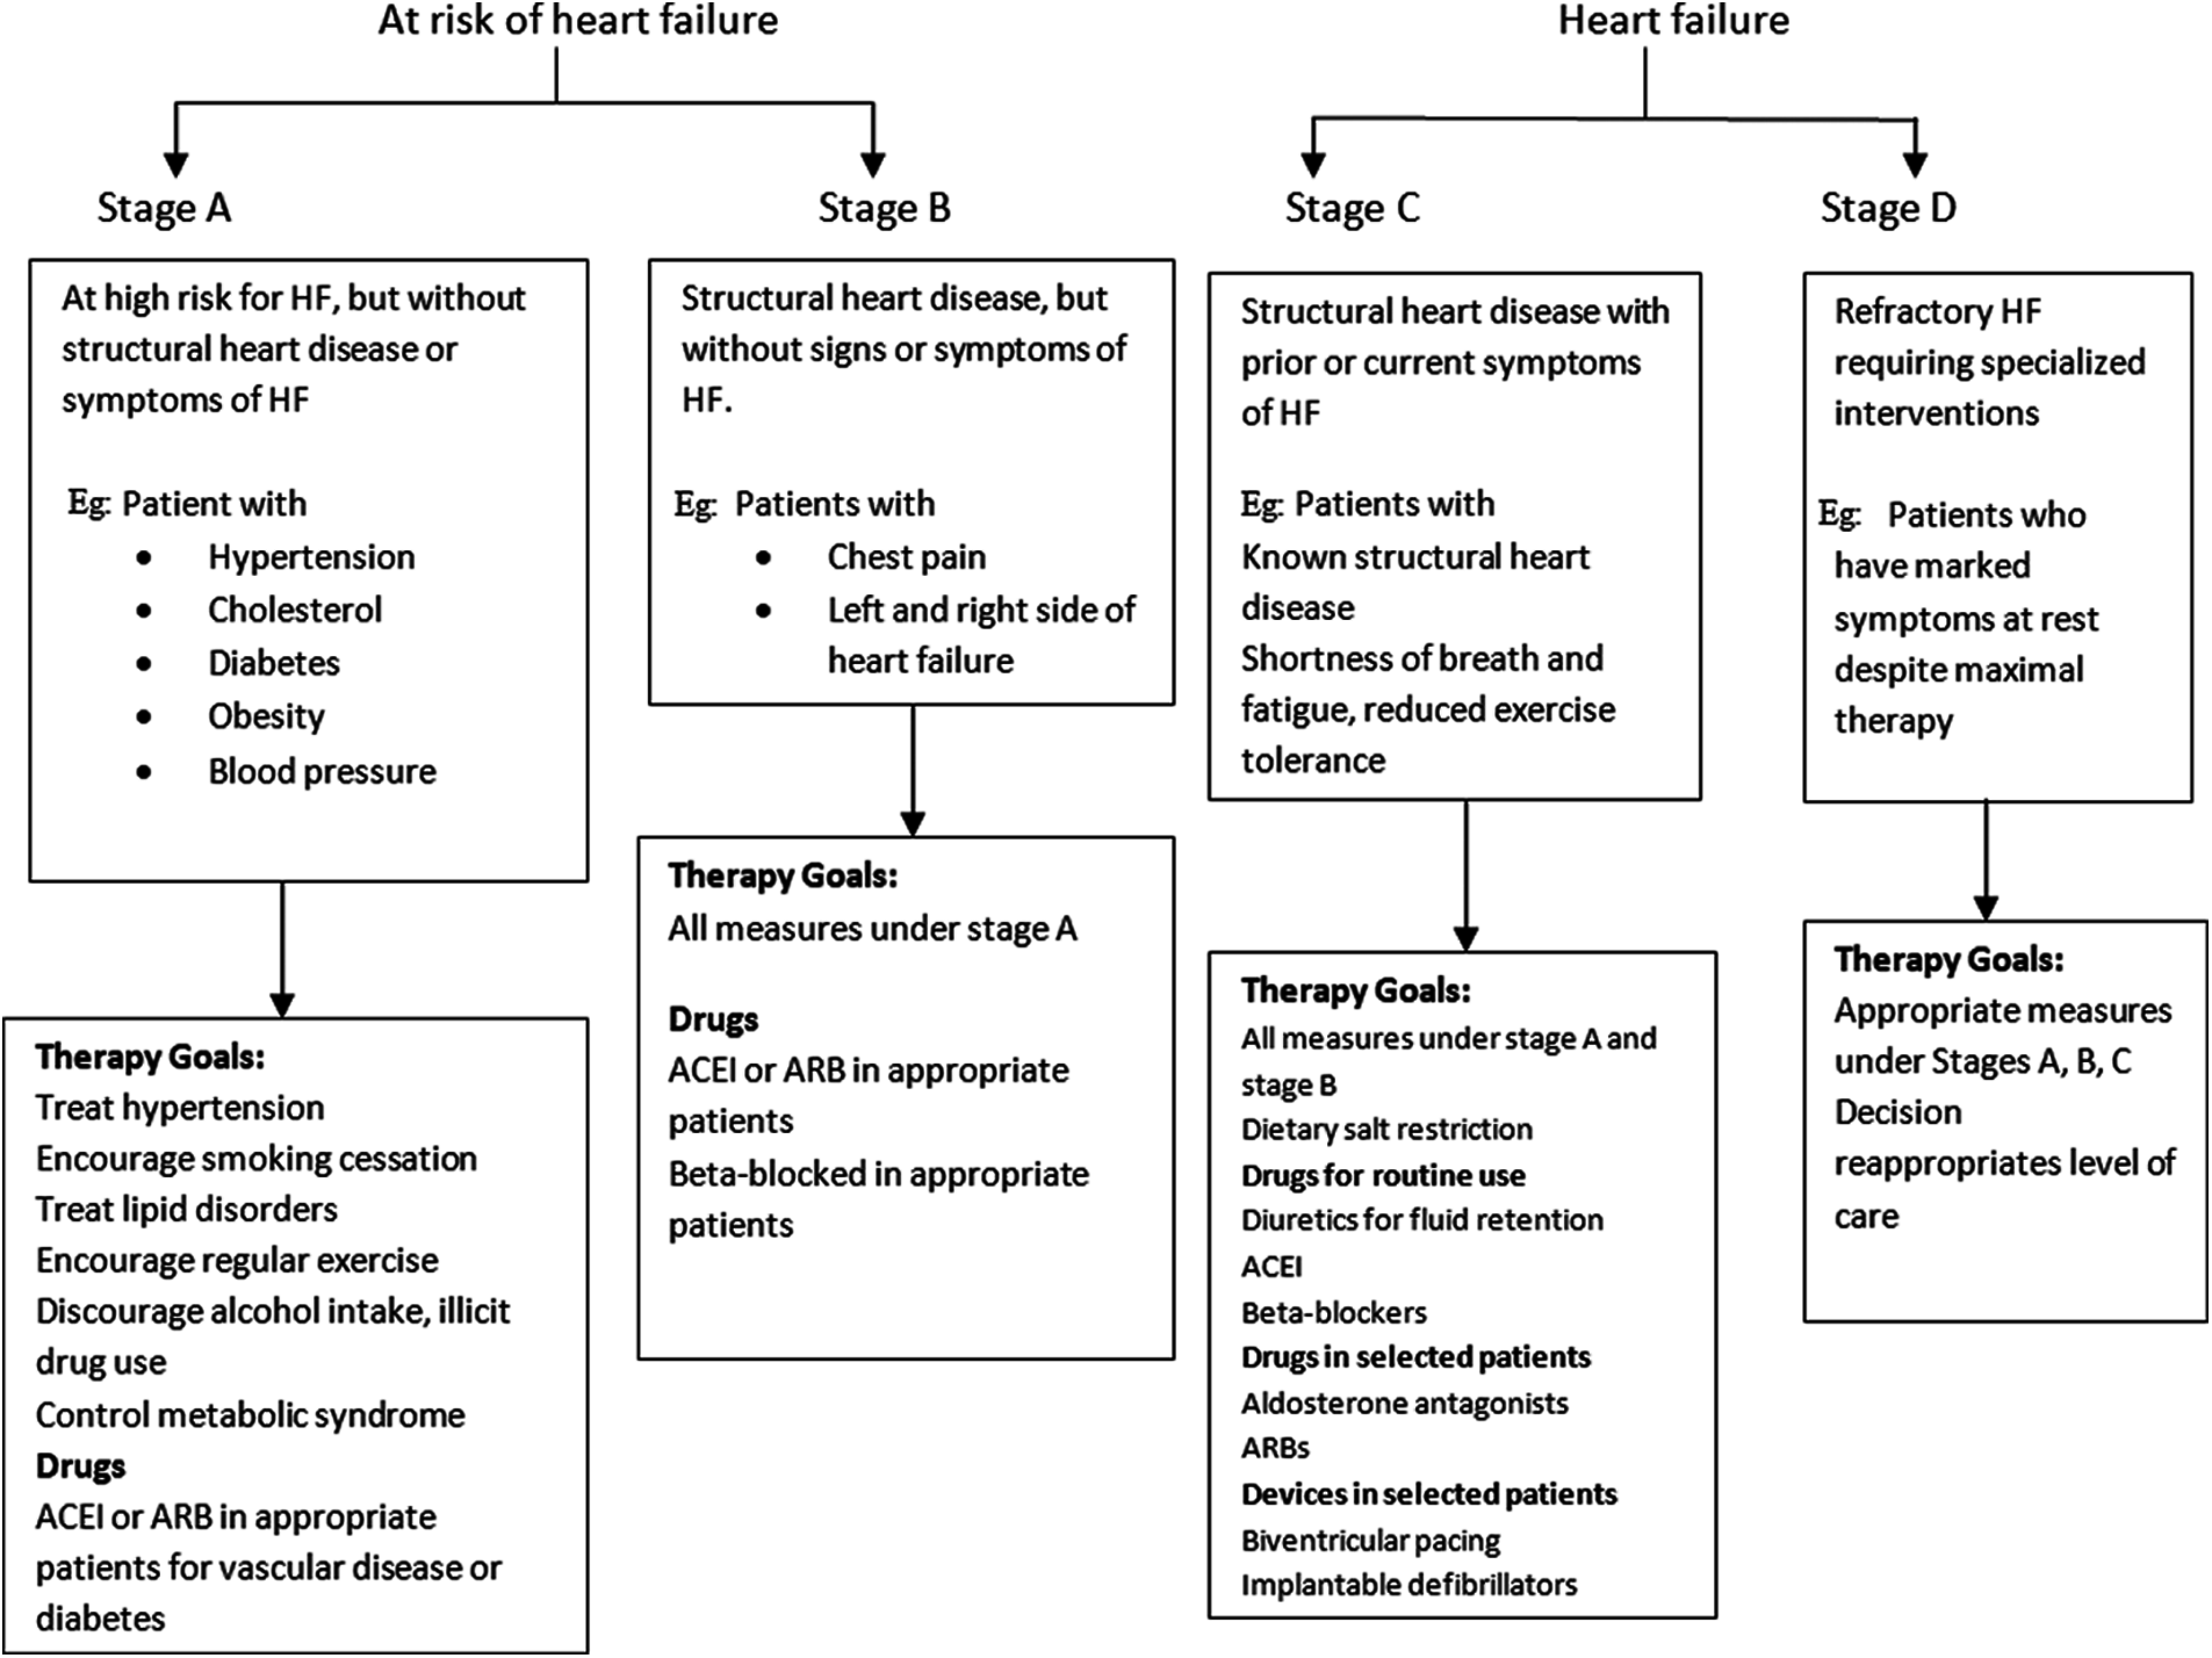
Figure 1: Stages of CVD
3.1 STAGE A: No Heart Disease and No Symptoms (High Risk)
Stage A is considered to be at high risk for heart failure but without structural heart disease or heart failure symptoms. The patient with symptoms of hypertension, cholesterol, diabetes, obesity, and blood pressure should have a standing goal therapy to self-care, carry out regular exercise and control metabolic syndrome and avoid alcohol intake. Drugs used for Stage A are ACEI or ARB in appropriate patients for vascular disease.
3.2 Stage B: Structural Heart Disease Without Symptoms
Stage B is considered to be a structural disease without symptoms, and there is also a risk of heart failure. The symptoms of Stage B are patients having chest pain and left and right-side heart failure. The goal therapy for Stage B is same as that of Stage A. The drugs used for Stage B is ACEI or ARB as well as beta-blockers for in appropriate patients.
3.3 Stage C: Structural Heart Disease with Symptoms
Stage C includes the problem of forming a structural heart disease with typical symptoms. There will be difficulty in breathing while doing exercises. Diuretics for fluid retention, ACEI and beta-blockers are the drugs used for daily routine.
Stage D is a refractory heart failure requiring specialized interventions for those patients having marked symptoms at rest despite maximal therapy. The goal therapy is the appropriate measures given for Stages A, B, C.
SVM is a supervised machine learning algorithm, which is mainly used to classify the symptoms and common risk factors. Linearly separable data is used for data classification. The kernel function is used for nonlinear data. By using a “hyperplane,” the variation between two data can be detected. To separate the given data into two classes, the hyperplane should have the largest margin in a large-dimensional space. The margin between the two categories is represented in the longest distance between the classes closest to data points, as shown in Fig. 2.
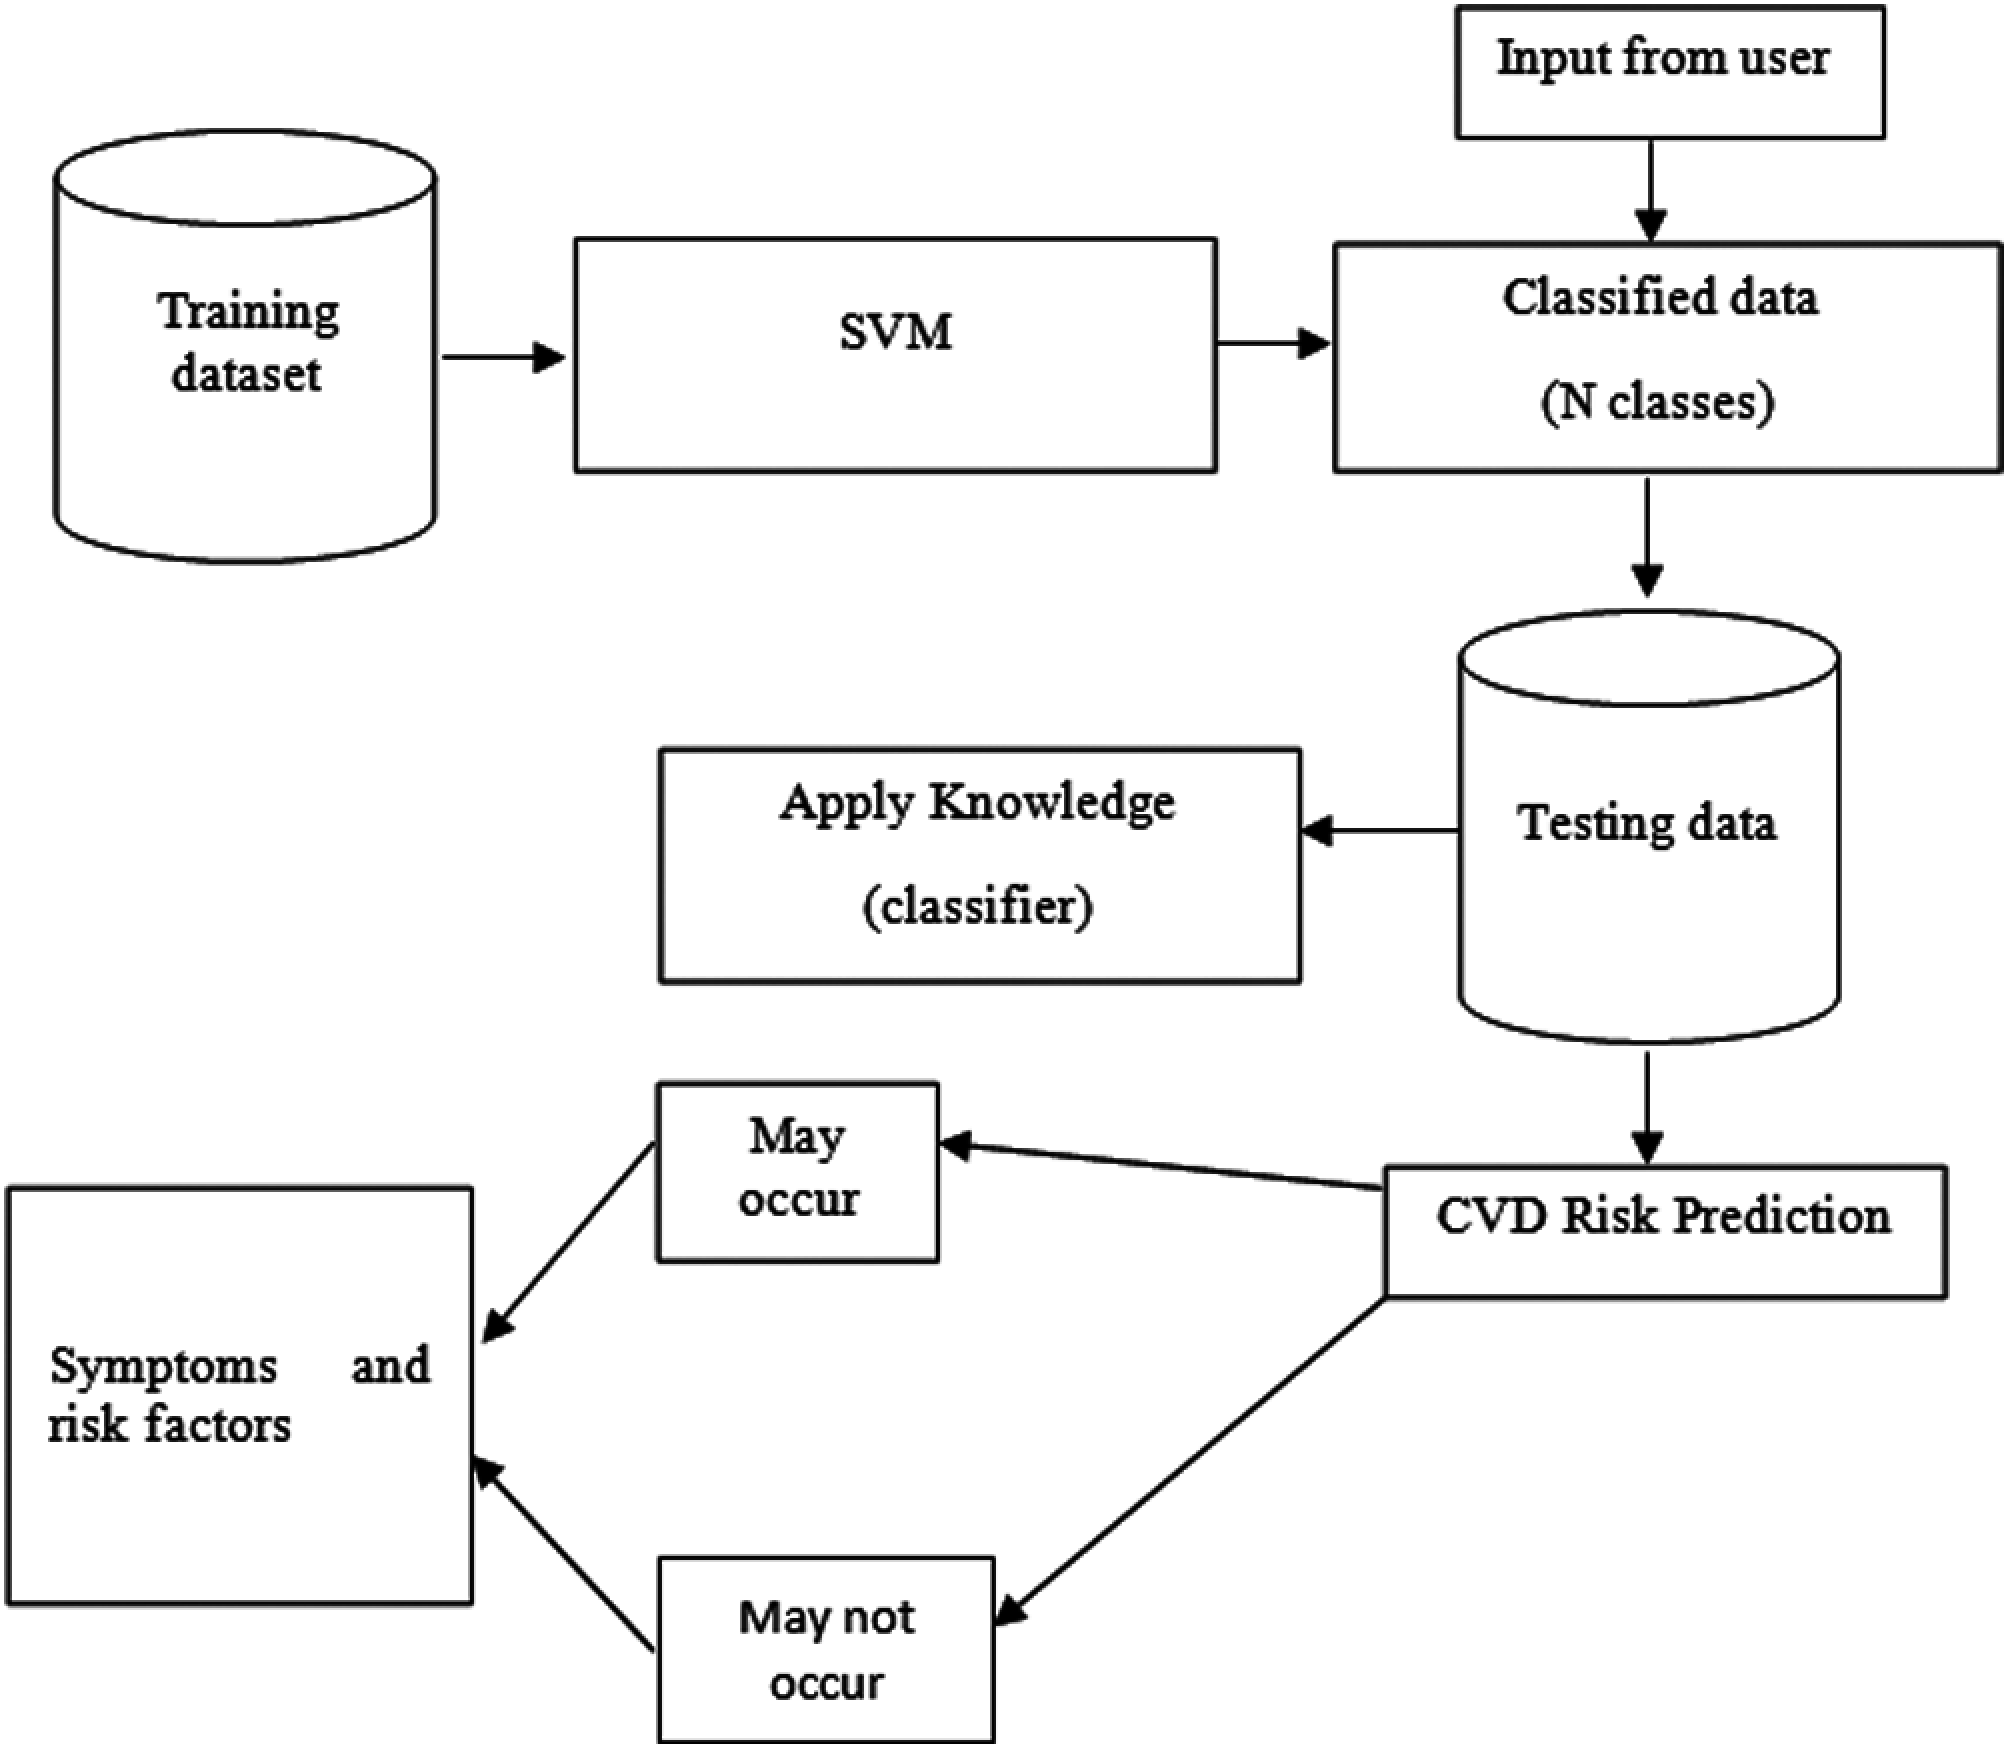
Figure 2: Predicting CVD using SVM
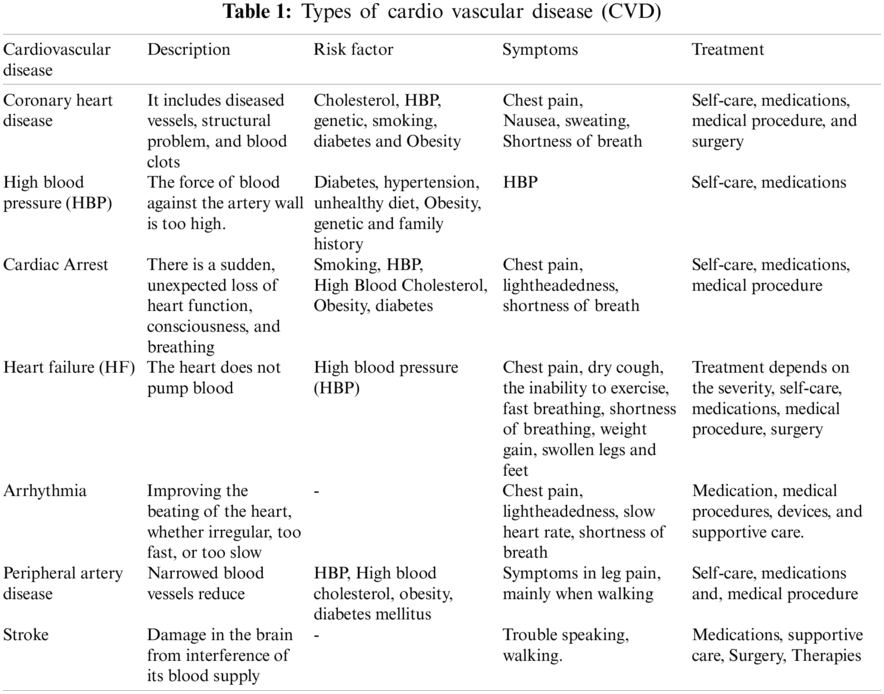
Various types of heart disease are shown in Tab. 1.
To find the optimal hyperplane, the separation of the symptoms of CVD has been done by using the vectors with one category as a target variable (risk factor) on one side of the plane with another class on the other side of the plane. Support vector is the vector near the hyperplane. In Fig 3, The SVM performs classification, regression and outline detection. The classification of linear SVM is done by drawing a straight line between the two classes. Consider a symptom or risk factor for the classification with T training data
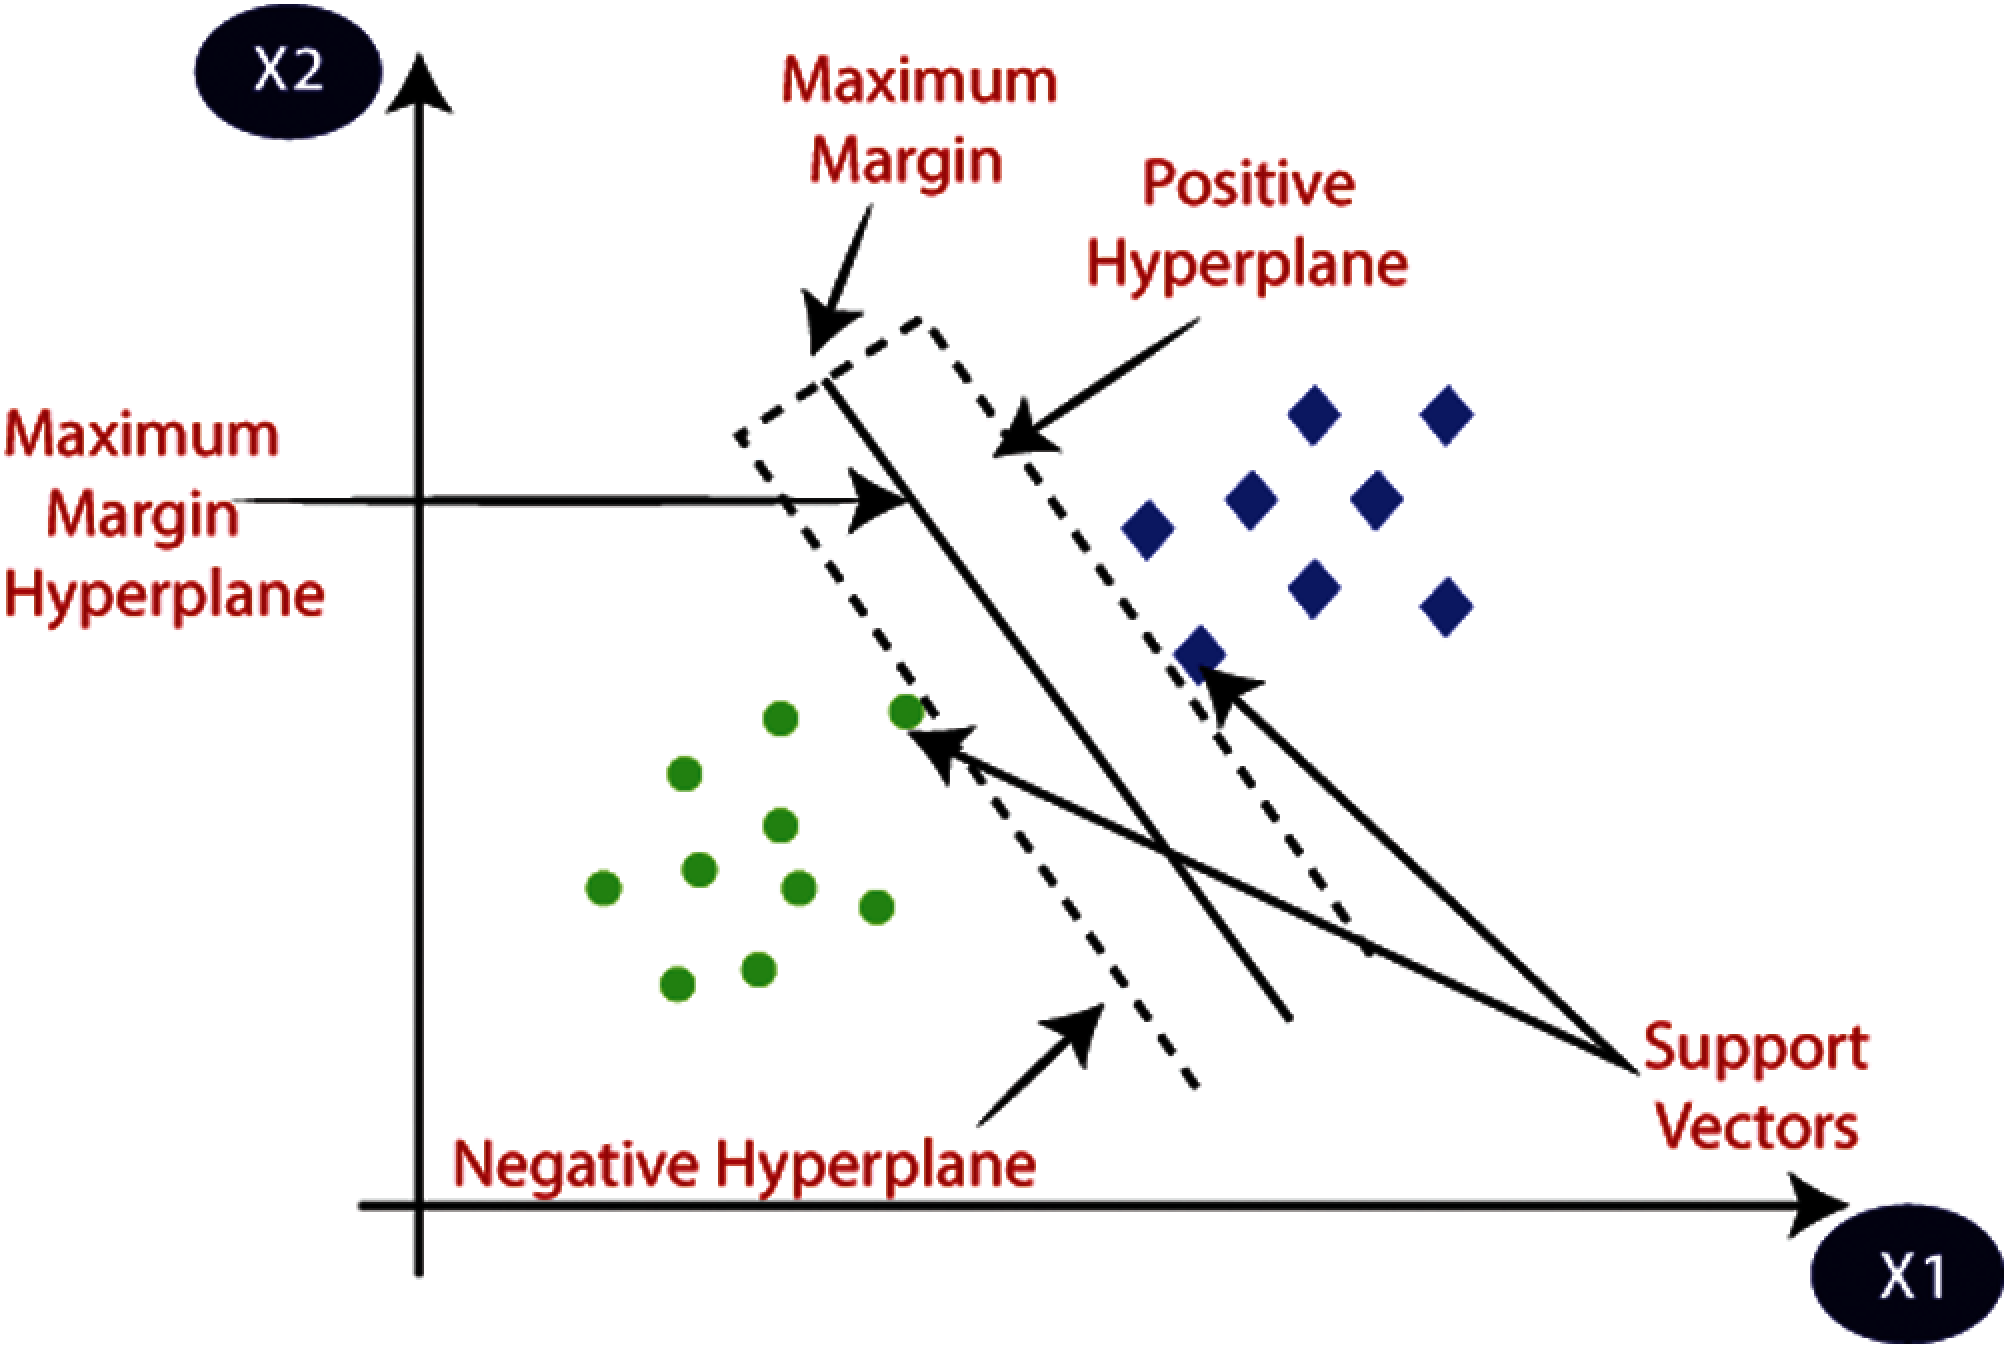
Figure 3: Structure of SVM
The symptoms or risk factor (training data) in the form:
The hyperplane has been described as
where w is the hyperplane and perpendicular distance from the hyperplane to the origin is
Solving the optimization problem is equal to finding the optimal hyperplane
The problem is in the quadratic form. For constraints minimization, longing to allocate Lagrange multipliers β and conclude that in the dual form:
By evaluating Eq. (4), Lagrange multipliers α is found out, and the optimal hyperplane is given below:
where xr and xs are any support vectors from each class satisfying:
By use of optimization quadratic Algorithms 1 the optimization problem has been solved.
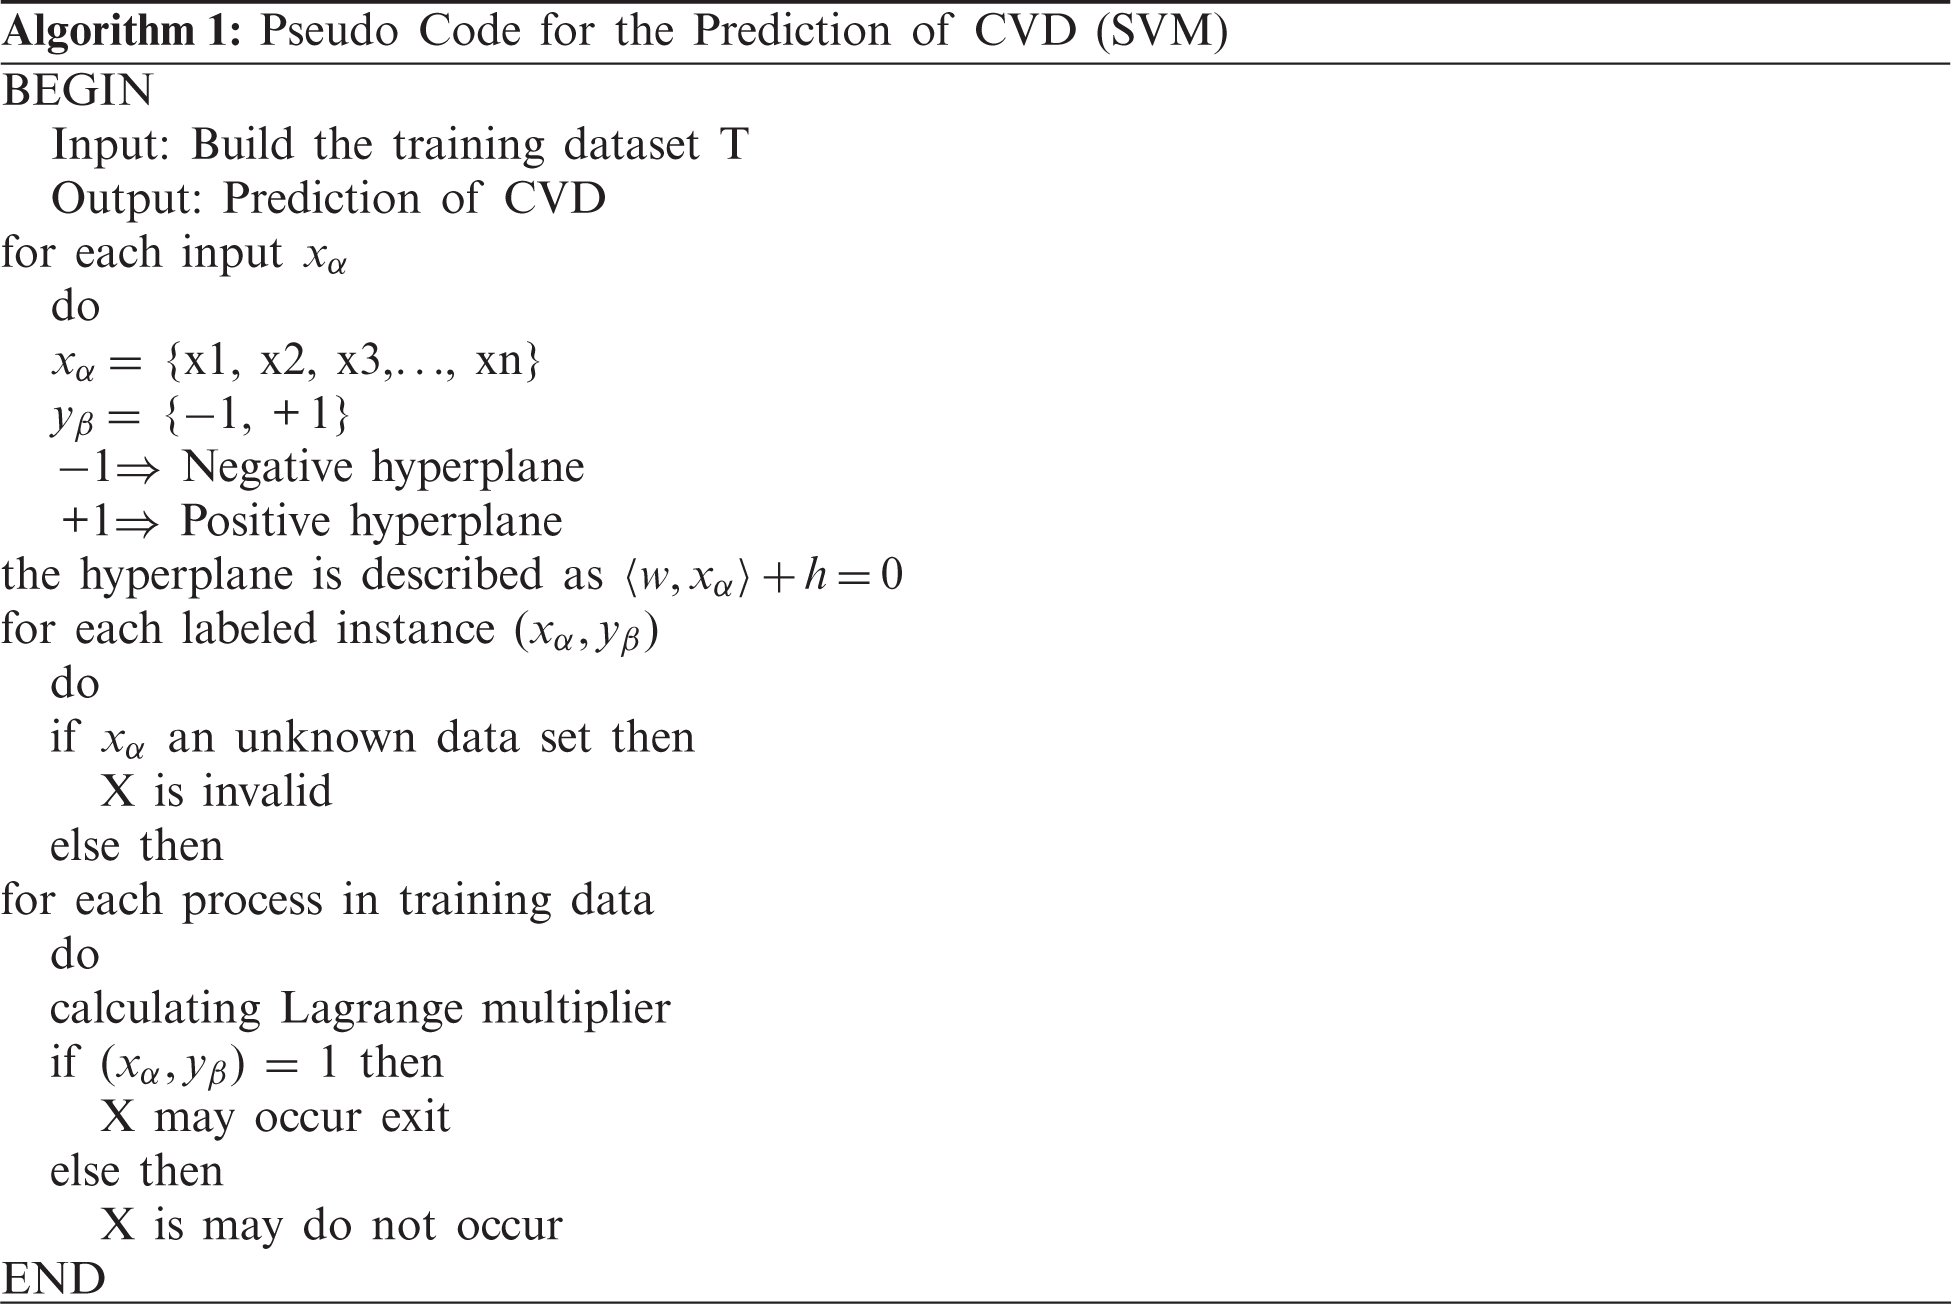
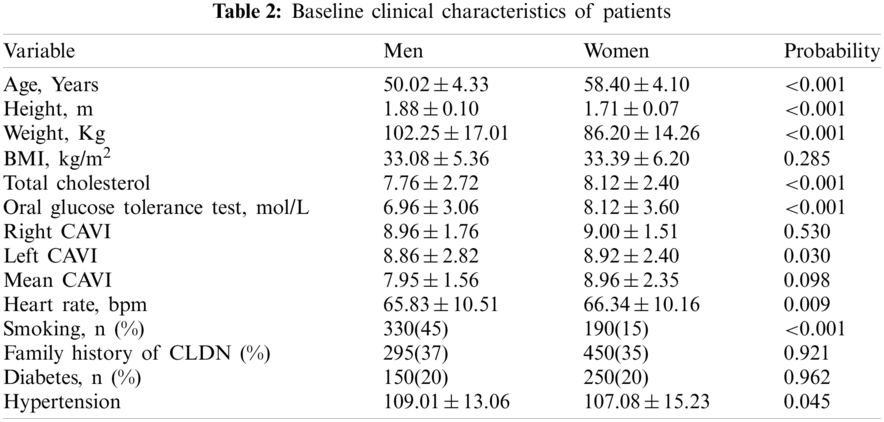
In this, SVM classification algorithm are used to analyze the health data for cardiovascular disease. For each attribute in SVM, the optimal hyperplane has been predicted. The performance metrics such as Accuracy, Specificity and Sensitivity were used to prove the efficacy of this modern approach. Tab. 2 gives the baseline clinical characteristics of patients.
Confusion matrix is defined to showcase the performance of an algorithm through visualization or to describe the performance of a classification model on a set of test data for which the true values are known. A confusion matrix is also called an error matrix shown in Fig. 4 that depicts the time taken for the completion of the training dataset. After the construction of confusion matrix, the sensitivity, specificity, and accuracy are calculated as,
where, TP-True positive; FP-False positive; TN-True negative; FN-False-negative.
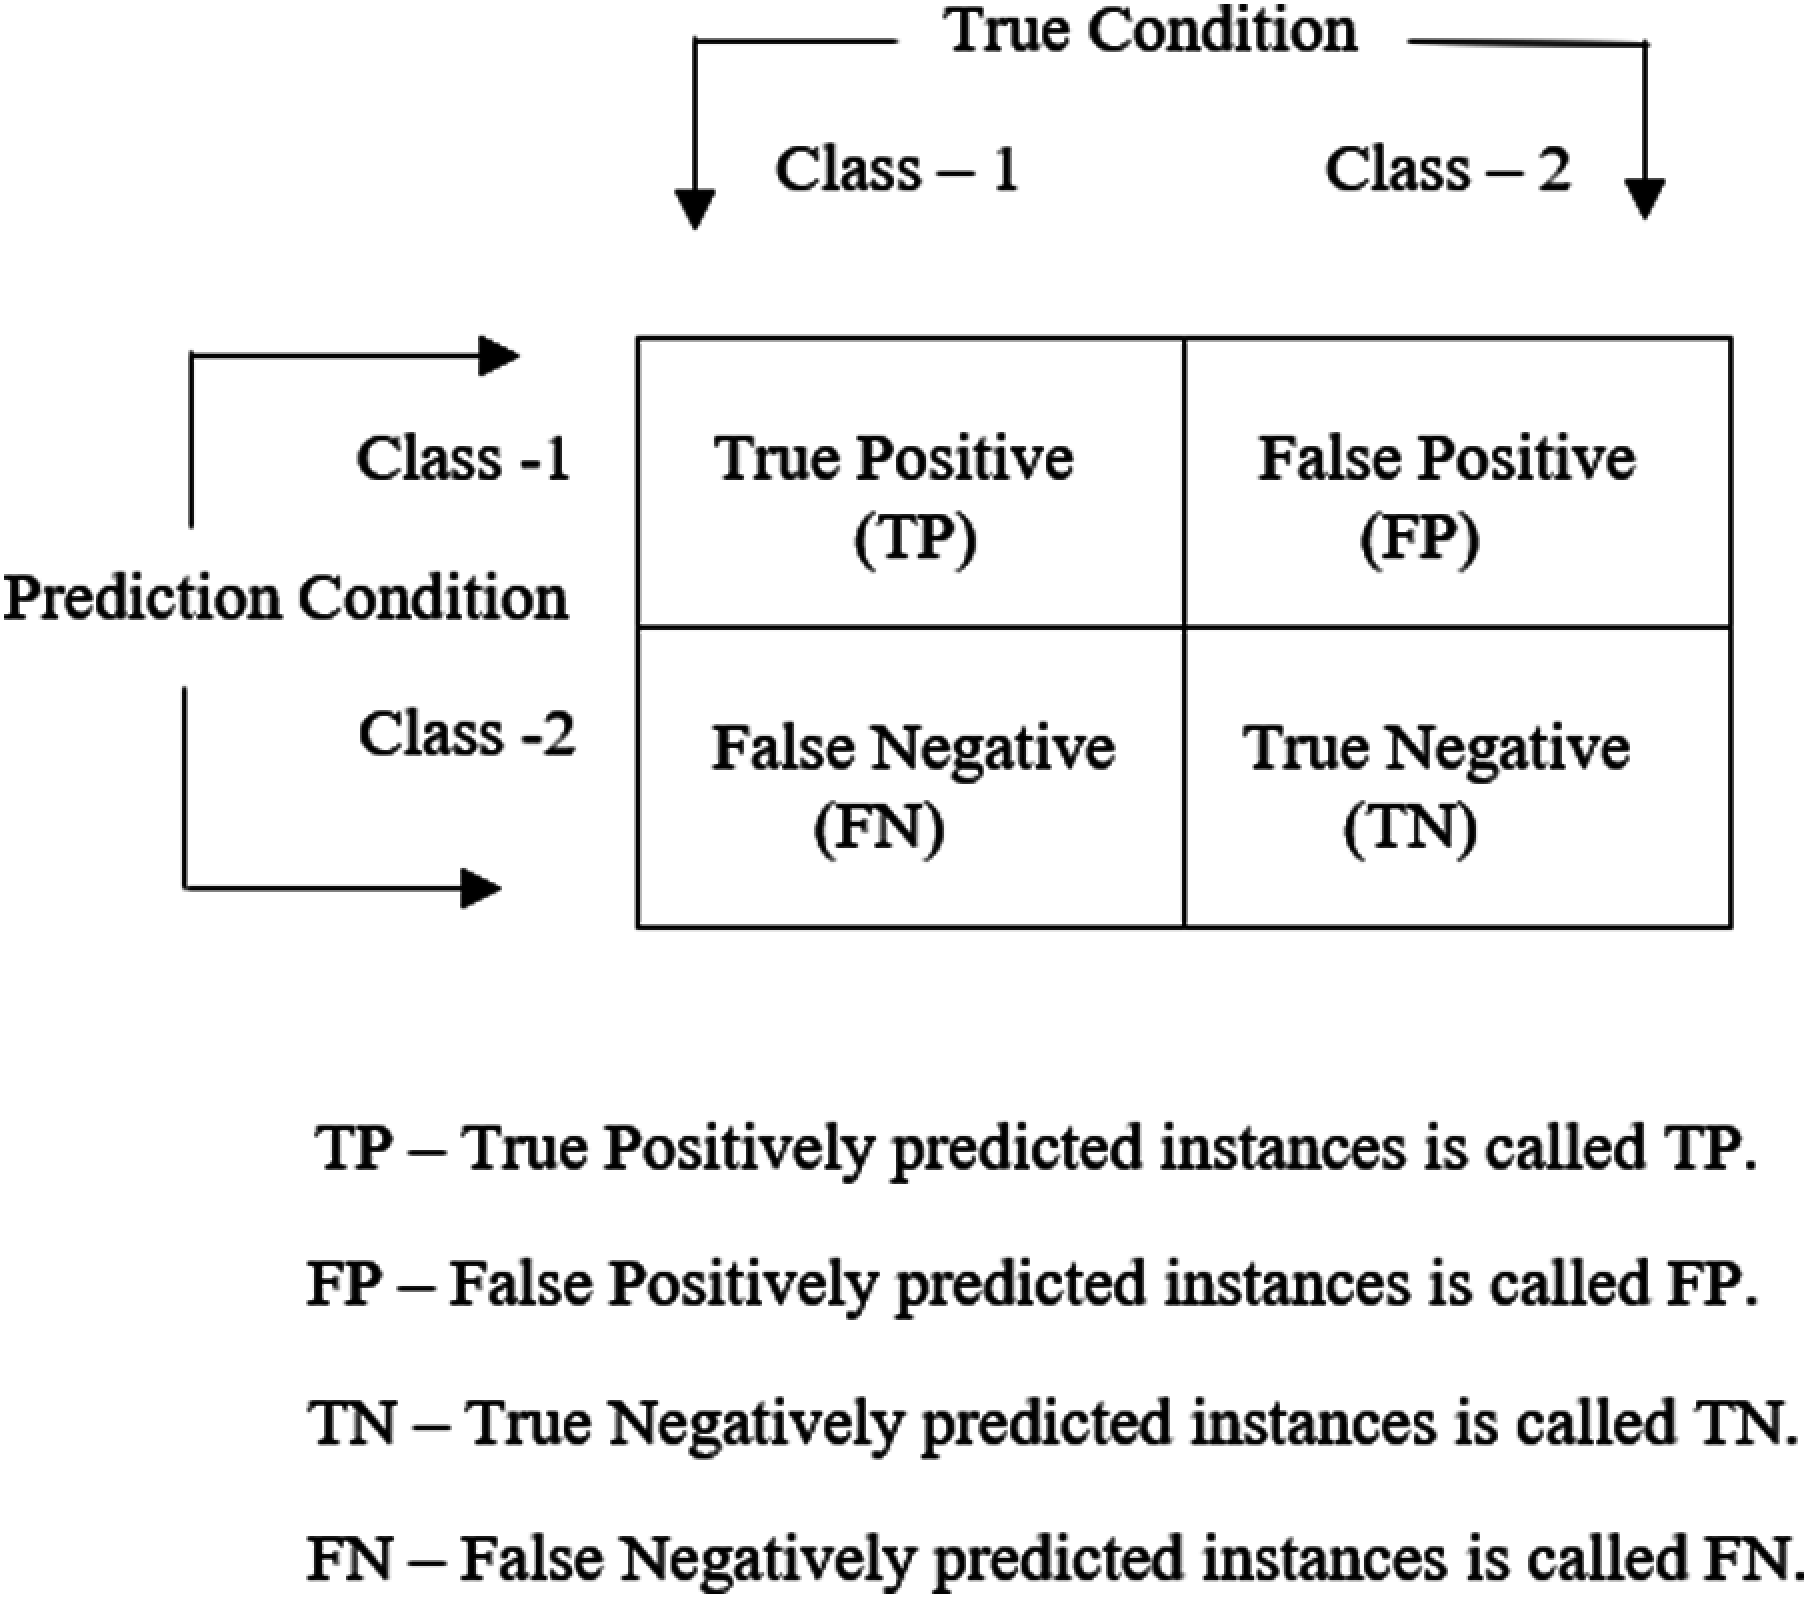
Figure 4: Confusion Matrix
Kappa Statistics is the measure of how closely the instances have been classified. The kappa coefficient is represented as follows
where k is kappa value, p0 denotes the probability of observed agreement and pe denotes the probability of hypothetical agreement. With the help of confusion matrix, p0 and pe is computed followed by pclass1 and pclass2.
p0=pclass1 + pclass2,
where pclass1 and pclass2 is computed as follows
The average difference between predicted and actual value in all test cases called average prediction error which otherwise refers to the mean of the absolute values of each prediction error on all instances of the given test data set.
Standard deviation measures the spread of the data about the mean value.
The median is the middle number sorted in ascending, or descending list of numbers and can be more descriptive data set than the average.
Tab. 3 shows by using validation data set, the detailed prediction has been done in the form of confusion matrices and error rate obtained using SVM.

Tab. 4 shows the performance metrics and the results obtained by the proposed method where each metric is calculated accordingly.

Fig. 5 gives the chart model evaluation using SVM and it proves the performance of classification accuracy 81.2187%, Sensitivity 93.2031% and Specificity 89.8655%. Tab. 5, it shows the comparison of existing systems and proposed systems for predicting cardiovascular disease.

Figure 5: Performance of the support vector machine

Fig. 6 is a graphical representation of a comparison of existing system with the proposed method for predicting cardiovascular disease in the early stage with more accuracy when compared to other machine learning techniques.

Figure 6: Comparison of existing and proposed system
In this study the occurrence of CVD is more in humans because of genetic disorder when compared to other health issues. Therefore, medical practioner are in need of suitable technique or model to predict primarily. Nowadays, machine learning techniques are adapted in medical science for such decision-making situations. The proposed system designed under supervised learning using SVM plays efficiently in decision appealing and retrieving proficiency from an enormous amount of data thereby delivering better patient care and productivity. This system proves as an excellent model in addressing the classification problems and go-to method for any type of prediction problem. In this research paper, the classification techniques used for identifying cardiovascular in patients gives more prediction accuracy compare to other technical approaches. Future research is required to validate the algorithm for a huge population in taking many risk parameters into consideration.
Funding Statement: Thanks for the Graphic Era Hill University and authors thanks to Saudi Electronic University for the financial support.
Conflicts of Interest: The authors declare that they have no conflicts of interest to report regarding the present study.
1. T. Sano, S. Kiuchi and S. Hisatake, T. Kabuki and T. Oka, “Cardio-ankle vascular index predicts the 1-year prognosis of heart failure patients categorized in clinical scenario 1,” Heart and Vessels, vol. 35, no. 1, pp. 1537–1544, 2020. [Google Scholar]
2. Q. U. Ain, N. Asif, A. Alam, M. Gilani and N. Shahzad, “Triglycerides-to-hDLC ratio as a marker of cardiac disease and vascular risk factors in adults,” Journal of the College of Physicians and Surgeons Pakistan, vol. 29, no. 11, pp. 1034–1037, 2019. [Google Scholar]
3. F. S. D. Edelenyi, L. Goumidi, S. Bertrais, C. Phillips and R. Macmanus, “Prediction of the metabolic syndrome status based on dietary and genetic parameters using random forest,” Genes & Nutrition, vol. 3, no. 3–4, pp. 173–176, 2008. [Google Scholar]
4. A. Laucevicius, L. Ryliskyte, J. Balsyte, J. Badariene and R. Puronaite, “Association of cardio-ankle vascular index with cardiovascular risk factors and cardiovascular events in metabolic syndrome patients,” Medicina, vol. 51, no. 3, pp. 152–158, 2015. [Google Scholar]
5. K. Furusawa, K. Takeshita, S. Suzuki, Y. Tatami, and R. Morimot, “Assessment of abdominal aortic calcification by computed tomography for prediction of latent left ventricular stiffness and future cardiovascular risk in pre-dialysis patients with chronic kidney disease: A single center cross-sectional study,” International Journal of Medical Sciences, vol. 16, no. 7, pp. 939–948, 2019. [Google Scholar]
6. S. Satpathy, D. Swapana, S. C. Sengupta Aditya and K. D. Bhattacaryya Bidyut, “Design a fpga fuzzy based, insolent method for prediction of multi-diseases in rural area,” Journal of Intelligent & Fuzzy Systems, vol. 37, no. 5, pp. 7039–7046, 2019. [Google Scholar]
7. S. B. Priya, M. Rajamanogaran and S. Subha, “Prediction of chest diseases using transfer learning,” Machine Learning for Healthcare Applications, vol. 1, no. 1, pp. 199–213, 2021. [Google Scholar]
8. H. A. Qadir, P. Thavendiranathan, P. C. Austin, D. S. Lee and E. Amir, “Development and validation of a multivariable prediction model for major adverse cardiovascular events after early-stage breast cancer: A population-based cohort study,” European Heart Journal, vol. 40, no. 48, pp. 3913–3920, 2019. [Google Scholar]
9. A. Zarzour, H. W. Kim and N. L. Weintraub, “Epigenetic regulation of vascular diseases,” arteriosclerosis,” Thrombosis, and Vascular Biology, vol. 39, no. 6, pp. 984–990, 2019. [Google Scholar]
10. E. Nowossadeck, “Population aging and hospitalization for chronic disease in Germany,” Deutsches Arzteblatt International, vol. 109, no. 9, pp. 151–158, 2012. [Google Scholar]
11. K. Balasaravanan, “Detection of dengue disease using artificial neural network based classification technique,” International Journal of Engineering and Technology, vol. 7, no. 1.3, pp. 13–15, 2017. [Google Scholar]
12. H. Kanegae, K. Suzuki, K. Fukatani and T. Ito, “Highly precise risk prediction model for new-onset hypertension using artificial intelligence techniques,” Journal of Clinical Hypertension, vol. 22, no. 3, pp. 445–450, 2019. [Google Scholar]
13. K. Matsushita, N. Ding, E. D. Kim, M. Budoff and J. A. Chirinos, “Cardio-ankle vascular index and cardiovascular disease: Systematic review and meta-analysis of prospective and cross-sectional studies,” the Journal of Clinical Hypertension, vol. 21, no. 1, pp. 16–24, 2019. [Google Scholar]
14. S. Y. Park, S. O. Chin, S. Y. Rhee, S. Oh and J. T. Woo, “Cardio-ankle vascular index as a surrogate marker of early atherosclerotic cardiovascular disease in Koreans with type-2 diabetes mellitus,” Diabetes & Metabolism Journal, vol. 42, no. 4, pp. 285–295, 2018. [Google Scholar]
15. K. F. Hjuler, L. C. Gormsen, M. H. Vendelbo, A. Egeberg and J. Nielsen, “Systemic inflammation and evidence of a cardio-splenic axis in patients with psoriasis,” Acta Dermato-Venereologica, vol. 98, no. 4, pp. 390–395, 2018. [Google Scholar]
16. M. Gohbara, N. Iwahashi, Y. Sano, E. Akiyama and N. Maejima, “Clinical impact of the cardio-ankle vascular index for predicting cardiovascular events after acute coronary syndrome,” Circulation Journal, vol. 80, no. 6, pp. 1420–1426, 2016. [Google Scholar]
17. M. A. Gomez-Marcos, J. I. Recio-Rodriguez, M. C. Patino-Alonso, C. Agudo-Conde and L. Gomez-Sanchez, “Cardio-ankle vascular index is associated with cardiovascular target organ damage and vascular structure and function in patients with diabetes or metabolic syndrome, LOD-dIABETES study: A case series report,” Cardiovascular Diabetology, vol. 14, no. 7, pp. 1–10, 2015. [Google Scholar]
18. S. L. Chung, C. C. Yang, C. C. Chen, Y. C. Hsu and M. H. Lei, “Coronary artery calcium score compared with cardio-ankle vascular index in the prediction of cardiovascular events in asymptomatic patients with type 2 diabetes,” Journal of Atherosclerosis and Thrombosis, vol. 22, no. 12, pp. 1255–1265, 2015. [Google Scholar]
19. D. Otgontuyal, S. Oum, B. S. Buckley and R. Bonita, “Assessment of total cardiovascular risk using WHO/ISH risk prediction charts in three low- and middle-income countries in Asia,” BMC Public Health, vol. 13, no. 1, pp. 1–12, 2013. [Google Scholar]
20. H. Hu, H. Cui, W. Han, L. Ye and W. Qiue, “A cutoff point for arterial stiffness using the cardio-ankle vascular index based on carotid arteriosclerosis,” Hypertension Research, vol. 36, no. 1, pp. 334–341, 2013. [Google Scholar]
21. P. Khan, A. Singh and S. Maheshwari, “Automated brain tumor detection in medical brain images and clinical parameters using data mining techniques: A review,” International Journal of Computer Applications, vol. 98, no. 21, pp. 13–19, 2014. [Google Scholar]
22. S. Gopika and V. Muthuraman, “Survey on prediction of kidney disease by using data mining techniques,” International Journal of Advanced Research in Computer and Communication Engineering, vol. 6, no. 1, pp. 198–201, 2017. [Google Scholar]
23. S. Babu, E. M. Vivek, K. P. Famina, K. Fida and P. Awasthi, “Heart disease diagnosis using data mining technique,” Int. Conf. of Electronics, Communication and Aerospace Technology, vol. 2, pp. 750–753, 2017. [Google Scholar]
24. D. Ferreira, A. Oliveira and A. Freitas, “Applying data mining techniques to improve diagnosis in neonatal jaundice,” BMC Medical Informatics and Decision Making, vol. 12, no. 1, pp. 143, 2012. [Google Scholar]
25. S. A. Sanap, M. Nagori and V. Kshirsagar, “Classification of anemia using data mining techniques,” in Int. Conf. on Swarm, Evolutionary and Memetic Computing (SEMCCOVisakhapatnam, Andhra Pradesh, India, pp. 113–121, 2011. [Google Scholar]
26. S. A. Medjahed, T. A. Saadi and A. Benyettou, “Breast cancer diagnosis by using k-nearest neighbor with different distances and classification rules,” International Journal of Computer Applications, vol. 62, no. 1, pp. 1–5, 2013. [Google Scholar]
27. L. G. Ahmed, A. T. Eshlaghy, A. Poorebrahimi, M. Ebrahimi and A. R. Razavi, “Using three machine learning techniques for predicting breast cancer recurrence,” Journal of Health & Medical Informatics, vol. 4, no. 2, pp. 1000124, 2013. [Google Scholar]
28. S. A. Medjahed, T. A. Saadi and A. Benyettou, “Urinary system diseases diagnosis using machine learning techniques,” International Journal of Intelligent System and Applications, vol. 7, no. 5, pp. 1–7, 2015. [Google Scholar]
29. M. A. Islam and N. Jahan, “Prediction of onset diabetes using machine learning techniques,” International Journal of Computer Applications, vol. 180, no. 5, pp. 7–11, 2017. [Google Scholar]
30. C. L. Tsien, H. S. F. Fraser, W. J. Long and R. L. Kennedy, “Using classification tree and logistic regression methods to diagnose myocardial infarction,” Studies in Health Technology and Informatics, vol. 52, no. 1, pp. 493–497, 1998. [Google Scholar]
31. A. U. Haq, J. P. Li, M. H. Memon, S. Nazir and R. Sun, “A hybrid intelligent system framework for the prediction of heart disease using machine learning algorithms,” Mobile Information Systems, vol. 2018, no. 1, pp. 3860146, 2018. [Google Scholar]
32. A. Osareh and B. Shadgar, “Machine learning techniques to diagnosis breast cancer,” in Int. Symp. on Health Informatics and Bioinformatics, Antalya, pp. 114–120, 2010. [Google Scholar]
33. B. Alic, L. Gurbeta and A. Badnjevic, “Machine learning techniques for classification of diabetes and cardiovascular diseases,” Mediterranean Conference on Embedded Computing (MECO), Bar, Montenegro, pp. 1–4, 2017. [Google Scholar]
34. R. Das, I. Turkoglu and A. Sengur, “Effective diagnosis of heart disease through neural networks ensembles,” Expert Systems with Applications, vol. 36, no. 4, pp. 7675–7680, 2009. [Google Scholar]
35. P. Samant and R. Agarwal, “Machine learning techniques for medical diagnosis of diabetes using iris images,” Computer Methods and Programs in Biomedicine, vol. 157, no. 1, pp. 121–128, 2018. [Google Scholar]
36. N. I. R. Yassin, S. Omran, E. M. F. E. Houby and H. Allam, “Machine learning techniques for breast cancer computer aided diagnosis using different image modalities: A systematics review,” Computer Methods and Programs in Biomedicine, vol. 156, no. 1, pp. 25–45, 2018. [Google Scholar]
37. B. Zheng, S. W. Yoon and S. S. Lam, “Breast cancer diagnosis based on feature extraction using a hybrid of K-means and support vector machine algorithms,” Expert Systems with Applications, vol. 41, no. 4, pp. 1476–1482, 2014. [Google Scholar]
38. A. Bhardwaj and A. Tiwari, “Breast cancer diagnosis using genetically optimized neural network model,” Expert Systems with Applications, vol. 42, no. 10, pp. 4611–4620, 2015. [Google Scholar]
39. A. Charleonnan, T. Fufaung, T. Niyomwong, W. Chokchueypattanakit and S. Suwannawach, “Predictive analytics for chronic kidney disease using machine learning techniques,” Management and Innovation Technology International Conference (MITiconBang-San, pp. 80–83, 2016. [Google Scholar]
40. K. G. Dinesh, K. Arumugaraj, K. D. Santosh and V. Mareeswari, “Prediction of cardiovascular disease using machine learning algorithms,” in Int. Conf. on Current Trends Towards Converging Technologies (ICCTCTCoimbatore, pp. 1–7, 2018. [Google Scholar]
41. G. Sannino and G. D. Pietro, “A deep learning approach for ECG-based heartbeat classification for arrhythmia detection,” Future Generation Computer Systems, vol. 86, no. 1, pp. 446–455, 2018. [Google Scholar]
42. V. D. Ambeth Kumar, S. Sharmila, A. Kumar, A. K. Bashir, M. Rashid et al., “A novel solution for finding postpartum haemorrhage using fuzzy neural techniques,” Neural Computing and Applications, vol. 33, no. 18, pp. 11541–11554, 2021. https://doi.org/10.1007/s00521-020-05683-z. [Google Scholar]
43. R. Vijay, A. Kumar, K. Ankit, V. D. A. Kumar, K. Rajeshkumar et al., “COVIDPRO-NET: A prognostic tool to detect COVID 19 patients from lung X-ray and CT images using transfer learning and Q-deformed entropy,” Journal of Experimental & Theoretical Artificial Intelligence, vol. 33, no. 4, pp. 683–698, 2021. https://doi.org/10.1080/0952813X.2021.1949755. [Google Scholar]
44. V. D. Ambeth Kumar, G. Gokul, S. Malathi, K. Vengatesan, D. Elangovan et al., “Implementation of the pulse rhythemic rate for the efficient diagonising of the heart beat,” Healthcare Technology Letter, vol. 6, no, 2, pp. 48–52, 2019. [Google Scholar]
 | This work is licensed under a Creative Commons Attribution 4.0 International License, which permits unrestricted use, distribution, and reproduction in any medium, provided the original work is properly cited. |