DOI:10.32604/cmc.2022.020348
| Computers, Materials & Continua DOI:10.32604/cmc.2022.020348 | |
| Article |
Fuzzy-Based Automatic Epileptic Seizure Detection Framework
1Shaheed Zulfikar Ali Bhutto Institute of Science and Technology, Islamabad, Pakistan
2Department of Computer Science & IT, University of Lakki Marwat, KPK, Pakistan
3Stockholm University, Stockholm, Sweden
4Department of Computer Science, School of Arts and Sciences, University of Central Asia, Kyrgyz Republic
5Department of Software, Korea National University of Transportation, Chungju, 27469, Korea
6Department of Biomedical Engineering, Korea National University of Transportation, Chungju, 27469, Korea
7Department of AI Robotics Engineering, Korea National University of Transportation, Chungju, 27469, Korea
8Department of IT & Energy Convergence (BK21 FOUR), Korea National University of Transportation, Chungju, 27469, Korea
*Corresponding Author: Jeonghwan Gwak. Email: jgwak@ut.ac.kr
Received: 20 May 2021; Accepted: 16 July 2021
Abstract: Detection of epileptic seizures on the basis of Electroencephalogram (EEG) recordings is a challenging task due to the complex, non-stationary and non-linear nature of these biomedical signals. In the existing literature, a number of automatic epileptic seizure detection methods have been proposed that extract useful features from EEG segments and classify them using machine learning algorithms. Some characterizing features of epileptic and non-epileptic EEG signals overlap; therefore, it requires that analysis of signals must be performed from diverse perspectives. Few studies analyzed these signals in diverse domains to identify distinguishing characteristics of epileptic EEG signals. To pose the challenge mentioned above, in this paper, a fuzzy-based epileptic seizure detection model is proposed that incorporates a novel feature extraction and selection method along with fuzzy classifiers. The proposed work extracts pattern features along with time-domain, frequency-domain, and non-linear analysis of signals. It applies a feature selection strategy on extracted features to get more discriminating features that build fuzzy machine learning classifiers for the detection of epileptic seizures. The empirical evaluation of the proposed model was conducted on the benchmark Bonn EEG dataset. It shows significant accuracy of 98% to 100% for normal vs. ictal classification cases while for three class classification of normal vs. inter-ictal vs. ictal accuracy reaches to above 97.5%. The obtained results for ten classification cases (including normal, seizure or ictal, and seizure-free or inter-ictal classes) prove the superior performance of proposed work as compared to other state-of-the-art counterparts.
Keywords: Medical image processing; electroencephalography; machine learning; fuzzy system models; seizure detection; epileptic seizure; virtualization
Epilepsy is a serious chronic neurological disorder affecting over 50 million people of all ages around the globe [1]. It is caused by an abnormal functionality of human neuron cells in terms of their excessive and hyper-synchronous electrical activities [2]. This abnormality originates from an epileptic seizure that is a common symptom of epilepsy. Most often, when a seizure happens individual gets classic uncontrolled jerking body movements and momentarily becomes loss of consciousness. Epileptic seizures are highly unprovoked, and their consequences vary according to the seizure type and its severity. Generally, such seizures are avoided by either medication or operating the infected part of the brain. However, the medicinal treatment exacerbates the memory loss issue while operating the brain; on the other hand, it originates complications when finding the regions containing abnormal neurons. In order to inspect the neuronal abnormality, neurologists recommend an affordable clinical-based medical test named as Electroencephalography [3]. It represents the electrical activities of brain cells in the form of Electroencephalogram (EEG) biomedical signals. The manual inspection of EEG signals is a tedious and time-consuming process that demands the continuous availability of neurologists. It puts a burden on experts and reduces their efficiency. Furthermore, inter-observer variability due to varying neurologists’ experiences also raises the issues in accurate diagnosis and medication of epileptic patients. These limitations motivated efforts to design and develop such systems in which EEG signals are investigated automatically by using machine learning algorithms [4].
The automatic epileptic seizure detection system is especially useful in countries where patients’ ratio is much greater than neurologists. Moreover, it can also act as an assistant in clinical practices and helpful in ambulatory settings to investigate long EEG recordings of patients. In recent literature [1–21], a number of machine learning-based epileptic seizure detection methods have been proposed that classify EEG segments into the seizure and non-seizure classes. These methods comprise three major steps: signal analysis, feature extraction, and signal classification. In the signal analysis step, EEG signal decomposition is performed using various signal analysis techniques such as Discrete Wavelet Transformation (DWT) [5], Wavelet Packet Transformation (WPT) [11], and Empirical Model Decomposition (EMD) [13]. The second step extracts characterizing features of EEG sub-signals, including temporal and spectral. In the third step of the classification, seizure and non-seizure EEG signals are detected.
The motivation behind the proposed research is many-fold because the existing methods confront several challenges that need to be tackled. First, EEG signals are highly non-stationary and non-linear in nature due to which signal characteristics vary over different seizure events within the same patient or in between two patients [13]. For this unobvious behavior of EEG signals, extraction of the most representative and characterizing features of epileptic EEG signals is a great challenge. Second, non-seizure EEG segments can contain their oscillatory and fractal characteristics similar to the seizure segments; therefore, extraction of the most discriminating features is also challenging [14]. Third, the accurate classification of the EEG segments is difficult as seizure, and non-seizure classes overlap based on their features. The previous methods [1–2,4,7,11,15] are unable to completely capture the distinguishing information about seizure recordings for accurate classification of EEG signals.
To address the aforementioned challenges, this paper presents a Fuzzy-based Epileptic Seizure Detection (FESD) framework. In this model, an improved feature extraction scheme is introduced that extracts a combination of temporal, spectral, non-linear, and pattern features from the sub-bands of EEG signals to identify the characterizing features of epileptic signals. In order to obtain the most significant and discriminating features among extracted feature vector, the FESD model introduces a feature selection strategy that first ranks and then selects top-ranked features. In this model, fuzzy logic-based machine learning algorithms are employed to deal with the issue of class overlapping. These algorithms build fuzzy classification models based on the selected features to detect epileptic seizure recordings.
The major contributions of this research work are mentioned below.
• A feature extraction method is proposed to improve the feature vector that extracts statistical features by temporal, spectral, non-linear, and pattern analysis of decomposed EEG signal sub-bands.
• In case of pattern features extraction, the One Dimensional-Local Binary Pattern (1D-LBP) based algorithm is proposed to know the morphological structure of epileptic EEG signals.
• A feature selection strategy for better classification is introduced that finds out the most distinguishing features by applying Information gain and Analysis of variance (ANOVA) statistical test.
• The proposed FESD employs fuzzy logic-based machine learning algorithms for EEG classification into three classes including normal, inter-ictal, and ictal.
The remaining paper is structured as follows. Section 2 briefly reviews the related work after categorizing on the basis of techniques used as machine learning algorithms and signal analyzing tools. The proposed FESD framework is elaborated in Section 3. The empirical evaluation of the proposed framework in terms of performance metrics is demonstrated in Section 4. Section 5 performs the comparison of the FESD model with the state-of-the-art literature works. Finally, Section 6 concludes this paper by summarizing the contributions and findings along with some future directions.
Before proceeding, some notations along with descriptions are provided in Tab. 1. This section discusses existing machine learning-based epileptic seizure detection approaches. The main purpose of this review is to critically analyze the previously proposed methods to extract important features from signals and their classification. On the basis of machine learning algorithms, the existing epileptic seizure detection literature is categorized into two broad categories: traditional machine learning-based methods and deep learning-based methods.
2.1 Traditional Machine Learning-Based Methods
In these methods, state-of-the-art machine learning algorithms such as Support Vector Machine (SVM), Random Forest (RF), and K-Nearest Neighbor (KNN) have been employed for epileptic seizure detection. Since extraction of the most appropriate and distinguishing features from EEG signals is an important task for epileptic seizure detection, these methods are further grouped into four types based on the signal analysis used for feature extraction. The four types are wavelet transform-based methods, non-linear analysis-based methods, multiple decomposition analysis-based methods, and non-decomposition analysis-based methods.

2.1.1 Wavelet Transform Based Methods
Wavelet transform-based methods for EEG signal analysis are employed in [1–13]. The nature of EEG signals is non-stationary; therefore, simultaneous analysis of time and frequency domains by means of wavelet transformation has great significance. In literature, different variants of wavelet transformation techniques are introduced as signal analyzing tools such as DWT, Dual Tree-Complex Wavelet Transformation (DT-CWT), Wavelet Packet Transform (WPT).
By using wavelet transformation, a signal is decomposed into sub-signals to extract statistical features from the decomposed sub-bands of different frequency ranges. In order to classify EEG recordings into two classes, normal and epileptic, the authors in [1] utilized statistical features of DWT coefficients along with Hilbert Envelope for building classification model in KNN, SVM, and LINEAR classifier. This work showed 99.7% accuracy with KNN but not applicable in clinical practices because it was not validated on various demographics of patients. An improved correlation-based feature selection (ICFS) technique was proposed by Mursalin et al. [2] to select the most discriminating features from extracted features of sub-bands generated by DWT. But proposed ICFS technique did not consider the class-level standard deviation in feature values. On the Bonn dataset, RF built model showed 98.45% accuracy but did not accurately classify those instances having high intra-class and low inter-class variability of feature values. To further enhance the accuracy, Subasi et al. [3] introduced an approach that built two hybrid classification models Genetic Algorithm – SVM (GA-SVM) and Particle Swarm Optimization – SVM (PSO-SVM) using statistical features of DWT generated decomposed signals. The hybrid classifiers apply optimization algorithms to choose optimizing parameter values of the kernel function. Although PSO-SVM showed the best accuracy of 99.38% for A and E subsets of the Bonn dataset, it also increased the execution time.
Wang et al. [4] proposed Lifting-based Discrete Wavelet Transform (LDWT) based three level decomposition and extracted time-domain statistical features from sub-signals to build a classification model in the Sparse Extreme Learning Machine (SELM) algorithm. It provided 98.40% accuracy for A, D, and E subsets of Bonn dataset but showed quadratic programming problem in classifier training. In accordance to the previous work, Li et al. [5] built a classification model in Neural Network Ensemble (NNE) along with DWT signal analyzing tool that showed improved accuracy of 98.78%. To boost accurate classification, the same authors applied DT-CWT [6] for decomposition of original signals into four levels and obtained non-linear features to train four state-of-the-art classifiers, i.e., SVM, KNN, Decision Tree (DT), and RF. The best classifier SVM showed the highest accuracy of 98.87%. However, in all the aforementioned frameworks, computational complexity was high due to the use of the Neural Network Ensemble (NNE) classifier and DT-CWT technique. The non-preprocessing strategy was introduced to remove artifacts.
In seizure vs. non-seizure EEG classification, Orosco et al. [7] extracted spectral and statistical features from Stationary Wavelet Transform (SWT) generated sub-bands to build a classification model of Linear Discriminant Analysis (LDA) and Bayesian Regulation Neural Network (BRNN) machine learning algorithms. Although it showed 96.3% accuracy for Children's Hospital of Boston-Massachusetts Institute of Technology (CHB-MIT), but the proposed approach was not generalized for all patients. On similar lines, Patidar et al. [8] proposed Tunable-Q Wavelet Transform (TQWT) based methodology for a similar classification case. In this work, Kraskov entropy was extracted from decomposed signals to build Least Square-SVM (LS-SVM) model that showed 97.7% classification accuracy for the Bonn dataset. However, in the proposed work, Radial Basis Function (RBF) kernel was selected arbitrarily without justifying the selection criteria. In [9], A. Bhattacharyya and R. B. Pachori employed Empirical Wavelet Transformation (EWT) method along with the RF technique and showed average accuracy of 99.41% under the CHB-MIT dataset, but the performance was reduced in detecting small duration EEG segments. Yuan [10] proposed WPT based approach for the classification of EEG signals in the Freiburg dataset. In this approach, relative amplitude, Power Spectral Density (PSD), and Pattern Match Regularity Statistic (PMRS) features were extracted to train Weighted Extreme Learning Machine (WELM) algorithm. But this work was unable to capture the entire signal variation because temporal information was not encountered. Vidyaratne et al. [11] employed the Harmonic Wavelet Packet Transform (HWPT) method to generate sub-bands of EEG signals, and non-linear features were extracted for seizure vs. non-seizure classification cases using Relevance Vector Machine (RVM). This work utilized more instance of non-seizure data compared to seizure data that led to generating over-specificity and low sensitivity in the resulting performance. Mardini et al. [12] proposed a framework in which 54-DWT mother wavelets from 7 wavelet families generated a feature matrix of 14 statistical features that derived from decomposed signal sub-bands. The dimensionality reduction of extracted feature vector by GA generated a selected feature set to train 4 machine learning algorithms where Artificial Neural Network (ANN) provided notable performance for 14 EEG classification cases using Bonn data.
2.1.2 Non-Linear Analysis Based Methods
To understand the non-linearity of EEG signals, EMD and Local Mean Decomposition (LMD) techniques were proposed. Riaz et al. [13] applied EMD, and then Hilbert transform it to extract temporal and spectral statistical features from the first three Intrinsic Mode Functions (IMFs) obtained after decomposition. The extracted features are used to build a classification model in four machine learning algorithms SVM, KNN, ANN, and DT, but SVM performed the best. On the other hand, Zhang et al. in [14] utilized LMD to analyze EEG signals. In this study, temporal, spectral, and non-linear features were extracted from Product Functions (PFs) generated by LMD. The most distinguishing features were selected by one-way ANOVA significance test and used to build a classification model in five machine learning algorithms Back Propagation Neural Network (BPNN), KNN, GA-SVM, SVM, and LDA, but GA-SVM showed superior results.
To capture the pattern behavior of EEG signals for epileptic seizure detection, Shanir et al. [15] applied ID-LBP technique on one second EEG epochs to get local binary patterns-based statistical features. These features built a model in KNN and performed classification between normal and seizure classes with 99.7% accuracy under CHB-MIT dataset. In [16], Tiwari et al. firstly detected signal key-points by calculating the pyramid of Difference of Gaussian (DoG) filtered signals and then applied ID-LBP on detected points to extract histogram features. The extracted features are utilized for model building in SVM which results in accuracy improvement for normal vs. seizure classification with increased computational cost due to the additional step for key-points detection.
2.1.3 Multiple Decomposition Analysis Based Methods
Previous studies employed multiple decomposition-based methods for signals analysis to capture EEG information from different perspectives. In such methods, Ghayab et al. [17] employed Fast Fourier Transform (FFT) and DWT methods separately to extract time domain statistical features from decomposed signals. The extracted features were ranked by information gain to select the most distinguishing features for building a classification model in LS-SVM. The resulting performance was impressive for two-class classification cases only without evaluating for multi-class scenarios.
Similarly, Alickovic et al. [18] applied a combination of DWT, WPT, and EMD techniques for decomposing pre-processed EEG segments. The temporal features were extracted from signal sub-bands to build model in four state-of-the-art algorithms RF, SVM, Multilayer Perceptron (MLP), and KNN, but RF and SVM performed better classification between pre-ictal, inter-ictal, and ictal classes. Likewise, in [19], Wang et al. employed DWT, FFT, and EMD procedures on pre-processed signals to generate sub-signals by 4-level decomposition in DWT and FFT, and eight IMFs in EMD. Temporal, spectral, and non-linear features were extracted from decomposed signals which were further selected by Principal Component Analysis (PCA) and ANOVA. The selected feature vector is used to build a model in RBF-SVM, which showed 99.25% accuracy for seizure vs. seizure-free classification. This technique resulted in high computational cost and execution time due to the use of combined techniques. Rabcan et al. [20] proposed a fuzzy approach where crisp EEG features extracted by FFT were first reduced by PCA and then FCM-based fuzzification was applied to get fuzzy features. The obtained fuzzy features built Fuzzy Decision Tree (FDT) classifier that achieved 99.5% accuracy for EEG classification into seizure and non-seizure. However, the additional fuzzification step incurs more computations that increase the complexity.
2.1.4 Non-Decomposition Analysis Based Methods
Arunkumar et al. [21] extracted three types of non-linear entropy features from original EEG signals of the Bern Barcelona database to train six machine learning algorithms Naïve Bayes Classifier (NBC), RBF, KNN, SVM, Non-Nested Generalized Exemplars (NNge), and Best First Decision Tree (BFDT). The best accuracy of 98% was shown by NNge for focal vs. non-focal signals classification. But, in this work pre-processing was not performed to remove artifacts. On the other hand, Kusmakar et al. [22] introduced a method for seizure vs. non-seizure classification of EEG signals. According to this method, pre-processing was first performed on EEG signals by activity and time filters, then temporal and Poincare-based features were extracted from signal segments. For feature selection, twenty-times repeated leave-one-out cross-validation based Receiver Operating Characteristic (ROC) analysis was performed to build a classification model in Support Vector Data Description (SVDD). It showed low sensitivity of 86.95% due to a variety of seizures in the dataset and more than 10 s latency to ring seizure alarm.
Similarly, Gu et al. [23] worked on classification between seizure and non-seizure classes using clinical scalp and behind the ear EEG. In this method, Blind Source Separation of Canonical Correlation Analysis (BSSCCA) and Independent Component Analysis (ICA) removed Electromyogram (EMG) and Electrooculogram (EOG) artifacts, respectively. The pre-processed 2 s signal epochs were used to extract temporal features for model building in SVM. It showed a high false detection rate for clinical EEG with low sensitivity of 94.5% for behind the ear EEG due to poorly connected electrodes. For normal vs. epileptic classification, Rajagopalan et al. [24] performed microstate alterations of ictal and inter-ictal discharge-free EEG segments after downsampling and removing the artifact. Two features, frequency of occurrence and percentage of time coverage, were extracted to build a classifier model in Fishers Linear Discriminant Analysis (FLDA) and MLR, but FLDA proved better performance with 76.10% accuracy. However, the dependency of microstate alteration on the cognitive deficit is a major drawback of this technique. Suguna et al. [25] introduced a Fuzzy Support Vector Machine (FSVM) for the classification of normalized EEG signals into the seizure and non-seizure classes. FSVM performed multi-label classification; therefore, each EEG instance with varying membership functions for both classes categorized to the class with higher membership function. However, the obtained performance of 79.65% accuracy was not significant.
2.2 Deep Learning-Based Methods
In such methods, neural network-based machine learning algorithms were used for signal classification. These algorithms, such as Convolutional Neural Network (CNN) or Recurrent Convolutional Neural Network (RCNN), have the end-to-end structure in which no explicit feature extraction and selection was performed. However, the layered structure of the classifier automatically extracts robust features for EEG signal classification.
The recent deep learning-based methodologies have a noteworthy impact in detecting seizure EEG segments. In this regard, Ullah [26] proposed 3 Pyramidal-1 Dimensional-CNN (P-1D-CNN) for normal, inter-ictal, and ictal classification of EEG data. Although, classifier yielded inspiring results of nine classification cases for normalized segments of Bonn data signals, high training time and computational complexity were observed.
On the other hand, Acharya et al. [27] used CNN as deep learning algorithm and classified the normalized EEG Bonn data into normal, pre-ictal, and ictal classes with reduced accuracy of 88.67%. Similarly, Thodoroff et al. [28], Kiral-Kornek et al. [29], and Tjepkema-Cloostermans et al. [30] employed RCNN, Neural Network (NN), and 2 Dimensional-CNN algorithms with reduced percent sensitivity of 85%, 68.6%, and 47.4% respectively. The major reason for reduced performance is the less availability of seizure data for deep learning.
In this paper, a novel Fuzzy-based Epileptic Seizure Detection (FESD) model is proposed to investigate EEG signals for epileptic seizure detection. The FESD method is comprised of six major phases Data Collection, Signal Pre-processing, Feature Extraction, Feature Selection, Classifier Building, and Classifier Evaluation, as illustrated in Fig. 1. In the first phase, EEG data is collected from the human brain by either placing electrodes on the patient's scalp or interior to the brain. The second phase pre-processes EEG signals to remove noise causing artifacts. Third phase introduces an improved feature extraction method consisting of two sub-phases Signal Decomposition and Feature Generation. In Signal Decomposition, EEG signals are decomposed into sub-bands using DWT technique. In Feature Generation, temporal, spectral, non-linear, and pattern features are extracted from decomposed signal sub-bands. The fourth phase of feature selection applies Information Gain (InfoGain) and ANOVA-based strategy to select the most distinguishing features. In the fifth phase, classification models are built using five fuzzy logic-based machine learning algorithms under 70% data for training. In the last phase, the built models are evaluated in terms of accuracy, sensitivity, and specificity performance measures to classify ten classification cases for 30% of testing data.
In the current study, a benchmark Bonn dataset is used for experimentation and evaluation of the proposed model. This dataset was collected by the Epileptology Department of Bonn University, Germany, and freely available for educational purposes. It consists of 500 EEG recordings acquired from ten individuals, including five healthy volunteers and five epileptic patients [31].
The Bonn dataset is comprised of five subsets A, B, C, D, and E, in which every subset consists of 23.6 s long 100 EEG recordings. Among these subsets, A and B contain EEG recordings of normal individuals with awaken state of eyes open and close, respectively. The subsets C and D are seizure-free EEG data collected from intracranial electrodes placed within and opposite to epileptogenic zone, respectively. In subset E, EEG recordings are ictal or seizure is a seizure or ictal EEG data obtained by placing electrodes in epileptogenic zone intra-cranially. The description of the Bonn dataset is summarized in Tab. 2. Fig. 2 demonstrates an instance of EEG recordings from each subset. The recordings were made by using an amplifier system that contained 128 channels with a common reference. In order to digitize the recorded signals, the sampling frequency was set to 173.61 Hz and employed 12-bit A/D resolution.
The collected EEG signals are contaminated with different types of artifacts that create noise in original recordings. These artifacts originate due to the movements of body limbs (EMG), eyes blinking (EOG), beating the heart muscles or Electrocardiogram (ECG), electrode movement, power lines impairment, and some environmental factors as well. The artifacts are eliminated by applying the Butterworth bandpass filter. This filter allows passing a certain range of frequencies while discards the remaining. In this work, Butterworth filter bandwidth is configured as 0.1–60 Hz. The reason behind choosing this bandwidth is that the most frequencies of EEG signals lie in this range. According to the configured bandwidth setting, the Butterworth filter allows passing only those frequency components of EEG signal that fall in the range of 0.1 to 60.0 Hz while the remaining that beyond this range are suppressed.
This paper introduces an improved method to extract such features about EEG signals that are better representative of distinct seizure EEG recordings from non-seizure ones. The method is comprised of three steps in which firstly, generate signal sub-bands by decomposition. Secondly, extract the statistical features from generated sub-bands to obtain varying trends and complexity of the signal. Thirdly, the most discriminating features are selected from extracted ones that lead to omit redundant and less important features. Three steps of the proposed feature extraction method are elaborated in the following sub-sections.
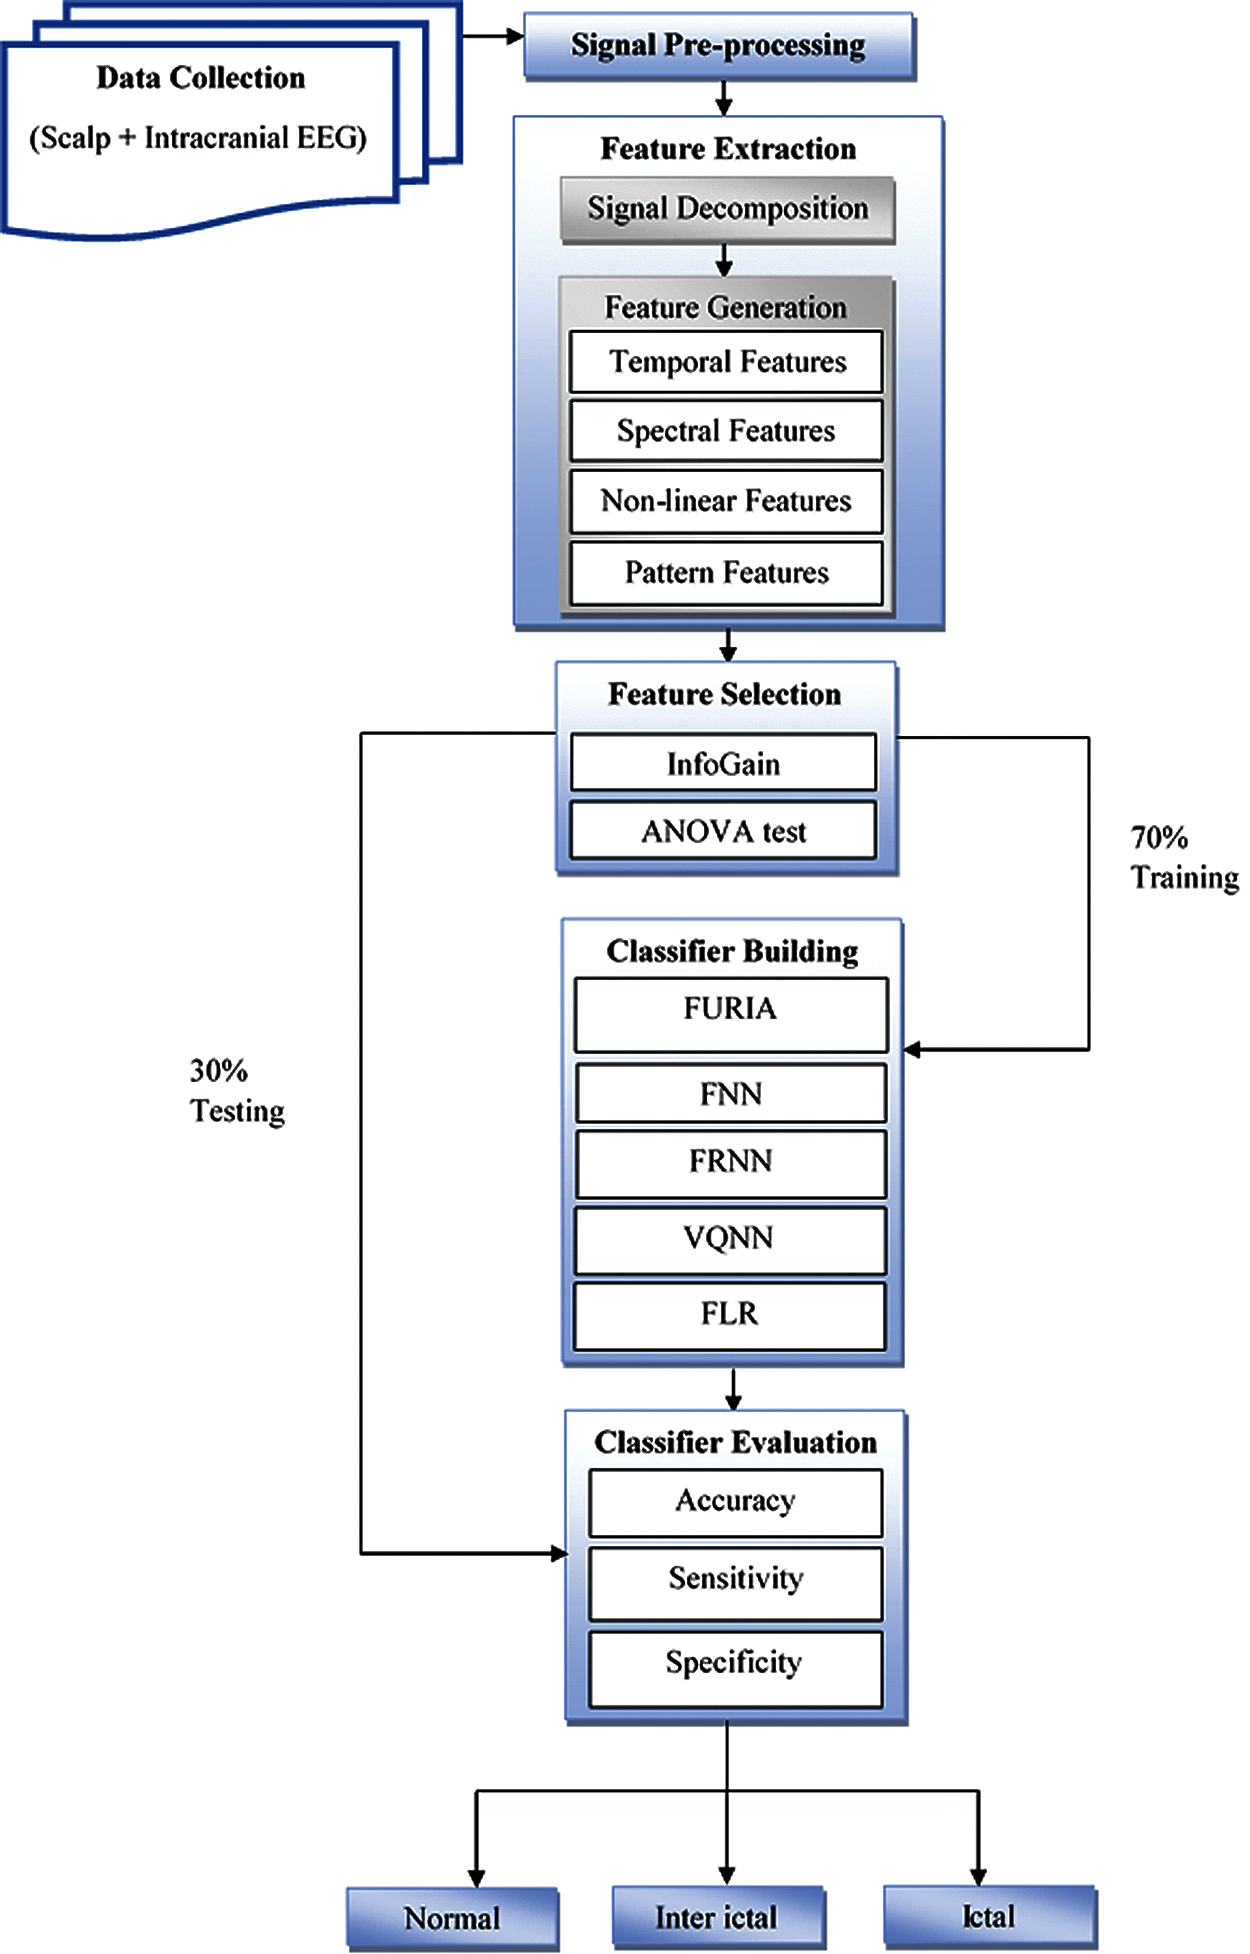
Figure 1: Fuzzy-based epileptic seizure detection model
In the first step of the feature extraction method, Discrete Wavelet Transform (DWT) technique [32] is applied on artifact-free signals to generate decomposed sub-signals. Since DWT provides time and frequency domain analysis of signals, it is considered a powerful tool to analyze signals. Its analysis can be explained by filter banks. These filters transform a signal into its components by multi-resolution decomposition. At every stage of this decomposition, two digital filters named as high pass and low pass are employed to provide detailed and approximation coefficients. The definition of the well-known DWT method for signal decomposition is given in Eq. (1) [2].
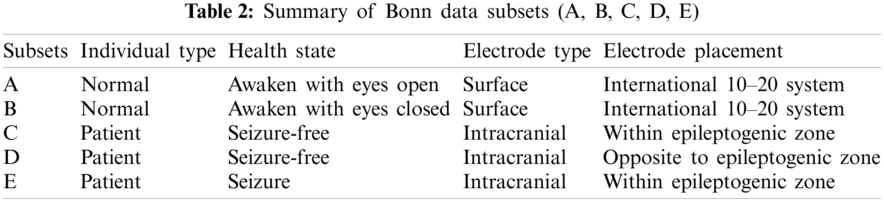
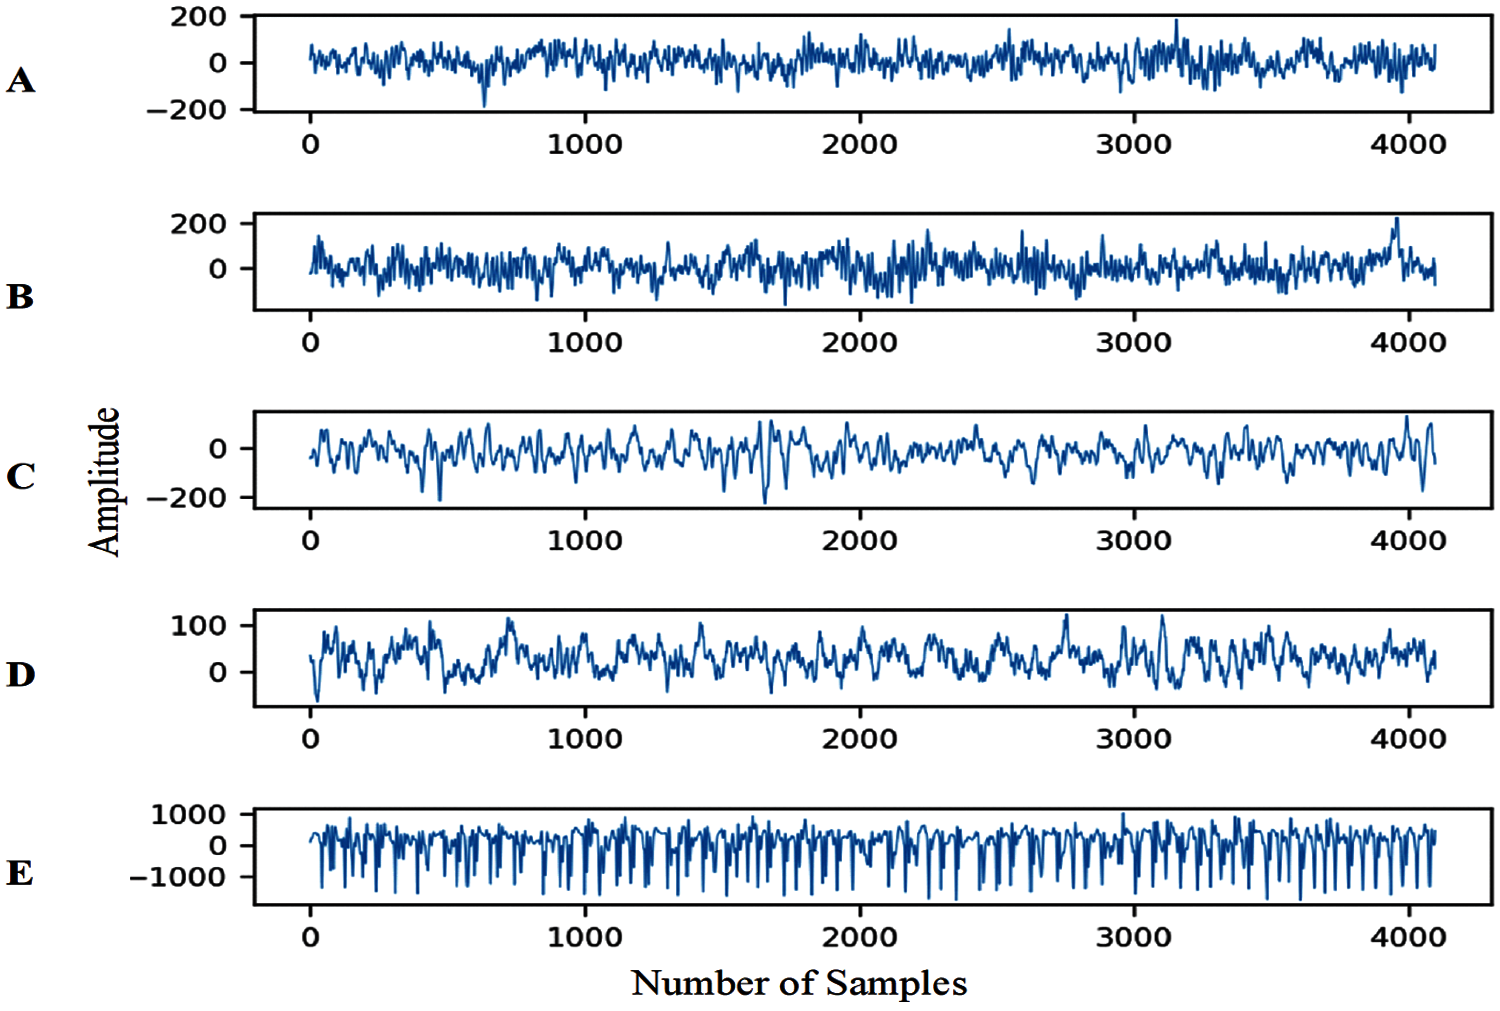
Figure 2: EEG recording samples of A, B, C, D, E subsets
According to Eq. (1), y(t) is the signal to be processed, 2ij and 2i refer to the shifting and scaling parameters of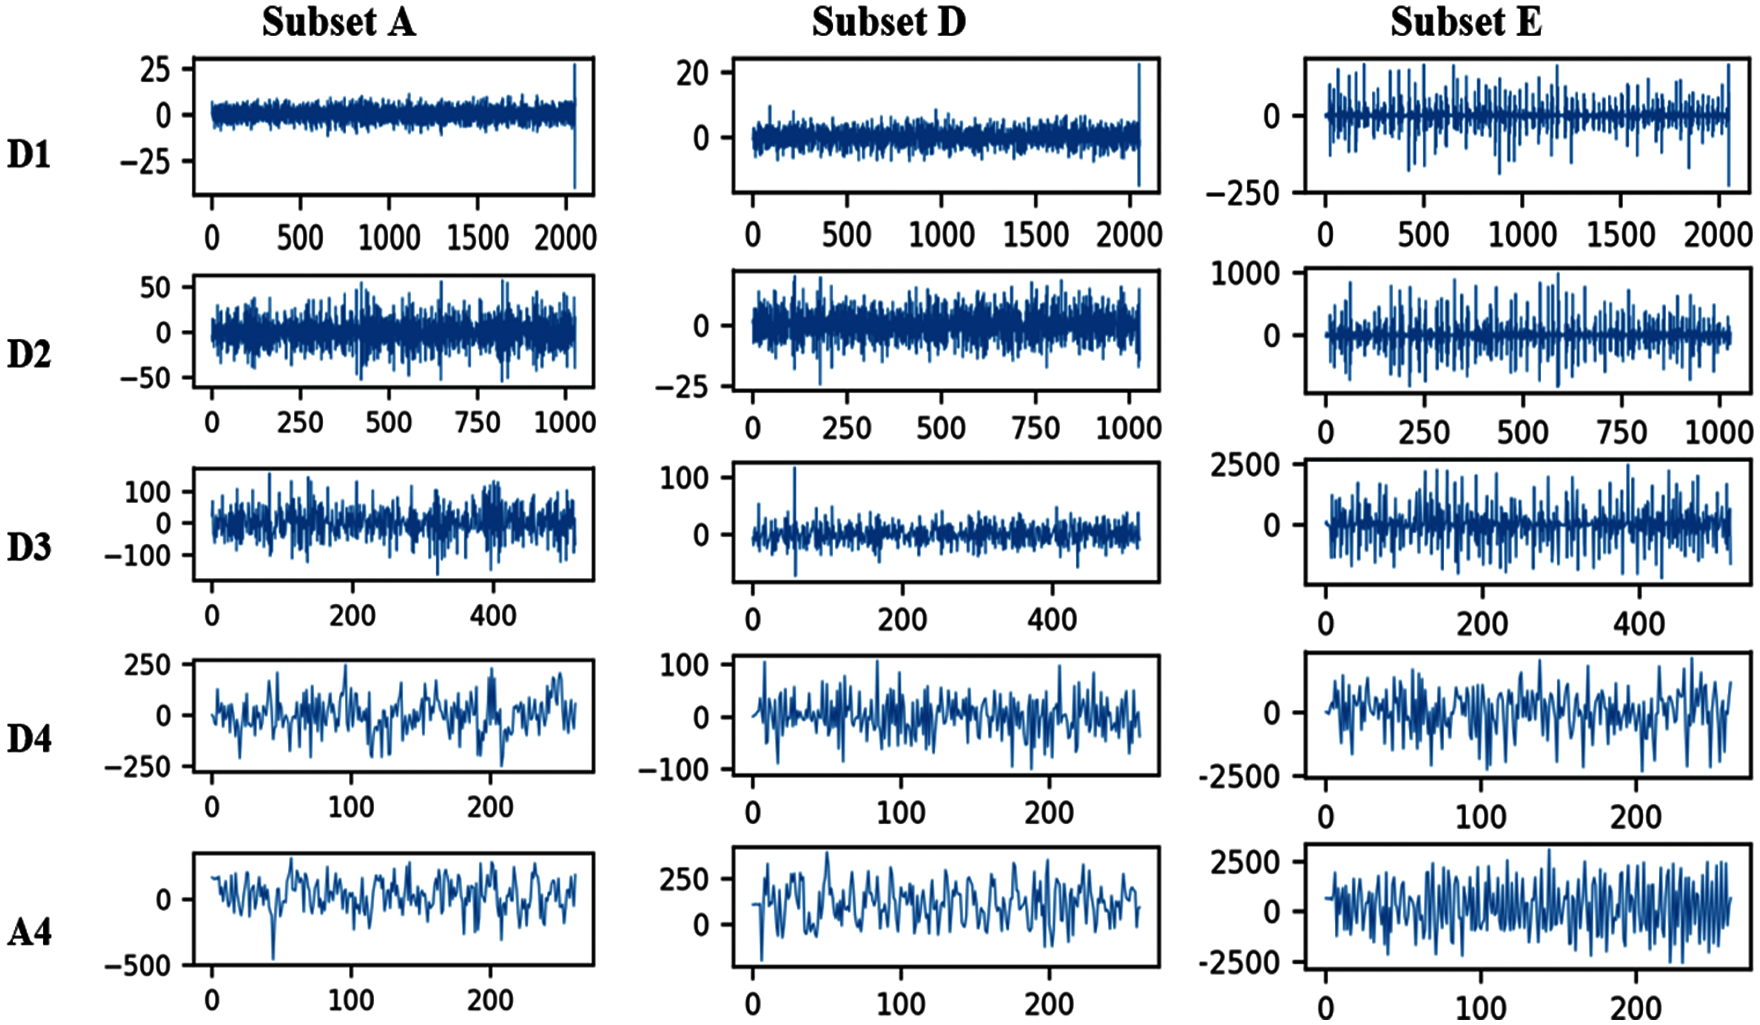
Figure 3: Wavelets transformed sub-signals of A, D, E subsets
To enhance EEG characterization, salient feature extraction is very important. In second step of feature extraction phase, four types of features temporal, spectral, non-linear, and patterns are extracted from decomposed sub-bands to achieve effective classification accuracy. These features capture different types of information about EEG sub-signals, such as temporal features collect time domain information and spectral features give statistical information about the frequency components. Similarly, non-linear features reflect the signal complexity and irregularity, and pattern features report the signal trends and their variations.
a) Temporal Features
These features extract time domain statistical features of EEG signals such as amplitude minimum, maximum, median, mean, mode, and standard deviation. In the current study, minimum amplitude [2,22], mean amplitude [1–3,5], and standard deviation [18,19] are used to cater temporal information. These features are mathematically represented in Eqs. (2)–(4) [34].
where
b) Spectral Features
One fundamental characteristic of signals is the frequency that informs about the rhythms of a signal. The spectral features encircle information about frequency components that constitute the signal and other fractal features such as signal power and energy. EEG signals have transitory characteristics and non-stationary nature. Thus signal analysis becomes less significant by only considering the time-domain features; therefore, spectral features are extracted as well [2]. In this work, PSD [7,10] is examined that computes power distribution in different signal frequency components. The values of peak, mean, and variance of PSD are focused on spectral analysis. Eq. (5) [14] calculates the maximum or peak value of PSD in decomposed signals where P(w) represents the amplitude of wth frequency bin of the signal spectrum. In the same way, Eq. (6) [13] determines the mean PSD value while Eq. (7) [13] computes variance in PSD of sub-band signals.
c) Non-linear Features
Since EEG signals are non-linear by nature, therefore capturing the EEG signals’ non-linearity is significant. In the proposed FESD model, non-linear features such as approximate entropy (ApEn) [1,35], Hurst exponent (H) [6,14] and fractal dimension (FD) [11,14] are calculated to inspect the EEG signal complexity, irregularity, and unpredictability. Mathematically,
Eq. (8) calculates approximate entropy where L represents the data length, n designates the number of samples, and s indicates the noise filter level. Eq. (9) [36] determines Hurst exponent value where R/S is rescaled range and T is the duration of the signal sample. For fractal analysis of EEG signals, Eq. (10) [37] employs Higuchi's algorithm to compute the fractal dimension of decomposed sub-band signals.
d) Pattern Features
In order to have information about the changing trends of EEG signals, pattern features have significant importance. This paper presents an algorithm to extract pattern features by utilizing 1D-LBP technique [16,38,39]. The proposed Algorithm1extracts histogram features from decomposed EEG signals sub-bands as described in Algorithm 1.
(i) One-Dimensional Local Binary Pattern
This technique is used to get pattern information from one-dimensional data such as time series. In the mathematical formulation given by [15], m consecutive samples of time series are considered for computing decimal LBP value of (m+1)/2th sample. Decision variable tj defines amplitude difference (Pj – Pmid) between the jth neighboring sample and the mid central sample. fj(tj) indicates bit value after applying the threshold condition mentioned in Eq. (12) . These bits generate a binary code that is converted to the decimal LBP value of the central sample.
For the current study, nine consecutive samples of time series are considered at a time, and an 8-bit binary code is obtained for each of the central samples.
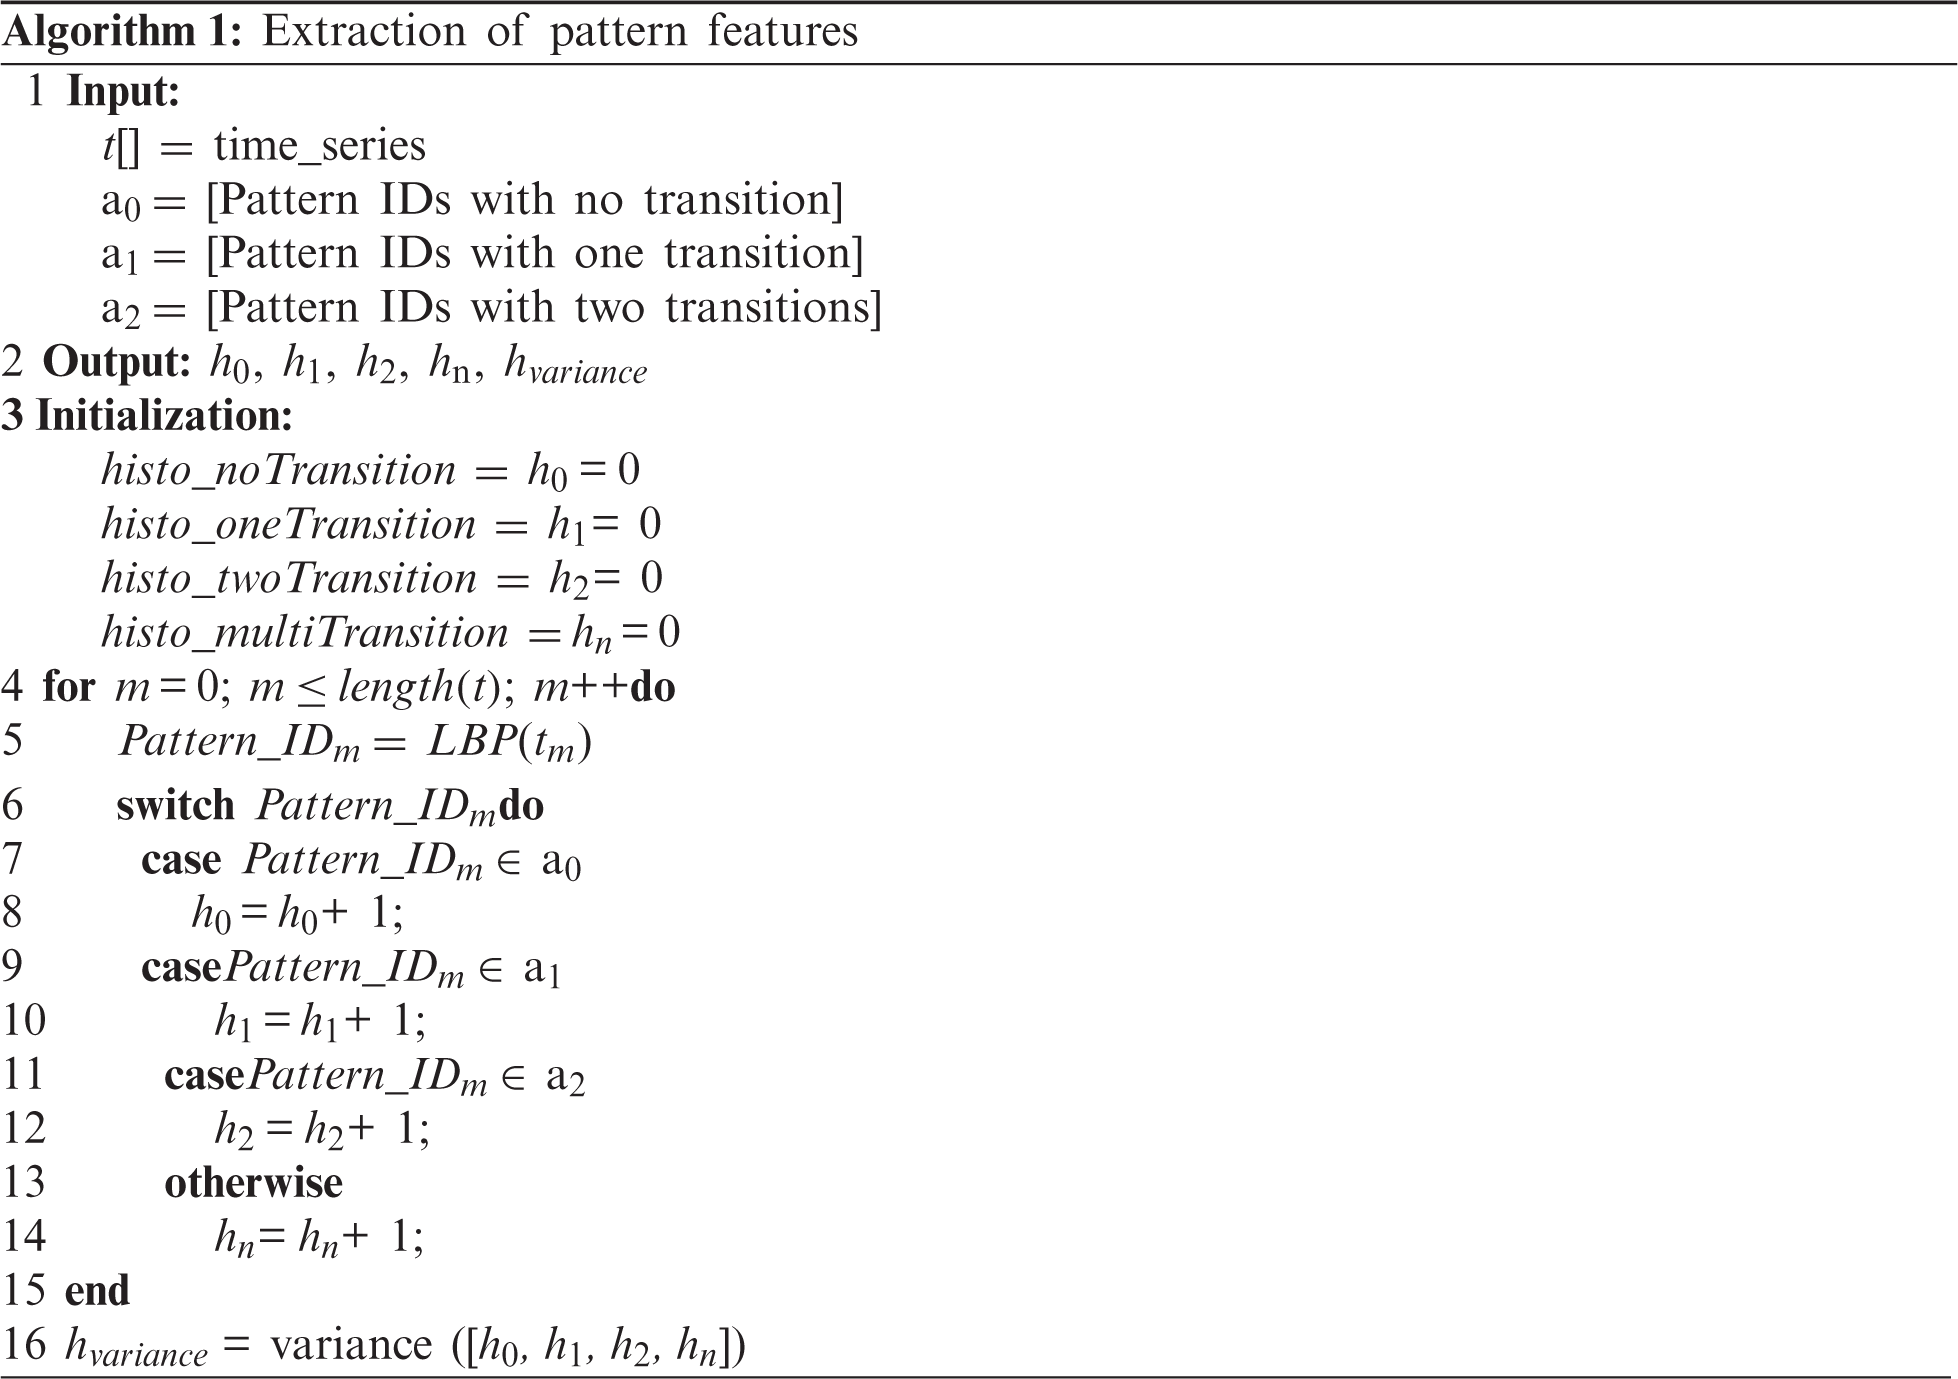
(ii) Algorithm1 Description
The proposed algorithm categorizes patterns of binary codes into four groups; no-change, one-change, two-change, and multi-change based on the number of bit-transitions. No-change designates those binary patterns in which the entire binary code contains either all zeros or all ones. One-change category groups those patterns where only one transition happens, either from zero to one or one to zero. In the two-change group, the binary code pattern shows two transitions of zero and one. However, the remaining patterns with more than two binary transitions in their codes are placed in the multi-change group.
According to Algorithm1, the input consists of EEG signal time series and three lists of decimal pattern ids with the varying number of transitions. Among these lists, a0 contains ids of no-change patterns, a1 is the list of one-change pattern ids and a2 includes ids, of two-change patterns. The algorithm outputs five pattern features, including four histograms h0, h1, h2, and hnthat designate the count of no-transition, one-transition, two-transition, and multi-transition patterns, respectively. The hvariancecomputes statistical variance among histograms. The initialization step assigns zero to all histogram features. In lines 4 and 5, the loop takes samples from input time series one by one and computes their LBP values. Line 6 applies switch statements on computed LBP values. If the LBP value exists in a0 then h0is incremented by one as shown in lines 7 and 8. If the value lies in a1, then h1is incremented by one as declared in lines 9 and 10. If the value belongs to a2, the value of h2 is incremented by one as given in lines 11 and 12. The remaining values increment hn by one as given in lines 13 and 14. The loop ends in line 15 and returns four histogram features. In the last line 16, the fifth pattern feature hvariance is computed by applying the statistical function of variance on the above obtained four histogram features.
In this feature selection phase, the most distinguishing features are chosen from the feature vector obtained by the proposed feature extraction method. Two major purposes of this step are the removal of redundant as well as low ranked features and selection of discriminating features. The extracted feature vector contains 14 features, including three temporal, three spectral, three non-linear, and five pattern features. In order to shortlist the extracted feature vector and select the most distinctive ones, a feature selection strategy is employed.
The proposed feature selection strategy includes InfoGain computation and application of ANOVA statistical test. Under this strategy, first InfoGain ranks the extracted features with respect to their usefulness and distinguishing ability. InfoGain is calculated by using Eq. (14) [34].
The top-ranked features are selected for ANOVA test that further purify the selection by choosing the most significant features among top-ranked features.
In the classifier building phase, the classification of EEG signals into three different classes, namely normal, inter-ictal, and ictal classes not only differentiate normal from epileptics but also seizure (ictal) and seizure-free (inter-ictal) states of epilepsy. In real-life classification cases, fuzzy logic-based algorithms are very useful where classes are overlapping. One of these scenarios is the classification process of EEG signals in which the algorithms must be capable of understanding the human brain EEG signals based on their characterizing features. For example, in EEG recordings, seizure signals have some features similar to non-seizure EEG segments and vice versa [11]. The similarity in seizure and non-seizure EEG segments adds complexity to decision making. Since fuzzy logic is highly effective in these situations, five fuzzy algorithms Fuzzy Nearest Neighbors (FNN), Fuzzy Unordered Rule Induction Algorithm (FURIA), Fuzzy Rough Nearest Neighbors (FRNN), Fuzzy Lattice Reasoning (FLR), and Vaguely Quantified Nearest Neighbors (VQNN) employed on an individual basis to determine the effectiveness of these techniques in EEG signals classification.
3.5.1 Fuzzy Unordered Rule Induction Algorithm (FURIA)
It is an extension of Repeated Incremental Pruning to Produce Error Reduction (RIPPER) [40] algorithm that implements a divide and conquer strategy to employ a greedy approach for classification rules learning [41]. It learns a fuzzy unordered set of rules in two phases: rule growing phase and rule optimization phase. The measure of InfoGain (IG) is used to calculate the improvement in a particular rule for the target class comparing to the default rule (without any antecedent). Mathematically,
In Eq. (15) [41], Pr designates a positive count that is the count of target class instances covered by the rule, while nr indicates negative count, which is the count of non-target class instances covered by the rule participating in the growing phase of rule learning. On the other hand, for the default rule, P is the count of positive instances and n representing the negative instance count. In the second phase of rule optimization, the built rule set is re-examined by activating the pruning strategy of antecedents’ removal.
3.5.2 Fuzzy Nearest Neighbors (FNN)
In this classifier, the similarity of K neighbors nearest to a test instance and membership degrees of these closely located neighbors to the existing classes are considered for classification of testing instance [42]. The basis of the algorithm is to assign membership as a function of the test instance's distance from its K-nearest neighbors and those neighbors’ memberships in the possible classes [43]. The membership of K neighbors provides information to classify the test object. The computation of the membership degree
In Eq. (16), m indicates a set of K nearest neighbors of object t and S(a, t) pointing towards the fuzzy similarity value between t and the neighboring object a. It is [0, 1]-valued similarity of a and t, that is traditionally defined as follows [44].
where
3.5.3 Fuzzy Rough Nearest Neighbors (FRNN)
In this algorithm, FNN is combined with fuzzy rough approximations [45]. FNN determines the neighbors closely located to the classifying object, while fuzzy rough approximations obtain lower and upper fuzzy approximations of available classes. Let D is the set of decision classes, and the procedure for output class is given as follows [44]:
where R is the fuzzy tolerance relation [44]. The high value of upper approximation
3.5.4 Vaguely Quantified Nearest Neighbors (VQNN)
VQNN is derived from making variations in FRNN algorithm [46]. In this algorithm, Vaguely Quantified Rough Set (VQRS) approximation quantifiers “some” and “most” are used as lower and upper approximations, respectively. Unlike conventional approximations, the algorithm approximations are not drastically affected by changing a single object; therefore, these approximations also suffer less by noise impact. This characteristic of VQRS approximations makes them a favorite comparatively. In this algorithm, lower approximation or
3.5.5 Fuzzy Lattice Reasoning (FLR)
It is a classifier for inducing a rule-based inference engine from data based on the fuzzy lattice framework [48]. In this framework, a partially ordered set is called a Lattice L, and two lattice elements
In this phase, classifier evaluation is performed by 70 and 30 percent split of input EEG data for training and testing purposes, respectively. The training data is used to train the fuzzy logic-based five fuzzy classifiers, namely, FURIA, FLR, FNN, FRNN, and VQNN. These classifiers build their classification models on the basis of selected feature vectors and classify test data into normal, inter-ictal, and ictal classes. The built models are evaluated by means of three performance metrics: accuracy, sensitivity, and specificity. These performance measures are defined in the following formulas.
In above Eqs. (18)–(20) [33], Acc. (%), Sen. (%), and Spec. (%) designated as percent accuracy, sensitivity, and specificity respectively. TN, FP, TP, and FN stand for True Negative, False Positive, True Positive, and False Negative, respectively. TN specifies the count of non-seizure cases accurately classified as non-seizure, while FP represents the count of non-seizure signals falsely classified as seizures. TP indicates the number of seizure signals correctly predicted as seizures, and FN states the count of seizure recordings incorrectly predicted as non-seizure.
4 Experiments and Results Discussion
This section summarizes classification results obtained by using the Bonn dataset [31]. Furthermore, a comparative analysis with prior works is performed in Section 5 for multiple classification cases on the basis of accuracy percentage. The accuracy results of the proposed FESD model are also comparatively analyzed for 10-fold cross-validation and 70/30 split of data.
In this study, the Bonn dataset, including five subsets of EEG signals, is used to perform experiments. The Python programming language, along with MySQL database, is used for feature extraction. Moreover, fuzzy Waikato Environment for Knowledge Analysis (WEKA) toolbox that provides a collection of fuzzy machine learning algorithms along with traditional classification algorithms is utilized not only for classifier building and evaluation but for feature selection as well. In this paper, fuzzy logic-based five fuzzy classifiers, FNN, FRNN, VQNN, FURIA, and FLR, are used to evaluate ten classification cases in terms of accuracy, sensitivity, and specificity performance measures.
In order to evaluate the proposed FESD model, ten classification cases are performed to distinguish seizure EEG signals from non-seizure ones. These classification cases are A-E, B-E, AB-E, C-E, D-E, CD-E, ABCD-E, AB-CD-E, A-D-E, and A-B-C-D-E. Among two-class classification cases, A-E, B-E, and AB-E refer to the normal vs. epileptic classification, while C-E, D-E, and CD-E point towards inter-ictal vs. ictal classification. On the other hand, ABCD-E represents seizure vs. non-seizure classification where non-seizure includes EEG signals collected from normal individuals as well as epileptic patients in the inter-ictal state. The three-class classification cases, namely A-D-E and AB-CD-E indicate the classification between normal, inter-ictal, and ictal classes. For the five-class classification case A-B-C-D-E, each class description is summarized in Tab. 2.
4.2.1 Two-class Classification Cases
This study is working on seven such cases in which two-class classification is discussed. These classification cases are further categorized into the following three subtypes.
a) Normal vs. Seizure
This type of two-class classification includes A-E, B-E, and AB-E classification cases. Tabs. 3 and 5 demonstrate the experimental results, and Fig. 4 shows the graphical representation of these cases for five classifiers. In the first case, A-E, all fuzzy classifiers except FNN achieved 100% accuracy, sensitivity, and specificity. For FNN, accuracy and sensitivity results declined to 96.67% and 93.33%, respectively. In the second case B-E, the performance of FRNN and VQNN is superior as compared to others because both of the classifiers achieved 100% classification accuracy, sensitivity, and specificity. On the other hand, FLR and FURIA achieved 96.67% accuracy with 100% sensitivity and 93.33% specificity while FNN showed the least performance of 91.67% accuracy. In the third case, AB-E, FRNN, VQNN, and FLR performed the best due to their 100% results for all three parameters. However, FURIA obtained less accuracy of 98.89% due to less sensitivity percentage. For FNN, similar to the prior cases, the accuracy percentage declined to 90%. Overall, FRNN and VQNN showed the best performance in above-discussed classification cases.

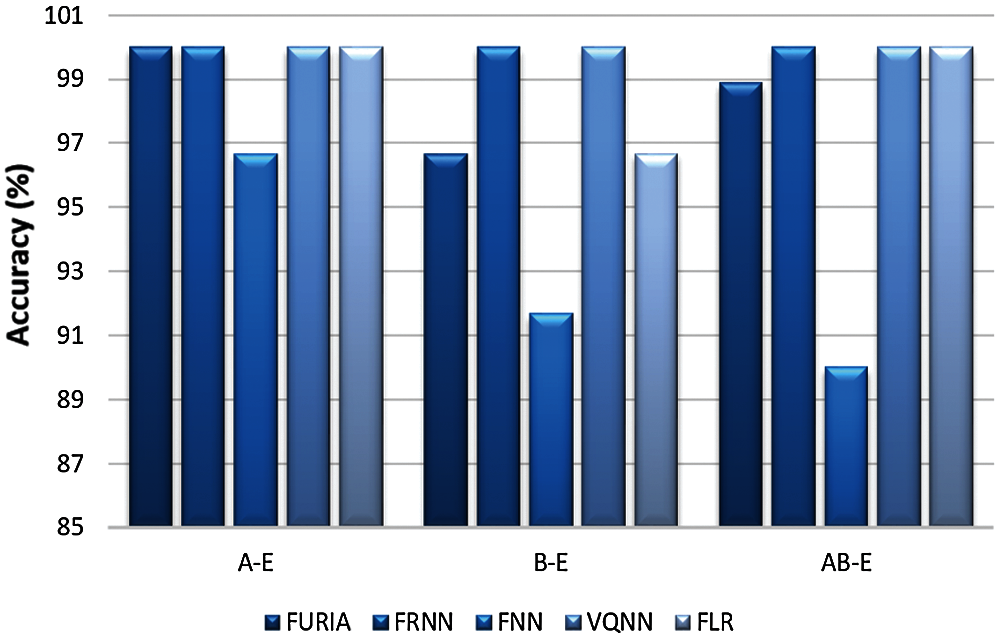
Figure 4: Comparative accuracy of classifiers for normal vs. seizure classification
b) Inter-ictal vs. Seizure
In C-E, D-E, and CD-E classification cases, EEG segments are classified into inter-ictal and seizure classes. The results of these cases are outlined in Tabs. 4 and 5, and Fig. 5 plots the graphical representation. According to the measurements, for C-E classification case, two classifiers FRNN and VQNN showed equivalent performance of 98.33% accuracy with 100% specificity. However, FURIA and FLR gained comparative results with 96.67% accuracy and 100% sensitivity. In D-E classification case, VQNN and FURIA achieved the best classification accuracy of 100% while FRNN and FLR achieved 98.33% accuracy with 100% specificity and sensitivity, respectively. In the third classification case CD-E, FRNN, and VQNN showed convincing results with 98.89% accuracy and 100% specificity. But other classifiers FLR, FNN, and FURIA could not show better performance. Overall, in the above discussed three cases, VQNN proved the best for accuracy, sensitivity, and specificity metrics.
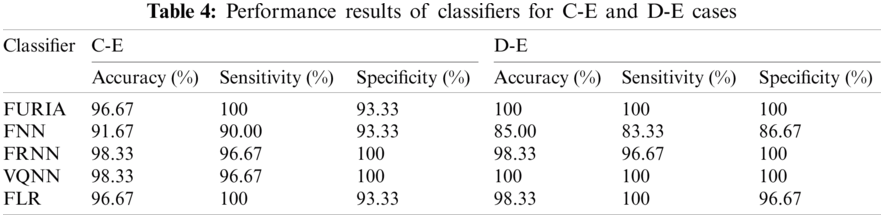


Figure 5: Comparative accuracy of fuzzy classifiers for inter-ictal vs. seizure classification
c) Non-seizure vs. Seizure
Only one classification case ABCD-E is concerned with seizure vs. non-seizure classification, where non-seizure includes both normal and inter-ictal. Tab. 6 describes the corresponding empirical results, and Fig. 6 demonstrates the results graphically. In the plotted results, FRNN achieved the highest results with 99.33% accuracy and 100% sensitivity. In the case of VQNN and FURIA, the accuracy percentage reached 98.67%, while the sensitivity of VQNN and specificity of FURIA achieved 100% rate. On the other hand, FLR showed average performance with 97.33% accuracy, but FNN obtained the lowest classification accuracy of 90.67%.
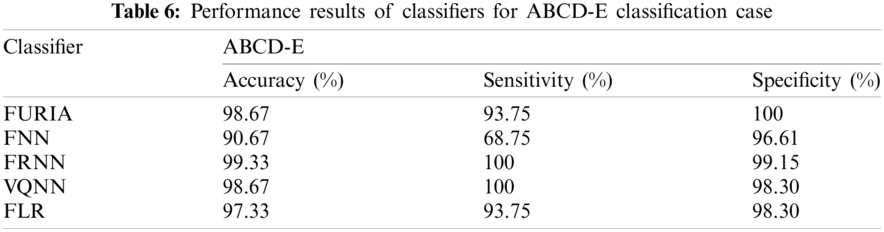
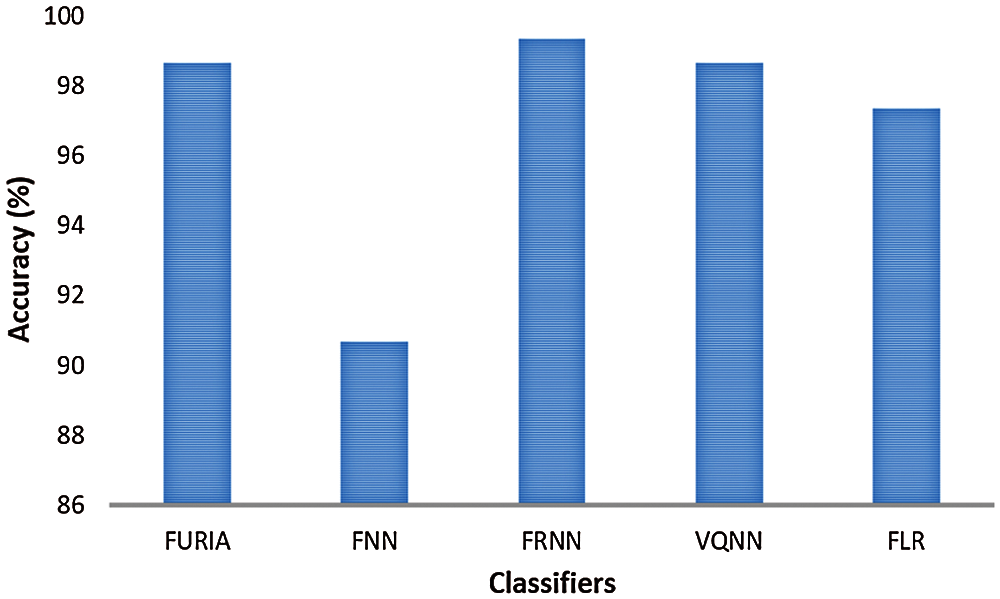
Figure 6: Comparative accuracy of classifiers for non-seizure vs. seizure classification
4.2.2 Three-Class Classification Cases
The classification of EEG into three classes is a difficult task as compared to two-class classification cases. In this study, A-D-E and AB-CD-E are three-class classification cases. These cases refer to classification between normal, inter-ictal, and seizure classes. Tab. 7, Tab. 8 and Fig. 7 demonstrate the obtained results for discussed classification. In the first case of A-D-E, remarkable performance was achieved by FRNN and VQNN classifiers with classification accuracy of 97.78%. In FURIA, accuracy percentage was 96.67%, and sensitivity (ictal), as well as specificity, was 100%. The remaining classifiers did not show impressive performance. Similar to the previous case, for the second classification case of AB-CD-E, FRNN and VQNN demonstrated the highest accuracy rate of 94.67% and 94.00%, respectively. The performance of FURIA was notable with 93.33% accuracy and 100% specificity. Overall, FRNN showed inspiring results while FNN presented the least performance in both cases.
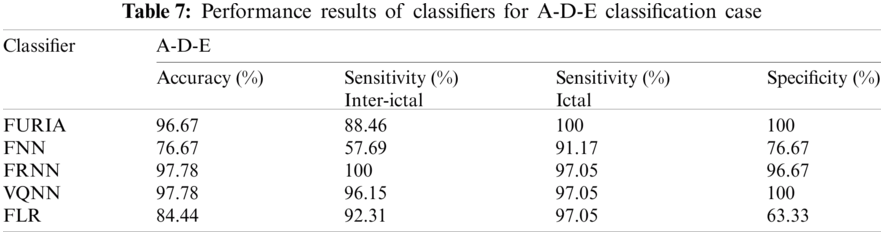


Figure 7: Comparative accuracy of classifiers for normal, inter-ictal, and ictal classification
4.2.3 Five-Class Classification Case
In this case, EEG signals are classified into five classes A, B, C, D, and E. Thus, empirical evaluation of A-B-C-D-E is presented in Tab. 9 and plotted in Fig. 8. The evaluation results illustrate that FRNN has been proved as a better classifier as compared to the others with 82% accuracy and 96.87% sensitivity (ictal). For VQNN, comparable performance was obtained by 80.67% accuracy and 100% sensitivity (ictal) results.
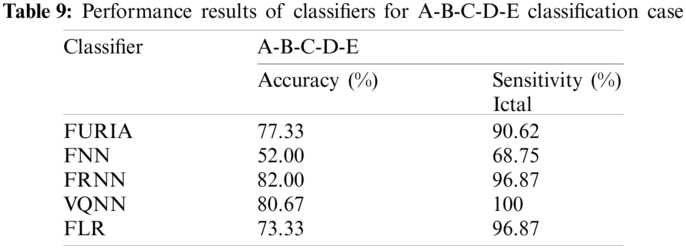
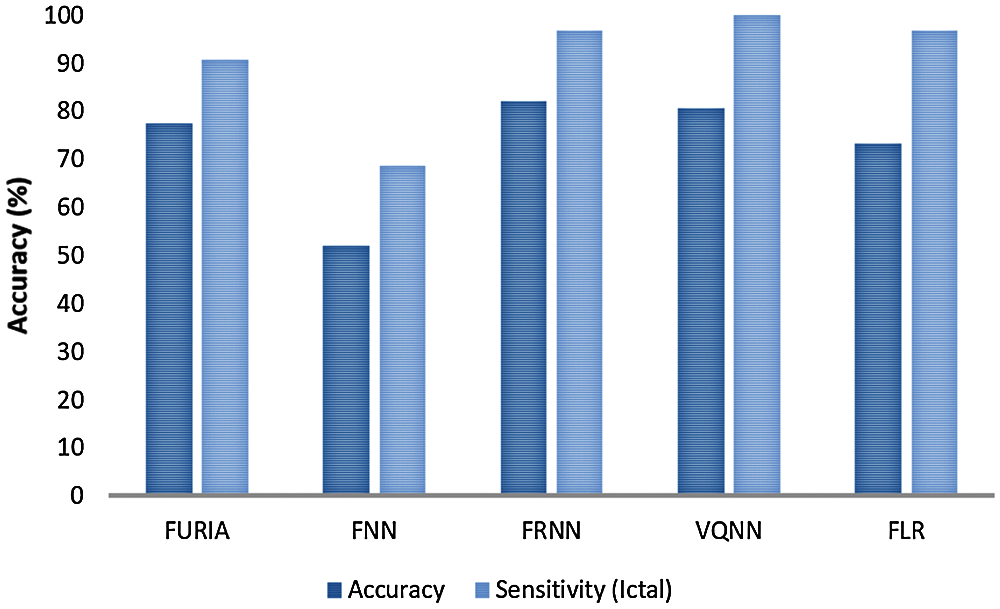
Figure 8: Comparative accuracy and sensitivity of classifiers for five-class classification
4.3 Analysis of Different Feature Types
This section analyzes the effectiveness of different types of features in the proposed feature vector. In order to perform this analysis, experiments were conducted with temporal, spectral, non-linear, and pattern features separately for ten classification cases. The comparison of experimental results for different feature types using the FRNN classifier is shown in Figs. 9a and 9b. As reported in Fig. 9a, for two-class classification, temporal features obtained better accuracy for A-E, B-E, C-E, and D-E cases. On the other hand, spectral and non-linear features were dominant in AB-E and ABCD-E. For CD-E, pattern features were at the top. According to Fig. 9b, for three-class and five-class classification, spectral features obtained prevailing accuracy while the remaining features showed inferior performance. In comparison to different feature types, the proposed feature vector of the FESD model provided the highest accuracy percentage for all classification cases.

Figure 9: (a) Comparison of different feature types for two-class classification cases (b) Comparison of different feature types for three and five-class classification cases
This section analyzes the effectiveness of different types of features in the proposed feature vector. In order to perform this analysis, experiments were conducted with temporal, spectral, non-linear, and pattern features separately for ten classification cases. The comparison of experimental results for different feature types using the FRNN classifier is shown in Figs. 9a and 9b. As reported in Fig. 9a, for two-class classification, temporal features obtained better accuracy for A-E, B-E, C-E, and D-E cases. On the other hand, spectral and non-linear features were dominant in AB-E and ABCD-E. For CD-E, pattern features were at the top. According to Fig. 9b, for three-class and five-class classification, spectral features obtained prevailing accuracy while the remaining features showed inferior performance. In comparison to different feature types, the proposed feature vector of the FESD model provided the highest accuracy percentage for all classification cases.
4.4 Analysis of Effectiveness of Feature Selection
This section analyzes the significance of the proposed feature selection strategy by conducting experiments with and without it. Fig. 10 demonstrates that the selection of the most distinguishing features using InfoGain and ANOVA test enhanced the percentage accuracy of CD-E, ABCD-E, A-D-E, AB-CD-E, and A-B-C-D-E classification cases.
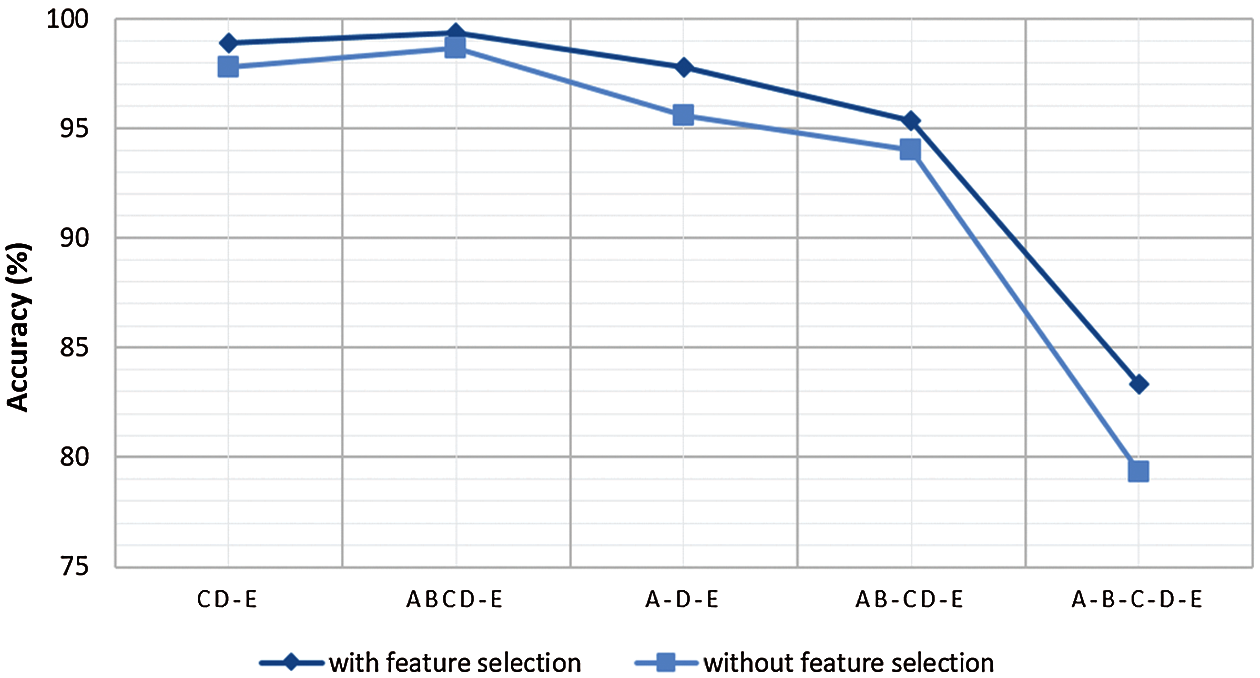
Figure 10: Comparison of classification accuracy with and without feature selection
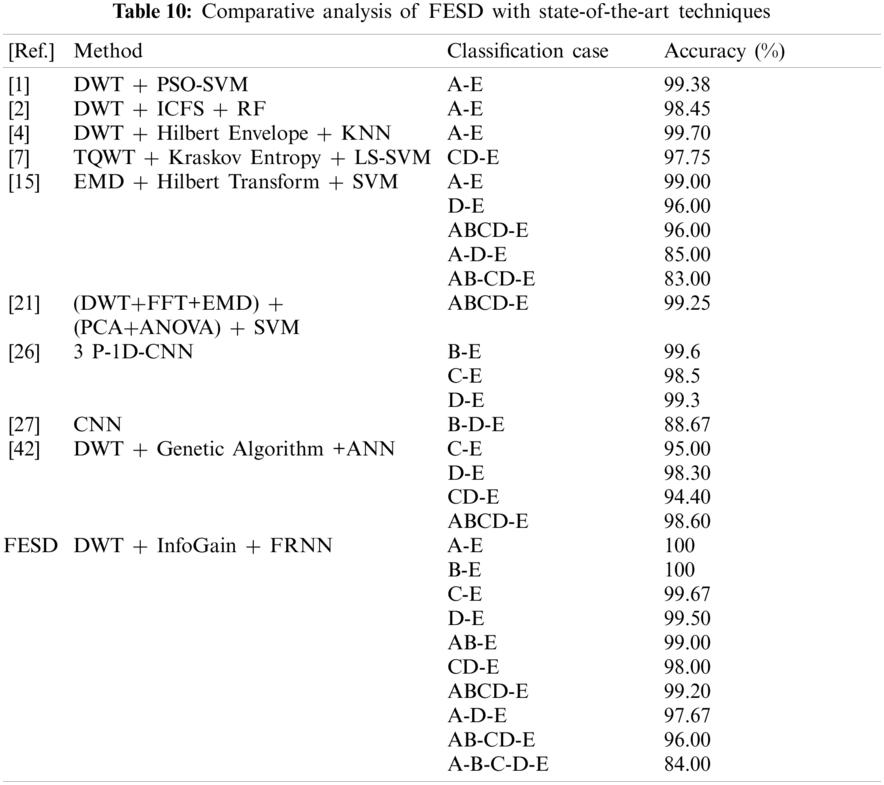
This section is dedicated to comparing the proposed FESD methodology with recent literature works of epileptic seizure detection using the Bonn dataset.
In prior studies [1–13], most of the research works performed 10-fold cross-validation in evaluating the proposed methodologies. The accuracy percentages of the prominent research for different classification cases are demonstrated in Tab. 10. This table describes the accuracy results of various classification cases under the Bonn dataset. In order to align with and perform a comparison with the literature, the proposed FESD framework is implemented with 10-fold cross-validation. The results of the highest percentage are in boldface to depict the effectiveness of the corresponding method.
The comparative analysis in Tab. 10 shows that the FESD method presented a higher performance for five classification cases A-E, D-E, CD-E, A-D-E, and AB-CD-E. In ABCD-E, the percentage accuracy of the proposed method is 0.05% less than the other existing studies, but for the remaining cases, accuracy is promising.
The current work analyzed the proposed FESD model in terms of ten classification cases of the Bonn dataset. Each classification case was implemented with five fuzzy classifiers individually using 70/30 split ratio of the data. The empirical results demonstrated that FRNN and VQNN showed remarkable performance; however, FRNN proved the best. The proposed feature extraction and feature selection strategies were also analyzed experimentally with FRNN to be the best ones. To analyze feature extraction method, the proposed model was implemented with different feature types as well as proposed feature vectors separately. The percent accuracies depicted the superiority of the proposed feature vector as compared to the different feature types. In order to analyze the effectiveness of the proposed feature selection strategy on classification accuracy, experiments were conducted with and without feature selection. The obtained results confirmed the importance of feature selection strategy in order to achieve better classification accuracy for epileptic seizure detection.
In addition, the proposed epileptic seizure detection framework was also evaluated with 10-fold cross validation to compare recently introduced literature in terms of percent accuracy for the Bonn dataset. This comparative analysis proved the outstanding performance of the proposed FESD model for epileptic seizure detection.
Epilepsy is a common mental disorder that disrupts the normal mental activity. It not only negatively affects the brain functionality but also physically disturbs the patient. In this research work, we have studied and critically evaluated the machine learning-based epileptic seizure detection methods in order to point out existing challenges and limitations. After a critical analysis, it has been concluded that existing approaches have flaws to cater with the unobvious behavior of EEG signals due to its non-stationary nature. So, it is needed to work on an automatic system for feature extraction, selection, and classification tasks to better capture the morphology of non-linear and non-stationary EEG signals. For this purpose, the FESD model was proposed that introduced an improved features extraction method and a feature selection strategy for building classification models in fuzzy classifiers. In comparison to the existing techniques, the proposed model achieved better accuracy results for ten classification cases along with FRNN and VQNN fuzzy classifiers. The results provided 100% accuracy for normal vs. ictal (A-E, B-E) classification and 99% accuracy for inter-ictal vs. ictal (C-E, D-E) classification. To classify EEG signal recordings into three classes of normal, inter-ictal, and ictal (A-D-E), the achieved accuracy was 97.67%.
In this work, we have focused on the classification of individuals into normal, inter-ictal, and ictal classes but did not consider pre-ictal and post-ictal states of the patient. The proposed approach can be improved by taking into account the pre-ictal and post-ictal regions in EEG recordings. Furthermore, the proposed model was evaluated on the small single-channel dataset, which in future can be evaluated on a large-scale real-world dataset. In addition, one of the future directions can be to introduce a framework by which normal individuals and epileptic patients could be further categorized into different severity levels of disorder for their better medical treatment.
Funding Statement: This work was supported by the Basic Science Research Program through the National Research Foundation of Korea (NRF) funded by the Ministry of Education (Grant No. NRF-2020R1I1A3074141), the Brain Research Program through the NRF funded by the Ministry of Science, ICT and Future Planning (Grant No. NRF-2019M3C7A1020406), and “Regional Innovation Strategy (RIS)” through the NRF funded by the Ministry of Education.
Conflicts of Interest: The authors declare that they have no conflicts of interest to report regarding the present study.
 | This work is licensed under a Creative Commons Attribution 4.0 International License, which permits unrestricted use, distribution, and reproduction in any medium, provided the original work is properly cited. |