DOI:10.32604/sv.2020.05055
| Sound & Vibration DOI:10.32604/sv.2020.05055 | |
| Article |
Condition Monitoring of an Industrial Oil Pump Using a Learning Based Technique
1Distributed and Intelligent Optimization Research Laboratory, Department of Electrical Engineering, Amirkabir University of Technology, Tehran, 1591634311, Iran
2Department of Computer Engineering, Amirkabir University of Technology, Tehran, 1591634311, Iran
3Department of Electrical Engineering, Amirkabir University of Technology, Tehran, 1591634311, Iran
*Corresponding Author: Amir Abolzafl Suratgar. Email: a-suratgar@aut.ac.ir
Received: 19 December 2018; Accepted: 18 July 2020
Abstract: This paper proposes an efficient learning based approach to detect the faults of an industrial oil pump. The proposed method uses the wavelet transform and genetic algorithm (GA) ensemble for an optimal feature extraction procedure. Optimal features, which are dominated through this method, can remarkably represent the mechanical faults in the damaged machine. For the aim of condition monitoring, we considered five common types of malfunctions such as casing distortion, cavitation, looseness, misalignment, and unbalanced mass that occur during the machine operation. The proposed technique can determine optimal wavelet parameters and suitable statistical functions to exploit excellent features via an appropriate distance criterion function. Moreover, our optimization algorithm chooses the most appropriate feature submatrix to improve the final accuracy in an iterative method. As a case study, the proposed algorithms are applied to experimental data gathered from an industrial heavy-duty oil pump installed in Arak Oil Refinery Company. The experimental results are very promising.
Keywords: Condition monitoring; fault assessment; industrial pump; genetic algorithm; wavelet packet decomposition
 | This work is licensed under a Creative Commons Attribution 4.0 International License, which permits unrestricted use, distribution, and reproduction in any medium, provided the original work is properly cited. |
Maintenance and repair costs are often known to be the heaviest charges in industries. Various studies have been conducted on condition monitoring of equipment in industrial processes and have long been discussed by scientists in systems dynamic field. By choosing the appropriate way of maintenance, it may greatly reduce costs, machine downtimes, and spare parts consumption and improves the reliability of machines which consequently increases the safety of machine operators. Hereof, health evaluation and fault detection have been done by a series of measurements on the data carrier signals like vibration, acoustic emission, and temperature profile records by the properly mounted sensors. For accurate measurements and better expressing the structural dynamic behavior of a machine, vibrations are the most common indicator of failure occurrence in the machine operating time. Concerning this, signal processing techniques have always been efficient tools that are used regularly by researchers. Among all techniques, Time-Frequency transforms based on wavelets have been more popular due to their properties to represent the abnormalities and unpredictable components localized in the time domain [1,2] which always come from corrosion, damaged parts, and exhaustion. However, the difficulties of determination of the enormous numbers of uncertain parameters have made their application more difficult in wavelet transform and interpretation of the results. In this context, [3] compared the wavelet packet energy with the corresponding entropy to achieve the maximum diagnosis accuracy. He also investigated the effect of the level of wavelet packet decomposition on the final results. Besides, the application of the fuzzy logic approach is another effective method used in health monitoring of cooling fan bearings in electronic products. In this method, a fuzzy rule was proposed to find the optimal wavelet parameters that can maximize the characteristic feature of bearing faults. Hence, they found that the proposed approach was more effective than the traditional CWT, DWT, and time-domain analysis in bearing health monitoring [4]. Empirical wavelet transform (EWT) is another hybrid method that can achieve good performance in the detection of faults that occurs in rolling bearings. The EWT method combines the classic wavelet with the empirical mode decomposition which is suitable for the non-stationary vibration signals [5]. It seems that the general idea of using further mathematical techniques sounds interesting in the condition monitoring field. Another great technique is the adaptive redundant multiwavelet packet (ARMP) method which was proposed for the compound-fault diagnosis. Multi wavelet structure described in ARMP was optimized by taking multifractal entropy as an optimization objective in the construction process. Finally, the utilization of the ARMP technique in combination with Hilbert transform demodulation analysis can effectively identify and detect the compound-fault of mechanical equipment [6]. On the other hand, the application of novel machine learning tools causes a great challenge for improving the performance of fault detection tasks. In this method, the SVM classifier [7,8], the RBF Neural Network [9], the Decision Trees [10], etc. are common tools to detect the faults. This paper presents a hybrid method for pump fault diagnosis based on feature extraction and selection technique which profits from full WPD tree, genetic algorithm, and ANN classifier ensemble. Moreover, to reduce the possible environmental noise affected by other equipment around the machine, the wavelet denoising is applied to the raw data. Wavelet packet decomposition is considered as the feature extractor because of its efficiency in exploiting high and low-frequency contents from the original signal and subsequently, a statistical feature is calculated in the feature domain on wavelet coefficients. Concurrently, the genetic algorithm optimizes four candidates to select the most salient features. Finally, optimal features are assigned to five output categories using an artificial neural network. As depicted in Fig. 1, the developed algorithm is split into training and test phases. The training data are fed into the algorithm to choose optimum values along with specified iterations. When the training is finished, the parameters are assigned to their optimum values to construct the desired feature set. The entire block diagram will be described in detail in the next sections.
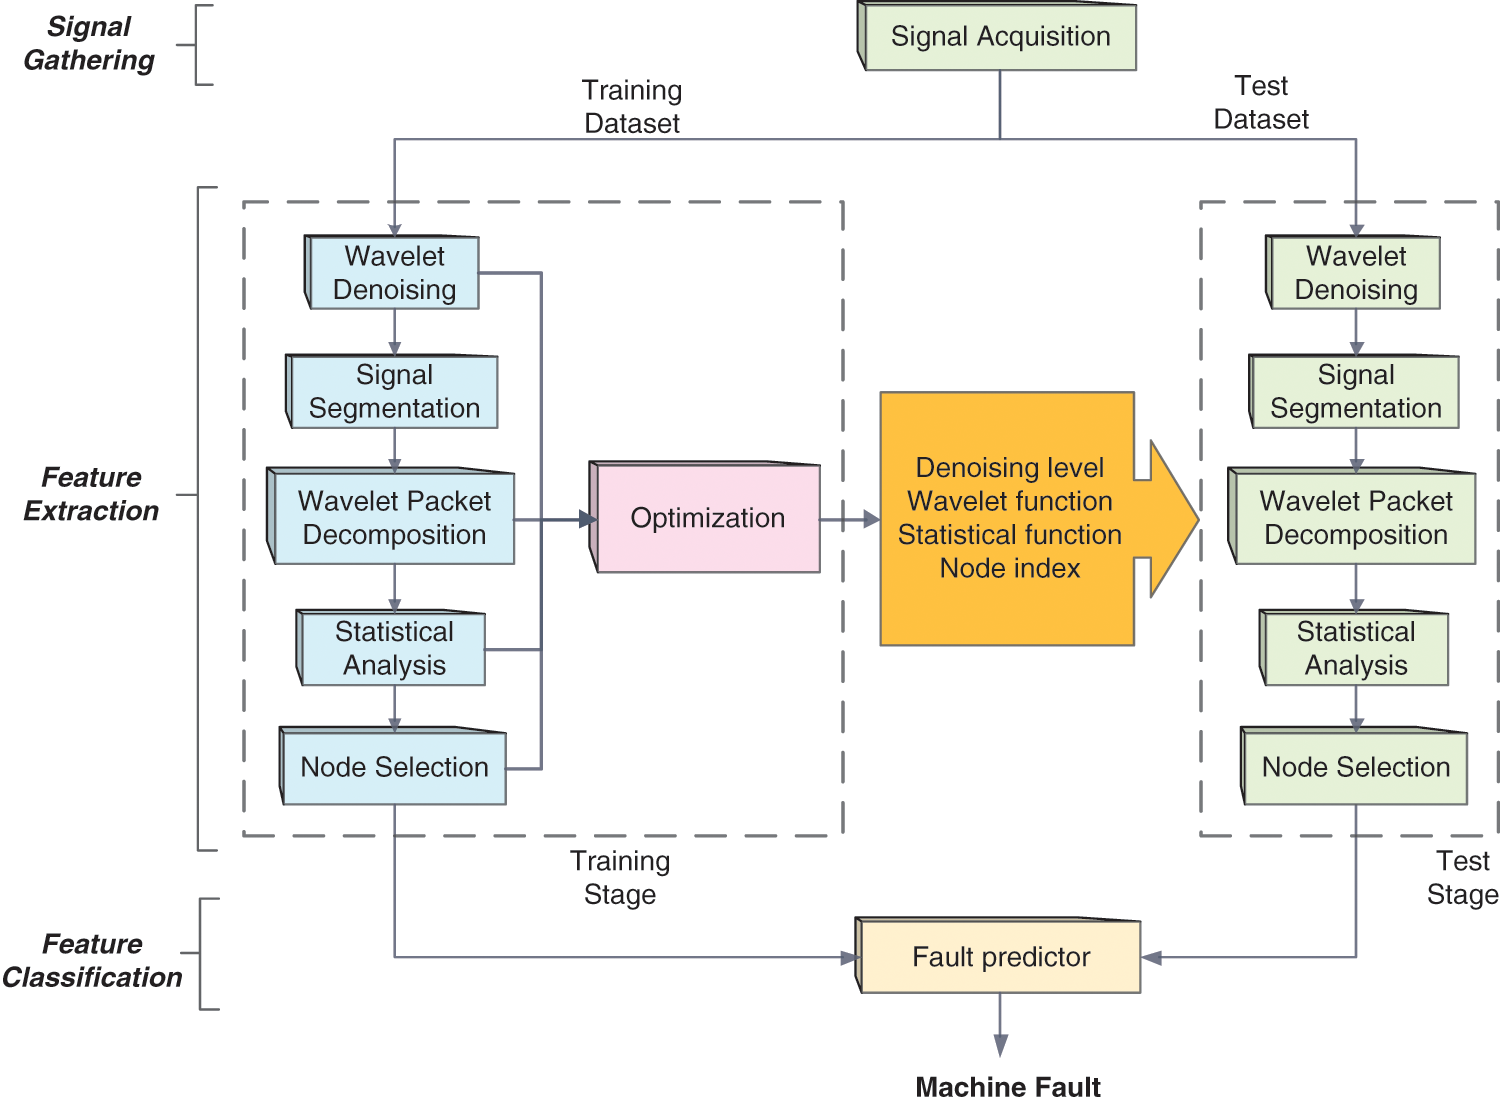
Figure 1: Entire block diagram of the proposed algorithm
To validate the effectiveness of the suggested procedure in this paper, the oil pump system installed in Imam Khomeini Oil Refinery Company located in Arak was utilized. The pump type is BB5 (High-Pressure Double Case Pump) made by Ebara company which is designed as radially split multi-stage and operates under the maximum flow rate of 1500 cubic meter per hour (m3/h). Fig. 2 demonstrates the oil pump system and mounted vibration transmitters on the case. During the sampling, the pump was working at a fixed speed of 49.6 Hz and we used the pre-mounted vibration sensor to measure the vibrations velocity in three directions (i.e., axial, horizontal, and vertical axes).
The most frequent faults which happen in a pump lifetime are analyzed in our practical study which includes casing distortion, cavitation, misalignment, looseness of interior components, and dynamically unbalanced mass. The examples of the measured signals in some machine conditions are shown in Fig. 3. These signals have been recorded for four years while the technical inspection team in the factory site annotated the cause of vibrations along with the overall maintenance program. Subsequently, by choosing the sampling frequency of 12 kHz, the number of 19200 samples was collected for each fault.
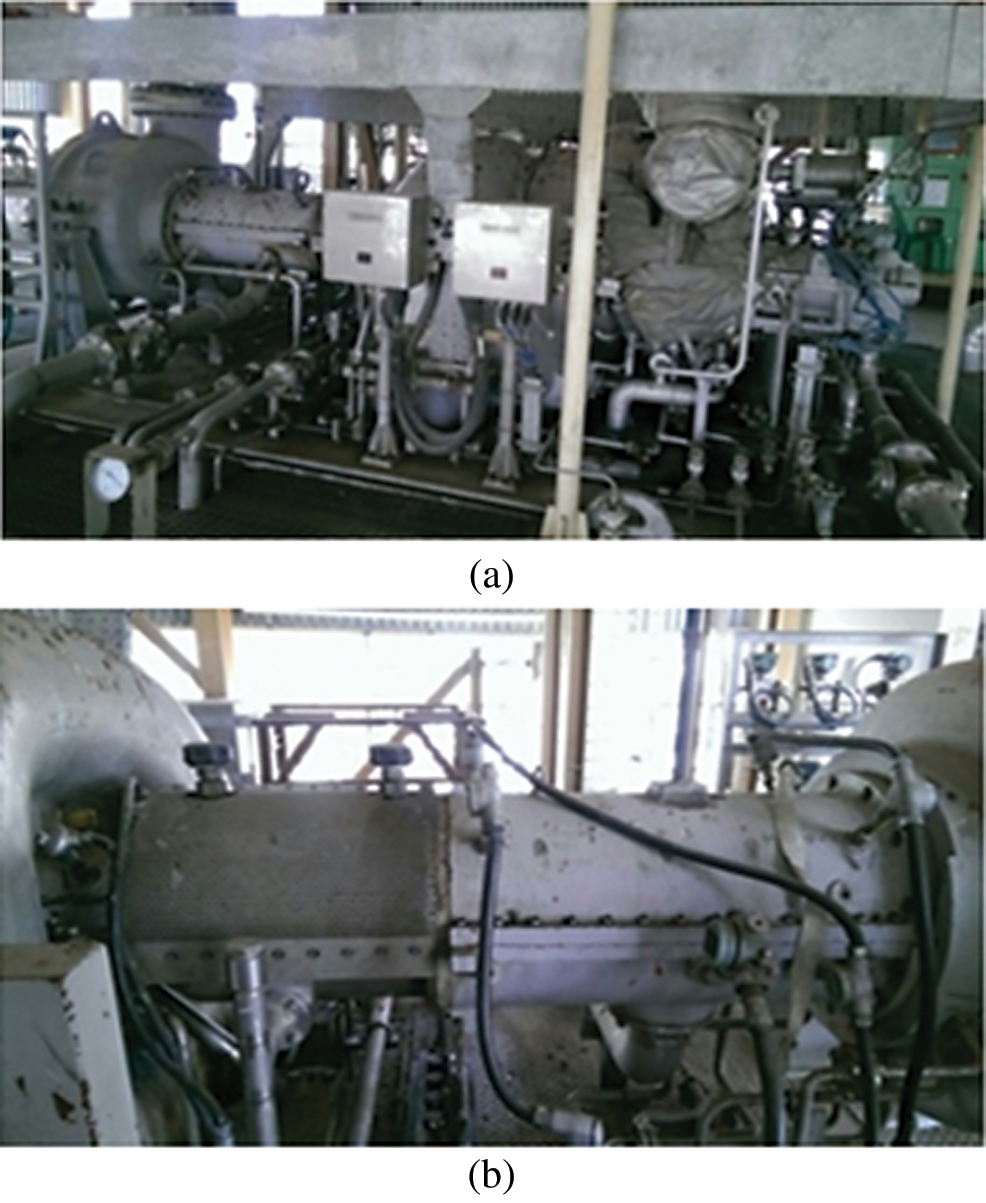
Figure 2: (a) The Ebara oil pump set up as a case study for fault diagnosis task, (b) Installed vibration transmitters
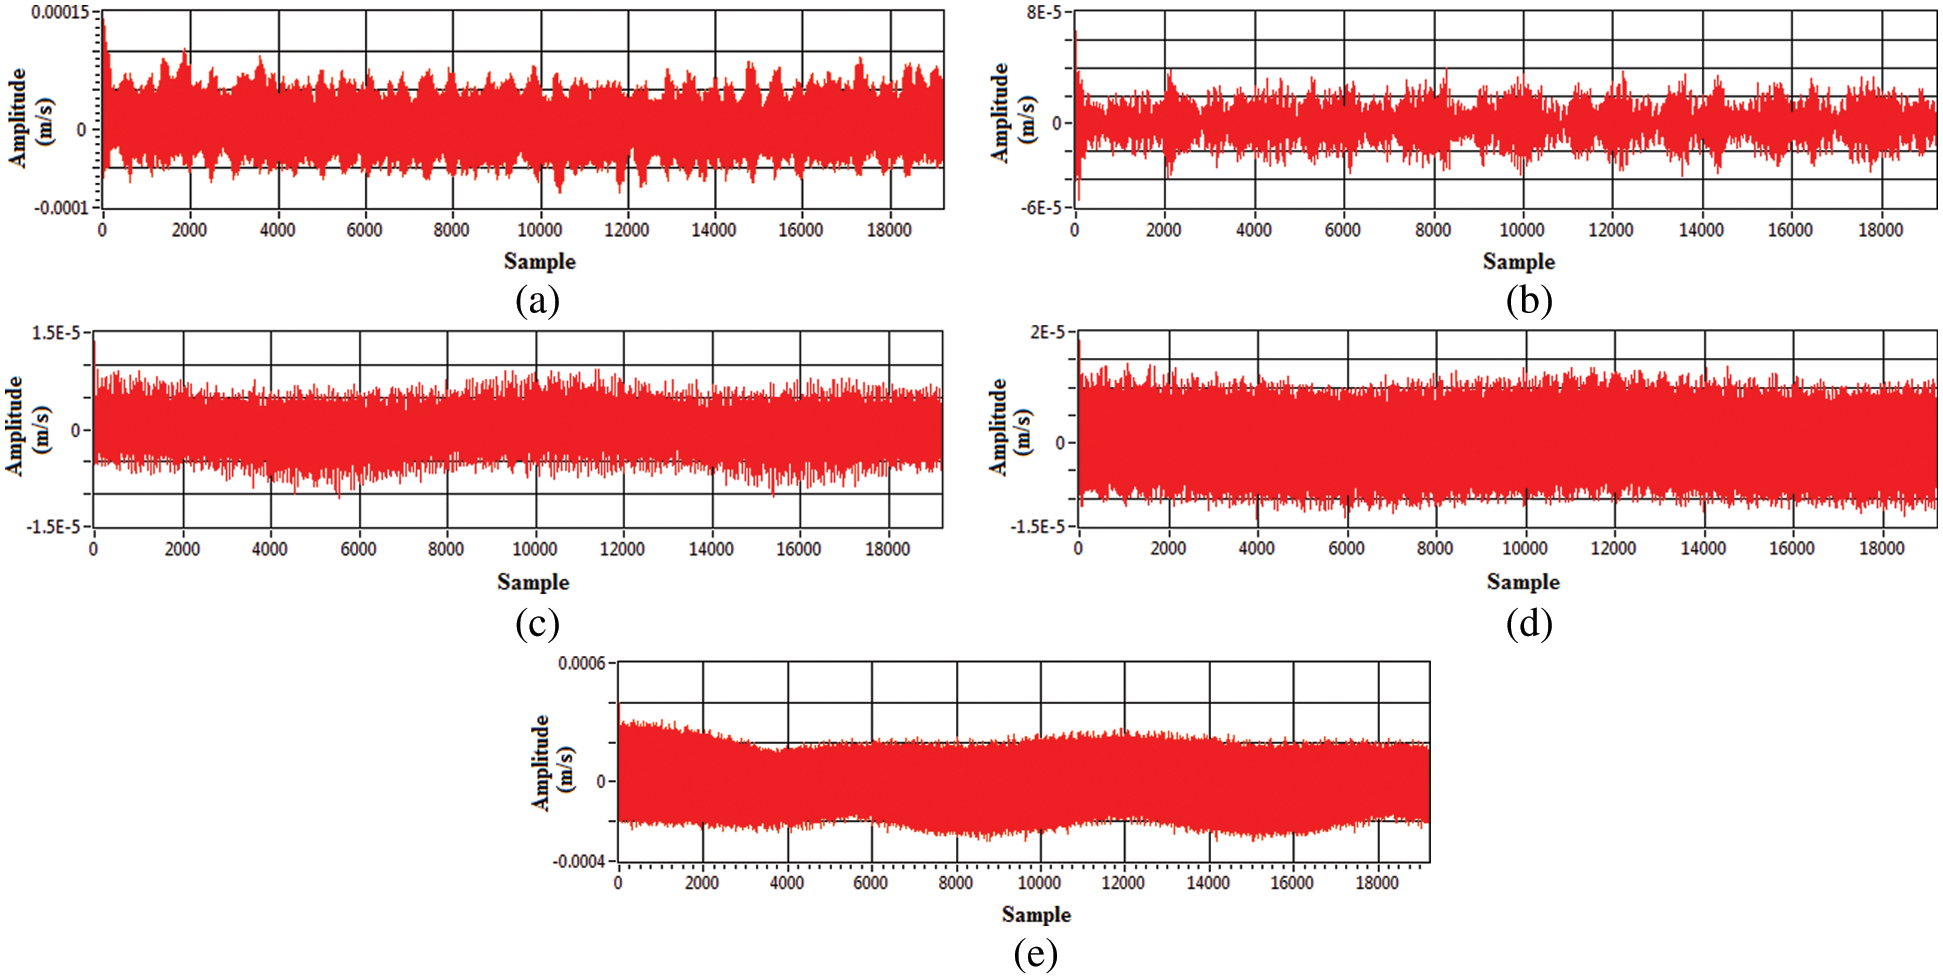
Figure 3: Measured vibration signals in axial direction: (a) Casing distortion, (b) Cavitation, (c) Looseness, (d) Misalignment, (e) Unbalanced mass
To analyze vibration signals with variable frequency content, the well-known time-frequency method of wavelet transform (WT) is used to investigate the local and global content in analyzed signals.
3.1 Wavelet Packet Transform Review
Wavelet packet transform is the generalized form of the discrete wavelet transform. It breaks down the frequency domain to slighter intervals as it increases the frequency resolution. Wavelet packet coefficients of a finite energy function f(t) with the wavelet packet functions Wj,k,n is given by the following equations [11]:


where  denote modulation, resolution, and translation index respectively. Besides, the wavelet function effects on are represented by the coefficients by Eqs. (3) and (4):


The implemented feature extraction technique consists of five main steps as follows:
1. Wavelet signal denoising/smoothing
2. Segmentation
3. Wavelet packet decomposition (WPD)
4. Statistical analysis
5. Node selection
In parallel to the mentioned activities on the analyzing signal, the genetic algorithm was applied to the problem and corresponding search domain to find the optimum values for uncertain parameters due to the binary coding capability. Mentioned activities are investigated in detail as follows:
Step 1: Environmental noises are everlasting parts of the recorded signals in real plants. To attenuate the effects of these undesirable noises on predicted outcomes, we have obtained the wavelet-denoising stage to make the signal smoother and generate more stable outputs. Thus, the decomposition level in the wavelet packet structure is considered to be the first candidate for the optimization process which determines the decomposition and reconstruction level of the examined signal. In this stage, “biorthogonal3-1” was chosen to approximate the signals because of its suitable properties in signal reconstruction.
Step 2: By our visual investigations, it seems that due to the rotary nature of the equipment, vibration signals act approximately the same in cyclic time intervals. Thus, to analyze the signals temporarily, we segmented the signals into 40 sections to preserve the similar behavior in new intervals.
Step 3: In this step, the WPD algorithm at decomposition level of four was evolved on whole sections of all fault signals. The main point in this step is the selection of the proper mother wavelet function which can represent signals appropriately. So, GA will consider the mother wavelet function as the second candidate for optimization [12] and will be found within a list of common wavelet function including Haar, db2, db3, db6, db9, db12, db14, Bior1.5, Bior2.8, Bior3.1, Bior3.5, Coif1, Coif3, Coif5, Sym3, Sym7 [13–15]. Note that one of the wavelets can be selected under the maximum fitness value resulted from GA. In Fig. 4, rows in the matrix signify the coefficients at final nodes in the WPD tree.
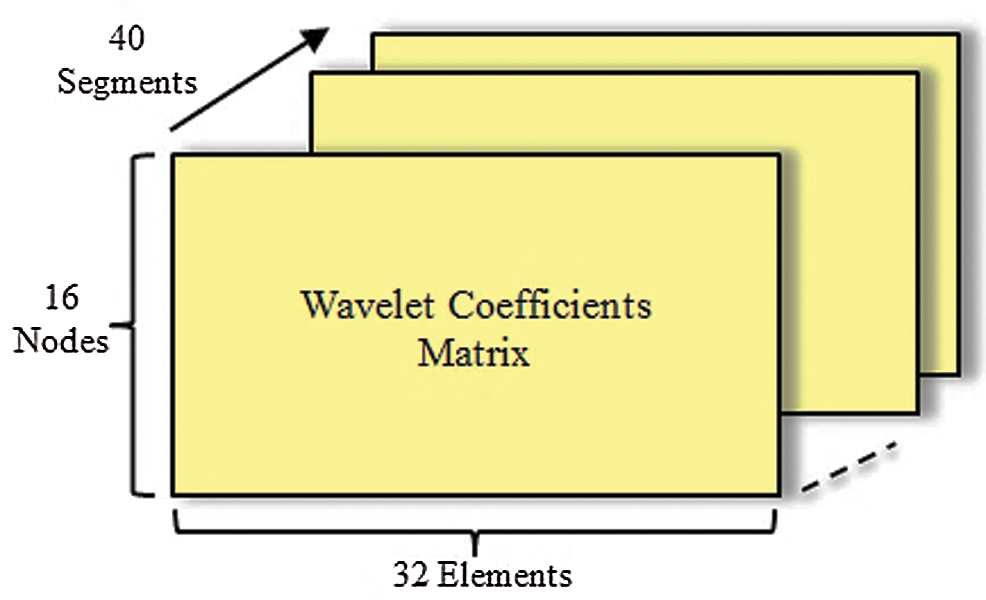
Figure 4: Coefficients matrix after applying the WPD tree
Step 4: To shorten the length of the generated coefficient matrix in the previous step and to overcome the computational complexity, all coefficients are subjected to statistical analysis. A statistical function is applied to coefficient vectors row by row. GA will seek an appropriate item among candidate functions including absolute mean, standard deviation, skewness, kurtosis, root mean square.
Step 5: The aim in this stage is to select the salient terminal nodes for two beneficial reasons: (1) To choose the most indicative features, (2) To reduce the needed CPU time for calculations; therefore, the last parameter for optimization is more effective wavelet nodes in the 4th level of WPD.
The inter-intra class criterion was employed as a score function to separate different faults in the optimization process which provides class discrimination information over the training set [16]. This measure uses the Euclidean distance between pairs of samples in the training set and shows the ratio of average scattering between classes ( ) and scattering within classes (
 ) under Eqs. (5)–(7). We expect that as this score function increases, it will ultimately improve the prediction performance.


where  and
and  are the number of features in each class and the entire number of samples in the data set, correspondingly. Maximum number of classes is denoted by “K” and
  and
and  represent
  sample in the entire set and
 in
in  class similarly.


 and
and  are sample mean of classes and sample mean of the entire set, respectively and
  stands for inter/intra class criterion function.
To verify the capability, the proposed method was implemented in Labview 2010 software. We used the “Inter/Intra class” criterion as an optimization fitness function [17] and a multi-layer perceptron with 30 × 20 × 5 neurons to separate different machine fault classes. The adjusting hyper parameters of GA were found by trial and error to achieve acceptable converging GA score which are described in Tab. 1.
Table 1: Hyper parameters values for GA
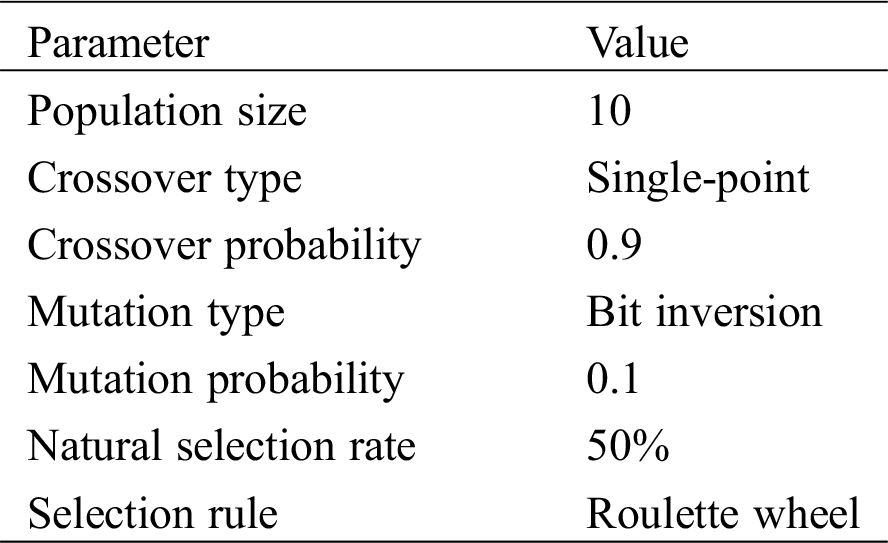
Fig. 5 shows that GA stops at the 20th generation with the score level being constant for five consecutive generations. According to Fig. 5, plotted score value indicates Inter/Intra class criterion while the maximum score belongs to the candidate having the values depicted in Tab. 2. Thus, among different combinations of candidates, the denoising level of “3”, the mother wavelet of “db2” and statistical function of “RMS” will lead to the optimum score at 20th generation. The parameters will be fixed to their optimal values and build the final feature set which is going to feed into the ANN classifier.
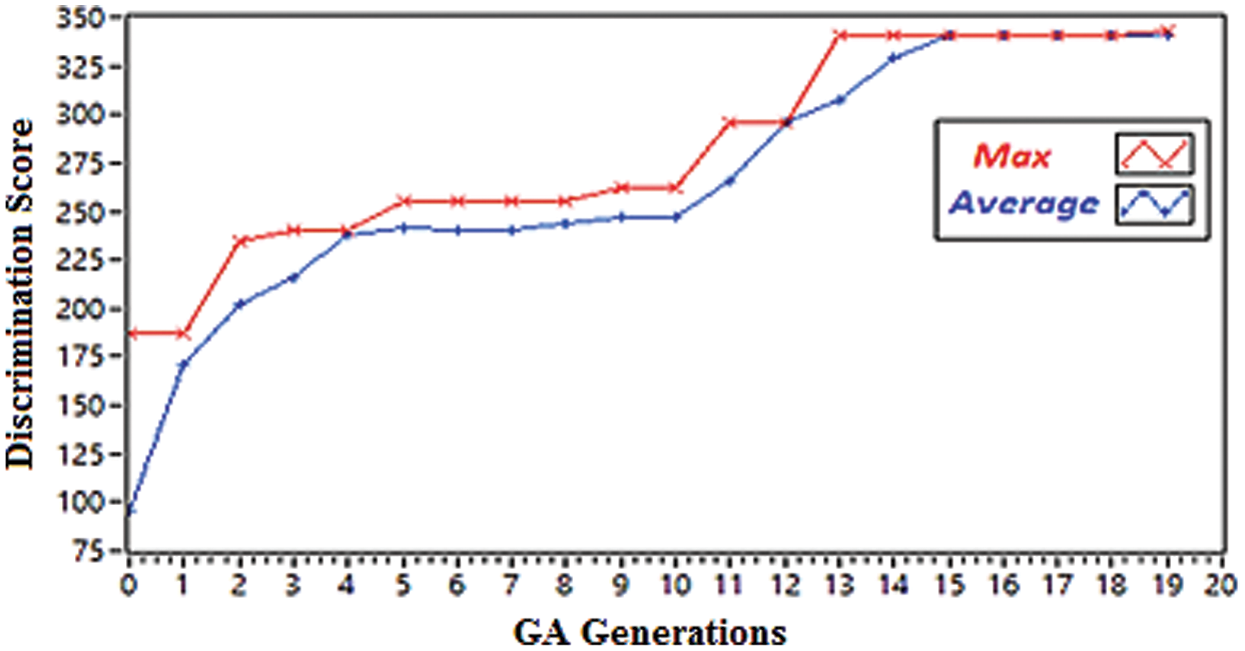
Figure 5: GA convergence plot during the optimization of the parameters
Table 2: GA results for uncertain parameters
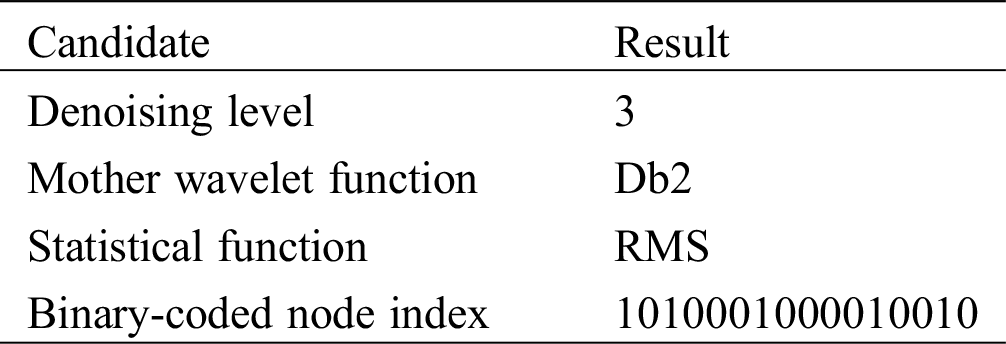
Fig. 6 shows the examples of fluctuations in RMS values of wavelet coefficients for all terminal nodes through all signal segments. Investigations reveal that the corresponding feature matrices are different in magnitude and frequency content in all fault signals. Following Tab. 2 and the evaluated criteria function, the obtained value for the “Binary-coded node index” indicates only five wavelet nodes in the last layer (4th layer in WPD tree) can build distinct features from the fault signals. Thus, the features in wavelet terminal nodes numbered 1, 3, 7, 12, and 15 can make distinct class features set. We calculated RMS values in the selected nodes as input samples to drive the classifier. In this regard, Fig. 7 illustrates RMS values calculated on dominant features in axial, horizontal, and vertical directions just for the first partition in all fault signals. As depicted in Fig. 7, there are strong dissimilarities between feature values in each direction which is the desired outcome for the feature selection task.
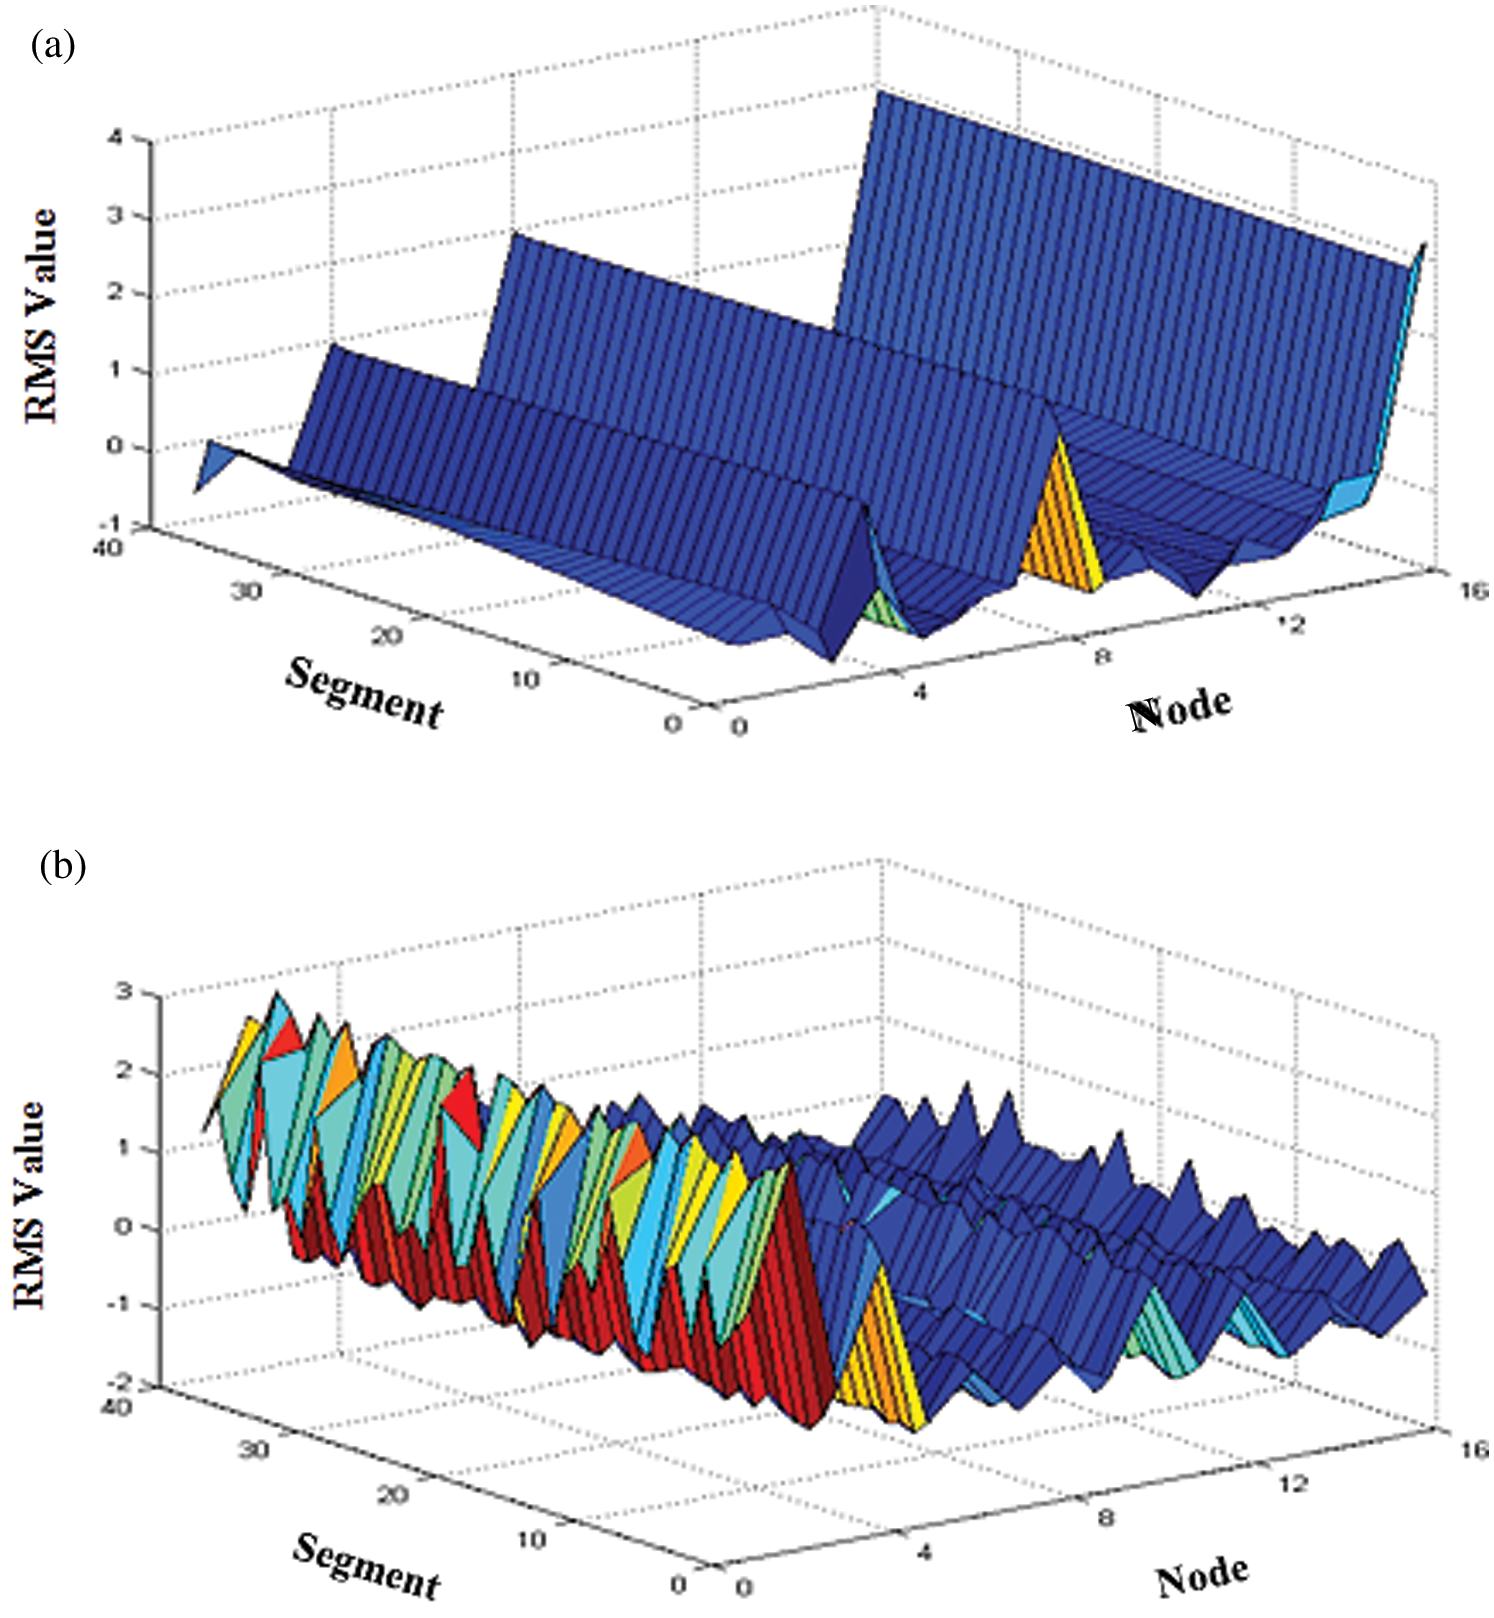
Figure 6: Illustration of RMS values for some machine faults in all terminal nodes. (a) Casing Distortion RMS values (Axial), (b) Cavitation RMS values (Axial)
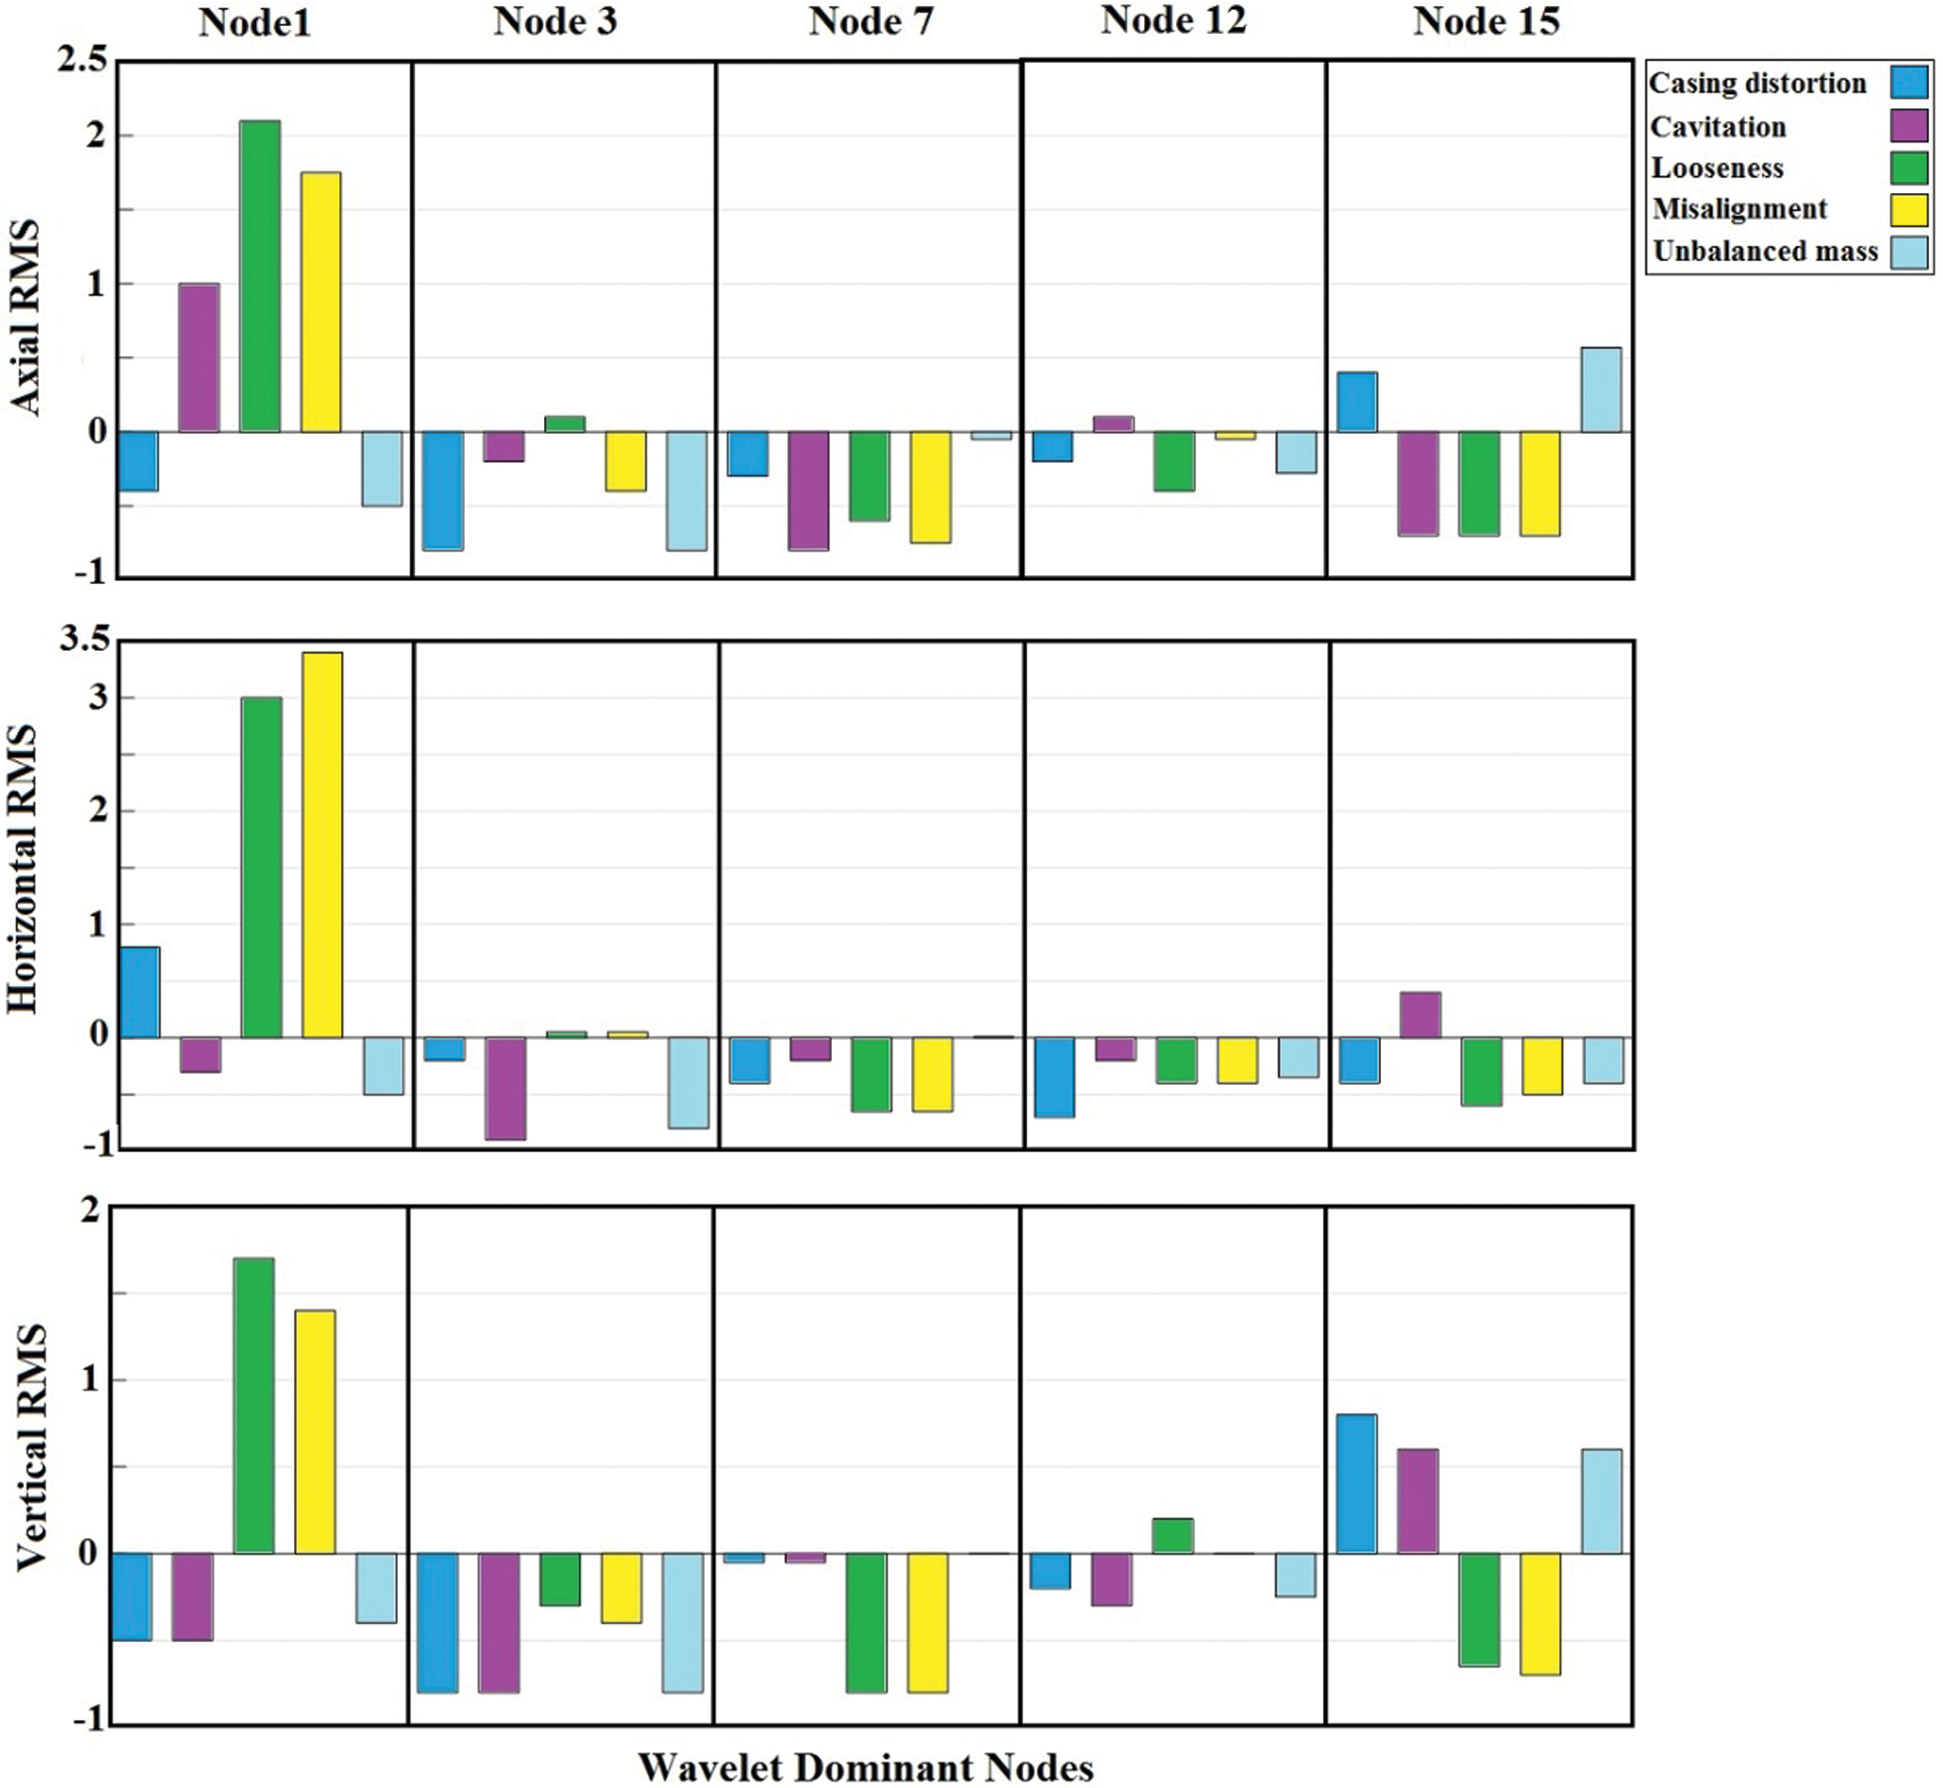
Figure 7: RMS values of wavelet coefficients at selected terminal nodes
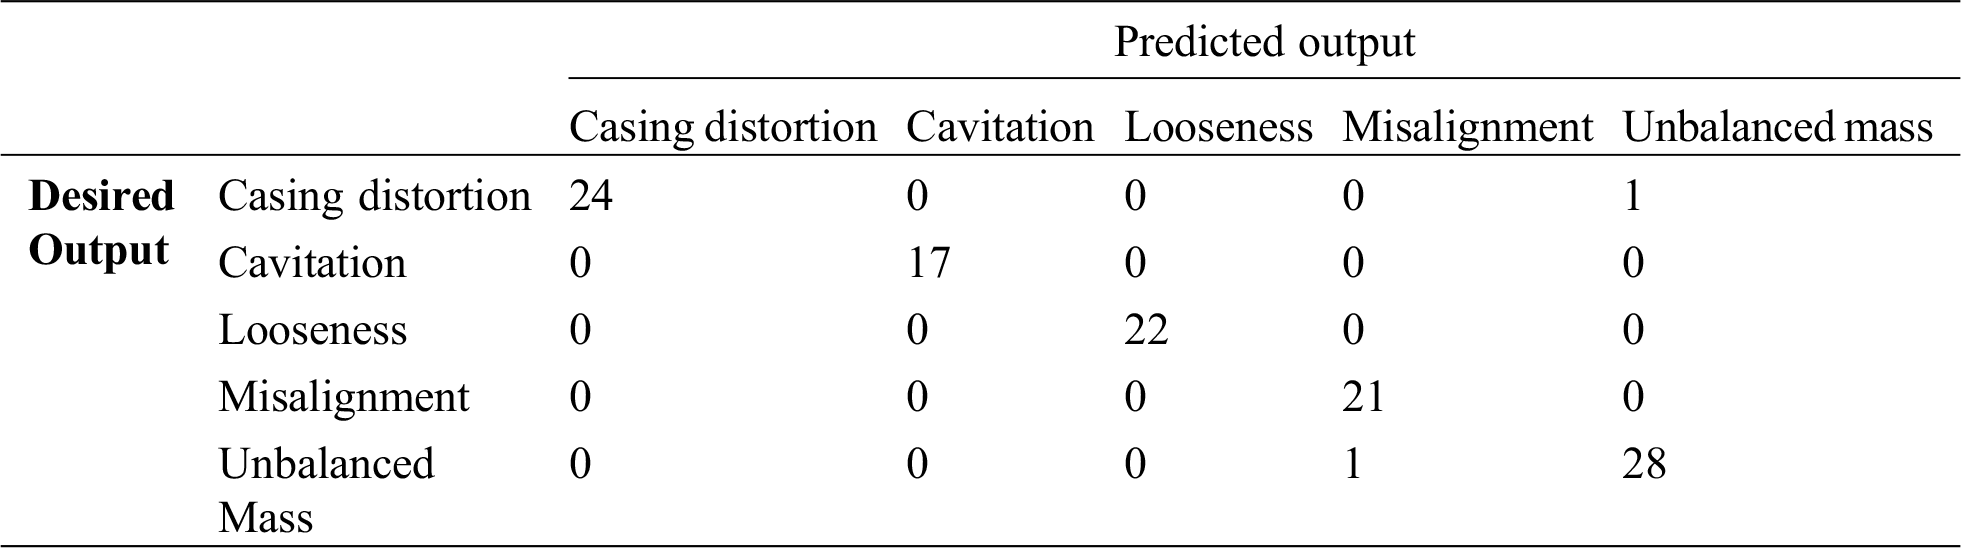
In the classification phase, the feature matrix with the size of 5 × 40 × 3 features was considered for each machine fault. The classifier network was verified by test data after the training stage. Tab. 3 which is called the confusion matrix shows the allocation of test data to their correct decision classes. As depicted in this table, the final accuracy for the test data resulted in 98%.
Table 3: The confusion matrix evaluated on test data
We outlined a learning based procedure to extract applicable features of an industrial pump (Fig. 1). In our algorithm, wavelet packet decomposition and statistical feature extraction are applied to improve the classification performance. Additionally, we consider a feature selection task to choose the most important features. In this regard, GA chooses the foremost parameters of this procedure. Therefore, the separate-ability factor increases which guarantee the efficiency of the classification. The disparity between the decision boundaries extends and improves the classifier performance. Finally, the proposed algorithms are applied to the experimental data gathered from an industrial heavy-duty oil pump installed in Arak Oil Refinery Company and the classification results are reliable.
Acknowledgement: The authors wish to thank H. Shafieepour, head of the instrumentation department of Arak Oil Refinery Company, for their anonymous supports in data acquisition, which led to this practical work.
Funding Statement: The authors received no specific funding for this study.
Conflicts of Interest: The authors declare that they have no conflicts of interest to report regarding the present study.
References
1. Jardine, A. K. S., Lin, D., Banjevic, D. (2006). A review on machinery diagnostics and prognostics implementing condition-based maintenance. Mechanical Systems and Signal Processing, 20(7), 1483–1510. DOI 10.1016/j.ymssp.2005.09.012.
2. Pakrashi, V., Basu, B., O’Connor, A. (2009). A statistical measure for wavelet based singularity detection. Journal of Vibration and Acoustics, 131(4), 041015. DOI 10.1115/1.3142880. [Google Scholar] [CrossRef]
3. Xiao, M., Wen, K., Zhang, C., Zhao, X., Wei, W. et al. (2018). Research on fault feature extraction method of rolling bearing based on NMD and wavelet threshold denoising. Shock and Vibration, 2018(3), 1–11. DOI 10.1155/2018/9495265. [Google Scholar] [CrossRef]
4. He, W., Miao, Q., Azarian, M., Pecht, M. (2015). Health monitoring of cooling fan bearings based on wavelet filter. Mechanical Systems and Signal Processing, 64–65, 149–161. DOI 10.1016/j.ymssp.2015.04.002. [Google Scholar] [CrossRef]
5. Cao, H., Fan, F., Zhou, K., He, Z. (2016). Wheel-bearing fault diagnosis of trains using empirical wavelet transform. Measurement, 82, 439–449. DOI 10.1016/j.measurement.2016.01.023. [Google Scholar] [CrossRef]
6. He, S., Chen, J., Zhou, Z., Zi, Y., Wang, Y. et al. (2016). Multifractal entropy based adaptive multiwavelet construction and its application for mechanical compound-fault diagnosis. Mechanical Systems and Signal Processing, 76–77, 742–758. DOI 10.1016/j.ymssp.2016.02.061. [Google Scholar] [CrossRef]
7. Jiang, F., Zhu, Z., Li, W., Ren, Y., Zhou, G. et al. (2018). A fusion feature extraction method using EEMD and correlation coefficient analysis for bearing fault diagnosis. Applied Sciences, 8(9), 1621. DOI 10.3390/app8091621. [Google Scholar] [CrossRef]
8. Namdari, M., Jazayeri-Rad, H. (2014). Incipient fault diagnosis using support vector machines based on monitoring continuous decision functions. Engineering Applications of Artificial Intelligence, 28, 22–35. DOI 10.1016/j.engappai.2013.11.013. [Google Scholar] [CrossRef]
9. Chai, W., Qiao, J. (2014). Passive robust fault detection using RBF neural modeling based on set membership identification. Engineering Applications of Artificial Intelligence, 28, 1–12. DOI 10.1016/j.engappai.2013.10.005. [Google Scholar] [CrossRef]
10. Parvin, H., MirnabiBaboli, M., Alinejad-Rokny, H. (2015). Proposing a classifier ensemble framework based on classifier selection and decision tree. Engineering Applications of Artificial Intelligence, 37, 34–42. DOI 10.1016/j.engappai.2014.08.005. [Google Scholar] [CrossRef]
11. Mallat, S. G. (2009). A wavelet tour of signal processing: The sparse way. 3rd ed. Amsterdam, Boston: Elsevier/Academic Press. [Google Scholar]
12. Rafiee, J., Rafiee, M. A., Tse, P. W. (2010). Application of mother wavelet functions for automatic gear and bearing fault diagnosis. Expert Systems with Applications, 37(6), 4568–4579. DOI 10.1016/j.eswa.2009.12.051. [Google Scholar] [CrossRef]
13. Ece, D. G., Başaran, M. (2011). Condition monitoring of speed controlled induction motors using wavelet packets and discriminant analysis. Expert Systems with Applications, 38(7), 8079–8086. DOI 10.1016/j.eswa.2010.12.149. [Google Scholar] [CrossRef]
14. Muralidharan, V., Sugumaran, V. (2013). Feature extraction using wavelets and classification through decision tree algorithm for fault diagnosis of mono-block centrifugal pump. Measurement, 46(1), 353–359. DOI 10.1016/j.measurement.2012.07.007.
15. Muralidharan, V., Sugumaran, V. (2012). A comparative study of Naïve Bayes classifier and Bayes net classifier for fault diagnosis of monoblock centrifugal pump using wavelet analysis. Applied Soft Computing, 12(8), 2023–2029. DOI 10.1016/j.asoc.2012.03.021. [Google Scholar] [CrossRef]
16. Van der Heijden, F., Duin, R. P. W., De Ridder, D., Tax, D. M. J. (2004). Classification, parameter estimation and state estimation. Chichester, UK: John Wiley & Sons, Ltd. [Google Scholar]
17. de Ridder, D., Tax, D. M. J., Lei, B., Xu, G. Feng, M. et al. (2017). Classification, parameter estimation and state estimation: An engineering approach using MATLAB. 2nd ed. Chichester, UK: John Wiley & Sons, Ltd. [Google Scholar]