
 Submit a Paper
 Propose a Special lssue
 Open Access
ARTICLE

Study on Seismic Performance of Continuous T-Beam Bridge—Kulungou Bridge
1 Xinjiang Transportation Investment (Group) Co., Ltd., Urumqi, 830002, China
2 Xinjiang Communications Investment Construction Group Co., Urumqi, 830049, China
3 Key Laboratory of Highway Engineering Technology in Arid Desert Areas of Transport Industry, Urumqi, 830099, China
4 Research Institute of Highway, Ministry of Transport, Beijing, 100088, China
* Corresponding Author: Shumao Qiu. Email:
(This article belongs to the Special Issue: Advanced Data Mining in Bridge Structural Health Monitoring)
Structural Durability & Health Monitoring 2025, 19(3), 705-729. https://doi.org/10.32604/sdhm.2025.060298
Received 29 October 2024; Accepted 19 December 2024; Issue published 03 April 2025
 View Full Text
 Download PDF
Abstract
The objective of this research is to assess the seismic behavior of the continuous T-beam bridge located at Kulungou in Xinjiang. In addition to traditional static and modal analyses, this study introduces a novel approach by comprehensively examining the performance of the bridge during construction stages, under ultimate load capacities and seismic load. Compliance with regulatory standards is verified by the static analysis, which also yields a thorough comprehension of stress distribution across various stages of construction. By unveiling the initial 100 vibration modes, the modal analysis has significantly enhanced our comprehension and established a robust basis for the ensuing seismic analysis. A distinctive aspect of this research is its comprehensive exploration of the bridge’s seismic behavior under E1 and E2 earthquake excitations. Under E1 earthquake excitation, the response spectrum analysis confirms the adequacy of the bridge piers’ strength according to seismic design criteria, whereas the time-history analysis conducted under E2 ground motion reveals the bridge’s robust resistance to strong earthquakes. This study also undertakes a comparative assessment of the seismic behavior of the bridge, contrasting its performance with lead-rubber bearings against that with high-damping rubber bearings. According to the study’s findings, both types of bearings demonstrate their efficacy in mitigating seismic responses, thereby emphasizing their potential as innovative approaches to enhance the resilience of bridges. A notable contribution of this research lies in its assessment of seismic performance indicators, namely hysteresis curves, backbone curves, and ductility coefficients, utilizing Pushover analysis. By conducting a thorough evaluation, a more profound insight into the seismic performance of bridge piers is gained. In conclusion, the study explores how earthquake wave intensity and aftershocks affect the seismic response of bridge piers, showing a substantial increase in seismic response with intensifying wave magnitude and the potential for aftershocks to aggravate damage to compromised structures. The importance of incorporating these factors in the seismic design and retrofitting of bridges is underscored by these discoveries. This study, in its entirety, proposes a fresh and comprehensive methodology to assess the seismic performance of continuous T-beam bridges, furnishing valuable perspectives and innovative remedies to augment the seismic resilience of bridges in earthquake-prone zones.Keywords
Over the past few decades, the effects of earthquakes on bridges have consistently constituted a key area of focus within the civil engineering discipline [1–3]. Scholars and engineers have extensively investigated the seismic performance of a range of bridge components [4,5], specifically highlighting piers alongside bearings and abutments, with a strong focus on the seismic behavior of piers. In the plethora of research conducted, Maragakis et al. [6] developed a Rigid-Body Motion Analysis Model for Skew Bridges, offering a significant understanding of bridge behavior in earthquake scenarios. Kim et al. [7] analyzed the impact that seismic forces exert on the expansion joints of concrete bridges, stressing the relevance of gap dimensions and earthquake motion attributes to ductility criteria. Additionally, a survey conducted by Iemura et al. [8] in Banda Aceh following the Major Sumatra Earthquake revealed extensive damage to numerous bridges caused by the tsunami, underscoring the significance of unseating as a concern for bridges exposed to water-borne forces. Wang et al. [9] conducted a study on the impact of scour on the seismic response of reinforced concrete bridges, stressing the necessity of considering a range of hazards in the design and evaluation process of bridges. Kang et al. [10] studied the cumulative behavior of extensive steel bridges constructed over the sea under the occurrence of strong earthquakes that initiate tsunami flows, which subsequently pose a risk of ship impacts, underscoring the need for comprehensive risk assessments and resilience-based design. Akiyama et al. [11] highlighted the significance of individual and combined hazards, such as earthquakes, tsunamis, and corrosion, in assessing reliability and potential risks in bridge structures and networks. Meanwhile, researchers have also proposed new strategies and methods to enhance the seismic resilience of bridges. For instance, Xie et al. [12] assessed the seismic fragility of single-pier highway bridges featuring rocking foundations and suggested rocking isolation as a retrofit strategy to improve bridge resilience. Kilanitis et al. [13] examined the influence of bridge damage resulting from earthquakes and variations in traffic demand on the resilience of road networks, emphasizing the interconnectedness of infrastructure systems during disaster events. Additionally, Numia et al. [14] concentrated on the dynamic interplay between vehicles and bridge structures, underscoring the importance of considering vehicle-induced dynamic responses in bridge design and assessment. Ghasemi et al. [15] introduced a new metric called instantaneous resilience to complete immediate post-earthquake assessment of the load-bearing capacity of highway bridges, providing engineers with a valuable tool for quantitatively assessing the immediate impact of earthquakes on bridges. In summary, Notable advancements have been achieved by the study of the impact of earthquakes on bridges, yet numerous challenges and issues remain to be further explored. Future research should continue to delve into the seismic performance of bridges and propose more effective seismic design and reinforcement strategies to enhance the resilience and safety of bridges in extreme disasters such as earthquakes.
In recent years, investigation into seismic resistance capabilities of high-pier continuous T-beam bridges has emerged as a focal point in both academia and engineering circles [16–18]. Extensive discussions have been devoted to various aspects of earthquake-induced responses of high-pier, long-span bridges. Specifically, Xiao et al. [19] investigated the seismic response along the longitudinal direction of continuously welded rails (CWR) on high-pier, long-span bridges under uniform excitation and the wave propagation effect. The study emphasized the necessity of considering the impacts of traveling wave effects and wave propagation directions in the design of CWR for bridges located in high-intensity earthquake zones, which holds considerable importance in improving the seismic stability and safety of bridges. Dai et al. [20] conducted a comparative study on the adaptability of small-resistance fasteners for high-speed railway long-span bridges, highlighting the practical engineering value of such research. Insights of considerable value are provided by this study for the seismic engineering design of bridges for high-speed railway systems. Chen et al. [21] presented a framework aimed at managing seismic vibrations in high-pier T-beam bridges by employing Tuned Mass Dampers (TMDs). The findings of the study reveal that Tuned Mass Dampers (TMDs) represent one of the most efficient solutions for absorbing vibrations in the event of an earthquake, providing fresh insights and methodologies for the seismic design of bridges. Yen et al. [22] delved into the construction practices and earthquake-resistant design of seamless bridges, introducing a system of prefabricated concrete bridge bents tailored to meet the challenges of earthquake-frequent zones. This research presents viable alternatives for the construction of bridges located in seismic zones. Deng et al. [23] have presented an approach, employing wavelet packet norm entropy, for detecting damage in curved beam bridges during seismic excitations. The importance of seismic damage identification in bridge structures is underscored by this study, which furnishes powerful technical backing for bridge maintenance and repair efforts. The literature review, in conclusion, points to a heightened interest in exploring the seismic behavior of different bridge structures, notably including high-pier continuous T-beam bridges. Various aspects, encompassing longitudinal seismic response, fastener suitability, vibration control techniques, construction methodologies, and damage identification methods, have been the focus of research aimed at bolstering the functional characteristics of bridge structures situated in regions of high seismic intensity. Additional studies in this field are vital for the ongoing refinement of bridge design and construction techniques, so that they can adequately withstand earthquake events. Ongoing research must continue to delve into new methods and technologies for seismic design, aiming to boost the seismic capacity and safety of bridges.
Extensive research notwithstanding, significant gaps and unresolved issues persist in the seismic performance of high-pier continuous T-beam bridges, necessitating further attention. With the goal of enhancing the safety, earthquake resilience, and durability of these crucial infrastructures, this study focuses on bridging existing gaps and integrating multiple dimensions of seismic design, analysis, and construction practices. Considering the complex topographies and diverse geological conditions often encountered by high-pier continuous T-beam bridges, a comprehensive grasp of their real-world responses to both static and seismic loading during the design and construction stages is imperative for refining design approaches and guaranteeing the bridges’ safety and dependability throughout their service life. In this paper, an in-depth analysis of the static and seismic performance of the Kulungou Bridge, situated in Xinjiang, China, is undertaken. The research is mainly divided into the following four parts: Firstly, a finite element model is established to investigate the static performance and vibration modes of the entire bridge. Secondly, based on the behavior of earthquake engineering design principles, the response of high-pier continuous T-beam bridges under E1 and E2 earthquake excitations is studied to clarify their seismic mechanical properties [24]. Finally, a more detailed investigation is carried out on the weak part of the high-pier continuous T-beam bridge (piers) to ensure their seismic performance. The research presented in this thesis contributes to the understanding of bridge seismic performance and the development of practical solutions for enhancing it. The findings not only provide research-based insights and recommendations for the engineering community but also enhance the resilience and adaptability of communities facing natural disaster challenges, thereby supporting sustainable development.
2 Bridge Description and Finite Element Model Development
2.1 Geological and Design Background of Kulungou Bridge
The Kulungou Bridge, positioned in Xinjiang, plays a significant role as a bridge between Gaochang and Baluntai. The bridge is made up of nine spans, amounting to a total length of 1048 m. It is divided into two separate roadways, with the superstructure comprising five assembled prestressed concrete continuous T-beams spaced 2.588 m apart and standing 2.5 m high. In this paper, we focus on the fifth span of the bridge, which features longer piers. The layout of this bridge type is illustrated in Fig. 1.

Figure 1: Schematic diagram of continuous T-beam bridge, unit: cm
2.2 Finite Element Model Development
This paper employs Midas Civil to construct a sophisticated finite element model for a continuous T-beam bridge. The entire structure is meticulously modeled using a rod-based framework, encompassing 2787 nodes and 3613 elements. Beam elements are used to simulate the main beams, capping beams, and cross diaphragms, while fiber elements are employed to represent the piers. Furthermore, the model incorporates variations in the cross-sectional configuration of the main girder, along with the prestress conditions prevalent in continuous T-beam bridges. The comprehensive three-dimensional FE (finite element) model of the bridge was presented in Fig. 2.

Figure 2: The finite element model of the fifth segment of Kulungou super large bridge
The explanation of the boundary conditions for modeling is primarily categorized into two sections: the simulation of bearings and the simulation of pile foundations. Firstly, the bearing type adopted for this structure is the pot-type rubber bearing. The specific arrangement is shown in Fig. 2: one bidirectional bearing and one unidirectional bearing are placed at location 1#, location 2# is fixed to the main girder, one bidirectional bearing and one unidirectional bearing are placed at location 3#, and similarly, one unidirectional bearing and one bidirectional bearing are placed at location 4#. The fixed bearing is simulated through rigid connections, while the unidirectional and bidirectional bearings are simulated through elastic connections.
Based on the “Specifications for Design of Highway Bridge Foundations and Substructures” [25], the pile-soil interaction is considered to calculate the foundation coefficient and the rigidity coefficient of the soil spring. The soil springs are simulated by applying nodal elastic supports to the nodes on the piles, as illustrated in Fig. 2.
By utilizing a fiber model, the pier section is meticulously subdivided into numerous fine fibers, with the purpose of capturing deformations under stress with greater precision. The fiber model excels in accounting for variations in material properties and stress states across different locations within the component’s cross-section, thereby significantly enhancing the accuracy and precision of structural analysis. Through a thorough analysis of each fiber section, a more detailed and comprehensive understanding of the structural response can be achieved, allowing for an accurate simulation of the elastoplastic mechanical behavior of the component under biaxial bending. The cross-section materials are composed of concrete fibers and steel fibers, where the concrete fibers are further distinguished between confined concrete and unconfined (protective layer) concrete.
The segmented fiber cross-section of the pier is illustrated in Fig. 5. The present section comprises three sections as follows: restrained concrete, free-state concrete and reinforcing steel. The concrete fibers within the confined area are segmented into 18 parts along the perimeter and 5 segments radially; the concrete in the unrestrained zone is divided into 18 segments circumferentially and 1 segment radially. The reinforcement is not subdivided but modeled according to its actual layout position. The key values for the correlation of bending moment with curvature in pier cross-sections are presented in Table 1.

The study adopts a trilinear model to represent the constitutive model of steel fibers. This approach necessitates only the definition of the ratio between the stiffness properties of steel, including its stiffness post-yield and initial stiffness, with E2/E1 = 0.01 being used in this study. During the post-yield loading phase, the yield stiffness is utilized, while the elastic stiffness is used during post-yield unloading and reloading, as illustrated in Fig. 3. In this paper, the constitutive behavior of steel fibers is modeled using a trilinear approach. This approach necessitates only the definition of the comparison between the post-yield stiffness and initial stiffness of steel, with E2/E1 = 0.01 being used in this study. The yield stiffness is applied during post-yield loading, while the elastic stiffness is used during post-yield unloading and reloading, as illustrated in Fig. 4.

Figure 3: Schematic diagram of fiber cross-section segmentation for pier

Figure 4: Stress-strain curve of reinforcing steel
In this paper, the constitutive response of concrete is modeled using the Mander approach, characterized by its adaptability to any cross-sectional shape. The curve representing stress vs. strain under compressive loading can be divided into three segments: the ascending branch, the descending branch, and the plateau branch, as illustrated in Fig. 5. The magnitude of elastic modulus for concrete Ec, the tensile capacity of concrete materials f ‘c, and the tensile strain of concrete εt are determined based on the following formulas:
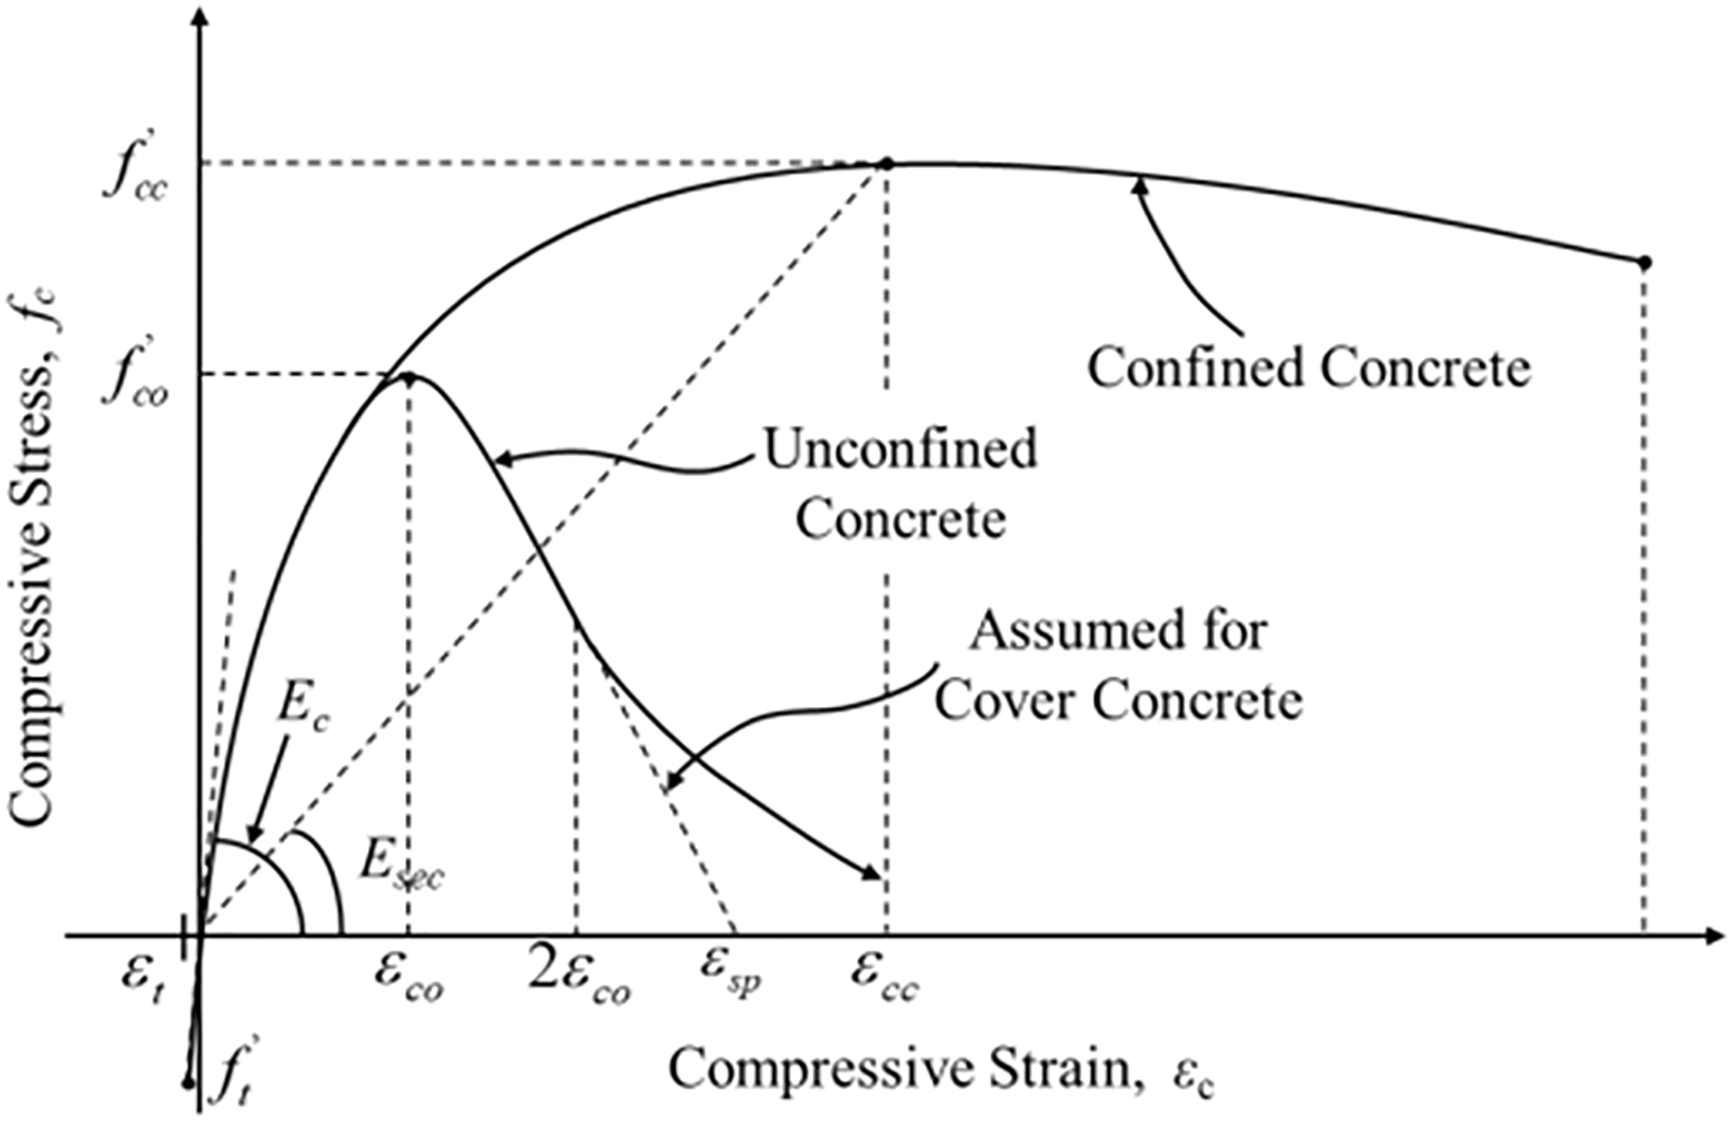
Figure 5: Stress-strain curve of concrete
Under seismic excitations, piers enter the plastic stage earlier than other bridge structures, indicating that their nonlinear response is more pronounced. The degree of nonlinearity also increases with the intensity of seismic excitation. Therefore, in addition to using fiber cross-sections to simulate the nonlinear behavior of piers, this paper also considers their second-order effects, namely the additional gravity effect (P − Δ) caused by deformation and displacement of the structure under horizontal excitation. The calculation formula and schematic diagram are shown in Eq. (4), Figs. 5 and 6.

Figure 6: Calculation model for P − Δ effect
3.1 Static Analysis and Ultimate Load-Bearing Capacity
3.1.1 Stress Analysis of Main Beam during Construction Stage
Conducting stress analysis during the construction stages of a continuous T-beam bridge is a crucial step in ensuring bridge construction safety, optimizing structural performance, and meeting the demands of high-grade highway construction. This paper analyzes the stresses in the bridge during four main construction stages of a continuous T-beam bridge. These stages are prefabricated T-beam erection with temporary support, wet joint construction, installation of permanent bearings and prestressing. As shown in the Fig. 7, the main stress experienced during construction is compressive stress, and the tensile stress within the main beam is within a range below the concrete cracking stress, satisfying the regulatory requirements.

Figure 7: Stress analysis of continuous T-beam bridge during construction stages
3.1.2 Ultimate Load-Bearing Capacity
The stress analysis results of the main beam under the ultimate load-bearing capacity state are shown in Fig. 8. Observation of Fig. 8 reveals that the main beam is primarily subjected to tensile stress in the lengthwise dimension of the bridge, with a maximum axial tensile stress of 1.3 MPa. The support serves as the base for maximum shear stress, which is 4.1 MPa. The maximum bending stress is 19.5 MPa, and sits atop the mid-span area.

Figure 8: Stress analysis of the main beam under ultimate load-bearing capacity, unit: MPa
3.2 Modal Analysis and Multi-Modal Response
The analysis of a structure’s natural vibration characteristics serves as the foundation for both response spectrum analysis and time-history analysis. The Single Ritz Vector method, Multi-Ritz Vector method, Subspace Iteration method, and Iterative Lanczos method are commonly employed for eigenvalue computation. In the Single Ritz Vector method, the eigenvector is approximated using just one basis vector, which can lead to a reduced convergence rate and a solution that merely represents a projection onto a specific eigen-subspace. The Subspace Iteration method, frequently utilized for solving eigenvalue problems, may experience decreased computational efficiency when applied to large-scale issues. The Iterative Lanczos method, another effective eigenvalue computation technique, can sometimes have a relatively unclear convergence criterion compared to the Multi-Ritz Vector method, potentially resulting in missed or duplicated roots. Consequently, the adoption of the Multi-Ritz Vector method for bridge modal analysis is comprehensively considered in this paper. In this paper, by utilizing the Multi-Ritz Vector method, the first 100 modes of the bridge are calculated, revealing its inherent frequencies, cycles, and modes of vibration. The corresponding mode shapes of the bridge are illustrated in Fig. 9, while the detailed dynamic characteristic dataset and corresponding mode shapes can be found in Table 2.

Figure 9: Vibration mode diagram of continuous T-beam bridge

On the basis of the analysis of the icon data presented above, it’s evident that the period of the bridge’s fundamental free vibration is measured at 1.6 s. The main beam primarily exhibits vertical bending, while the piers mainly display longitudinal bending. The overall structure of the bridge is not prone to torsional deformation. Due to the relatively high piers of this bridge, the structural stiffness is reduced, resulting in the first and second natural frequencies being 0.62 and 1.10 Hz, respectively. Both the vertical and horizontal fundamental frequencies are relatively low.
This paper also analyzes the modal participation mass corresponding to each mode of the bridge. When the modal participation mass in the longitudinal, transverse, and vertical directions all exceed 90%, it can be ensured that the number of selected modes meets the requirements. According to the relevant standards, in order to ensure the accuracy of seismic calculation and analysis of structures, the modal participation mass in all three directions corresponding to the termination of modes should reach above 90%. The modal participation mass coefficients for the first 60 modes in the longitudinal, transverse, and vertical directions for this model are presented in Table 3.

The first 20 modes of the bridge have modal participation masses of 99.99%, 99.67%, and 67.41% in the directions of length, width, and height, respectively. This indicates that the lower-order modes primarily have a significant impact on the longitudinal and transverse seismic responses, while the higher-order modes mainly affect the vertical seismic response. For the 60th mode, the modal participation masses in the directions of length, width, and height are 100%, 100%, and 93.92%, respectively, all exceeding 90% and meeting the requirements of the specifications.
3.3 Response Spectrum Analysis under E1 Earthquake
The particular soil features of the site are factored into the determination of seismic excitations at the ground surface via Site Response Analysis (SRA) [26]. The bridge site is located in a low-to-medium mountain region characterized by tectonic erosion landforms, with an elevation ranging between 1420 and 1522 m. The “Seismic Ground Motion Parameter Zonation Map of China” (GB 18306-2015) [27] indicates a peak ground acceleration (PGA) value of 0.20 g and assigns a characteristic period of 0.4 s to the seismic response spectrum, which corresponds to a basic seismic intensity of VIII. In accordance with the “Specifications for Seismic Design of Highway Bridges” (JTG/T 2231-01-2020) [28], the seismic design category for the bridge in this project is Class B, and the seismic measure level is IV.
In accordance with the “Specifications for Seismic Design of Highway Bridges” (JTG/T B02-01-2020) [28], for Class B bridges, spectral analysis is required under E1 earthquake conditions, while time-history analysis is mandatory under E2 earthquake conditions. The acceleration response spectrum S(T) for design purposes is determined by the formula provided, as depicted in Fig. 10.

Figure 10: Design acceleration response spectrum
In the formula: T is indicative of the time period in this context, s; T0 signifies the longest duration of the linearly ascending segment within the response spectrum, taken as 0.1 s; Tg is the characteristic period, s; Smax is the designated acceleration response spectrum attains its maximum value, g; Ci is the seismic importance coefficient; Cs is the site coefficient; Cd is the damping adjustment coefficient; A is the horizontal peak ground acceleration associated with fundamental seismic activity is observed, g.
The Kulungou Grand Bridge is a Class B bridge situated in a region designated with a seismic prevention intensity scale of VIII. Both horizontal and vertical seismic actions are considered. For E1 earthquake actions, the seismic importance coefficient Ci is taken as 1.0; for E2 earthquake actions, the seismic importance coefficient Ci is taken as 1.7. The site coefficient Cs is 1.00 for horizontal directions and 0.6 for vertical directions. The damping adjustment coefficient is calculated using the formula shown below, with the structural damping ratio constant ζ taken as 0.05.
Under E1 horizontal earthquake action, the expression that defines the design response spectrum is calculated based on the following formula with Ci = 1, Cs = 1, Cd = 1, Tg = 0.4, and Smax = 0.5:
For E1 vertical earthquake action, the formula underlying the computation of the design response spectrum expression is as follows Ci = 1, Cs = 0.6, Cd = 1, Tg = 0.3, and Smax = 0.3:
Under the action of E2 level earthquake, the expression that defines the design response spectrum is calculated based on the following expression with Ci = 1.7, Cs = 1, Cd = 1, Tg = 0.4, and Smax = 0.85:
Under the vertical earthquake action of E2, the mathematical representation that characterizes the design response spectrum is calculated based on the following expression with parameters: Ci = 1.7, Cs = 0.6, Cd = 1, Tg = 0.3, and Smax = 0.51:
Therefore, under the earthquake actions of E1 and E2, the parameter values for each horizontal and vertical direction are shown in Table 4. The design response spectrum diagram based on these parameters is illustrated in Fig. 11.


Figure 11: Design acceleration response spectrum of E1 and E2
Under the E1 earthquake action, only the strength of the pier needs to be verified. First, the verification section should be determined. The location of the pier and crossbeam is considered as a potential plastic hinge region, which is taken as the pier verification section. The specific location is shown in Fig. 12.

Figure 12: Schematic diagram of pier verification section, unit: cm
The horizontal and vertical seismic waves of E1 are shown in Fig. 13. Under the E1 earthquake action, the bending moments of each section are presented in Table 5. The design values of the bending strength (equivalent yield moment) for the control sections in the table are calculated based on the moment-curvature program in the software, with the material strength adopting design values. It can be concluded from the table that the piers of this continuous T-beam bridge meet the strength requirements under the E1 earthquake action.

Figure 13: Time history curve of E1 seismic wave

The aforementioned analysis confirms that the piers of this bridge satisfy the strength criteria under E1 earthquake conditions. To further validate the rationality of the pier design in a more intuitive manner, we introduce a redundancy coefficient μ, defined as the ratio of Bending Moment to Bending Capacity, and compare it with findings from the literature [29]. The results of this comparison are presented in Table 6. Upon examining the data, it is evident that the seismic redundancy for the selected cross-Sections 1 and 2 in the transverse direction is 53%. In contrast, the redundancy reported in the literature [29] falls within the range of 40% to 62%. These findings affirm that the design of this bridge is sound and complies with the seismic requirements associated with E1 earthquake excitation.

3.4 Response Analysis under E2 Earthquake Action
The artificial wave is fitted with the target of calculating the design response spectrum. By obtaining the maximum responses of a connected single-degree-of-freedom system at different periods under the design ground motion, the standard response spectrum can be derived. Then, by calculating its power spectrum through Fourier transform and performing iterative calculations, the E2 artificial ground motion can be obtained. The degree of fitting between the horizontal and vertical spectral data of the obtained artificial seismic wave is shown in Fig. 14.

Figure 14: Artificial seismic wave spectral data diagram
The variation pattern of internal forces in bridge piers under seismic action is a crucial indicator for evaluating the dynamic response of structures and also an important basis for conducting seismic bearing capacity verification. In this paper, an anti-seismic analysis is conducted on the fifth bridge span with a relatively long calculated length for the piers. Due to chapter limitations in subsequent analyses, only the middle pier will be examined.
Fig. 15 presents the time-history curves of axial force, bending moment, and shear force for the critical bridge pier. As shown in the figure, the pier remains in a state of compression under both gravity and seismic action, with noticeable fluctuations in axial force values, reaching a peak of 9.8 × 10⁻³ kN·m.

Figure 15: Internal force response of critical bridge pier
3.5 Research on the Effectiveness of Seismic Isolation Bearings
Seismic isolation and mitigation technology employ devices that, while ensuring the normal functionality of structures, extend the structural period, dissipate a significant amount of seismic energy, and thereby reduce the structural response to earthquakes. Common seismic isolation bearings include laminated rubber bearings, lead-rubber bearings, sliding friction-based seismic isolation bearings, high-damping rubber bearings, and steel dampers. Among these, lead-rubber bearings and high-damping rubber bearings are widely used in seismic isolation and mitigation techniques.
This paper compares the impact of lead-rubber bearings and high-damping rubber bearings on the overall seismic performance of bridges. Lead-rubber bearings are characterized by low yield shear force, high initial shear stiffness, ideal elastoplastic behavior, and excellent fatigue resistance under plastic cycling. High-damping rubber bearings, made from specially formulated rubber materials, can accommodate large-displacement shear deformations in the horizontal direction and provide hysteretic energy dissipation for seismic isolation and mitigation. The constitutive relationships for both types of bearings are shown in the Fig. 16 below.
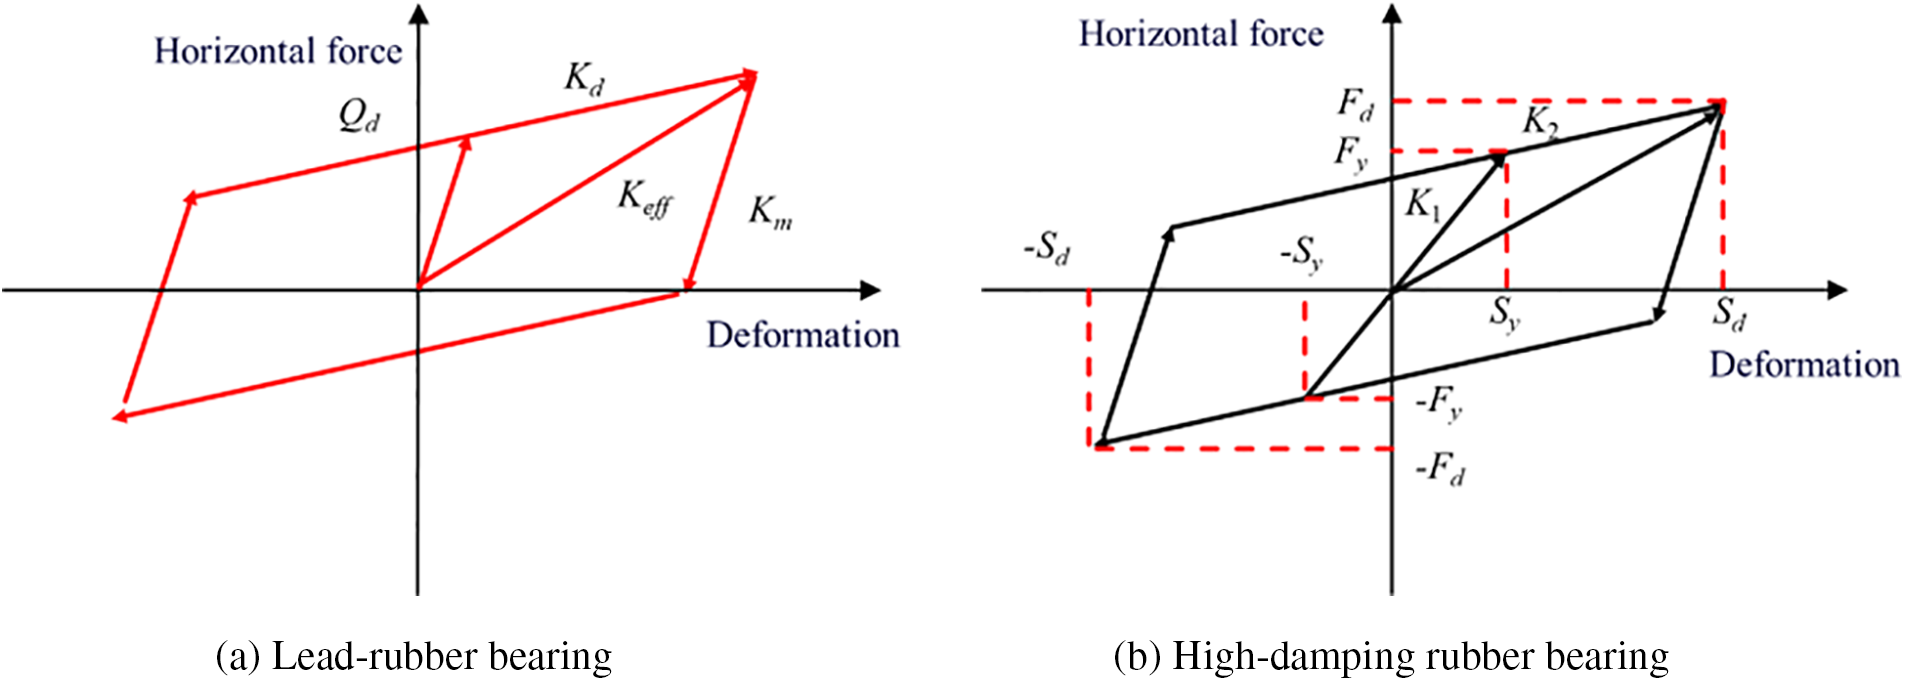
Figure 16: Constitutive relationship of seismic isolation bearings
To clarify the role of seismic isolation bearings, we first compare the lateral displacement in the central section of the main beam’s span in both the side span and the mid-span before and after installing lead-rubber bearings, as shown in Fig. 17. The figure indicates that after adding lead-rubber bearings, the lateral displacement at the mid-span of both the side span and mid-span main beams is reduced. This reduction is particularly evident during aftershocks in the later stages. Therefore, it can be seen that seismic isolation bearings play a crucial role in the seismic design of continuous T-beam bridges with high piers.

Figure 17: The impact of lead-rubber bearings on the lateral displacement of main beams in side-span and mid-spans
The working principle of the high-damping rubber bearing is similar to that of the lead rubber bearing, with specific parameters varying depending on the selected model. This paper compares the Y4Q circular lead-rubber bearing with the HDR(I) (High Dynamic Range Imaging) high-damping rubber bearing. Using the transverse displacement at the top of the bridge pier as the criterion, the isolation rates of the two types of bearings are analyzed, as shown in Table 7.

As can be seen from the table, both the lead-rubber bearing and high-damping rubber bearing solutions are effective in reducing the seismic response of the structure. For the types of seismic isolation bearings used in this paper, the maximum reduction in the transverse displacement at the top of the piers for a high-pier continuous T-beam bridge can reach 44%.
4 Nonlinear Seismic Response Analysis of Bridge Piers
Bridge piers are weak links in the seismic resistance of bridges, especially for the high-pier continuous T-beam bridge in this project. Therefore, to further analyze the seismic performance of this bridge in detail, this paper investigated the seismic response of the bridge piers under earthquake loads. Initially, the seismic performance indices of the bridge piers are calculated through Pushover analysis. Subsequently, the seismic performance under E1 earthquake is investigated to determine whether the bridge piers remain in the elastic stage under such conditions. Finally, the seismic response of the bridge piers under E2 earthquake is analyzed, and the performance of the piers under mainshock and aftershock sequences is examined.
4.1 Pseudo-Static Analysis of Bridge Piers
The hysteresis curve of the bridge pier is shown in Fig. 18. The diagram reveals that prior to the onset of cracking in the specimen, the bending stiffness remains high, with a linear correlation observed between force and displacement. With an increase in load, the hysteresis loop becomes increasingly evident. Following the cracking and yielding of the specimen, there is a swift reduction in bending stiffness accompanied by an augmentation in displacement. The hysteresis curve displays a distinct pinching effect due to the shear action exerted by the horizontal force. More precisely, as the load escalates, the curve’s morphology progressively transitions from a sharp peak during the yield phase to an inverse S-shape.

Figure 18: Hysteresis loops of pier
4.1.2 Skeleton Curves and Ductility
Based on the results of pseudo-static tests and finite element numerical analysis, the literature [30] recommends adopting a three-line form for the skeleton curve model of RC piers, as shown in Fig. 19. The three-line skeleton curve can directly reflect the seismic performance of the component under earthquake action. This form is simple and clear, allowing engineers to quickly grasp the seismic performance characteristics of the structure during design and analysis, thereby providing valuable support for engineering decisions. The skeleton curve in this paper adopts a three-linear model, dividing the loading process into three specific stages: the elastic stage, the strengthening stage, and the strength degradation stage. Point A marks the end of the elastic stage of the curve, corresponding to the yield load Py and yield displacement δy. Point B represents the peak point of the curve, with corresponding values of peak load Pmax and peak displacement δmax. Point C is the ultimate state point, characterized by the ultimate load Pu and ultimate displacement δu. According to the pseudo-static research results, the bending stiffness K of the structure remains essentially constant during the elastic stage. The yield displacement of the structure is the ratio of the yield load to the bending stiffness. Additionally, it is stipulated that when the load of the structure exceeds the peak load and enters the descending phase, reaching 85% of the peak load, the structure is considered to have failed. The ultimate load Pu at Point C is 0.85 times the peak load Pmax.

Figure 19: Skeleton curves
Based on the three-linear load-displacement skeleton curve model, the primary performance parameters of the bridge pier can be determined, as shown in Table 8.

4.2 The Influence of Ground Shaking on the Structural Seismic Response
“Specifications for Seismic Design of Highway Bridges [28]” indicate that the seismic response of this bridge pier needs to be verified. Under the action of E1 ground motion, the bridge pier should remain in the elastic stage, meaning that both the maximum displacement and maximum load are less than the yield point. Under E2 ground motion, the maximum displacement and response force of the bridge pier should both be less than the ultimate point.
Fig. 20 presents the response curve of the bridge pier under E1 earthquake excitation. As illustrated in the figure, the pier reaches its maximum negative response displacement of −269.48 mm at 25.23 s, with a corresponding maximum negative response load of 924.36 kN. Subsequently, at 35.77 s, it attains the maximum positive response displacement 217.42 mm, with a maximum positive response load of 851.39 kN. Consequently, both the maximum response displacement and the maximum response load under E1 earthquake excitation are less than the yield displacement (327.86 mm) and yield load (1081.41 kN) of the bridge pier. This demonstrates that the seismic behavior of the bridge pier with E1 earthquake loading meets the requirements of the specification, thereby indicating a reasonable design of the bridge pier.

Figure 20: Under the action of E1 ground motion
Fig. 21 depicts the response curve of the bridge pier under E2 earthquake excitation. The figure reveals that the pier attains its maximum negative response displacement of −272.97 mm at 24.78 s, with a corresponding maximum negative response load of 959.28 kN. Subsequently, at 38.21 s, it reaches its maximum positive response displacement of 389.35 mm, with a maximum positive response load of 1131.21 kN. Consequently, both the maximum response displacement and the maximum response load under E2 earthquake excitation are less than the ultimate displacement and ultimate load of the bridge pier. This demonstrates that the seismic response of the bridge pier under E2 earthquake excitation meets the requirements of the specification, thereby affirming the reasonable design of the bridge pier.

Figure 21: Under the action of E2 ground motion
4.3 The Impact of Earthquake Wave Intensity on the Seismic Behavior of Structures
In this section, the focus is on examining the influence of seismic wave intensity on the seismic response of bridge piers. Specifically, seismic responses under three intensities of seismic waves, namely PGA = 0.4 g, PGA = 0.6 g, and PGA = 0.8 g, are studied. The responses corresponding to these intensities are illustrated in Fig. 22. As observed from the figure, under the condition of PGA = 0.4 g, the hysteresis curve exhibits a slight inflection point and assumes a more rounded shape.

Figure 22: The impact of seismic wave intensity on structural seismic response
To provide a clearer analysis of the impact of various seismic intensities on the structure, the maximum displacements and corresponding maximum forces of the structure under different seismic intensities are summarized in Table 9. As shown in the table, the bridge pier experiences its maximum negative displacement of 558 mm at 25.8 s, exceeding the yield displacement of the pier structure. When PGA = 0.6 g, the maximum negative displacement reaches 1086.71 mm at 26.95 s, surpassing the ultimate displacement and resulting in structural failure. However, the maximum positive displacement is 541.89 mm, which has not yet reached the ultimate displacement. In the case of PGA = 0.8 g, the maximum positive displacement is 1315.98 mm, and the maximum negative displacement is 1133.49 mm, both reaching the ultimate displacement of the bridge pier structure.

4.4 The Influence of Aftershocks on the Seismic Response of Damaged Structures
After the mainshock, aftershocks often follow. The structure accumulates a certain degree of damage and stiffness degradation during the mainshock. To prevent further severe damage to the already damaged structure during aftershocks, it is essential to study the seismic response of the structure under aftershock effects. This subsection mainly discusses the influence of aftershocks of different intensities on the seismic response characteristics of damaged structures. The seismic waves are continuously input to simulate the first earthquake with a peak ground acceleration (PGA) of 0.05 g, the second mainshock with a PGA of 0.8 g, and the third aftershock with a PGA of 0.8 g. The specific structural seismic responses in these three stages are shown in Fig. 23. The maximum response displacement and corresponding force were summarized in Table 10.

Figure 23: The exploration of how aftershocks affect the seismic performance of damaged structures

As shown in the figure and table, the bridge pier exhibits no significant damage during the first earthquake with a PGA of 0.05 g, and the maximum response displacement of the bridge pier is 55.38 mm, which is within the elastic stage. As the ground motion intensifies, during the second earthquake (mainshock) with a PGA of 0.8 g, the maximum positive response displacement of the bridge pier reaches 1310.98 mm with a load of 1032.94 kN, and the maximum negative response displacement is 1121.43 mm with a load of 1100.86 kN. Both displacements exceed the ultimate displacement of the bridge pier structure, indicating significant structural damage. Under this damaged condition, when analyzed for the third aftershock with a PGA of 0.8 g, the stiffness of the structure decreases significantly, and the maximum response load it can bear is only 912.91 kN.
This study, grounded in performance-based seismic engineering design principles, conducted an in-depth analysis of the response of high-pier continuous T-beam bridges under E1 and E2 earthquake excitations, elucidating their seismic mechanical properties. Nonetheless, the study is not without its limitations. Firstly, given the complexity and uncertainty of earthquake excitations, coupled with the inherent nonlinearity of bridge structures, the results may not encompass all possible earthquake scenarios and corresponding bridge responses. Secondly, relying primarily on numerical simulations and theoretical analyses, this study lacks validation from actual earthquake data, which may somewhat impact the accuracy of the findings. In spite of the limitations, valuable insights are offered by this research toward understanding and enhancing the seismic performance of high-pier continuous T-beam bridges.
The findings of this research provide a scientific foundation for bridge engineers and designers to incorporate seismic performance considerations into the design and assessment of high-pier continuous T-beam bridges. Enhancing the bridge’s stability and safety in earthquakes through structural optimization and reinforcement of weak links can effectively reduce the structural damage and casualties caused by seismic disasters.
The following key conclusions were drawn from a thorough examination of the static and seismic performance of the continuous T-beam bridge located at Kulungou, Xinjiang, conducted in this study:
1. During construction stages and under ultimate load-bearing capacity, the main beams of the bridge primarily experienced compressive stress, with stress levels meeting regulatory requirements. The bridge structure demonstrates satisfactory load-bearing capacity under static conditions, as indicated by the results.
2. Using time-history analysis, the study examined the internal force response of bridge piers under the influence of E2 earthquake excitation. The findings reveal that the bridge structure retains good seismic resistance under intense earthquake conditions. Crucial seismic performance indicators, namely hysteretic behavior, backbone curve, and ductility ratio, were unveiled through the nonlinear seismic response analysis of the bridge piers.
3. Comparing the seismic performance of the bridge equipped with lead-rubber bearings and high-damping rubber bearings, it was found that both types of bearings significantly reduce seismic responses, thereby enhancing the bridge’s seismic resilience.
4. It has been observed that the seismic response of bridge piers rises markedly with increasing earthquake wave intensity, based on a study examining the impact of earthquake wave intensity and aftershocks. The significance of accounting for aftershock effects in seismic design is emphasized by the fact that aftershocks have the potential to further damage already weakened structures.
Acknowledgement: Specially thanks the professional technical support to the study by the members of our research group, who have provided a stimulating and collaborative environment.
Funding Statement: Supported by the Scientific and Technological Research and Development Program of Xinjiang Transportation Investment (Group) Co., Ltd.: XJJTZKX-FWCG-202312-0456.
Author Contributions: The authors confirm contribution to the paper as follows: study conception: Jiuqing Zhou, Daming Lin, Leifa Li, Guanghui Zhang; data collection: Shumao Qiu, Daming Lin; analysis and interpretation of results: Leifa Li, Guanghui Zhang; draft manuscript preparation: Jiuqing Zhou, Daming Lin, Shumao Qiu. All authors reviewed the results and approved the final version of the manuscript.
Availability of Data and Materials: The data that support the findings of this study are available from the corresponding author upon reasonable request.
Ethics Approval: Not applicable.
Conflicts of Interest: The authors declare no conflicts of interest to report regarding the present study.
References
1. Waqas HA, Su D, Nagayama T. Investigation of seismic response amplification effects of diverse multi-support earthquake excitations on cable-stayed bridges. Adv Struct Eng. 2024:13694332241281523. doi:10.1177/13694332241281523. [Google Scholar] [CrossRef]
2. Zhu Z, Gong W, Zhou G, Yang Y, Jiang L. A simplified weak coupling dynamic analysis method for running safety evaluation of train on bridges under earthquake excitation. Eng Struct. 2024;309:118072. doi:10.1016/j.engstruct.2024.118072. [Google Scholar] [CrossRef]
3. Ghadban AA, Wehbe NI, Pauly T. Seismic performance of self-consolidating concrete bridge columns. Eng Struct. 2018;160:461–72. doi:10.1016/j.engstruct.2018.01.065. [Google Scholar] [CrossRef]
4. Stefanidou SP, Paraskevopoulos EA, Papanikolaou VK, Kappos AJ. An online platform for bridge-specific fragility analysis of as-built and retrofitted bridges. B Earthq Eng. 2022;20(3):1717–37. doi:10.1007/s10518-021-01299-3. [Google Scholar] [CrossRef]
5. Miano A, Iacovazzo P, Mele A, Ludovico MD, Prota A. Seismic fragility of circular piers in simply supported RC bridges: a proposal for capacity assessment. Eng Struct. 2024;302:117426. doi:10.1016/j.engstruct.2023.117426. [Google Scholar] [CrossRef]
6. Maragakis EA, Jennings PC. Analytical models for the rigid body motions of skew bridges. Math Comput Model. 1989;12(3):377. doi:10.1016/0895-7177(89)90115-5. [Google Scholar] [CrossRef]
7. Kim SH, Shinozuka M. Effects of seismically induced pounding at expansion joints of concrete bridges. J Eng Mech. 2003;129(11):1225. doi:10.1061/(ASCE)0733-9399(2003)129:11(1225). [Google Scholar] [CrossRef]
8. Iemura H, Pradono MH, Takahashi Y. Report on the tsunami damage of bridges in banda aceh and some possible countermeasures. Environ Syst Res. 2005;28:214. doi:10.11532/proee2005.28.214. [Google Scholar] [CrossRef]
9. Wang Z, Dueñas-Osorio L, Padgett JE. Influence of scour effects on the seismic response of reinforced concrete bridges. Eng Struct. 2014;76:202–14. doi:10.1016/j.engstruct.2014.06.026. [Google Scholar] [CrossRef]
10. Kang L, Magoshi K, Ge H, Nonaka T. Accumulative response of large offshore steel bridge under severe earthquake and ship impact due to earthquake-induced tsunami flow. Eng Struct. 2017;134:190–204. doi:10.1016/j.engstruct.2016.12.047. [Google Scholar] [CrossRef]
11. Akiyama M, Frangopol DM, Ishibashi H. Toward life-cycle reliability-, risk- and resilience-based design and assessment of bridges and bridge networks under independent and interacting hazards: emphasis on earthquake, tsunami and corrosion. Struct Infrastruct E. 2019;16:26–50. doi:10.1080/15732479.2019.1604770. [Google Scholar] [CrossRef]
12. Xie Y, Zhang J, DesRoches R, Padgett JE. Seismic fragilities of single-column highway bridges with rocking column-footing. Earthq Eng Struct D. 2019;48(7):843–64. doi:10.1002/eqe.3164. [Google Scholar] [CrossRef]
13. Kilanitis I, Sextos A. Impact of earthquake-induced bridge damage and time evolving traffic demand on the road network resilience. J Traffic Transp Eng. 2019;6(1):35–48. doi:10.1016/j.jtte.2018.07.002. [Google Scholar] [CrossRef]
14. Nunia B, Rahman T. A study of vehicle-bridge dynamic interaction due to Indian Road Congress (IRC) class A and B loading. Mech Solids. 2020;55:437–59. doi:10.3103/S0025654420030115. [Google Scholar] [CrossRef]
15. Ghasemi SH, Lee JY. Measuring instantaneous resilience of a highway bridge subjected to earthquake events. Transport Res Rec. 2021;2675(9):1681–92. doi:10.1177/03611981211009546. [Google Scholar] [CrossRef]
16. Zhang W, Liu Y, Chen Y, Du X. Study on the pier bottom self-centering seismic isolation structure of the high-pier continuous rigid frame bridges. Soil Dyn Earthq Eng. 2023;174:108189. doi:10.1016/j.soildyn.2023.108189. [Google Scholar] [CrossRef]
17. Zeng X, Deng K, Wang Y, Yan G, Zhao C. Field investigation and numerical analysis of damage to a high-pier long-span continuous rigid frame bridge in the 2008 Wenchuan earthquake. J Earthq Eng. 2022;26(10):5204–20. doi:10.1080/13632469.2020.1868361. [Google Scholar] [CrossRef]
18. Wei B, Yue N, Yu P, Zhou S, Jiang L. Experimental and numerical study on honeycomb T-beam bridge deck. Eng Fail Anal. 2024;164:108686. doi:10.1016/j.engfailanal.2024.108686. [Google Scholar] [CrossRef]
19. Xiao JL, Wei XK, Wang P, Zhang MN. Research on longitudinal seismic response of continuous welded rail on bridge with high-pier and long-span. Adv Mat Res. 2013;838–841:1063–8. doi:10.4028/www.scientific.net/AMR.838-841.1063. [Google Scholar] [CrossRef]
20. Dai GL, Liu WS. Applicability of small resistance fastener on long-span continuous bridges of high-speed railway. J Cent South Univ. 2013;20:1426–33. doi:10.1007/s11771-013-1631-7. [Google Scholar] [CrossRef]
21. Chen ZW, Han ZL, Zhai W, Yang JZ. TMD design for seismic vibration control of high-pier bridges in Sichuan-Tibet railway and its influence on running trains. Veh Syst Dyn. 2019;57(2):1–19. doi:10.1080/00423114.2018.1457793. [Google Scholar] [CrossRef]
22. Yen WP, Dekelbab W, Khaleghi B. Connections for integral jointless bridges in seismic regions suitable for accelerated bridge construction. Transp Res Rec. 2017;2642(1):147–54. doi:10.3141/2642-16. [Google Scholar] [CrossRef]
23. Deng TF, Huang JW, Cao MS, Li DY, Bayat M. Seismic damage identification method for curved beam bridges based on wavelet packet norm entropy. Sensors. 2021;22(1):239. doi:10.3390/s22010239. [Google Scholar] [PubMed] [CrossRef]
24. Zelaschi C, Angelis GD, Giardi F, Forcellini D, Monteiro R. Performance based earthquake engineering approach appled to bridges in a rod network. In: 5th International Conference on Computational Methods in Structural Dynamics and Earthquake Engineering Methods in Structural Dynamics and Earthquake Engineering, 2015 May 25–27; Crete Island, Greece. doi:10.7712/120115.3438.1833. [Google Scholar] [CrossRef]
25. Zhao JL, Gong WM, Zhao MH, Liu MH, Liu XM, Dai GL, et al. Specifications for design of foundation of highway bridges and culverts (JTG 3363-2019). Beijing, China: China Communications Press; 2019 (In Chinese). [Google Scholar]
26. Forcellini D, Tanganelli M, Viti S. Response site analyses of 3D homogeneous soil models. Emerg Sci J. 2018;5(2):238–50. doi:10.28991/esj-2018-01148. [Google Scholar] [CrossRef]
27. Gao MT, Chen GX, Xie FR, Xu XW, Li XJ, Yu YX, et al. Seismic ground motion parameters zonation map of China (GB 18306-2015). Beijing, China: China Earthquake Administration; 2015 (In Chinese). [Google Scholar]
28. Li JZ, Tao XX, Zheng WS, Zhang XD, Lin JH, Zheng G, et al. Specifications for seismic design of highway bridges. Beijing, China: Ministry of Transport of the People’s Republic of China; 2015 (In Chinese). [Google Scholar]
29. Xu J. Transverse seismic performance analysis of highway bridge with double column piers (Master Thesis). Lanzhou Jiaotong University: Lanzhou, China; 2021 (In Chinese). [Google Scholar]
30. Yuan HH, Wu QX, Huang YF, She ZM. Experimental and theoretical studies on the seismic performance of CFST battened built-up column piers. Eng Struct. 2020;206(110099):1–16. doi:10.1016/j.engstruct.2019.110099. [Google Scholar] [CrossRef]
Cite This Article
 Copyright © 2025 The Author(s). Published by Tech Science Press.
This work is licensed under a Creative Commons Attribution 4.0 International License , which permits unrestricted use, distribution, and reproduction in any medium, provided the original work is properly cited.
 Downloads
 Citation Tools