
 Submit a Paper
 Propose a Special lssue
 Open Access
ARTICLE

Safety Evaluation of Bridge under Moving Abnormal Indivisible Load Based on Fusing Bridge Inspection Data and Load Test Data
1 Beijing Construction Engineering Quality Third Test Institute Co., Ltd., Beijing, 100037, China
2 School of Civil Engineering and Transportation, State Key Laboratory of Subtropical Building and Urban Science, South China University of Technology, Guangzhou, 510640, China
3 Beijing Yongan Municipal Construction & Investment Co., Ltd., Beijing, 102200, China
4 Beijing Municipal Engineering Research Institute, Beijing, 100037, China
* Corresponding Authors: He Zhang. Email: ,
; He-Qing Mu. Email:
(This article belongs to the Special Issue: Health Monitoring and Rapid Evaluation of Infrastructures)
Structural Durability & Health Monitoring 2025, 19(3), 499-530. https://doi.org/10.32604/sdhm.2025.059070
Received 27 September 2024; Accepted 06 January 2025; Issue published 03 April 2025
 View Full Text
 Download PDF
Abstract
Safety evaluation of a bridge under Moving Abnormal Indivisible Loads (MAILs) directly relates to whether an oversized and/or overweight Large-Cargo Transportation (LCT) vehicle is permitted to pass the bridge. Safety evaluation can be updated by fusing bridge inspection data and load test data, but there are two fundamental difficulties in updating. The first difficulty is to develop an updating scheme to utilize the unstructured inspection data. The second difficulty is to develop a successive updating scheme using load test data based on the previous updating results of the inspection data. This paper proposed a framework, consisting of three modules, to tackle these two fundamental difficulties of updating. Module one is the updating of Finite Element Model (FEM) and resistance of the bridge based on fusing bridge inspection data and load test data. The first difficulty in utilizing the unstructured inspection data is tackled by introducing updating guidelines using the unstructured inspection data. The second difficulty in conducting a successively updating scheme using load test data based on previous updating results is tackled by Bayesian updating. Module two is the simulation of a bridge under a MAIL, updating the Probability Density Functions (PDFs) of Load Effects (LEs) of critical sections of critical components based on the updated FEM and the given MAIL. Module three is the safety evaluation of the bridge based on the load-bearing capacity index and reliability index, updating indices based on the updated resistance and LE. The illustrative examples consist of a simulated example and an engineering example, demonstrating the effectiveness of the proposed framework. The simulated example is the safety evaluation of a bridge under a MAIL, and the engineering example is the safety evaluation of the Anning River Bridge of the Yazhong-Jiangxi Ultra-High-Voltage Direct Current (UHVDC) MAIL project. The results show that it is crucial to fuse bridge inspection data and load test data for updating the safety evaluation of bridges under MAILs.Keywords
Road transportation of oversized and/or overweight cargo, for example, agricultural machinery, production lines, and equipment for construction, mining, or other special purposes, is important for industrial development and economic growth. This special transportation and the corresponding transportation vehicle are called the Large-Cargo Transportation (LCT) and LCT vehicle, respectively. From the civil infrastructure point of view, the LCT vehicle is a Moving Abnormal Indivisible Load (MAIL). Especially, the MAIL will significantly affect the safety of highway bridges, so it is crucial to conduct a safety evaluation of bridges under MAILs. From the governing authority’s point of view, there are two categories of oversized and/or overweight vehicles: permit vehicles and illegal vehicles. An LCT vehicle is a permitted vehicle operating legally under permissions granted by the authority. It is suggested in [1] that it needs greater caution by the authority when permits for oversized and/or overweight vehicles are issued, since the possibility of inducing limit states overcoming events is considerably higher than for ordinary vehicles. Intelligent transportation system-based real-time traffic management strategies can be used to protect the bridge from overloading, and a brief discussion of this approach can be found in [1,2].
The European Commission regulated the weight and speed of the LCT vehicle, and the Danish Road Directorate encoded an informatics program to assist in the approval of permits [3]. To protect highways, the Federal Highway Administration of the United States provided an oversized/overweight load permit for each State [4]. Australia set provisions on the mass limit of single axles of agricultural vehicles [5]. China established an approval standard for LCT, including “pre-transport safety evaluation and in-transport health monitoring of civil infrastructures”. In 2023, the Ministry of Transport of the People’s Republic of China issued the “Technical Specifications for Highway Transport Safety Audit of Abnormal Indivisible Load” (hereinafter called Specifications of Abnormal Indivisible Load (JTG/T 2013-2023) [6]) as a recommended standard. According to these specifications, the technical condition (or health condition) grade of a bridge should be determined based on the “Specifications for Maintenance of Highway Bridges and Culverts” (hereinafter called Specifications for Maintenance (JTG 5120-2021) [7]) and the “Specification for Inspection and Evaluation of Load-bearing Capacity of Highway Bridges” (hereinafter called Specification for Load-bearing Capacity (JTG/T J21-2011) [8]). Bridges with technical condition grades 4 and 5 are not permitted for the pass of LCT vehicles; and bridges with grades one, two, or three must undergo a structural passability evaluation based on the safety evaluation of bridges. There are two approaches for bridge safety evaluation under MAILs: vehicle Load Effect (LE) comparison approaches and vehicle LE checking approaches. The principles, applicable scope, and calculation processes of these two methods are different, and the following will provide a detailed discussion.
Vehicle LE comparison approaches compare the LE value of the LCT Vehicle with the design vehicle LE value. According to the Specifications of Abnormal Indivisible Load (JTG/T 2013-2023) [6], when the technical condition of the bridge is classified as grade 1 or 2, and the total weight LE
Vehicle LE checking approaches compare the LE of the MAIL with the resistance of the structural component. According to the Specifications of Abnormal Indivisible Load (JTG/T 2013-2023) [6], the LE value of the MAIL must be compared with both the ultimate limit state of load-bearing capacity and the serviceability limit state under permanent conditions, as specified in the “General Specifications for Design of Highway Bridges and Culverts” (JTG D60-2015) [15] and “Unified standard for reliability design of highway engineering structures” hereinafter called Standard for Reliability Design (JTG 2120-2020) [16]. The safety evaluation can be conducted based on the Specification for Load-bearing Capacity (JTG/T J21-2011) [8]. The Specifications of Abnormal Indivisible Load (JTG/T 2013-2023) [6] states the range of application of these approaches: 1) when the technical condition of the bridge is at grade one or two, and the total weight LE
Vehicle LE checking approaches are more suitable than vehicle LE comparison approaches for the safety evaluation of bridges under MAILs, but there still exists a critical but unsolved issue for vehicle LE checking approaches. That is, updating the safety evaluation of a bridge by fusing its inspection data and load test data. The safety evaluation depends on the LE and resistance, and the latter two factors depend on the basic quantities of interest (QoI), such as the material and geometry parameters of structural components. However, most of the existing research performed safety evaluation of bridges under MAILs based on bridge design data only without considering any updating [18]. There are two fundamental difficulties in updating. First, the inspection data contains both the structured data (e.g., sample test data of material strength and unstructured data) and the unstructured data (e.g., qualitative description of weathering, carbonization, physical and chemical damage of components). The structured data can be directly utilized to update the corresponding QoI while the unstructured data cannot. The first difficulty is to develop an updating scheme to utilize the unstructured inspection data. Second, the load test is the follow-up action of the inspection, so the successively updating using the load test data should be conducted based on the updating results of the inspection data. Most of the existing research performed safety evaluation without conducting this successively updating, e.g., updating based on load test data only [17,19] or based on bridge maintenance data only [18,20] but ignoring bridge inspection data. The second difficulty is to develop a successive updating scheme using load test data based on the previous updating results of the inspection data.
In order to tackle these two fundamental difficulties of updating, this paper proposed a framework for the safety evaluation of bridges under MAILs based on fusing bridge inspection and load test data. The framework consists of three modules. Module one is the updating of FEM and resistance of the bridge based on fusing bridge inspection data and load test data. The first difficulty in utilizing the unstructured inspection data is tackled by introducing the updating guidelines using the unstructured inspection data (recommended by Specification for Load-bearing Capacity (JTG/T J21-2011) [8]). The updating guidelines are a series of empirical equations, obtained from previous experiment studies of the unstructured inspection data and Delphi method [8]. Correspondingly, the basic QoIs are selected compatible with [8]. The above key technique is fused into the design data and structured inspection data, so updating can be performed on the Probability Density Functions (PDFs) of basic Random Variables (RVs), the FEM, and the PDF of the resistance. The second difficulty in conducting a successively updating scheme using load test data based on previous updating results is tackled by Bayesian updating. The stiffness substructural parameters are the re-parameterization of the stiffness matrix of the inspection stage. Prediction-error including measurement and modeling uncertainties are considered. The posterior PDF of the parameters is obtained based on the load test data and the prior PDF reflecting the previous updating results of the inspection data. Module two is the simulation of a bridge under a MAIL, updating of the PDFs of LEs of critical sections of critical components based on the updated FEM and the given MAIL. Module three is the safety evaluation of the bridge based on load-bearing capacity index [8] and reliability index, updating indices based on the updated resistance and LE. The focus of module three is not to develop a novel algorithm to evaluate the reliability integral, but to successively update load-bearing capacity index and reliability index for the safety assessment of an existing bridge based on the initial dataset (design data), first round updating dataset (initial dataset plus inspection data), and second round updating dataset (first round updating data plus load test data). The illustrative examples consist of a simulated example and an engineering example, demonstrating the effectiveness of the proposed framework.
Fig. 1 shows the framework of safety evaluation of the bridge under MAIL based on fusing bridge design, inspection, and load test data. Note that

Figure 1: Framework of safety evaluation of bridge under MAIL based on fusing bridge design, inspection and load test data
Table 1 shows the outline of module one, two, and three, as well as the initial round, first round updating, and second round updating, of the proposed framework. The table has ten rows, namely, R1 to R10, and three columns, namely, C1 to C3. Based on the row and column numbers of each cell in Table 1, one can quickly identify the location of the cell. For example, cell (R6, C2) is for the PDF of resistance of first round updating.

Modules one, two, and three correspond to cell (R1:R6, C1:C3), cell (R7:R8, C1:C3), and cell (R9:R10, C1:C3), respectively. The initial round, first round updating, and second round updating correspond to cell (R1:R10, C1), cell (R1:R10, C2), and cell (R1:R10, C3), respectively. Module one is the updating of FEM and resistance of the bridge based on fusing bridge inspection data and load test data. In order to utilize the unstructured inspection data, the updating guidelines using the unstructured inspection data recommended by Specification for Load-bearing Capacity (JTG/T J21-2011) [8] is introduced. These guidelines are a series of empirical equations, obtained from previous experiment studies of the unstructured inspection data and Delphi method. Correspondingly, the basic QoIs are selected compatible with the code [8]. The above key technique is fused into the design data and structured inspection data, so updating can be performed on the Probability Density Functions (PDFs) of basic RVs, the FEM, and the PDF of the resistance. A successively updating scheme using load test data based on previous updating results is tackled by Bayesian updating. The stiffness substructural parameters are the re-parameterization of the stiffness matrix of the inspection stage. Prediction-error including measurement and modeling uncertainties are considered. The posterior PDF of the parameters is obtained based on the load test data and the prior PDF reflecting the previous updating results of the inspection data. Module two is the simulation of a bridge under a MAIL, updating the expectations and PDFs of LEs of critical sections of critical components based on the updated FEM and the given MAIL. Module three is the safety evaluation of the bridge based on load-bearing capacity index [8] and reliability index, updating indices based on the updated resistance and LE. The focus of module three is not to develop a novel algorithm to evaluate the reliability integral, but to successively update load-bearing capacity index and reliability index for the safety assessment of an existing bridge based on the initial dataset (design data), first round updating dataset (initial dataset plus inspection data), and second round updating dataset (first round updating data plus load test data). Details of Table 1 will be presented in Section 3.
3.1 Module One: Updating of FEM and Resistance of Bridge Based on Fusing Bridge Inspection Data and Load Test Data
Module one, shown in the bold-dash part ‘3.1’ of Fig. 1 and cell (R1:R6, C1:C3) of Table 1, is the updating of FEM and resistance of bridge based on fusing bridge inspection data and load test data. According to the QoI (Quantity of Interest), module one focuses on totally six QoI. Cell (R1, C1:C3), cell (R2, C1:C3), and cell (R3, C1:C3) of Table 1 are the basic QoI (Quantity of Interest), the inference/updating method of basic QoI, and the PDF of basic QoI, respectively, of three rounds. Note that the basic QoIs are for those quantities for which observational data are available or can be obtained. Cell (R4, C1:C3) is the FEM of three rounds. Cell (R5, C1:C3) and cell (R6, C1:C3) are the design/Code-Com resistance and the PDF of resistance, respectively. According to the utilized data for inference/updating, i.e.,
3.1.2 Initial FEM (FEM0) and Resistance (R0) Based on Bridge Design Data (Ddesign)
The initial round is outlined in cell (R1:R6, C1) of Table 1. Although many quantities can be considered, this study selected the same basic QoI as the code (Specification for Load-bearing Capacity (JTG/T J21-2011) [8]). Thus,
The initial FEM (
where
3.1.3 First Round Updating of FEM (FEM’) and Resistance (R’) Based on Bridge Inspection Data (Dinspection)
The first round updating is outlined in cell (R1:R6, C2) of Table 1. Before the first round updating based on

Table 3 shows first round updating of basic QoI based on

According to the second row of Table 3, the code [8] only gives guidelines about how to achieve
where the likelihood function adopts the widely accepted assumption on statistical independent between
where
Based on the third and fourth rows of Table 3,
where
Based on the fifth and sixth rows of Table 3,
where
The updated
The Code-Com resistance
The PDF of resistance
Similar to cell (R6, C1),
One may be concerned about the issue of the completeness of an inspection report. The framework is still applicable to any inspection report without prescribing the complement of the inspection report. This is because the proposed framework fuses the updating guidelines of Specification for Load-bearing Capacity (JTG/T J21-2011) [8], and this specification allows the inspection data to be incomplete.
3.1.4 Second Round Updating of FEM (FEM”) and Resistance (R”) Based on Bridge Load Test Data (Dtest)
The second round updating is outlined in cell (R1:R6, C3) of Table 1. The purpose of the load test is to verify whether the bridge structure fulfills the design load or special load requirements. The MAIL belongs to the special load. In the basis of
Consider the bridge under the load test is monitored by a sensor network with
When using the physical parameter-based updating, one or more material properties are used as parameters, and the updated material parameters
When using the substructural parameter-based updating, the concept of substructures and substructure scaling parameters are introduced. First, the total stiffness matrix in the round one updating,
where
where
The measured noisy output at the
where
By collecting load test data up to
According to Bayes’ theorem, we proposed the posterior PDF fusing design data, inspection data, and load test data:
where
where
Through this model updating process, the
According to Section 8 of [8], if the bridge load test is passed, the Code-Com resistance
where
where
3.2 Module Two: Simulation of Bridge under MAIL
Module two, shown in the dash part ‘3.2’ of Fig. 1 and cell (R7:R8, C1:C3) of Table 1 is the simulation of a bridge under a MAIL. In Table 1, cell (R7, C1:C3) is the expectation of LE, and cell (R8, C1:C3) is the PDF of LE. The simulation analysis involves obtaining the LEs (denoted as
Fig. 2 shows a simulation of bridge under MAIL for the three FEMs mentioned above, the stiffness matrices are extracted, and the probability distributions of their elements are analyzed. By adding the load model of MAIL, the LEs on the bridge under MAIL conditions can be obtained. Based on the safety evaluation requirements, critical components are selected for evaluation, and critical sections are identified according to specifications or calculation results. The LEs at these critical sections, including internal forces and deflections, can be examined in the finite element analysis software. Additionally, the distribution of the LEs can be further determined using statistical data and design information. The simulation results obtained from the different models will be used for the next stage of safety evaluation.

Figure 2: Simulation of bridge under MAIL
For the safety evaluation of bridges under MAIL, only one specific LCT vehicle is considered, and its total weight and axle weights are fixed and given. Common types of trailers used in LCT include semi-trailers, full trailers, and specialized trailers for transporting specific cargo [40]. A semi-trailer has its axles located behind the center of gravity of the vehicle and transmits horizontal or vertical forces to the towing vehicle through its coupling device. The features of semi-trailers include high load capacity, faster speed compared to full trailers, the ability to carry larger and taller cargo, and a shorter, more maneuverable body compared to full trailers. Common types of semi-trailers mainly include heavy-duty low-bed trailers, box semi-trailers, and gooseneck flat semi-trailers.
A full trailer, on the other hand, has no power of its own, is independently load-bearing, and is connected to the towing vehicle via a hitch. The towing vehicle does not bear any load, providing only the power needed to overcome road friction, while the load is entirely supported by the full trailer. Compared to semi-trailers, full trailers can carry larger and heavier abnormal loads, but they are slower and less maneuverable. The most common full-trailer combinations in highway abnormal indivisible load transportation are of three types: flatbed trailers, recessed flatbed trailers, and long cargo trailers.
LCT vehicles commonly adopt multi-axle multi-wheel hydraulic flatbed trailers [41]. Compared to standard vehicles, hydraulic flatbed trailers have a larger load-bearing surface area, longer vehicle length, and a broader longitudinal load impact range, which exerts a greater influence on bridges. The reason for selecting multi-axle hydraulic flatbed trailers in LCT is that, not only these trailers distribute the axle load evenly and ensure uniform stress on the bridge structure when the vehicle crosses, but also they can reduce axle load by increasing the number of axles, allowing them to comply with the axle load limits specified in regulations. The axle spacing of hydraulic flatbed trailers generally ranges from
Fig. 3 shows a demonstration of axle load configuration of an LCT vehicle. According to Specifications of Abnormal Indivisible Load (JTG/T 2013-2023) [6], the axle load configuration of the specific LCT vehicle is given before bridge safety evaluation. Thus, the proposed framework can adopt any LCT vehicle and the corresponding MAIL. As the MAIL of an LCT vehicle is a moving load, it consists of two parts: the position of the axles

Figure 3: Demonstration of axle load configuration of an LCT vehicle
3.2.3 LEs of Critical Sections of Critical Components
In structural engineering, LEs refer to the response of a structure under the applied loads, such as internal forces (e.g., axial force, shear force, bending moment), deflections, and cracks [42]. Because there are many components of a bridge, the first issue is to select or identify critical sections of critical components. It can be done based on the guidelines [8], expert judgment (e.g., structural components with poor operational conditions indicated in the bridge inspection report), or other reanalysis methods (e.g., the most unfavorable section for moving loading in bridge engineering [43,44]), or sensitivity analysis of structural responses with respect to MAIL and/or the basic QoI. Let
Note that as MAIL is a moving load, maximum LE has to be considered. It is worth noting that because the current study focuses on the safety evaluation of a bridge under an LTC vehicle in the situation that the bridge is temporarily closed to public traffic during the LTC vehicle passes through the bridge, the vehicle LE can be obtained from module two without considering other vehicles. Another issue is about choosing static analysis or dynamic analysis. Different from traditional vehicles, the speed of an LTC vehicle should be limited to a very low range. According to Specifications of Abnormal Indivisible Load (JTG/T 2013-2023) [6], the speed of a vehicle is limited at the range from 0 to 20 km/h: when the speed is less than or equal to 5 km/h, static analysis is conducted; when the speed is at the range from 5 to 20 km/h, static analysis combined with empirical dynamic impact coefficient, which is also related to the fundamental frequency of the bridge, is conducted. It is worth noting that the difficulty is not conducting dynamic analysis but achieving dynamic properties of the LCT vehicle. However, these dynamic properties are not provided in most engineering problems. Practically, due to the distinctiveness of LCT, the speed is less than 5km/h unless otherwise specified, so choosing static analysis is suitable.
The simulation of a bridge under a MAIL can be treated as static moving load problem. This problem can be solved using the influence line, which is a functional used to describe the variation of the LE at a given section under a unit moving load. Let
where
Referred to cell (R7, C1:C3) of Table 1, the expectation of the LE of three rounds can be evaluated at the optimal value of the basic QoI:
Referred to cell (R7, C1:C3) of Table 1, the PDFs of the LE of three rounds is:
where
3.3 Module Three: Safety Evaluation of Bridge Based on Load-Bearing Capacity and Reliability
Melchers et al. (2018) [46] discussed the hierarchy of structural reliability measures (see Section 2.6 and Table 2.11 of [46]): Level 1: the partial factor approach. It is a non-probabilistic generalized version of the traditional safety factor and load factor formats. It is the format most commonly used for limit state design codes and thus for applied engineering design work at the present time. Level 2 (Second moment methods): nominal probabilities based on the use of the normal distribution and some simple mathematical forms for the limit state function. Level 3 (Exact methods): the best estimate of the probability of failure, using accurate probability models as well as the use of human error and intervention data if available. Structural system effects and the influence of time may be of importance. Level 4 (Decision Methods): minimum cost or maximum benefit, i.e., any of level 1 to 3 plus economic data. Note that although Melchers et al. (2018) [46] called level 1 a “code level method”, in the newly developed code of level 1, the partial factors are calibrated using level 2 (Second moment methods) or level 3 (Exact methods). Nowak (2012) [47] discussed about the code levels. A design code intends to provide a minimum safety level. Current codes use deterministic formulas, but the optimum design will require the consideration of structural reliability as an acceptance criterion. The acceptance criterion is defined in terms of the closeness of the actual reliability index to the optimum reliability level (or probability of failure). Depending on the approach to reliability, the codes are classified into four levels (see Section 8.3 of [47]): Level I codes: These codes use deterministic design formulas. The safety margin is introduced through central safety factors (ratio of design resistance to design load) or partial safety factors (load and resistance factors). Level II codes: These codes define the acceptance criterion in terms of the “closeness” of the actual reliability index for a design to the target reliability index or other safety-related parameters. Level III codes: These codes require a full reliability analysis to quantify the probability of failure of the structure under various loading scenarios. The acceptance criterion is defined in terms of the closeness of the actual reliability index to the optimum reliability level (or probability of failure). Level IV codes: These codes use the total expected cost of the design as the optimization criterion. The acceptable design maximizes the utility function that describes the difference between the benefits and costs associated with a particular design. Note that Standard for Reliability Design (JTG 2120-2020) [16], AASHTO LRFD bridge design specifications [48], Specification for Load-bearing Capacity (JTG/T J21-2011) [8], and Manual for Bridge Evaluation (MBE) [49] belongs to level II codes.
Module three, shown in the dotted part ‘3.3’ of Fig. 1 and cell (R9:R10, C1:C3) of Table 1, is the safety evaluation of the bridge based on load-bearing capacity and reliability. In Table 1, cell (R9, C1:C3) is the Load-bearing capacity index and cell (R10, C1:C3) is the reliability index. In addition to the above two common indices, there are some other indices, e.g., a new risk index combining the probability/frequency and consequences/severity of bridge failure or overloading event [2]. When the load-bearing capacity index is used, the expectation of the LE (

Figure 4: Safety evaluations of different rounds
3.3.2 Load-Bearing Capacity Index
In load-bearing capacity assessment, the partial safety factors of load and resistance are derived based on limit state design, i.e., the corresponding reliability reaches a minimum required reliability index (target reliability index). This paper adopts load-bearing capacity index of the specification [8], which is similar to the rating factor in Load and Resistance Factor Rating (LRFR) [49]. The resistance (
(1) Initial round
where
(2) First round updating
(3) Second round updating
Finally, if the above inequality holds, the structure is considered safe; otherwise, it is unsafe. It is worth noting that in contrast to the specification [8] not considering the updating of FEM, the proposed framework gives a better estimation on the LE
The structural reliability theory accounts for all factors influencing the reliability of a structure as random variables. Utilizing extensive field measurement and testing data, statistical methods are employed to identify the statistical distributions of each random variable and to assess the failure probability
where
Define the indicator function
The failure probability integral can be formulated as [55]:
where
(1) Initial round
Both
where
(2) First round updating
Both
where
(3) Second round updating
If the bridge load test is passed, the resistance
The second is the approximated way by neglecting the dependency between
According to Chapter 3 of the that Standard for Reliability Design (JTG 2120-2020) [16], the reliability index must not be less than the target reliability index
where
When performing a reliability index evaluation, a target reliability index
3.3.4 Additional Note: Influence of Measured Data on Updating Process and Safety Evaluation
Recall Fig. 1 and Table 1, the proposed framework, based on conducting inference of three rounds (i.e., initial round, first round updating, and second round updating), performs safety evaluation of the bridge under MAIL based on fusing bridge design, inspection, and load test data.
One may be concerned about whether the proposed framework is still applicable to the situation with load test data but without inspection data. From an engineering point of view, this situation violates the current specification because a bridge technical inspection should be always performed before a bridge load test [8]. Therefore, it is rare for the situation with load test data but without inspection data. From a theoretical point of view, this situation can still be tackled by the proposed framework. This can be simply done by setting the results of first round updating as that of the initial round and then performing second round updating based on the ‘duplicated’ first round updating.
Another concerned question may be the influence of measured data on the updating process and safety evaluation. Qualitatively, for a bridge without any damage and with very good technical grade, the FEM models and safety evaluation results of three rounds are similar; for a bridge with minor damage, the results of the first and second round updating are more reliable compared to the initial model due to changes in the structure; for a bridge with significant damage or those that have been in service for a long time, the evaluation results of the second round updating model are the most reliable, as inspection reports often cannot fully infer or describe internal structural changes. Quantitatively, the above influence can be studied using sensitivity analysis. The input is the updated PDF of the basic RVs while the output can be resistance, LE related to FEM, or failure probability. For resistance and LE, many tools can be adopted. For example, Taylor importance factors (see Eq. (2.6) of [67]), derived from a Taylor expansion, are defined to rank the sensitivity of the output (resistance or LE) to the inputs (basic RVs) for central dispersion analysis. For failure probability, the sensitivity analysis of analytical cases, which is rare practically, is solvable, but that of general cases, relying on the MCS, becomes subtle. Naively, one may think that, if the effect of changing one or more basic RVs on the failure probability is required to be evaluated, two MCS assessments, with and without the change and comparing them, can be applicable. However, the uncertainty of the above approaches may be too large to make a meaningful conclusion. This is because the change is obtained by subtracting the outputs, while the variance for the change is obtained by adding the two variances. One way to alleviate the uncertainty between two outputs is to employ the same set of random numbers for both probability estimates (see Section 3.4.6 of [46]). Another insight thought about the sensitivity of failure probability with respect to uncertain basic RVs is made (see Eq. (6.7) of [55]). According to Bayes’ theorem, the relation between conditional failure probability, i.e.,
The above equation indicates that the influence on failure probability can be studied through
A final note is that decision making for both updating and safety evaluation should always attempt to fuse as much data as possible. If all data (design, inspection, and load test data) are available, the results of second round updating are the most reliable while the results of the initial and first round can be served for reference.
4 Illustrative Examples: Simulation and Engineering Application
4.1 Simulated Example: Safety Evaluation of Bridge under MAIL
For a simply supported beam with a total length of

Figure 5: Critical position of LCT vehicle
An LCT Vehicle passes over the bridge, consisting of a three-axle vehicle with axle loads of
According to Specification for Load-bearing Capacity (JTG/T J21-2011) [8], it is stipulated that for concrete simply supported girder bridges, the bending moment of the mid-span section of the beam, the most unfavorable shear force near the support, and the most unfavorable bending and shear combination effect near the 1/4 section of the span should be calculated. Therefore, to check whether the simply supported beam meets the requirements of the ultimate limit state of the bearing capacity, it is required to conduct a safety evaluation of the above effects and locations. Here, safety evaluation of the bending moment at the most unfavorable section and deflection at the mid-span section are conducted, and safety evaluation of other effects can follow similar procedures.
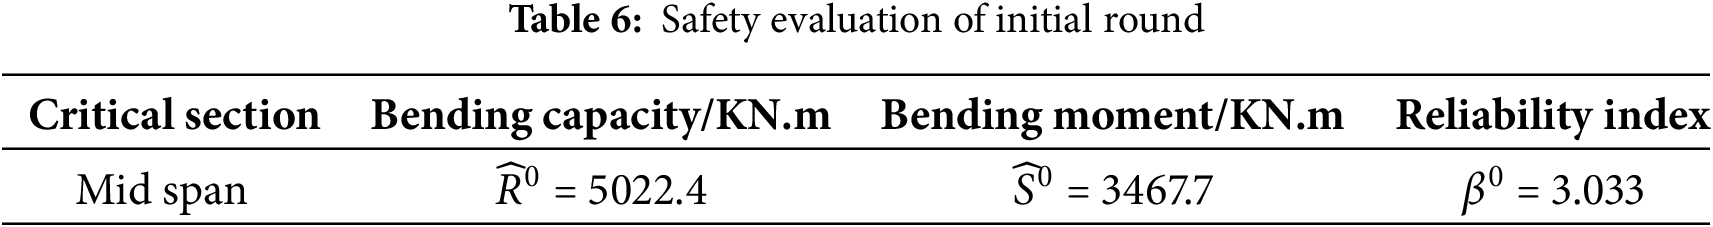
4.1.1 Safety Evaluation of Initial Round
To determine the critical section for the load moment effect, an equivalent axle load can be introduced into the calculation. The vehicle’s equivalent axle load
The LE of bending moment
where

According to the design data, the initial flexural capacity of the section is
The initial reliability index is
4.1.2 Safety Evaluation of First Round Updating
Based on the inspection data, it is known that the concrete at the critical section has spalled by
4.1.3 Safety Evaluation of Second Round Updating
Based on the load test data, the stiffness of the FEM is updated using the substructure method. Two adjacent elements are taken as one substructure, resulting in a total of six substructures, as shown in Fig. 6. During the load test, a test load of

Figure 6: Structure diagram of simulated example
The maximum deflections at mid-span before and after updating are 3.24 and
The above demonstrates safety evaluation based on fusing bridge design, inspection, and load test data. If all safety evaluation criteria are satisfied, the LCT Vehicle is permitted to pass the bridge. It is worth noting that in some special cases, the updating of structural parameters may not cause changes to some LEs. For example, in the linear elastic stage, updating the stiffness of a simply supported beam does not affect the bending moment. However, in general, the updating of structural parameters will lead to changes in LEs and further changes in load-bearing capacity indicators and reliability indices. Therefore, the method proposed in this paper is essential in the sense that it integrates bridge inspection and load test data to update all QoIs related to the safety evaluation of bridge under MAILs.
4.2 Engineering Example: Safety Evaluation of Anning River Bridge of Yazhong-Jiangxi UHVDC MAIL Project
The Anning River Bridge is located on National Highway 348 in the Xichang section. The total length of the bridge is
4.2.1 Safety Evaluation of Initial Round
The design load is Highway-Class I. The beams were constructed using C40 concrete, the cap beams were reinforced with C30 concrete, and the deck pavement was made of C40 steel-fiber waterproof concrete. Material parameters follow normal distributions, with the mean value


Figure 7: Drawing of anning river bridge: (a) Plan drawing; (b) Elevation drawing; (c) Section drawing
Fig. 8 shows the FEM in this example is established during the bridge design and is part of the bridge design data, so the finite element model in this example can accurately reflect the specific structural form, geometric characteristics, and material types of the actual bridge. The finite element model consists of six prefabricated prestressed T-beams, which are connected by diaphragms at the two fulcrums and in the middle of the span. The finite element model divides each beam into twelve elements with a total of thirteen nodes, and the elements near the supports are in the form of variable cross-sections, and the element length is smaller than that of constant cross-section. The beam body is made of C40 concrete and HRB400 steel bars, the prestressed tendons are made of steel strands, and two prestressed tendons are arranged for each beam, and the prestressed tendons are tensioned by the post-tensioning method.

Figure 8: FEM of the anning river bridge
Fig. 9 shows the axle load configuration of the LCT vehicle. The total vehicle length is

Figure 9: Axle load configuration of the LCT vehicle
4.2.2 Safety Evaluation of First Round Updating
According to the inspection data, the bridge’s T-beams showed four cases of weathering, four defect areas with honeycombing and rough surfaces, three cases of exposed reinforcement, five defect areas of concrete damage, two cases of net cracking, and one longitudinal crack. The wet joints and diaphragms did not have significant damage. The estimated compressive strength of the extracted T-beams exceeded

4.2.3 Safety Evaluation of Second Round Updating
Based on the load test data, the stiffness of the FEM is updated using the substructure method. The bridge was divided into 21 nodes with node-to-node distance being 1 m intervals. Two successive elements were treated as one substructure, so there are 10 substructures. Displacement sensors were placed from nodes 2 to 19. A test load of
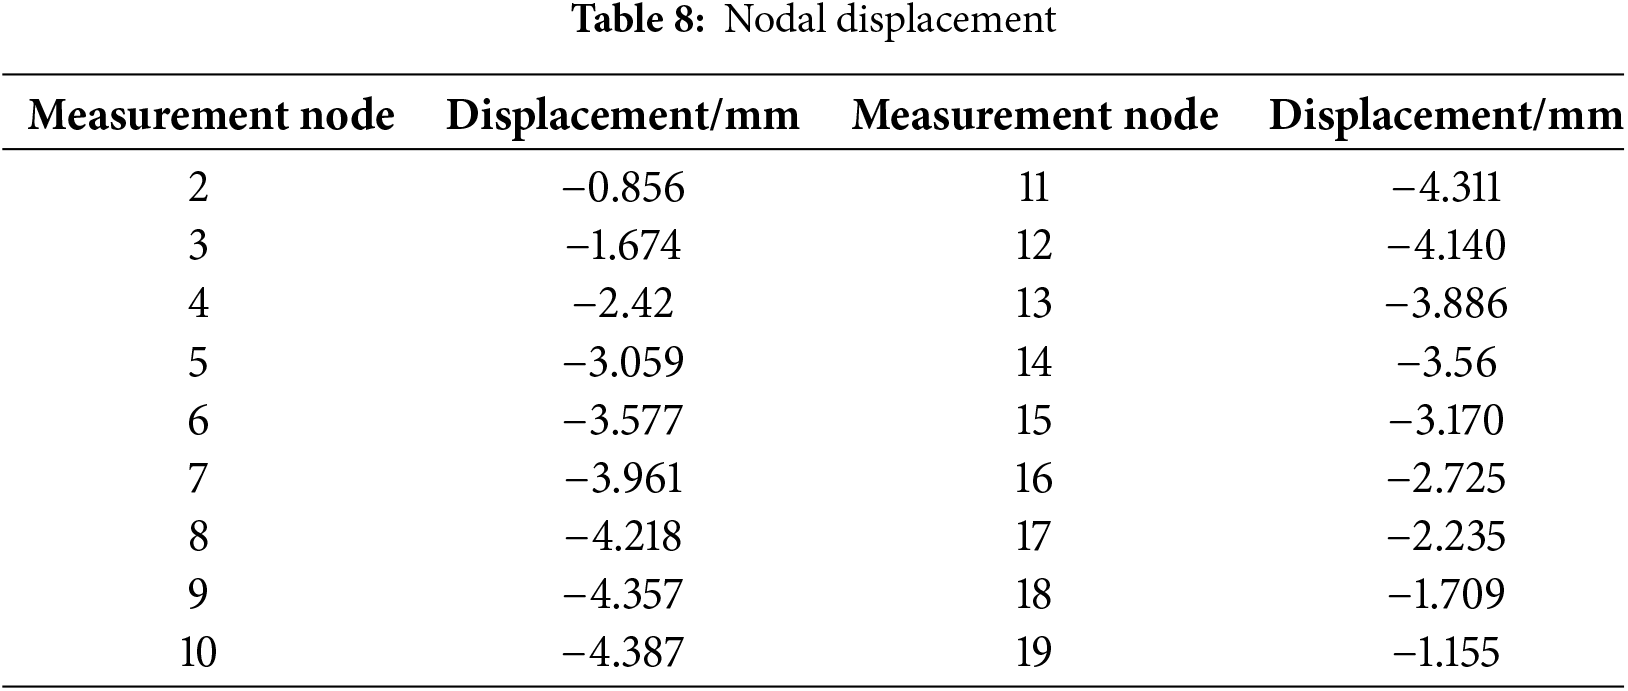
The substructural parameters were updated to be 1.0035, 1.0411, 0.9946, 0.9993, 0.9508, 0.9836, 1.0064, 1.0038, 0.9774, and 1.0000, respectively. It can be seen that the fifth substructural was subjected to about 5% degradation. In order to present how the predicted output changed with respect to the FEM updating, Fig. 10 shows comparisons of measured displacements and predicted displacements of

Figure 10: Comparisons of measured displacements and predicted displacements of
LCT vehicles are vehicles with oversized and/or overweight, so ignoring available inspection and/or load test data in the safety evaluation of the bridge under MAIL will possibly lead to a disorder in the safety evaluation results and furthermore cause overweight disaster to the bridge. On the one hand, most of the existing research performed safety evaluation of bridges under MAILs based on bridge design data only without considering any updating, or based on load test data only but still ignoring bridge inspection data. On the other hand, the proposed framework is capable of fusing bridge design, inspection, and load test data, to update safety evaluation. From utilizing data for updating point of view, the existing research is a special case of module one or two of the proposed framework.
In addition, there are three main conclusions related to updating safety evaluation:
(1) The first difficulty of updating is to develop an updating scheme to utilize the unstructured inspection data. This is tackled by introducing the updating guidelines using the unstructured inspection data recommended by the code. The updating guidelines are a series of empirical equations, obtained from previous experiment studies of the unstructured inspection data and Delphi method.
(2) The second difficulty of updating is to develop a successive updating scheme using load test data based on the previous updating results of the inspection data. This is tackled by Bayesian updating. The stiffness substructural parameters are the re-parameterization of the stiffness matrix of the inspection stage. Prediction errors including measurement and modeling uncertainties are considered. The posterior PDF of the parameters is obtained based on the load test data and the prior PDF reflects the previous updating results of the inspection data. It shows that the prediction performances are significantly improved from the initial, first, to second rounds of updating.
(3) To enhance the comprehensiveness of bridge safety evaluation, it is recommended to consider both the load-bearing capacity index and the reliability index, as well as compare and analyze the changing of the safety valuation results based on data of initial, first, and second round.
The current study focuses on the safety evaluation of a bridge under the LTC vehicle to be permitted in the situation that the bridge is temporarily closed to public traffic during the LTC vehicle passes through the bridge. Although closing to public traffic can increase bridge reliability, it decreases the efficiency of public traffic. As public traffic is a stochastic loading, future developments may incorporate this stochastic component into the proposed safety evaluation framework. The result of the safety evaluation can be utilized as a decision support for the governing authorities on traffic control during the LTC vehicle passes through the bridge.
Acknowledgement: The authors express their sincere gratitude for the help provided by Beijing Construction Engineering Quality Third Test Institute Co., Ltd. in providing data of engineering example of safety evaluation of the Anning River Bridge of the Yazhong-Jiangxi UHVDC moving abnormal indivisible load project.
Funding Statement: This research was funded by the Science and Technology Development Fund (SKL-IOTSC(UM)-2021-2023), the State Key Laboratory of Internet of Things for Smart City (University of Macau) (SKL-IoTSC(UM)-2024-2026/ORP/GA07/2023), and Guangdong Provincial Key Laboratory of Modern Civil Engineering Technology (2021B1212040003).
Author Contributions: The authors confirm contribution to the paper as follows: Conceptualization, Methodology, Data curation, Analysis and interpretation of results, Writing—original draft preparation: He Zhang; Conceptualization, Methodology, Supervision, Funding acquisition, Writing—original draft preparation, Writing—review and editing: He-Qing Mu; Data collection and curation, Resources: Xiao Zhang; Conceptualization, Methodology, Data curation, Analysis and interpretation of results, Writing—original draft preparation: He Zhang; Data curation, Analysis and interpretation of results: Yuedong Yang. All authors reviewed the results and approved the final version of the manuscript.
Availability of Data and Materials: The data that support the findings of this study are available from the corresponding author upon reasonable request.
Ethics Approval: Not applicable.
Conflicts of Interest: The authors declare no conflicts of interest to report regarding the present study.
References
1. Ventura R, Barabino B, Maternini G. Estimating the frequency of traffic overloading on road bridges. J Traffic Transp Eng (Eng Ed). 2024;11(4):776–96. doi:10.1016/j.jtte.2023.11.005. [Google Scholar] [CrossRef]
2. Ventura R, Maternini G, Barabino B. Traffic hazards on main road’s bridges: real-time estimating and managing the overload risk. IEEE Trans Intell Transp Syst. 2024;25(9):12239–55. doi:10.1109/TITS.2024.3371265. [Google Scholar] [CrossRef]
3. Infrastructure Technical Specifications for Interoperability (TSI). European best practice guidelines for abnormal road transports. European Commission: Directorate-General for Energy and Transport; 2021. [Google Scholar]
4. U.S. Department of Transportation Federal Highway Administration (FHWA). Oversize/overweight load permits. [cited 2024 Jan 5]. Available from: https://ops.fhwa.dot.gov/freight/sw/permit_report/index.htm#obt. [Google Scholar]
5. Department of Transport, Energy and Infrastructure (DTEI). Code of practice for oversize or overmass agricultural vehicles. South Australia: Government of South Australia; 2008. [Google Scholar]
6. Ministry of Transport of the People’s Republic of China. JTG/T 2213-2023: technical specifications for highway transport safety audit of abnormal indivisible load. Beijing: China Communications Press; 2023. [Google Scholar]
7. Ministry of Transport of the People’s Republic of China. JTG 5120-2021: specifications for maintenance of highway bridges and culverts. Beijing: China Communications Press; 2021. [Google Scholar]
8. Ministry of Transport of the People’s Republic of China. JTG/T J21-2011: specifications for inspection and evaluation of load-bearing capacity of highway bridge. Beijing: China Communications Press; 2011. [Google Scholar]
9. Huang PM, Wang JF, Han WS, Yuan YG. Study on impact factors of small-and medium-span bridges under the special-purpose vehicle load. Structures. 2022;43(4):606–20. doi:10.1016/j.istruc.2022.06.077. [Google Scholar] [CrossRef]
10. Yuan YG, Han WS, Xu X, Wang JF, Sun JP. Permit checking of overloaded customized transport vehicle based on serviceability limit state reliability of concrete bridges. Adv Struct Eng. 2021;24(5):884–96. doi:10.1177/1369433220972451. [Google Scholar] [CrossRef]
11. Ma DH, Wu WQ, Li Y, Zhao L, Cai YC, Guo P, et al. Numerical simulation-based analysis of the impact of overloading on segmentally assembled bridges. Struct Durab Health Monit. 2024;18(5):663–81. doi:10.32604/sdhm.2024.052677. [Google Scholar] [CrossRef]
12. Zheng X, Yi TH, Yang DH, Li HN, Zhou Y. Bridge evaluation based on identified influence lines and influence surfaces: multiple-scenario application. Int J Struct Stab Dyn. 2023;23:1640023. doi:10.1142/S0219455423400266. [Google Scholar] [CrossRef]
13. Feng K, González A, Casero M. A kNN algorithm for locating and quantifying stiffness loss in a bridge from the forced vibration due to a truck crossing at low speed. Mech Syst Signal Process. 2021;154(1):107599. doi:10.1016/j.ymssp.2020.107599. [Google Scholar] [CrossRef]
14. Zhu X, Cao M, Ostachowicz W, Xu W. Damage identification in bridges by processing dynamic responses to moving loads: features and evaluation. Sensors. 2019;19(3):463. doi:10.3390/s19030463. [Google Scholar] [PubMed] [CrossRef]
15. Ministry of Transport of the People’s Republic of China. JTG D60-2015: general specifications for design of highway bridges and culverts. Beijing: China Communications Press; 2015. [Google Scholar]
16. Ministry of Transport of the People’s Republic of China. JTG 2120-2020: unified standard for reliability design of highway engineering structures. Beijing: China Communications Press; 2020. [Google Scholar]
17. Zhang YF, Duan HJ, Ma ZG. Fast appraisal for girder bridge condition based on quasi stationary load test. Modern Transp Technol. 2009;6:21–4 (In Chinese). [Google Scholar]
18. Cui X, Chen Y, Hu N, Pan LW. Research on evaluation and monitoring methods of large-sized transport vehicles for non-closed traffic hollow slab beam bridges. Highway. 2020;65:124–9. (In Chinese). [Google Scholar]
19. Xing WB. Research on rapid assessment methods for bridge under abnormal indivisible load transportation. J China Foreign Highway. 2011;31:217–20 (In Chinese). [Google Scholar]
20. Chen YY, Mao JP, Yang QH. Research on bearing capacity and process monitoring analysis of large transport bridge. Western China Commun Sci Technol. 2021;5:101–5 (In Chinese). [Google Scholar]
21. Ministry of Housing and Urban-Rural Development of the People’s Republic of China. GB/T 50283-1999: unified standard for reliability design of highway engineering structures. Beijing: China Architecture & Building Press; 1999. [Google Scholar]
22. Ministry of Transport of the People’s Republic of China. JTG 3362-2018: specifications for design of highway reinforced concrete and prestressed concrete bridges and culverts. Beijing: China Communications Press; 2018. [Google Scholar]
23. Ministry of Transport of the People’s Republic of China. Decision on amending the ‘Highway management regulations for over-limit transport vehicles’. [cited 2024 Jan 5]. Available from: https://www.gov.cn/zhengce/zhengceku/2021-08/26/content_5633469.htm. [Google Scholar]
24. Schlune H, Plos M, Gylltoft K. Improved bridge evaluation through finite element model updating using static and dynamic measurements. Eng Struct. 2009;31(7):1477–85. doi:10.1016/j.engstruct.2009.02.011. [Google Scholar] [CrossRef]
25. Lam HF, Peng HY, Au SK. Development of a practical algorithm for Bayesian model updating of a coupled slab system utilizing field test data. Eng Struct. 2014;79(27):182–94. doi:10.1016/j.engstruct.2014.08.014. [Google Scholar] [CrossRef]
26. Mao JX, Wang H, Li J. Bayesian finite element model updating of a long-span suspension bridge utilizing hybrid Monte Carlo simulation and Kriging predictor. KSCE J Civ Eng. 2020;24(2):569–79. doi:10.1007/s12205-020-0983-4. [Google Scholar] [CrossRef]
27. Yin T, Zhu HP. An efficient algorithm for architecture design of Bayesian neural network in structural model updating. Comput Aided Civ Infrastruct Eng. 2020;35(4):354–72. doi:10.1111/mice.12492. [Google Scholar] [CrossRef]
28. Nguyen D, Salamak M, Katunin A, Gerges M. Finite element model updating of RC bridge structure with static load testing: a case study of Vietnamese ThiThac Bridge in coastal and marine environment. Sensors. 2022;22(22):8884. doi:10.3390/s22228884. [Google Scholar] [PubMed] [CrossRef]
29. Weng S, Zhu HP, Xia Y. Substructuring method for civil structural health monitoring. Singapore: Springer; 2023. [Google Scholar]
30. Yuen KV, Mu HQ. Real-time system identification: an algorithm for simultaneous model class selection and parametric identification. Comput Aided Civ Infrastruct Eng. 2015;30(10):785–801. doi:10.1111/mice.12146. [Google Scholar] [CrossRef]
31. Weng S, Zhu HP, Xia Y, Li JJ, Tian W. A review on dynamic substructuring methods for model updating and damage detection of large-scale structures. Adv Struct Eng. 2020;23(3):584–600. doi:10.1177/1369433219872429. [Google Scholar] [CrossRef]
32. Beck JL. Bayesian system identification based on probability logic. Struct Control Health Monit. 2010;17(7):825–47. doi:10.1002/stc.424. [Google Scholar] [CrossRef]
33. Mu HQ, Liang XX, Shen JH, Zhang FL. Analysis of structural health monitoring data with correlated measurement error by Bayesian system identification: theory and application. Sensors. 2022;22(20):7981. doi:10.3390/s22207981. [Google Scholar] [PubMed] [CrossRef]
34. Mu HQ, Zhao ZT, Yuen KV. Characterizing multivariate, asymmetric, and multimodal distributions of geotechnical data with dual-stage missing values: BASIC-H. Georisk: Assess Manag Risk Eng Syst Geohazards. 2024;18(1):85–106. doi:10.1080/17499518.2024.2313482. [Google Scholar] [CrossRef]
35. Zhao ZT, Mu HQ, Yuen KV. Probability density function modelling and credible region construction for multivariate, asymmetric, and multimodal distributions of geotechnical data. Struct Saf. 2024;107:102429. doi:10.1016/j.strusafe.2023.102429. [Google Scholar] [CrossRef]
36. Mu HQ, Shen JH, Zhao ZT, Liu HT, Yuen KV. A novel generative approach for modal frequency probabilistic prediction under varying environmental condition using incomplete information. Eng Struct. 2022;252(10):113571. doi:10.1016/j.engstruct.2021.113571. [Google Scholar] [CrossRef]
37. Mu HQ, Hu Q, Guo HZ, Zhang TY, Su C. Uncertainty quantification of load effects under stochastic traffic flows. Int J Struct Stab Dyn. 2019;19(1):1940009. doi:10.1142/S0219455419400091. [Google Scholar] [CrossRef]
38. Frangopol D, Yang D, Lantsoght E, Steenbergen R. Reliability-based analysis and life-cycle management of load tests. In: Lantsoght E, editor. Load testing of bridges. 1st ed. Florida: CRC Press; 2019. p. 265–96. [Google Scholar]
39. Alampalli S, Frangopol DM, Grimson J, Halling MW, Kosnik DE, Lantsoght EOL, et al. Bridge load testing: state-of-the-practice. J Bridge Eng. 2021;26(3):03120002. doi:10.1061/(ASCE)BE.1943-5592.0001678. [Google Scholar] [CrossRef]
40. Sun P. Study on the road curve outline passing ability of large-cargo transport vehicles [master’s thesis]. China: Jilin University; 2014. [Google Scholar]
41. Wang WT. Research on the rapid assessment method of traffic safety for large transport vehicles on highway and bridges [master’s thesis]. China: Ningxia University; 2022. [Google Scholar]
42. Ministry of Housing and Urban-Rural Development of the People’s Republic of China. GB50009-2012: load code for the design of building structures. Beijing: China Architecture & Building Press; 2012. [Google Scholar]
43. Zheng X, Yang DH, Yi TH, Li HN. Development of bridge influence line identification methods based on direct measurement data: a comprehensive review and comparison. Eng Struct. 2019;198(3):109539. doi:10.1016/j.engstruct.2019.109539. [Google Scholar] [CrossRef]
44. Zheng X, Yi TH, Zhong JW, Yang DH. Rapid evaluation of load-carrying capacity of long-span bridges using limited testing vehicles. J Bridge Eng. 2022;27(4):04022008. doi:10.1061/(ASCE)BE.1943-5592.0001838. [Google Scholar] [CrossRef]
45. Yuen KV, Guo HZ, Mu HQ. Bayesian vehicle load estimation, vehicle position tracking, and structural identification for bridges with strain measurement. Struct Control Health Monit. 2023;2023(1):4752776. doi:10.1155/2023/4752776. [Google Scholar] [CrossRef]
46. Melchers RE, Beck AT. Structural reliability analysis and prediction. 3rd ed. Hoboken: John Wiley & Sons; 2018. [Google Scholar]
47. Nowak AS, Collins KR. Reliability of structures. New York: CRC Press; 2012. [Google Scholar]
48. AASHTO LRFDBDS-2020. AASHTO LRFD bridge design specifications. 9th ed. Washington, DC, USA: AASHTO; 2020. [Google Scholar]
49. AASHTO MBE-3-I2-2020. The manual for bridge evaluation with 2020 interim revisions. 3rd ed. Washington, DC, USA: AASHTO; 2020. [Google Scholar]
50. Gusella F. Expected damage assessment of RC half-joints under traffic load. Probab Eng Mech. 2024;77(1):103656. doi:10.1016/j.probengmech.2024.103656. [Google Scholar] [CrossRef]
51. Sassu M, Puppio ML, Doveri F, Ferrini M, Mistretta F. A time and cost-effective strengthening of RC half joint bridges exposed to brittle failure: application to a case study. Struct Infrastruct Eng. 2023;1–16. doi:10.1080/15732479.2023.2275689. [Google Scholar] [CrossRef]
52. Zhang M. Structural reliability analysis: methods and procedures. Beijing, China: Science Press; 2009. [Google Scholar]
53. Li J. Fundamental of structural reliability analysis. Beijing, China: Science Press; 2021. [Google Scholar]
54. Der Kiureghian A. Structural and system reliability. New York: Cambridge University Press; 2022. [Google Scholar]
55. Au SK, Wang Y. Engineering risk assessment with subset simulation. Hoboken: John Wiley & Sons; 2014. [Google Scholar]
56. de Vries R, Lantsoght EO, Steenbergen RD, Fennis SA. Time-dependent reliability assessment of existing concrete bridges with varying knowledge levels by proof load testing. Struct Infrastruct Eng. 2024 Aug 2;20(7–8):1053–67. doi:10.1080/15732479.2023.2280712. [Google Scholar] [CrossRef]
57. ISO 2394:2015. General principles on reliability for structures. 4th ed. Geneva: International Organization for Standardization (ISO); 2015. [Google Scholar]
58. ISO 13822:2010. Bases for design of structures—assessment of existing structures. 2nd ed. Geneva: International Organization for Standardization (ISO); 2010. [Google Scholar]
59. Steenbergen R, Vrouwenvelder A. Safety philosophy for existing structures and partial factors for traffic loads on bridges. Heron. 2010;55(2):123–39. [Google Scholar]
60. Stewart MG, Rosowsky DV, Val DV. Reliability-based bridge assessment using risk-ranking decision analysis. Struct Saf. 2001;23(4):397–405. doi:10.1016/S0167-4730(02)00010-3. [Google Scholar] [CrossRef]
61. Koteš P, Vičan J. Recommended reliability levels for the evaluation of existing bridges according to Eurocodes. Struct Eng Int. 2013;23(4):411–7. doi:10.2749/101686613X13627351081678. [Google Scholar] [CrossRef]
62. Liao W. A study on key issues of bearing capacity evaluation for bridge structures based on health monitoring systems [Ph.D. thesis]. China: South China University of Technology; 2016. [Google Scholar]
63. Alampalli S, Frangopol DM, Grimson J, Kosnik D, Halling MW, Lantsoght EOL, et al. Primer on bridge load testing. In: Transportation research circular E-C257. Washington: Transportation Research Board; 2019. [Google Scholar]
64. Sivakumar B. LRFR limit states, reliability indices and load factors. In: Load and resistance factor rating of highway bridges. Washington: FHWA LRFR Seminar; 2008. [Google Scholar]
65. Gao WB, Yuan YG, Huang PM, Xu X, Wang JF, Han WS. Safety assessment of steel strand stay cable under customized transport vehicle load considering strength degradation. China J Highway Transp. 2020;33(8):169–81 (In Chinese). [Google Scholar]
66. Hou TY, Li WJ, Zhao JL, Feng M, Gong JX. Research on target reliability indexes for safety evaluation of existing concrete bridges. Highway. 2017;62(3):66–72 (In Chinese). [Google Scholar]
67. Da Veiga S, Gamboa F, Iooss B, Prieur C. Basics and trends in sensitivity analysis: theory and practice in R. Philadelphia: Society for Industrial and Applied Mathematics; 2021. [Google Scholar]
68. Ministry of Transport of the People’s Republic of China. JTG/T H21-2011: standards for technical condition evaluation of highway bridges. Beijing: China Communications Press; 2011. [Google Scholar]
Cite This Article
 Copyright © 2025 The Author(s). Published by Tech Science Press.
This work is licensed under a Creative Commons Attribution 4.0 International License , which permits unrestricted use, distribution, and reproduction in any medium, provided the original work is properly cited.
 Downloads
 Citation Tools