
 Submit a Paper
 Propose a Special lssue
 Open Access
ARTICLE

Study on the Mechanical Performance of Wet Concrete Joints in Large-Span Composite Steel-Concrete Cable-Stayed Bridges
1 Shandong Hi-Speed Construction Management Group Co., Ltd., Jinan, 250300, China
2 School of Civil Engineering, Shandong University, Jinan, 250061, China
3 Shandong Expressway Jinan Round City West Highway Co., Ltd., Jinan, 250300, China
* Corresponding Authors: Zhe Wu. Email: ; Youzhi Wang. Email:
Structural Durability & Health Monitoring 2025, 19(3), 613-642. https://doi.org/10.32604/sdhm.2024.058451
Received 12 September 2024; Accepted 21 November 2024; Issue published 03 April 2025
 View Full Text
 Download PDF
Abstract
A steel-concrete composite cable-stayed bridge features integrated steel girders and concrete decks linked by shear connectors to support loads, but stress concentration in wet joints can lead to cracking. In-situ tests were conducted on key sections of steel-concrete composite cable-stayed bridges to analyze the stress-strain evolution of wet joints under environmental factors, constraints, and complex construction processes. The coordinated working performance of the bridge decks was also analyzed. The results indicate that temperature is the key factor affecting the stresses and strains in wet joint concrete. Approximately 7 days after casting the wet joint concrete, the strains at each measurement point of the wet joint are approximately negatively correlated with the temperature change at the measurement point. Different locations within the wet joints have respective impacts, presenting potential weak points. Construction conditions have a certain impact on the stress and strain of the wet joint. The top deck of the steel box girder is not fully bonded to the bottom surface of the wet joints, resulting in a certain strain difference after loading. To further analyze the cooperative working performance of steel box girders and concrete wet joint bridge deck systems, finite element analysis was conducted on composite girder structures. A stiffness calculation method for shear connectors based on numerical simulation was proposed. The results indicate that strain differences can cause interface slip in composite girders. This slip leads to increased deflection of the composite girders and increased tensile stress in the bottom plate of the steel box girders. This study clarifies the stress conditions and factors affecting wet joints during construction, preventing early cracking, and offers precise data for a full bridge finite element model.Keywords
In the field of bridge engineering, cable-stayed bridges, and large-span steel-concrete composite girder cable-stayed bridges are widely used due to their structural advantages and economic benefits [1–3]. The bridge structures connect steel girders with concrete bridge decks through shear connectors, enabling them to jointly bear loads [4]. However, due to differences in material properties and complex stress states, the bridge decks of steel-concrete composite girders are prone to stress concentration and cracking [5]. These problems are particularly prominent in the wet joints. As a relatively weak part of the bridge structure, concrete wet joints often crack, leading to corrosion of steel reinforcement and seriously affecting the normal serviceability of the structure [6–8].
To clarify the mechanical properties of wet joints in composite structures, many investigations have been carried out. Jia et al. [9] conducted three-point bending tests on precast bridge deck panels with Ultra-High Performance Concrete (UHPC) wet joints, evaluating the flexural performance based on the failure mode, load-deflection curve, cracking width in the wet joint region, and stiffness degradation. Zhao et al. [10] proposed a dovetail-shaped Reactive Powder Concrete (RPC) wet joint to enhance crack resistance and conducted an experimental study. To improve the mechanical properties and working performance of wet joints, some studies have been conducted on the dimension and shape of wet joints, material optimization of wet joints, overlapping connection of wet joints, and interface treatment of wet joints. Xiao et al. [11] conducted full-scale tests on bridge decks with dovetail-shaped wet joints or newly-proposed construction-friendly rectangular wet joints, and analyzed the ultimate bearing capacity of wet joints to obtain a crack width prediction model. Pan et al. [12] studied the mechanical properties and crack resistance of different wet joint details. The results showed that although the mechanical properties of different wet joint details were similar, the crack resistances of serrated wet joints, rectangular wet joints, and steel plate reinforced wet joints were better. Qiao et al. [13] added superabsorbent polymers as self-curing agents to wet joints. The results showed that the addition of superabsorbent polymers effectively improved the interfacial bonding performance of wet joints. Feng et al. [14] studied the shear performance of reactive power concrete grouting materials in wet joints. Huang et al. [15] proposed a notched double-loop connection and determined its minimum overlap length by finite element modeling. Dong et al. [16] comprehensively investigated wet joints with lapped U-bars to explore their advantages and limitations by experimental and theoretical analysis. Chen et al. [17] conducted axial tensile tests on full-scale specimens of steel-UHPC composite bridge decks to evaluate the tensile performance of wet joint interfaces treated with epoxy resin and roughened by high-pressure water jetting. The results indicated that the interface treatment with high-pressure water jet removal of fine aggregate was superior. Lu et al. [18] used steel wire mesh (SWM) for interface treatment to enhance the crack resistance of the wet joint interface.
The main girders of a steel-concrete composite cable-stayed bridge are subjected to complex loading and boundary conditions. Currently, the primary research methods involved scaled-down model tests, full-scale model tests, and numerical simulation models [19–23]. Various aspects related to composite bridge structures have been studied, such as the shear performance of connecting components [24], the fatigue performance of connections [25], interface slip effects in composite beams [26,27], development of concrete slab cracks [7], and stability of structures [28]. In summary, research methods for the mechanical characteristics of wet joints and the cooperative working performance of steel-concrete composite girders mainly involved laboratory experiments and numerical simulation models. However, both methods are difficult to accurately simulate the actual load and boundary conditions of wet joints and main beams. Previous field experimental studies on the mechanical properties of wet joints and the overall cooperative working performance of steel-concrete composite beams, as well as studies on the development of stresses and strains in wet joints during the construction stage, are relatively few.
Therefore, to analyze the stress and strain variation characteristics of wet joints during the construction phase and further clarify the cooperative working performance of steel box girders and concrete wet joint bridge deck systems, based on the actual engineering design characteristics, key construction characteristics, and the deformation and interaction laws of steel-concrete composite girders, in-situ tests were conducted to study the evolutionary characteristics of wet joints under complex construction processes, stress conditions, and environmental factors. The tests included longitudinal and transverse stress-strain of main girder wet joints, corresponding longitudinal and transverse stress-strain of steel box girders, environmental temperature monitoring, etc. The test studies can reflect the early constrained deformation state of wet joints and steel box girders, as well as the development and evolution laws of temperature and strain, and reveal the cooperative working condition between the main girder decks and steel box girders, which is helpful in avoiding early cracking of wet joints. At the same time, accurate data parameters are provided for the establishment of the finite element model of the whole bridge, which ensures the quality of engineering construction. In addition, finite element simulation analysis was conducted on the cooperative working performance of composite girders, proposing a stiffness calculation method for shear connectors based on numerical simulation. The distribution patterns of deflection and stress in the composite girders were obtained, revealing the impact of interface slip on the cooperative working performance of composite girders.
In this study, the main girder of a steel-concrete composite girder cable-stayed bridge is selected. The elevation of the whole bridge is shown in Fig. 1, with a span arrangement of 790 m, and a deck width of 35.5 m. The cross section of the main girder is shown in Fig. 2. The 3D model of the steel box girder is shown in Fig. 3a, and a real photo is shown in Fig. 3b. The steel box girder is formed by welding the top plate, bottom plate, webs, diaphragms, and cantilever beams to create a steel framework. The steel box girder features a single-box, three-cell cross-sectional form. The steel plates of the steel box girder are made of Q345 steel, with a yield strength of 345 MPa. The stay cables are deployed in a lateral fan shape, arranged in two central cable planes with a spacing of 2 m. The vertical cable spacing on the tower is 2 m, and the horizontal cable spacing on the beam is 8 and 4 m. The deck is axially suspended. The entire bridge is divided into 101 sections, categorized into tower-near sections, standard sections, common pier sections, and mid-span sections. The sections are welded on-site to form an integrated structure. The main girder deck slabs are made of C60 prestressed concrete, which is divided into two parts of precast slabs and cast wet joints, which are combined with the steel main girders through shear nails arranged on the top decks of the steel main girders. According to Chinese Code [29], the elastic modulus of C60 concrete is 36,000 MPa, the Poisson’s ratio is 0.2, the characteristic compressive strength is 38.5 MPa, and the characteristic tensile strength is 2.85 MPa. C60 micro-expansive concrete, with the addition of calcium aluminosulfate expansive admixture, can reduce the shrinkage of wet concrete cast on site. Prestressed steel strands with a diameter of 15.2 mm, a characteristic tensile strength of 1860 MPa, and an elastic modulus of 195 GPa are used. Each prestress cable consists of either 9 or 17 steel strands. These strands are placed at the wet joint location and are tensioned after the wet joint has reached its required strength.
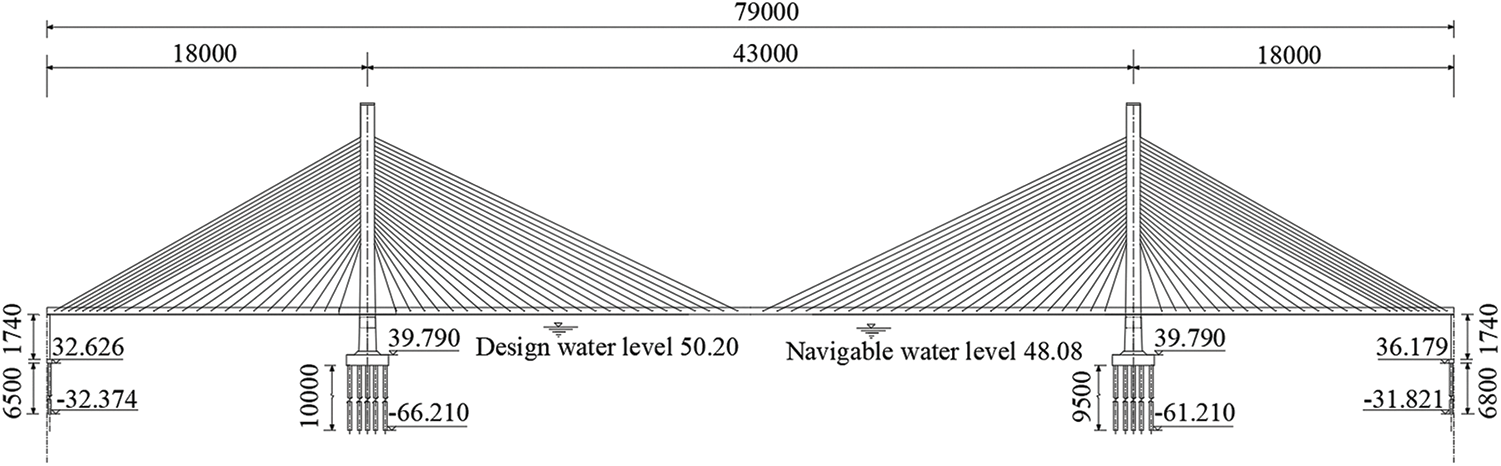
Figure 1: Elevation of the whole bridge (unit of size: mm, unit of elevation: m)
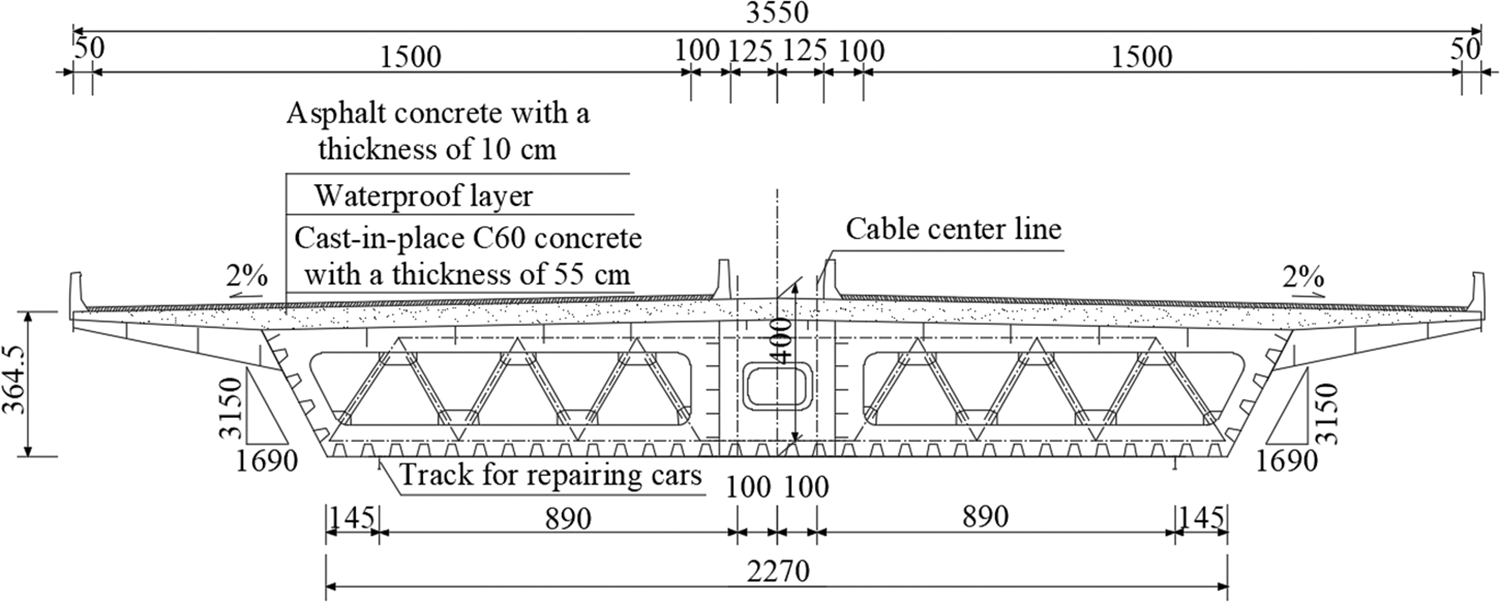
Figure 2: Cross section of the main girder (unit: cm)
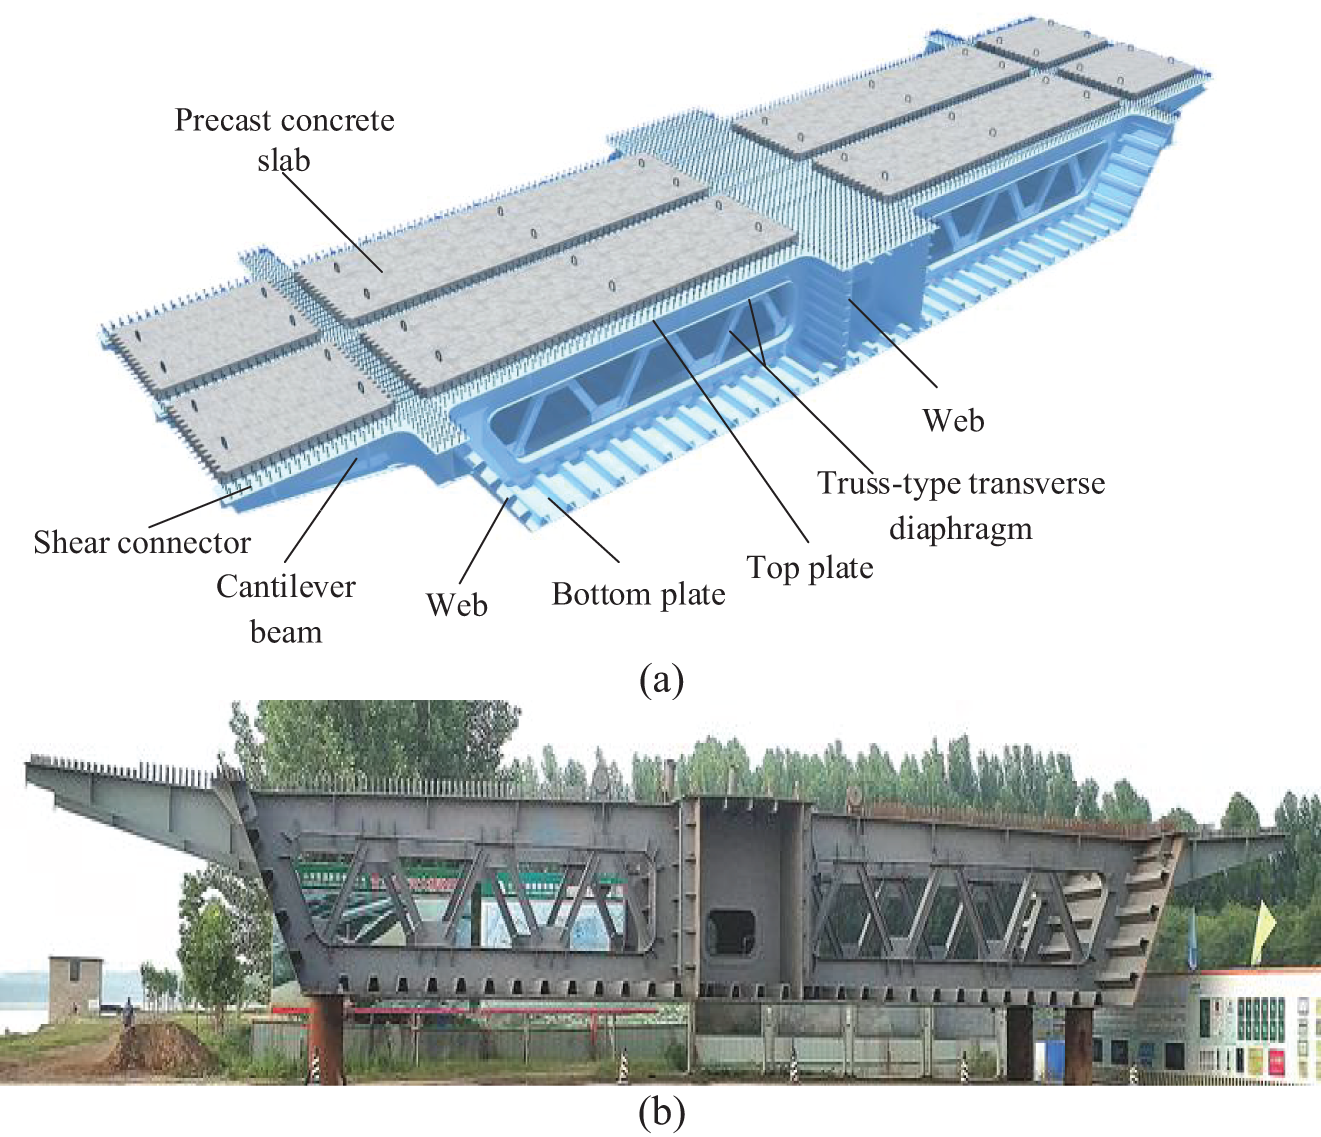
Figure 3: Pictures of steel box girder. (a) 3D model, (b) Real photo
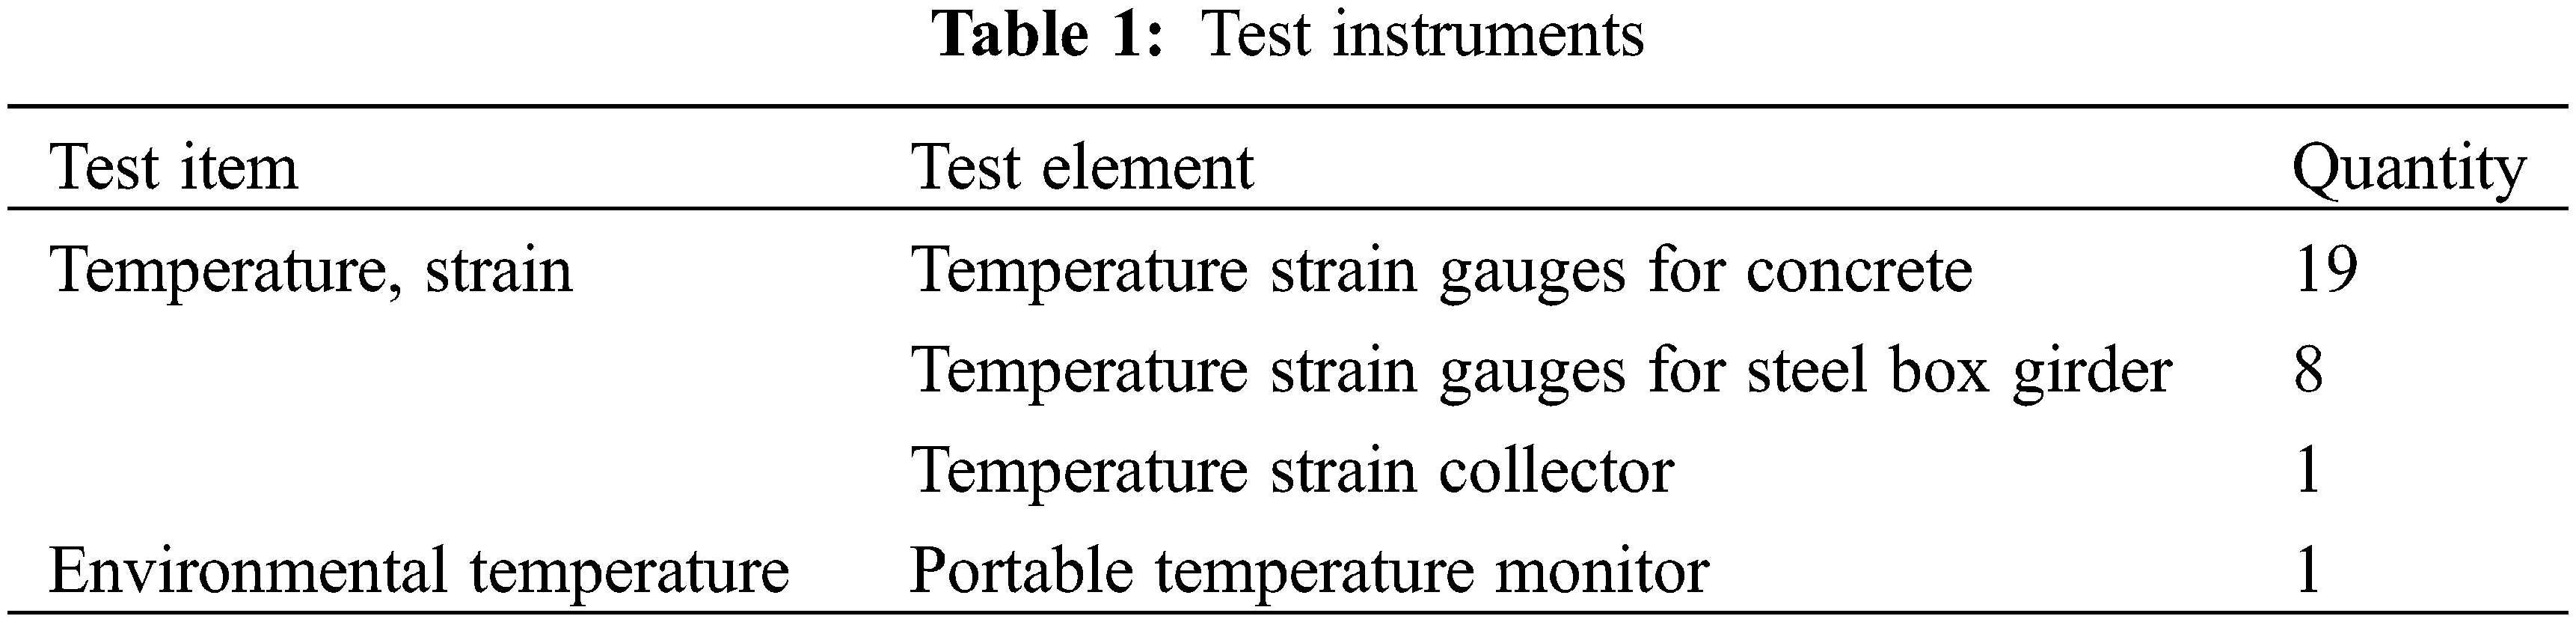
To analyze the stress and strains in wet joints during the construction phase and to prevent early cracking so as to clarify the synergistic performance of the steel box girder and concrete wet joint deck system, in-situ tests were carried out. The evolving characteristics of wet joints under the influence of complex construction processes, loading conditions, and environmental factors were investigated, and the synergistic working conditions between the composite beam’s main girder deck and the steel box girder were also revealed. The main test observations of this study included synchronized mechanical performance tests, temperature monitoring, and stress-strain monitoring. The test instruments are shown in Table 1. Before use, the instruments were checked one by one for damage to ensure that they were in good condition before placement.
To select the monitoring site of the main girders in the tests, a finite element model of the entire bridge was established in Midas Civil. The pylons, the main girder decks, and the steel box girders each were simulated using beam elements, the stay cables were simulated using truss elements. In total, 1010 beam elements and 1152 nodes were established. The finite element model diagram of the entire bridge is shown in the Fig. 4.
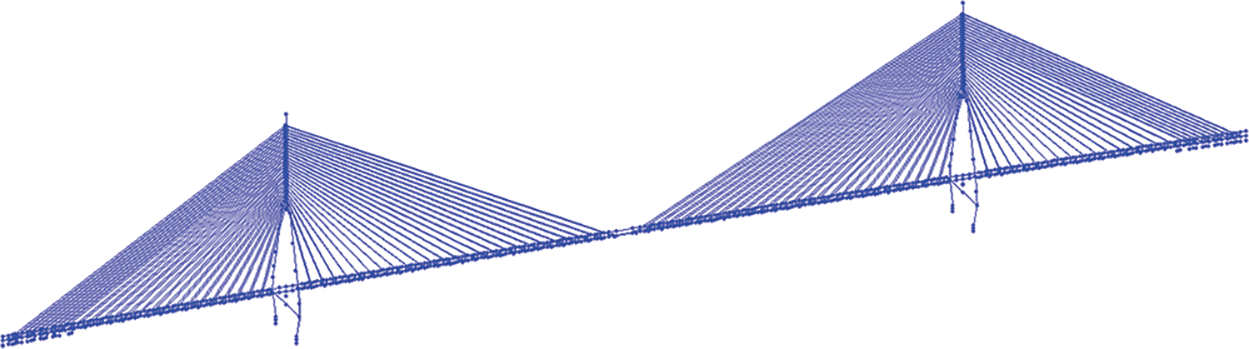
Figure 4: The finite element model diagram of the entire bridge
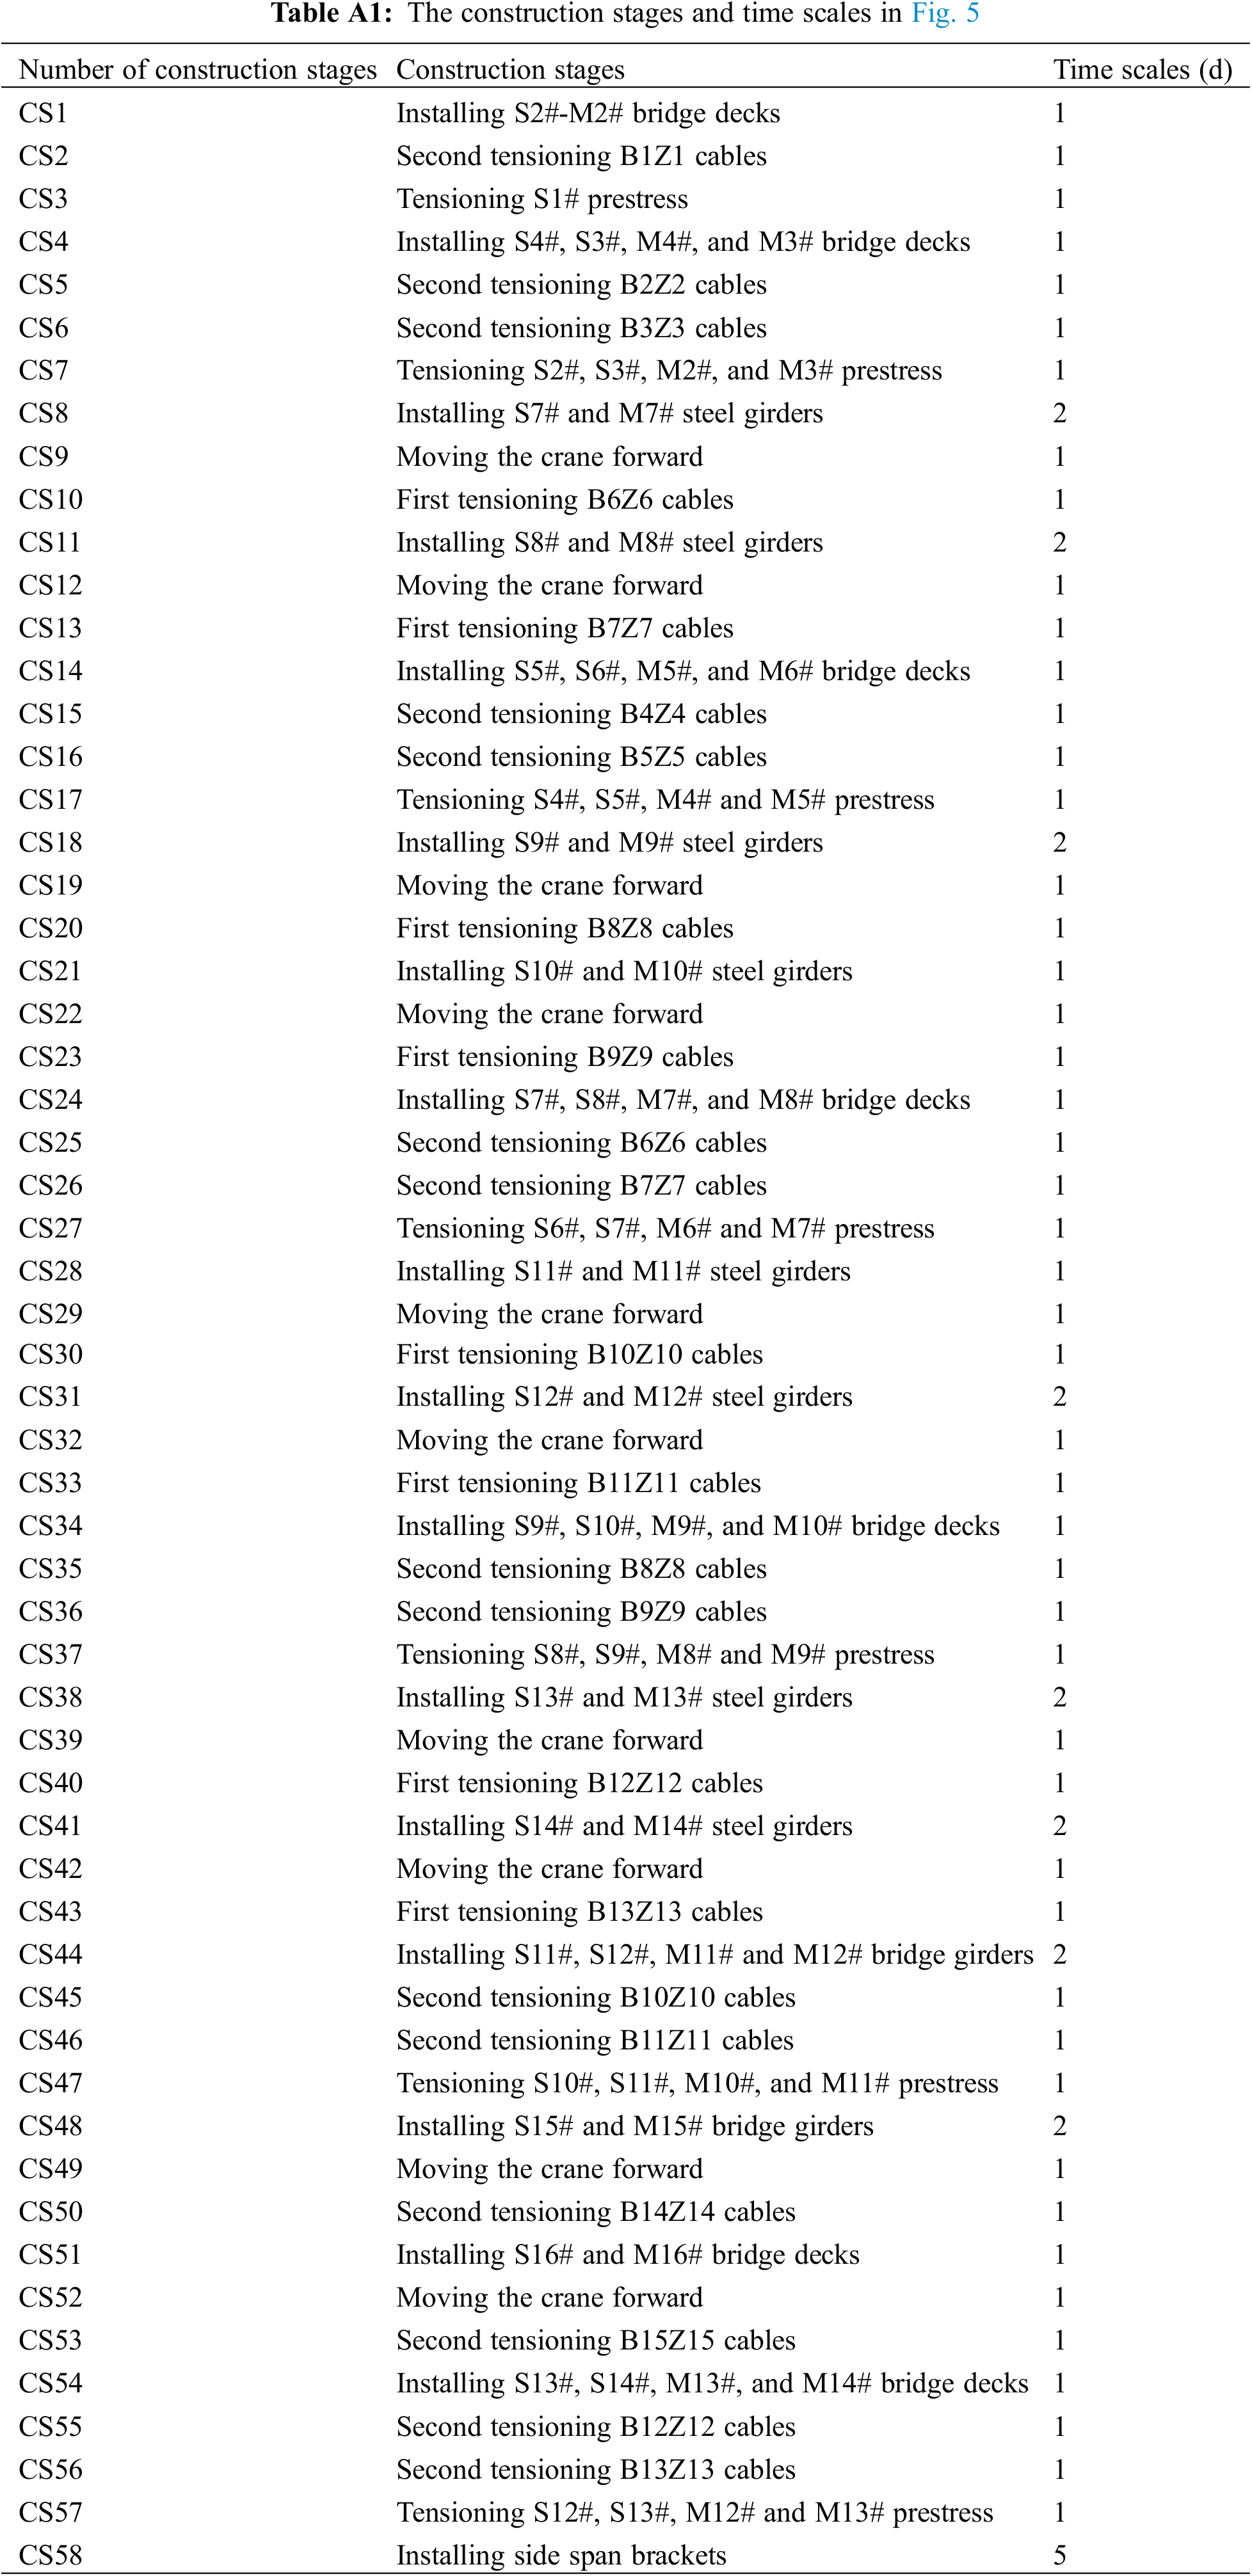
To analyze more construction scenarios before closure, the monitoring site was selected from the 12 girder sections of the side span constructed before the installation of the side span support frame. The stress variation of each girder section’s concrete slab is considered as the primary analytical data for comparative analysis, as shown in Fig. 5. The construction stage numbers shown in Fig. 5 correspond to the construction stages and time scales listed in Table A1. The naming convention for girder sections is as follows: ‘S’ denotes side span, ‘M’ denotes middle span, and the numbers and ‘#’ represent the number of sections from the pier. The naming convention for stay cables is as follows: ‘B’ denotes side span, ‘Z’ denotes middle span, and the numbers represent the number of cables from the pier. As can be seen from Fig. 5, during the construction process, the compressive stress in the concrete slabs of the S6# girder section is the highest, whereas it is the lowest in the S5# girder section. Therefore, the S6# girder section of the side span was chosen to be the main monitoring site, considering the adjacent girder sections on both sides.
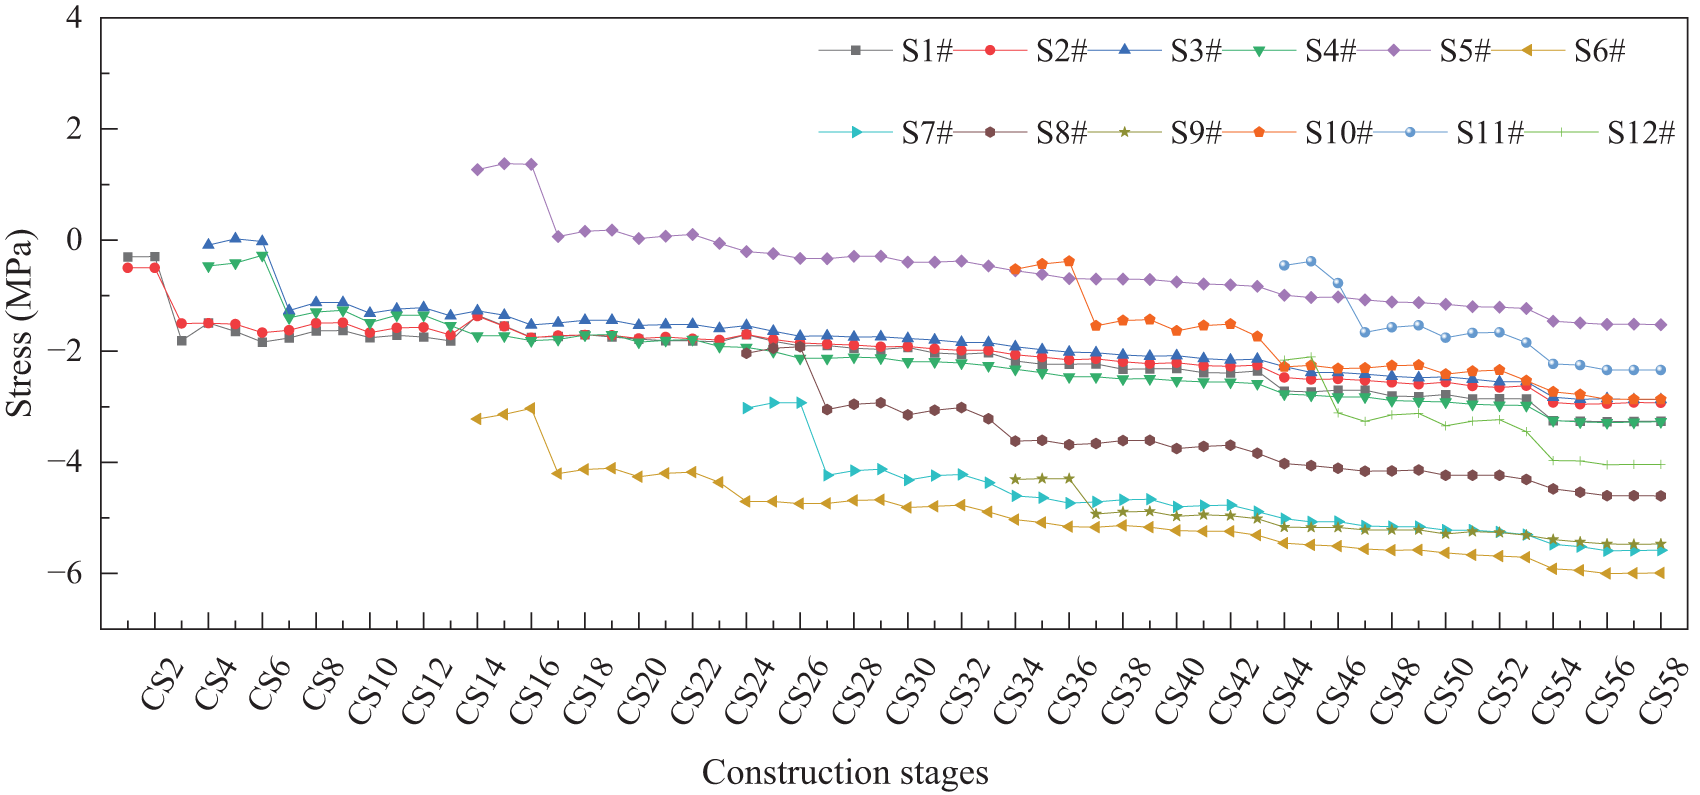
Figure 5: The stress variations of the girder section’s concrete slabs
The distribution of wet joints and the arrangement of temperature strain gauges in the S6# girder section and adjacent girder sections of the side span are shown in Fig. 6. S1T, S1M and S1D measuring points refer to the temperature strain gauges located at the top, middle and bottom of the wet joint at this position, respectively. Similarly, S2T, S2M, S2D, S3T, S3M, S3D, S4T, S4M and S4D measuring points refer to the temperature strain gauges located at the top, middle and bottom of the wet joint at the corresponding positions, respectively. Measuring points S5–S11 respectively refer to the temperature strain gauge located at the center of the wet joint at the corresponding position.

Figure 6: Arrangement of temperature strain gauges for wet joints (a) In the longitudinal bridge direction (unit: mm), (b) In the transverse bridge direction
Since the maximum thickness of the wet joints was 550 mm, to accurately obtain the internal strain and stress changes in the wet joints, the longitudinal temperature strain gages located at the wet joint of the diaphragm were arranged vertically in three groups at the top, middle and bottom of the wet joints, while the longitudinal temperature strain gages in other positions and all the transversal temperature strain gages were tied to the center. The vertical arrangement of the temperature strain gauges in the wet joints is shown in Fig. 7.
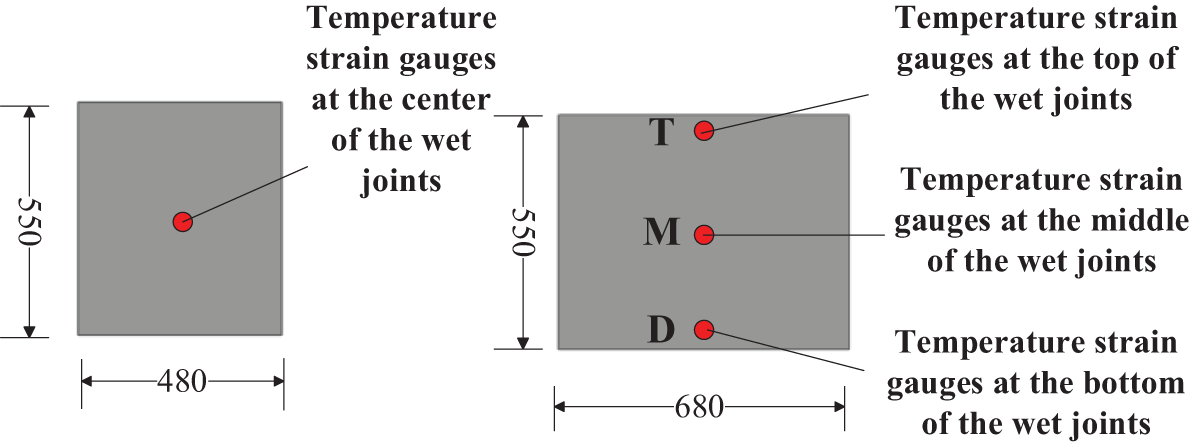
Figure 7: Vertical arrangement of wet joint temperature strain gauges (unit: mm)
The arrangement of the temperature strain gauges in the longitudinal direction of the steel box girder is shown in Fig. 8a. G1, G3, G5, and G6 measuring points are located on the lower surface of the top plate of the steel box girder, which are in the same vertical line with the measuring points S1D, S3D, S5, and S6, respectively. G12 is located on the upper surface of the bottom plate of the central box chamber of the steel box girder, which is in the same vertical line with the measuring points S1D and G1.

Figure 8: Arrangement of temperature strain gauges for steel box girder, (a) In the longitudinal bridge direction, (b) In the transverse bridge direction
The arrangement of the temperature strain gauges in the transverse direction of the steel box girder is shown in Fig. 8b. The measuring points G7, G8 and G9 are located on the lower surface of the top plate of the steel box girder, and are in the same vertical line with the measuring points S7, S8 and S9, respectively.
Photographs of the field measuring point placement are shown in Fig. 9.

Figure 9: Photographs of measuring points in the field test
Measurement test data were collected Measurement and test data were collected over a period of approximately 50 days, from the start of concrete placement on 26th November to the completion of side closure. Under normal circumstances, data were collected every day at 2:00 p.m. Additionally, the frequency of data collection was increased before and after key construction phases such as lifting steel box girders, installing prefabricated slabs, tensioning prestressed tendons, and tensioning inclined cables.
3.1 Analysis of Mechanical Test Data for Wet Joint Concrete
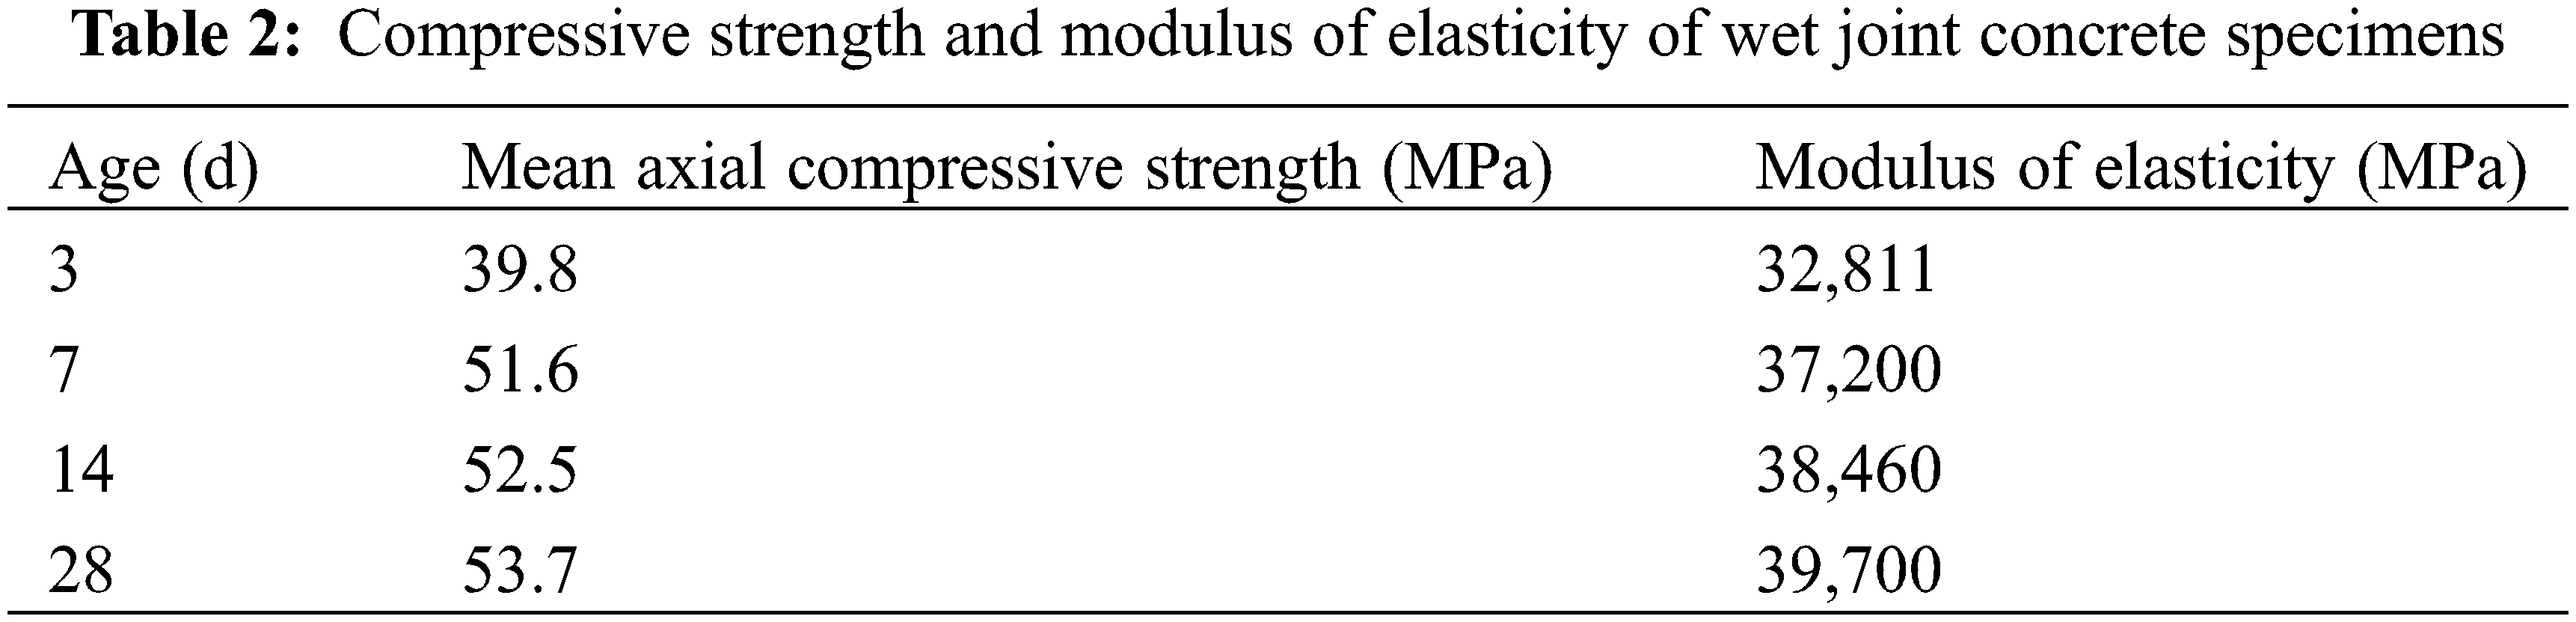
Prisms with dimensions of 150 mm × 150 mm × 300 mm were cast using the same batch of concrete as the wet joints and cured in the site environment. The wet joints were made of C60 micro-expansive concrete, and the compressive strength of 28 days of curing in the field environment was 53.7 MPa, which was 10.5% lower than the standard value of cubic compressive strength of 60 MPa. The modulus of elasticity of concrete cured for 28 days in the field environment was 10.3% higher than the modulus of elasticity of C60 concrete of 36,000 MPa given in the specification [29]. The results of axial compressive strength and modulus of elasticity of wet joint concrete specimens are shown in Table 2.
As shown in Figs. 10 and 11, the test data are fitted to obtain Eq. (1) for the modulus of elasticity E(t) vs. age t. Eq. (1) can be utilized to calculate the stresses in wet joint concrete at various ages based on strain measurements.
And the compressive strength f(t) vs. age t equation is
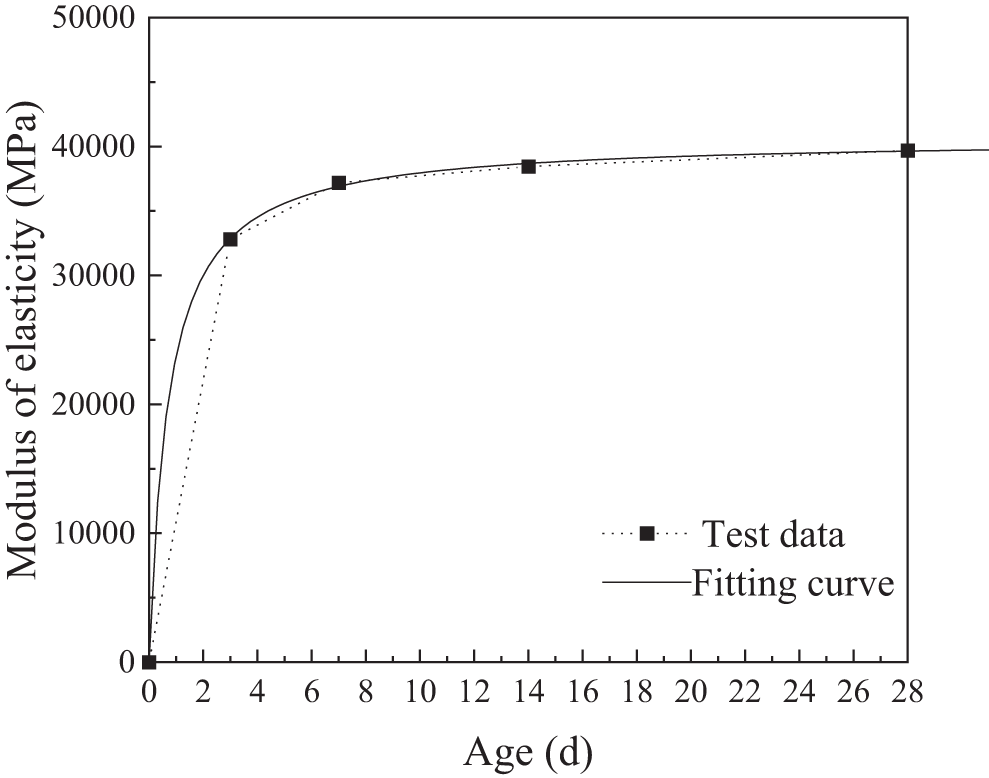
Figure 10: Modulus of elasticity of wet joint concrete and fitted curve
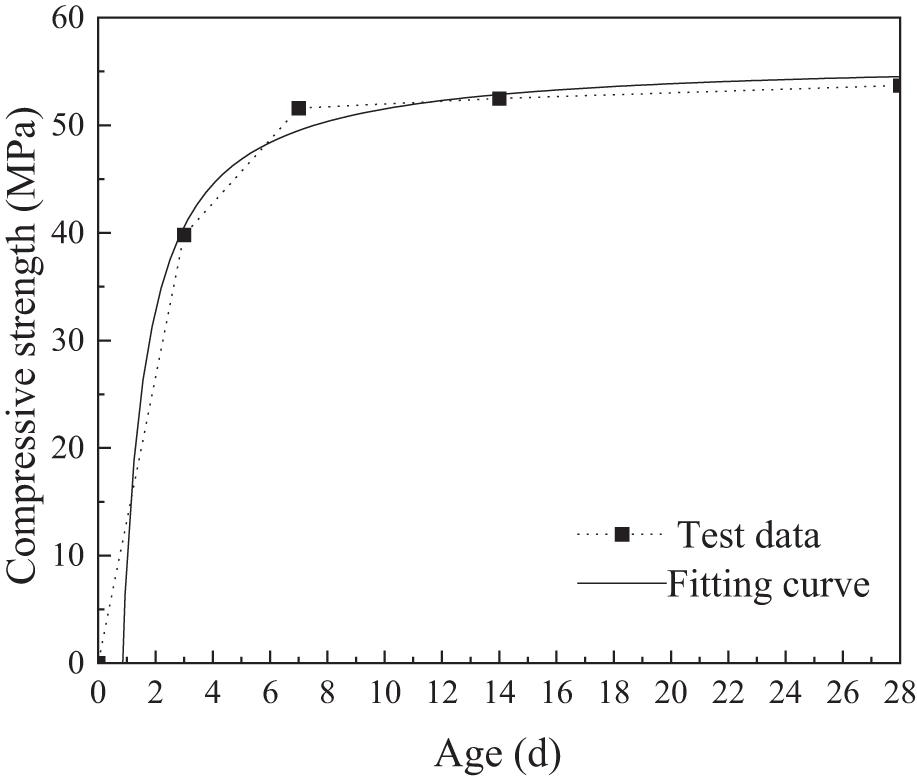
Figure 11: Wet joint concrete compressive strength and fitting curve
3.2 Analysis of Internal Temperature Variation of Main Beams
The temperature variation curves at the measuring points of the steel box girder are shown in Figs. 12–14. The horizontal axis represents the number of days after the wet joints have been cast. As can be seen from Fig. 12, the temperatures at all measuring points increase sharply up to 37.2°C within 1–2 days after casting the wet joints. Afterwards, the temperatures decrease, and after about four days, they stabilize around the environmental temperature with slight fluctuations. The hydration heat of the concrete significantly affects the temperatures at various points within the wet joints during the first 4–5 days after casting, which is critical to consider for insulation and protection of the wet joints during winter to prevent cracking due to large temperature differentials. As can be seen from Fig. 13, there is a significant difference in the peak temperatures at different points at the same height, and the peak temperatures are ranked as S1M > S3M > S2M > S4M. This is due to the fact that the wet joints at the measuring points S1M and S3M are wider, resulting in a greater accumulation of heat from hydration. As can be seen from Fig. 14, after the wet joints were cast on 26th November, the temperatures at points S1T, S1M, and S1D were higher than the environmental temperature, with peak temperatures in the order of S1M > S1D > S1T, attributed to the diffusion of hydration heat from the upper and lower surfaces of the wet joints.
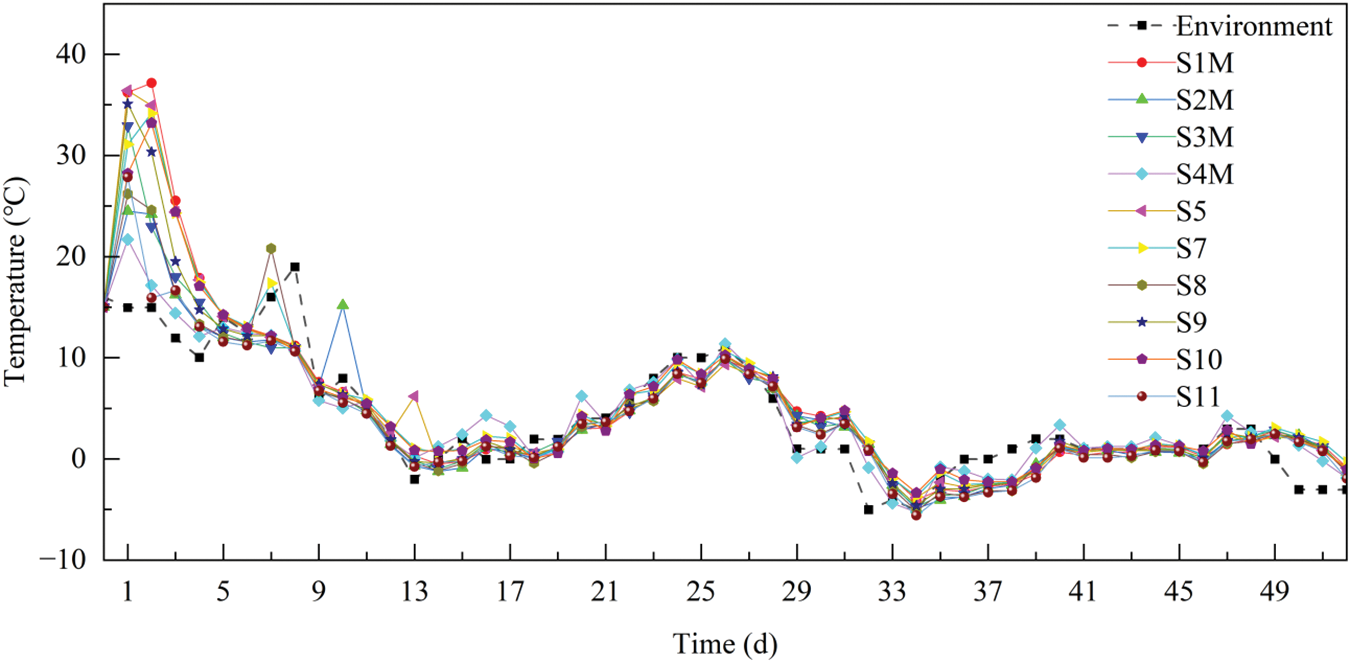
Figure 12: Temperature variation curve of each measuring point in side wet joints

Figure 13: Temperature variation curves at different locations at the same height inside wet joints

Figure 14: Temperature variation curves at different heights at the same location inside a wet joint
The temperature variation curves at the measuring points of the steel box girder are shown in Fig. 15. The horizontal axis represents the number of days after the wet joints have been cast. As can be seen from Fig. 15, within four days after the wet joints were cast, the temperatures of the measuring points of the steel box girder corresponding to the wet joints were significantly higher, while at other times, the temperatures at these points were close to and primarily influenced by the environmental temperature, showing fluctuations around it.

Figure 15: Temperature variation curves at the measuring points of the steel box girder
3.3 Effect of Temperature Changes on Strains in Wet Joints
Temperature is an important factor affecting the strain and stress of wet joint concrete. Fig. 16 shows the strain and temperature curves at each measuring point of wet joints after they have been cast. Except for measuring point S8, the strains at most measuring points generally showed a downward trend after the concrete was cast, primarily due to the shrinkage of the wet joint concrete and the pre-stressing applied to the wet joints. The day after the concrete was cast, there was a sharp drop in the strain values of the wet joints, caused by the settlement shrinkage of the concrete aggregate. About seven days after the wet joints were cast, it can be observed that the changes in strains at various measuring points are generally negatively correlated with the changes in temperature. This is mainly due to the effect of the surrounding precast concrete slabs, which expand and contract with temperature changes, thus compressing or stretching the wet joints. S3 and S5 measurement points exhibited temporary tensile strain after the wet joint pouring, which was due to the temperature stress caused by the temperature difference between the interior and surface of the concrete. During the hardening process, the exothermic hydration reaction within the concrete generates a significant amount of heat, leading to an increase in internal temperature and volume expansion. When the external temperature is lower, the surface of the concrete cools and contracts more rapidly. This uneven thermal expansion and contraction can create stress within the concrete. If this stress exceeds the concrete’s tensile strength, cracks may form. As can be seen from Fig. 11, the maximum temperature difference between the interior of the concrete and the ambient environment is 22°C, hence it is essential to pay attention to the insulation and curing of the wet joint to prevent temperature-induced cracks.
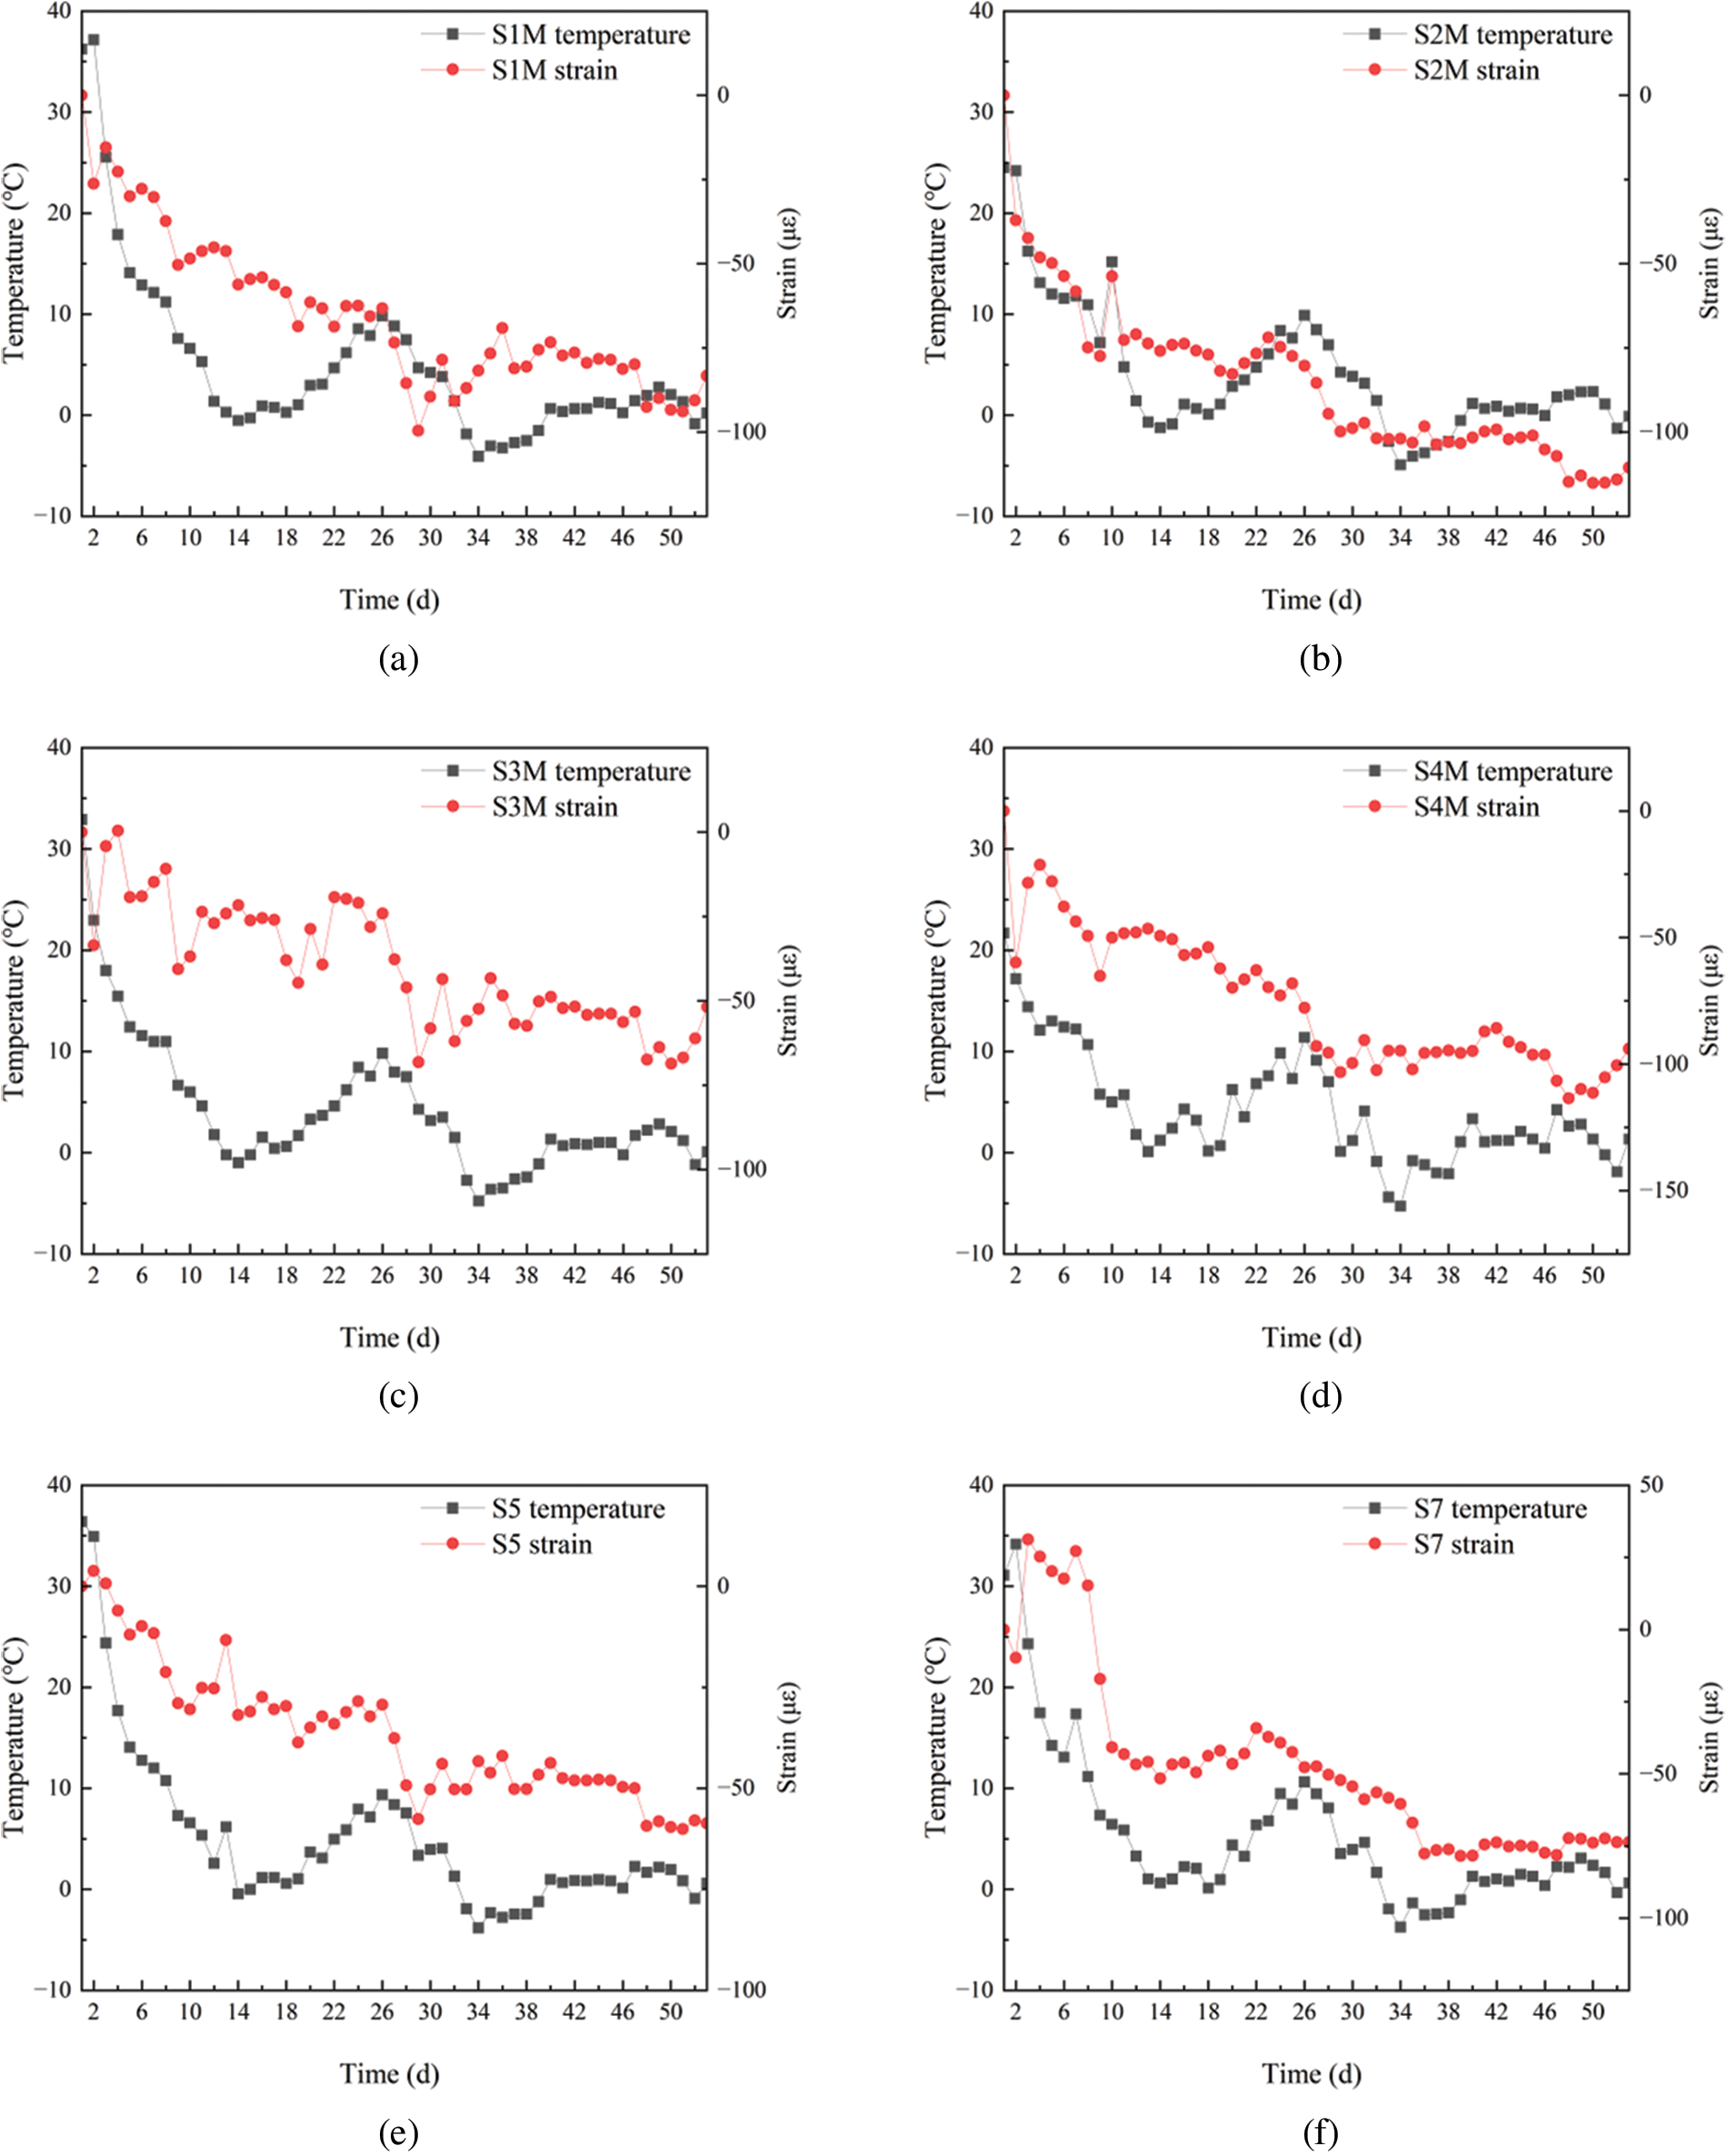
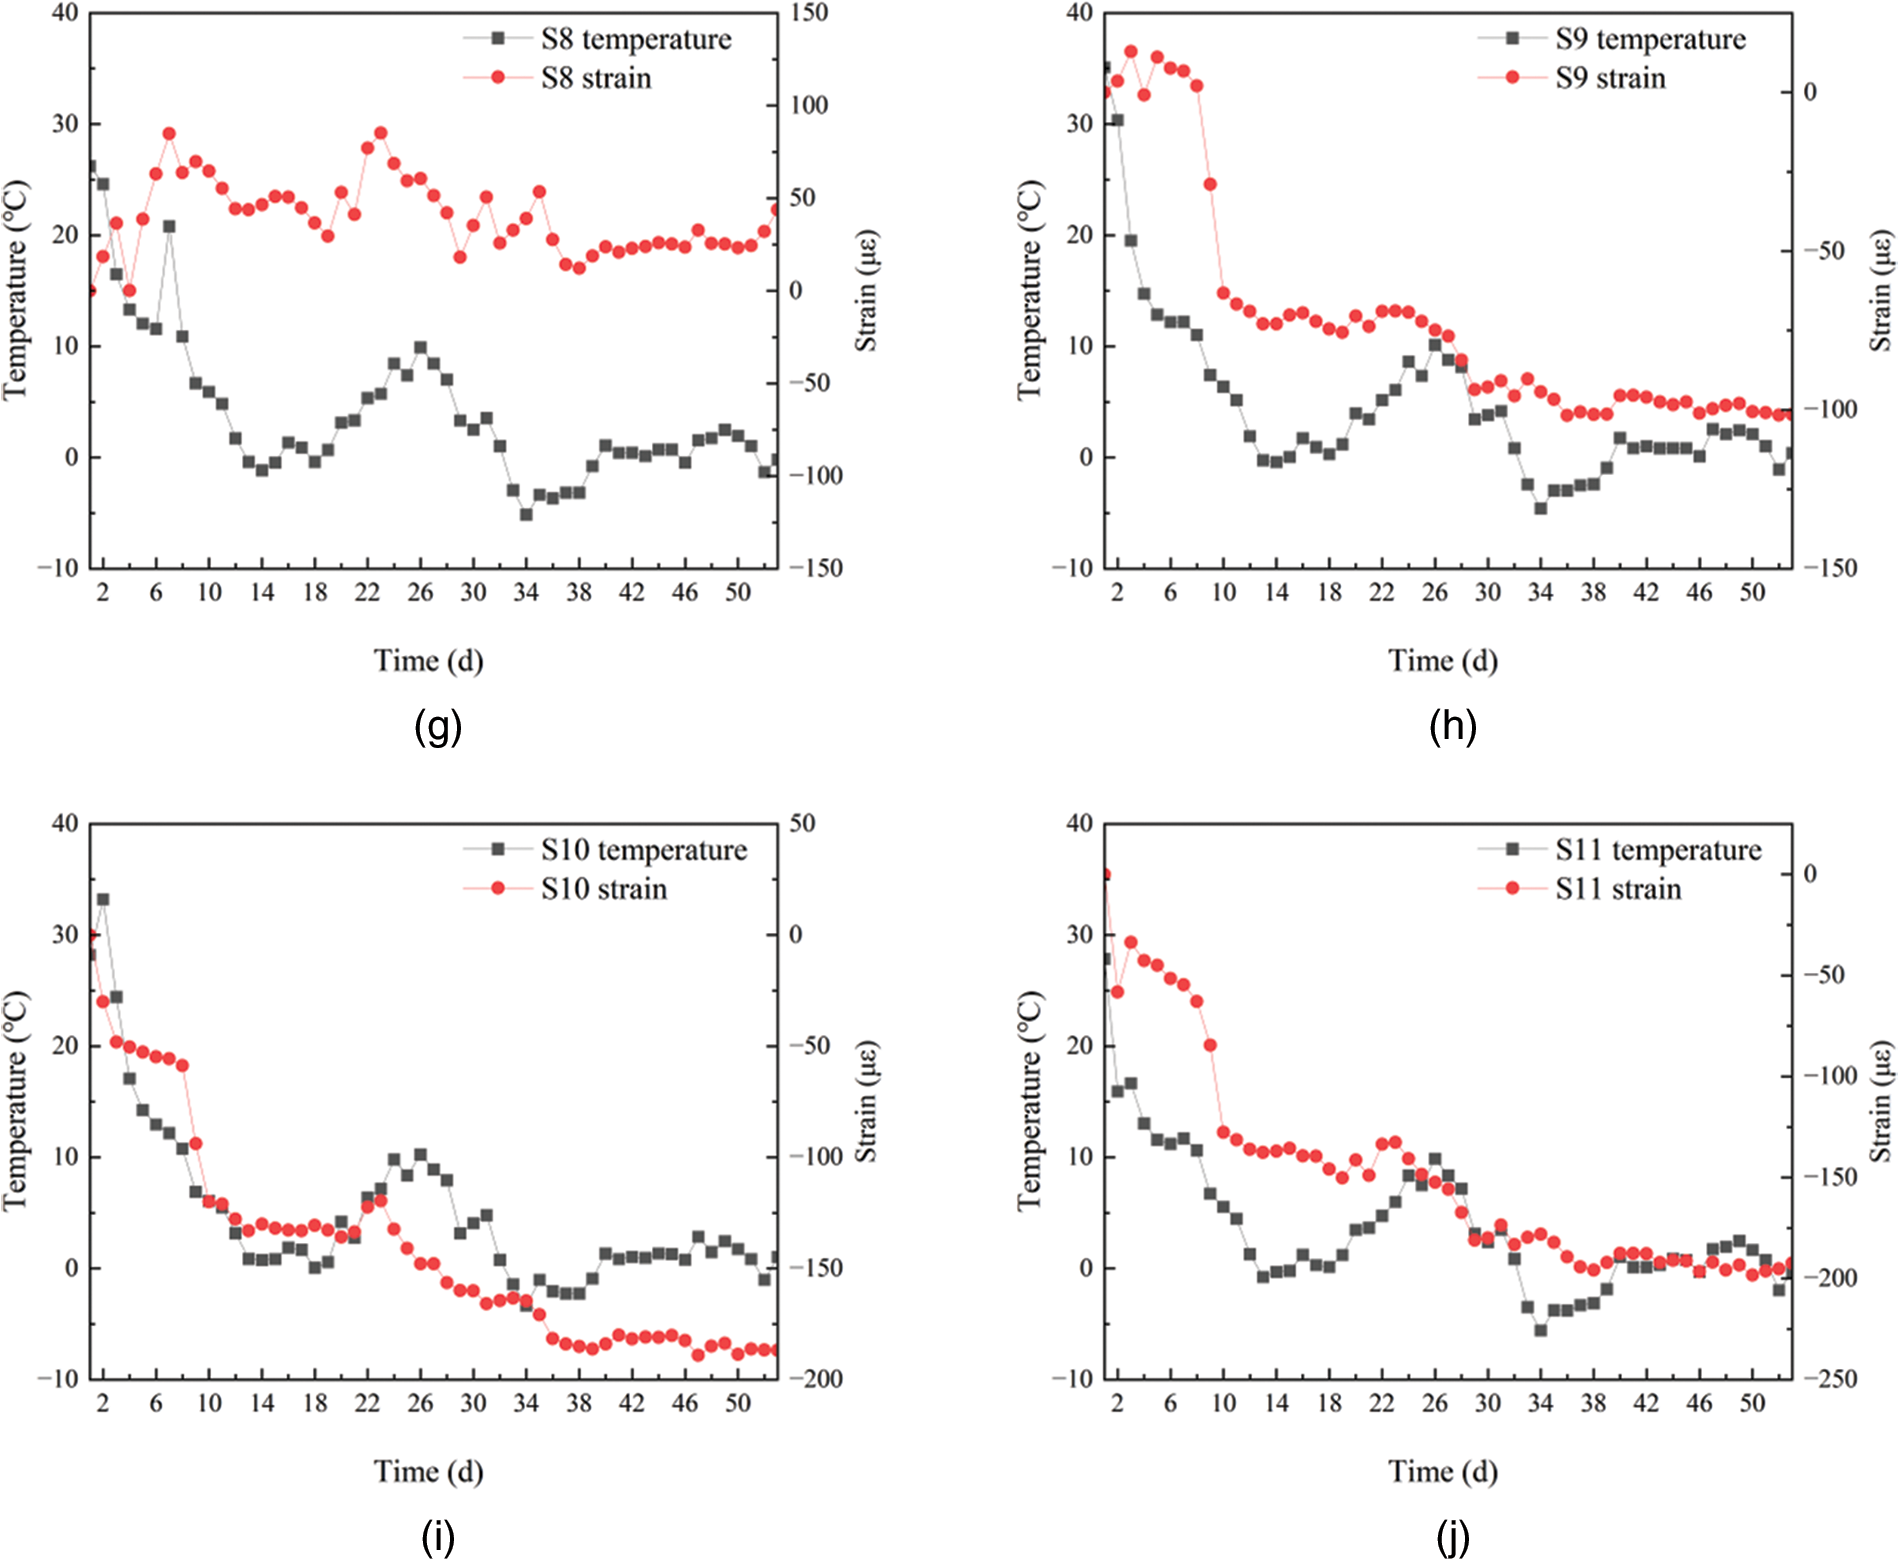
Figure 16: Temperature and strain curves at each measuring point of wet joints, (a) S1M, (b) S2M, (c) S3M, (d) S4M, (e) S5, (f) S7, (g) S8, (h) S9, (i) S10, (j) S11
3.4 Effect of Positional Constraints on Strains in Wet Joints
3.4.1 Longitudinal Strains in Wet Joints Along the Bridge Direction
Strain variation curves in the wet joints along the longitudinal bridge direction are shown in Fig. 17. The horizontal axis represents the number of days after the wet joints have been cast. Measuring points S1M, S2M, S3M, and S4M were located at the same transverse wet joint of a diaphragm. Only measuring point S3M exhibited a single instance of tensile strain, while the other measuring points showed compressive strains. Measuring points S1M and S5 were located at the longitudinal wet joint in the central box section. Measuring point S5 experienced a single instance of tensile strain, with the overall compressive strain being less than that at the S1M point.
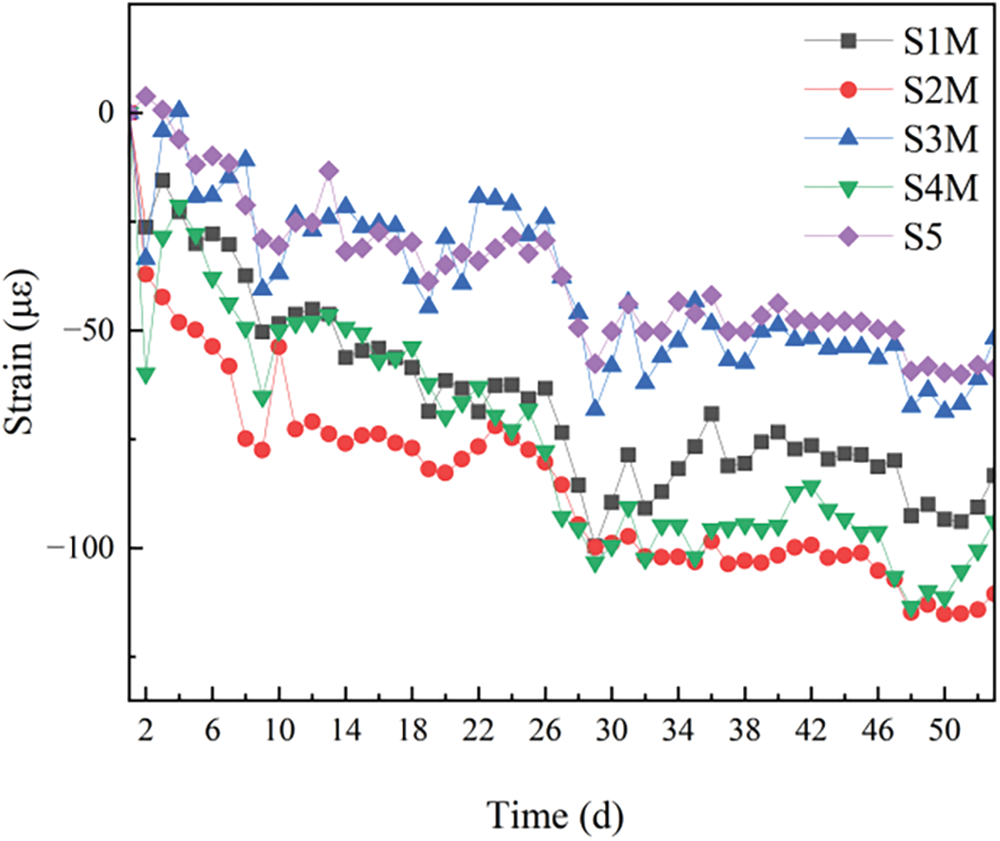
Figure 17: Strain variation curves in wet joints along the longitudinal bridge direction
3.4.2 Transverse Strain in Wet Joints across the Bridge Direction
Strain variation curves in the wet joints along the transverse bridge direction are illustrated in Fig. 18. The horizontal axis represents the number of days after the wet joints have been cast. Measuring points S7, S8, and S9, located at the same transverse wet joint of the diaphragm, exhibited distinct behaviors. Measuring points S7 and S9 switched from tensile to compressive strain after prestressing, while S8 continuously exhibited tensile strains that increased significantly to a maximum value of 85 με after casting. According to Eq. (1), the elastic modulus at measuring point S8 can be derived, and then the tensile stress obtained is 3.36 MPa, which exceeds the specified standard value of axial tensile strength of C60 concrete of 2.85 MPa [29]. However, measuring point S8 did not crack due to the stresses absorbed by steel reinforcement and concrete. It is recommended that special attention be paid to the internal location of the transverse diaphragm wet joints to prevent early cracking. The reason why the S8 measurement point experienced tensile strain was that the stay cables adopted a central cable surface form, which resulted in significant lateral loads. After the wet joint was cast, the self-weight of the concrete subjected the diaphragm to bending moments, causing the upper wet joint to be in tension. The pressure provided by the prestress applied to the wet joint did not counteract the initial tensile force, hence the S8 measurement point continued to exhibit tensile strain. The S7 and S9 measurement points were located above the junction of the diaphragm and the web plate. Due to the greater stiffness of the web plate, it diminished the transmission of tensile force. Consequently, the transverse wet joint at the diaphragm is prone to tension and represents a weak point in the wet joint, which can lead to load cracks. Additionally, measuring points S7 and S10 were at the longitudinal wet joints of the central box chamber, and they were all under tension before the prestressing was tensioned. Measuring point S10, on the other hand, was always negative in strain value and was under pressure. Due to the influence of the wet joint of the diaphragm, measuring point S7 was more susceptible to tension and was relatively weak. Similarly, measuring points S9 and S11 were located at the longitudinal wet joints of the side webs and had a similar pattern to the S7 and S10 measuring points, with S9 being more susceptible to tensile forces and relatively weaker.

Figure 18: Strain variation curves in wet joints along the transverse bridge direction
3.5 Effect of Construction Conditions on Strains in Wet Joints
After a section of the steel box girder was installed, the first tensioning of the stay cables for this section was carried out. The installation of the bridge deck was delayed by two sections behind the steel box girder installation. The wet joints pouring for the steel box girders of two girder sections were done simultaneously. After the strength was achieved, the prestressing of the wet joints and the second tensioning of the stay cables for this girder section were performed. The force value for the first cable tensioning was around 1000 kN, and the force value for the second cable tensioning was around 3000 kN.
The strain differences in wet joints before and after the key construction conditions after pouring the wet joint concrete are shown in Table 3. As can be seen from Table 3, when the stay cables of the S6# girder section were tensioned, the internal measurement points of the stay cables were under compression, while the external S5 measurement points exhibited tension. This had a significant impact on the transverse stress of the wet joint, particularly on the transverse wet joint of the diaphragm. It had a smaller impact on the longitudinal stress of the wet joint. Consequently, the wet joint near the stay cable position experienced increased local stress, which could lead to stress concentration and the risk of cracking. When the stay cables of subsequent girder sections were tensioned, all wet joint measurement points were under compression. This was because the cable force could be resolved into an upward vertical force and a horizontal force directed towards the tower. The upward vertical force was equivalent to reducing the load on the cantilever end of the steel box girder, thus providing compression to the wet joint of the S6# girder section. The horizontal force was a longitudinal horizontal force directed towards the tower.
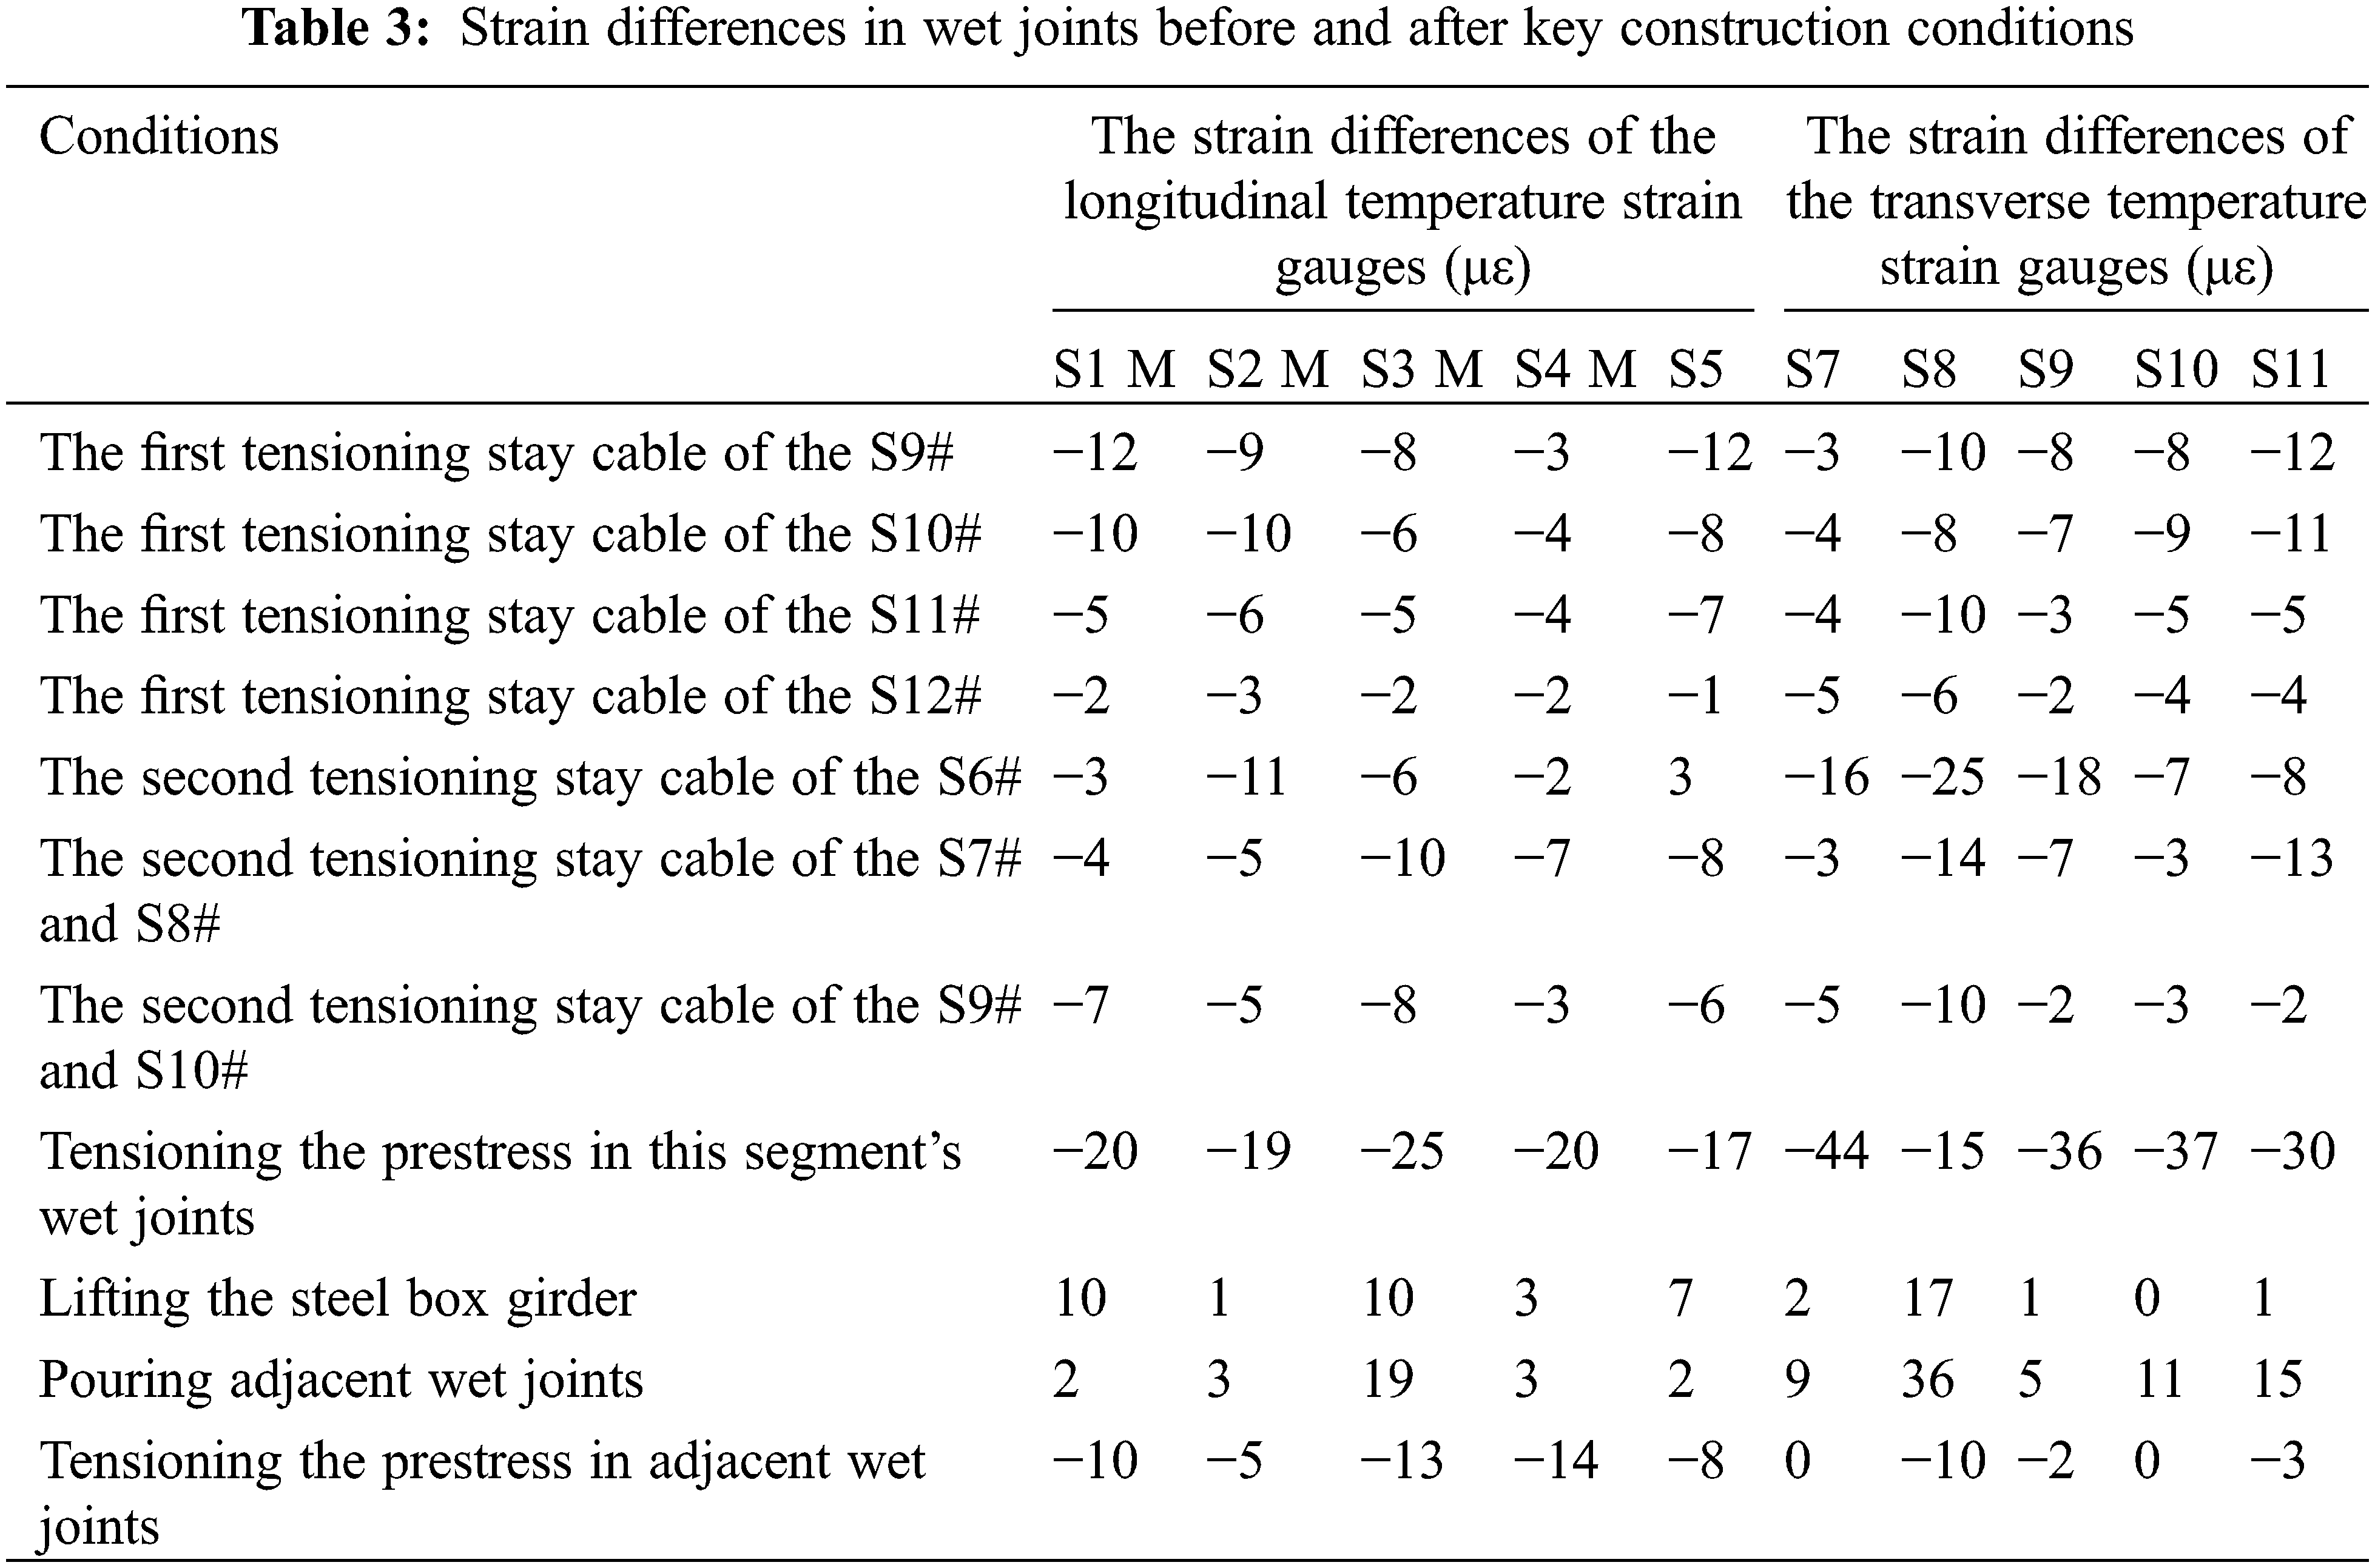
Fig. 19 shows the finite element analysis results of the stress variations in the concrete wet joint bridge deck systems of the S6# girder section before and after the stay cable tensioning for each girder section. Stress results are taken from the elements at the far end of the girder section. As can be seen from Fig. 19, tensile forces are exerted on the concrete of the S6# girder section when the stay cables of the S6# girder section are tensioned. Additionally, the concrete slab and wet joint of the S6# girder section are under compression during subsequent tensioning operations. During the first stay cable tensioning, the influence on the concrete decreased with increasing distance from the S6# girder section, which is consistent with the in-situ test results. However, during the second stay cable tensioning, due to the significant variation in the tensioning values of the individual stay cables, there was no distinct pattern observable along the direction of distance.

Figure 19: Finite element analysis results of stress changes in the concrete wet joint bridge deck systems of the S6# girder section, (a) The first tensioning of the stay cables, (b) The second tensioning of the stay cables
As can be seen from Table 3, under the condition of tensioning the prestress in this segment’s wet joints, the strains at each measuring point decreased, which was due to the fact that tensioning prestressing was equivalent to exerting pressure on the wet joints. Under the condition of tensioning diagonal cable, the strains at each measuring point decreased, which was due to the fact that the wet joints were located on the top plate of the composite girder, and the pressure on the top plate of the composite girder increased after tensioning the diagonal cable. Under the condition of lifting the steel box girder, the strains at each measuring point increased due to the increased load at the cantilever end of the composite girder, which in turn increased the tensile force on the top plate of the composite girder. Under the condition of pouring adjacent wet joints, the strains at each measuring point increased which was because pouring adjacent wet joints increased the load at the cantilever end of the composite girder, causing an increase in the strains of the wet joints. Under the condition of tensioning the prestress in adjacent wet joints, the strains at each measuring point decreased. It can be concluded that prestressing the adjacent wet joints also caused compression in the wet joints of this section.
3.6 Summary of the Causes of Wet Joint Cracking and the Proposal of Crack Resistance Measures
Cracks in wet joints are primarily categorized based on their causes into load cracks, temperature cracks, and shrinkage cracks. Load cracks in wet joints mainly occur due to tensile forces and stress concentration. According to in-situ test results, the transverse wet joints with diaphragms are subject to significant tensile forces, making them prone to load-induced cracks. The crack resistance of wet joints can be improved by locally reinforcing the rebar. Controlling the construction quality of wet joints can prevent local defects that lead to concentrated stresses. Temperature cracks are primarily caused by the heat of hydration, which leads to the expansion and thermal stress in the wet joint concrete. In-situ test results indicate that the hydration heat of wet joints causes tensile stress, thereby increasing the risk of cracking. The temperature of the concrete during placement can be reduced to lower the heat of hydration, and insulation measures can be taken to mitigate the uneven thermal expansion and contraction in the wet joint caused by temperature differences between the interior and exterior, thereby enhancing the crack resistance of the wet joint. Shrinkage cracks occur when the surface of wet joint concrete loses water rapidly, causing a sharp volume reduction. At this point, the tensile strength of the concrete is insufficient to resist the tensile stress generated by its shrinkage. The use of micro-expansive concrete and enhanced early curing can prevent cracking. In-situ test results show that the strain curve of the wet joint generally exhibits a downward trend, indicating that despite the use of micro-expansive concrete, there is still some degree of shrinkage.
3.7 Analysis of the Cooperative Working Performance of Composite Girders
Fig. 20 shows comparisons of the longitudinal strains in the top, middle and bottom layers at the measuring points inside the wet joint. The horizontal axis represents the number of days after the wet joints have been cast. As indicated by Fig. 20, the strain patterns in the top, middle, and bottom layers of the wet joint were consistent, performing an overall trend of increasing compressive strain. However, there was no obvious pattern between the magnitude of the strains of the measured points in each layer, indicating that inside the wet joints, the strains of the measured points at different heights did not fully conform to the assumption of a flat cross-section, which was mainly due to the complexity of the stress conditions in the wet joints. The wet joints are concrete under constrained conditions, affected by surrounding precast concrete panels, internal prestressed reinforcements, and ordinary steel bars, and also influenced by the bottom steel box girders.
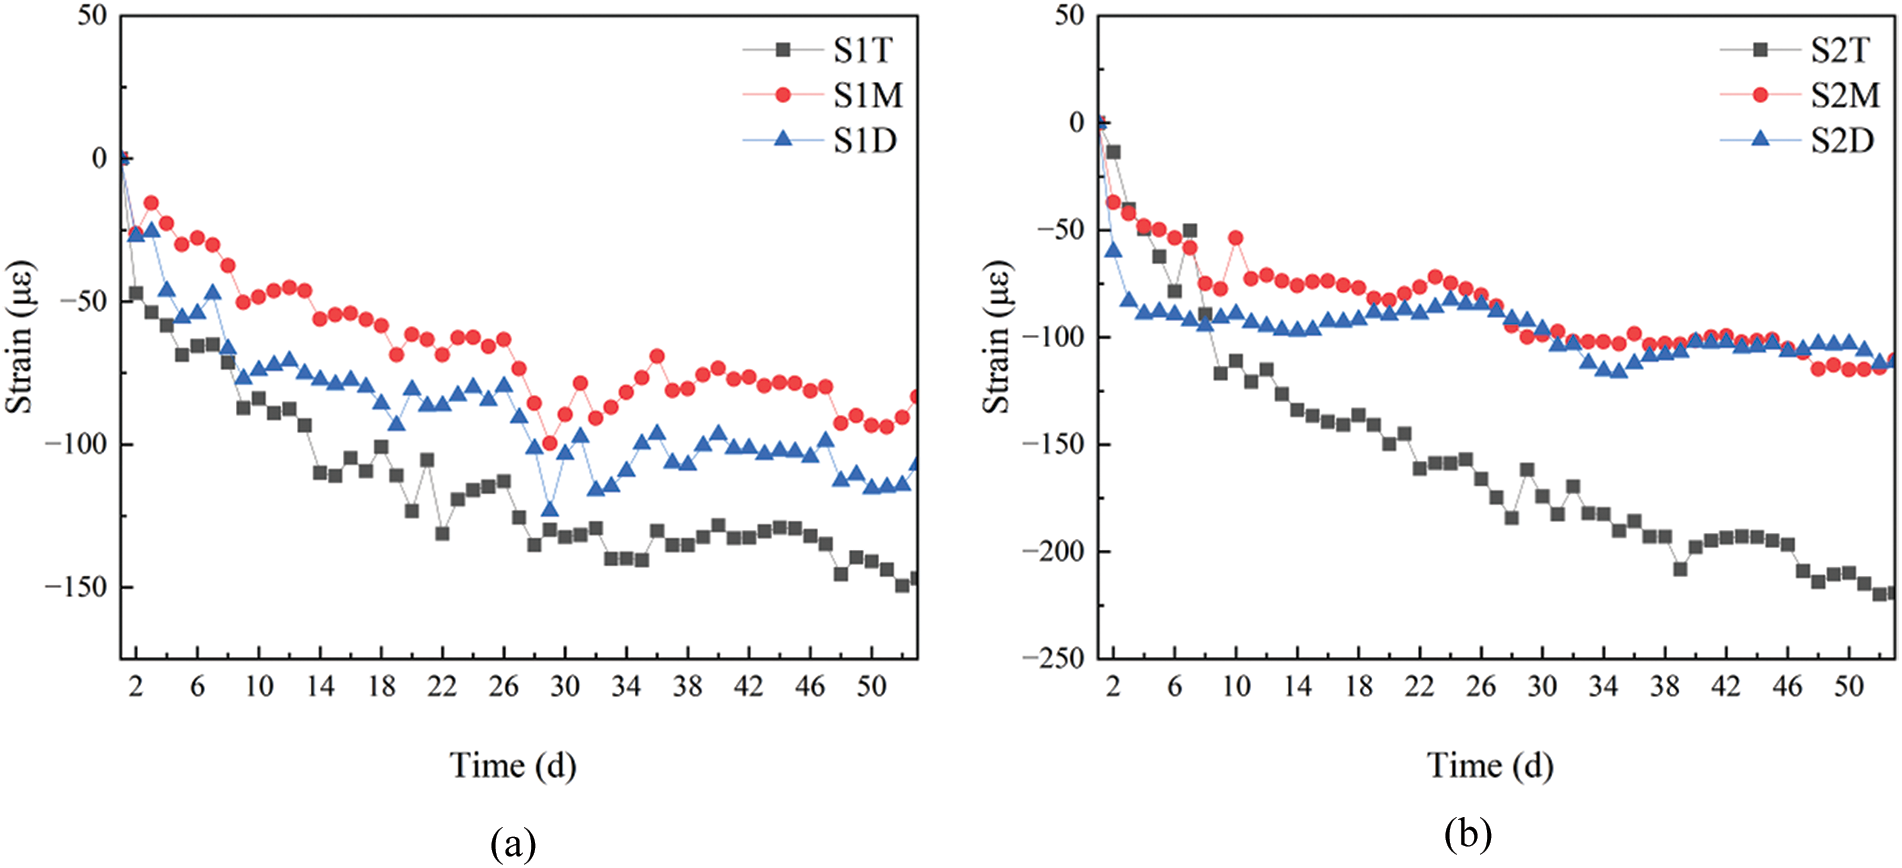
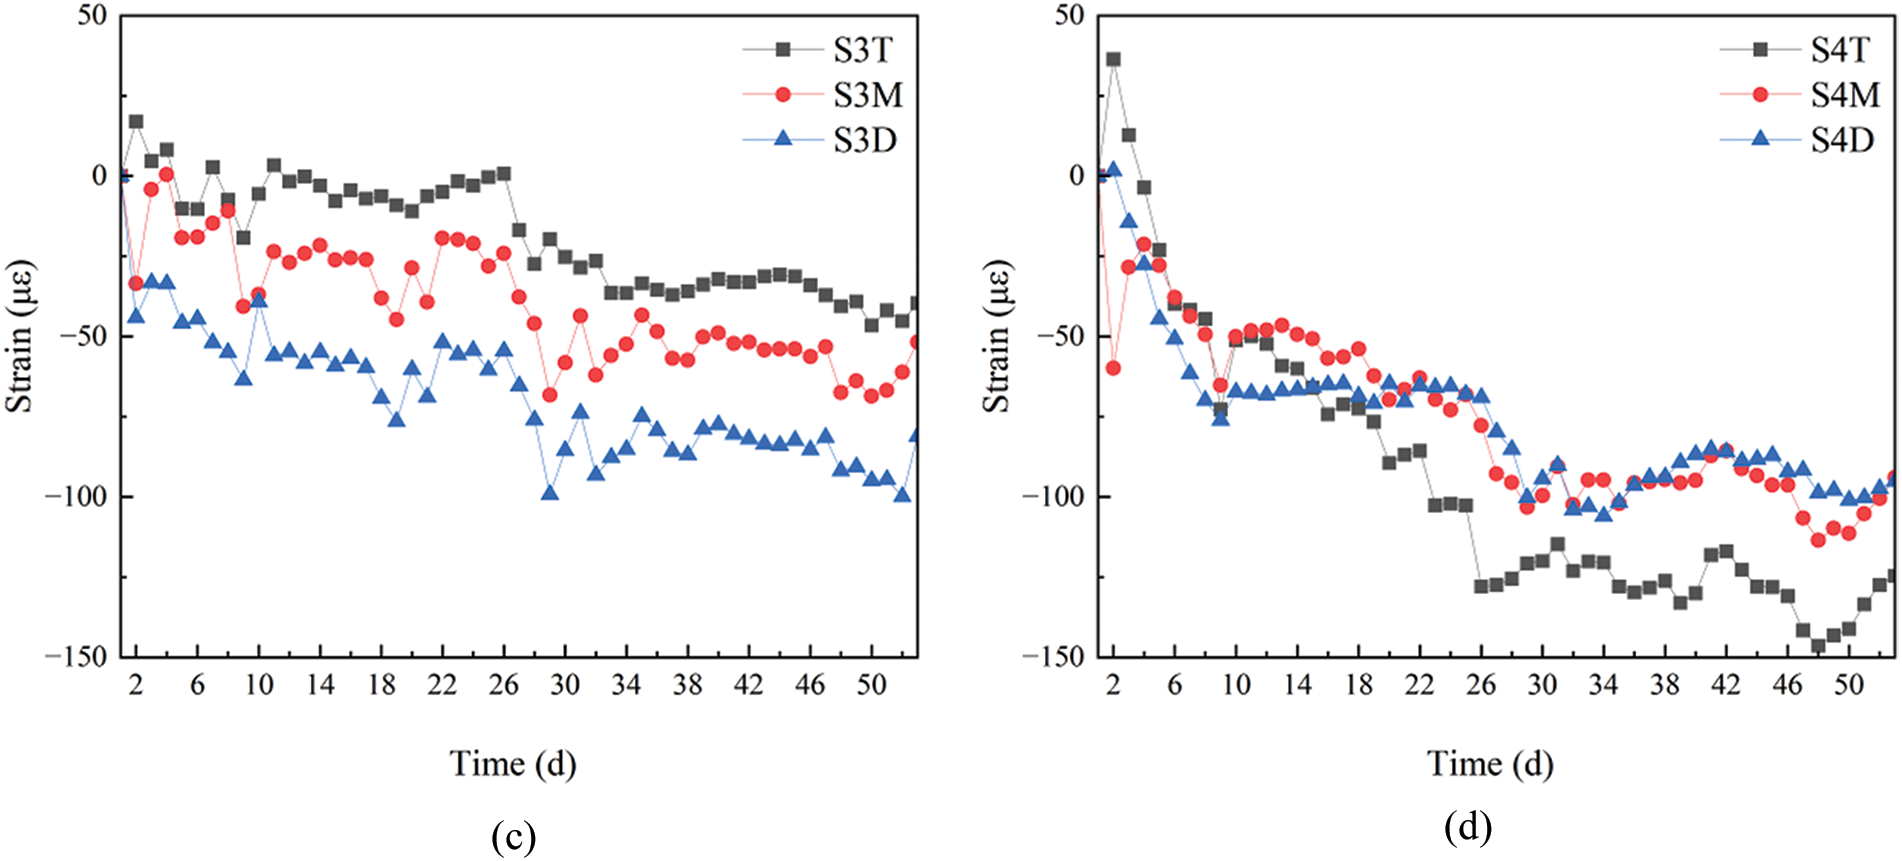
Figure 20: Comparisons of longitudinal strains at the top, middle, and bottom layers of the internal measuring points in the wet joint, (a) Position 1, (b) Position 2, (c) Position 3, (d) Position 4
Figs. 21 and 22 show the strain differences between the bottom of the wet joint and the top plate of the steel box girder. The horizontal axis represents the number of days after the wet joints have been cast. As can be seen from Figs. 21 and 22, there are differences in strain between measuring points S1D and G1, as well as between S3D and G3. This indicates that the top plate of the steel box girder and the wet joint above it were not perfectly bonded, and there was a certain degree of deformation difference. The accumulation of deformation differences may lead to slip between the two. The strain difference between the wet joint concrete and the steel box girder had remained stable at a relatively small value before the closure of the side span, suggesting that the relative deformation between the concrete and the steel box girder had been controlled to some extent. However, even if the strain difference had decreased, the significant strain difference that had already occurred may have caused some damage, such as local stress concentration and slippage, which would not disappear with the reduction of the strain difference. Most of the relative strain differences at the measuring points of the composite beam interface were negative, indicating that the compressive strains at the bottom measuring points of the wet joint were greater than those of the top plate of the steel box girder. Additionally, the change of strain difference is similar to the trend of temperature change, and the two are roughly positively correlated.

Figure 21: Strain differences between measuring points S1D and G1

Figure 22: Strain differences between measuring points S3D and G3
4 Finite Element Analysis of the Cooperative Working Performance of Composite Girders
To explore the impact of interface slippage on the cooperative working performance of the composite girder after the strain difference between the concrete and the steel box girder had tended to stabilize, the general connection within the elastic connection was used in the Midas Civil to simulate the role of the actual shear connectors, allowing slippage to occur, and the fixed connection within the elastic connection was used to simulate the prevention of slippage. By comparing the main beam deflection and stress distribution patterns of the two models before the closure of the side span and after the completion of the bridge, the impact of interface slippage on the cooperative working performance of the composite girder was revealed.
4.1 Calculation Method for Shear Stud Shear Stiffness
The general connection within the elastic connection was used to simulate the function of the shear studs, and the calculation method for the shear studs considering interface slippage was based on the method proposed by Wang [30] for stiffness calculation. The shear stiffness of the shear studs was calculated according to Eq. (3).
where
4.1.1 Push-Out Test and Numerical Simulation
The method described in Eq. (3) relies on the load-slip curve from the push-out test. Due to the extended duration of the push-out experiment, a numerical simulation-based method for obtaining the load-slip curve has been proposed to enhance computational efficiency. The accuracy and feasibility of the numerical simulation were verified against the results of the push-out test.
Push-out test photos are shown in the Fig. 23. The specimens were divided into two groups, and each group contained one push-out specimen. The specifications of the shear studs were 22 mm in diameter and 150 mm in height. The shear studs were purchased as finished products, the specification was ML15AL. The push-out test load-slip curve is shown in Fig. 24.

Figure 23: Push-out test photos, (a) Specimen making, (b) Specimen loading

Figure 24: The push-out test load-slip curve
A numerical simulation of the push-out test for shear studs of specification Φ22 mm × 150 mm was conducted by Abaqus. The numerical simulation utilized the same shear studs and wet joint concrete materials as those in the actual project. Material properties were obtained from the synchronous mechanical test of the wet joint concrete. The compressive and tensile stress-strain relationships for concrete were defined by Eqs. (4) and (5) in the Chinese code [29]. Additionally, the analysis incorporated the concrete damaged plasticity model.
where
The stress-strain relationship of the shear stud and steel beam is shown in Fig. 25 [31]. A bilinear model was used for simulation, where the stress-strain relationship was linear during the elastic stage, and a flatter straight line was used to simulate after the yield hardening. The elastic modulus and stress-strain relationship for both tension and compression were taken to be the same. In this case, the elastic modulus

Figure 25: The stress-strain relationship of shear stud and steel beam
The concrete slab, steel beam, and shear studs were meshed by eight-node reduced integral format 3D solid elements (C3D8R). The mesh and assembly diagram of the model is shown in Fig. 26. Considering the symmetry of the push-out test specimen, a 1/2 finite element model was established to simplify calculations. The mesh size at the shear studs and their junction with the steel beam, as well as the junction between the concrete and the shear studs, was set to 3–4 mm, while other areas were meshed with sizes ranging from 5–15 mm. The shear studs and steel beams were divided into 2344 C3D8R elements and 3569 nodes. The concrete was divided into 7592 C3D8R elements and 8982 nodes. The bond force between the shear studs and concrete was not considered. The shear studs and the steel beam were simulated as a unified entity due to the welding process used during the push-out test. The bottom of the concrete specimen was fixed, and due to the use of a symmetric model, a symmetric boundary condition was added at the symmetric plane of the steel beam’s web. Displacement loading was applied to the steel beam to simulate shear, and the load-slip curve was recorded.

Figure 26: The mesh and assembly of the model, (a) Concrete slab model, (b) Steel beam and shear stud model, (c) Assembly model
4.1.2 Numerical Simulation Results and Validation of the Push-Out Test
The numerical simulation and experimental comparison of the load-slip curves for shear studs of specification Φ22 mm × 150 mm are shown in Fig. 27, and the curves are relatively consistent. The numerical simulation of the push-out test for shear studs of this specification indicated an ultimate shear resistance of 193.9 kN, which closely matched the experimentally determined shear capacity of 193.8 kN, thereby confirming the precision of the numerical simulation outcomes. The numerical simulation results indicated a shear force of 118 kN for an interface slip of 0.8 mm, which closely aligned with the experimentally determined average value of 113 kN. This small discrepancy confirms the accuracy and thus the feasibility of using numerical simulation to model the stiffness of shear studs. Utilizing the same modeling method, simulations were conducted for other specifications of shear studs in the bridge, including Φ22 mm × 280 mm and Φ22 mm × 300 mm. The resulting load-slip curves for these three types of shear studs are illustrated in Fig. 28. As can be seen from Fig. 28, the shear capacities of the three shear stud specifications are 198.21, 193.85, and 200.42 kN, respectively. This indicates that when the diameter of the shear studs is the same, the change in length has an insignificant effect on the shear bearing capacity.

Figure 27: The numerical simulation and experimental comparison of the load-slip curves for shear studs of specification Φ22 mm × 150 mm
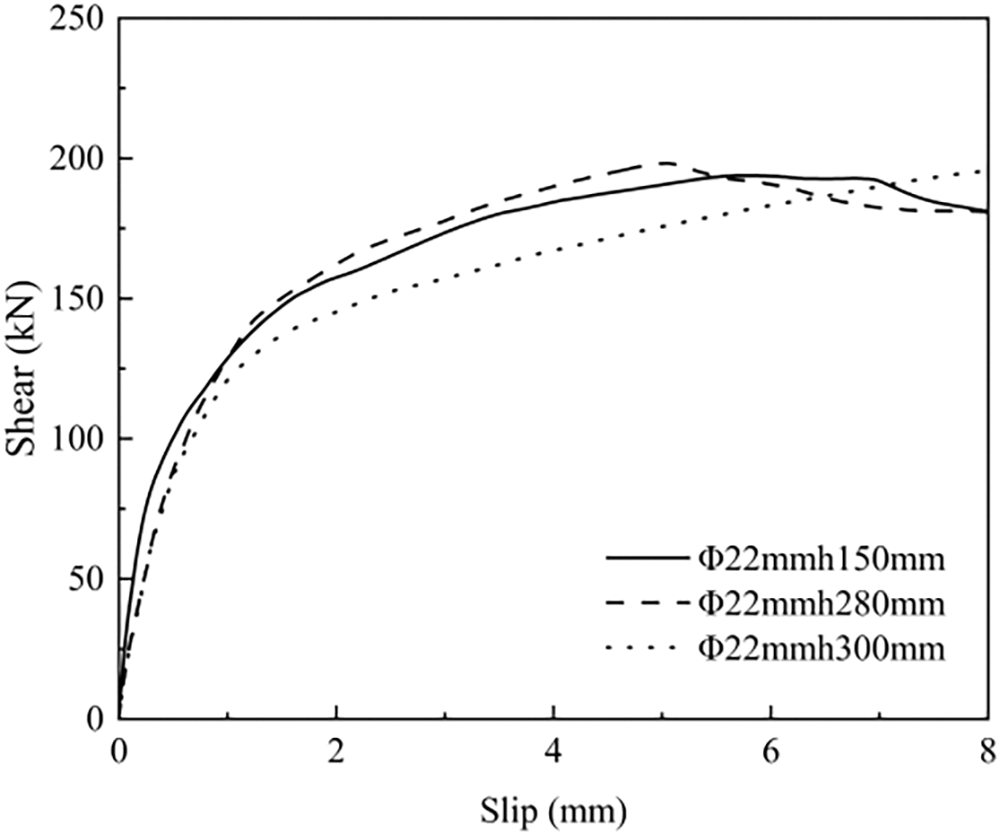
Figure 28: Load-slip curves of three types of shear studs
4.1.3 Calculation of Shear Stiffness for Individual Girder Section Shear Studs
The stiffness calculation values for shear studs in three orthogonal directions within a single girder section are determined using Eq. (6).
where Kx, Ky, and Kz are the longitudinal bridge-direction shear stiffness, transverse bridge-direction shear stiffness, and tensile stiffness of the elastic connection, respectively; n1, n2, and n3 are the quantities of the three types of shear studs within a 2 m length of the girder; k1x, k2x, and k3x are the longitudinal bridge-direction shear stiffnesses of the three individual shear studs, calculated according to Eq. (3); k1y, k2y, and k3y are the transverse bridge-direction shear stiffnesses of the three types of shear studs, also calculated according to Eq. (3); k1z, k2z, and k3z are the tensile stiffnesses of the three types of shear studs, which are calculated using Eq. (7).
where As is the cross-sectional area of the shear stud and L is the length of the shear stud.
4.2 Analysis of the Impact of Interface Slip on the Cooperative Working Performance of Composite Girders
The cooperative work performance of the composite girders was analyzed before the closure of the side span construction stage and after the completion of the bridge construction stage. Before the closure of the side span construction stage, the loads included the self-weight of the entire bridge, the tensioning of the stay cables, the crane loads, the prestressing tensioning, and the permanent load on the side span. After the completion of the bridge construction stage, the loads included the self-weight of the entire bridge, the pavement layer loads, the tensioning of the stay cables, the prestressing tensioning, and the permanent load on the side span.
The interface slip value represents the difference in longitudinal deformation between the wet joint bridge deck system and the steel box girder. The distribution of interface slip along the main beam is shown in Fig. 29. As can be seen from Fig. 29, before the closure of the side span, the slip deformation is symmetrically distributed around the bridge tower, with the maximum relative slip value being 0.063 mm. There is almost no slip near the bridge tower, and as the distance from the tower increases, the relative slip value gradually increases, slightly decreasing near the cantilever end. The S6# girder section is close to the bridge tower, and in the in-situ test, before the closure of the side span, the strain difference between the concrete and the steel box girder is small, indicating that the relative slip here is small, which is consistent with this conclusion. After the bridge is completed, the relative slip value of the side span is small, while the relative slip value of the middle span is larger. The maximum relative slip is 0.306 mm, occurring near the center of the middle span.

Figure 29: Distribution of interface slip along the longitudinal direction of the main beam, (a) Before the closure of the side span, (b) After the completion of the bridge
Comparing the deflection distribution of the main beam calculated with and without considering relative slip, the results are shown in Fig. 30. As can be seen from Fig. 30, when considering relative slip, the overall deflection of the main beam increases for both before the side span closure and after the bridge completion. Before the closure of the side span, the maximum deflection of the main beam considering relative slip is 130 mm, which is an increase of 9 mm compared to the deflection without slip. After the completion of the bridge, the maximum deflection of the main beam considering relative slip is 0.552 m, which is an increase of 32 mm compared to the deflection without slip.

Figure 30: Comparison of the deflection distribution of the main beam, (a) Before the closure of the side span, (b) After the completion of the bridge
Comparing the stress in the bottom plate of the steel box girder calculated with and without considering relative slip, the results are shown in Fig. 31. As can be seen from Fig. 31, when considering relative slip, the stress in the bottom plate of the steel box girder increases for both before the side span closure and after the bridge completion. The maximum tensile stresses in the bottom plate of the steel box girder for the two conditions, when considering relative slip, are 25 and 119.11 MPa, respectively, which are increases of 1.3 and 9.11 MPa compared to the models that do not consider relative slip. Relative slip has an adverse effect on the bottom plate of the steel box girder.

Figure 31: Comparison of the stress in the bottom plate of the steel box girder, (a) Before the closure of the side span, (b) After the completion of the bridge
(1) Within 1–2 days after casting the wet joints, the internal temperatures of the wet joints are significantly influenced by the heat of hydration, making them much higher than the environmental temperature, after which the temperatures gradually decrease. The temperatures at the surface measuring points of the wet joints are greatly affected by the environmental temperature. In winter, it is important to pay attention to the thermal insulation and curing of the wet joints within five days after casting the concrete for the wet joints. Due to the heat of hydration of the wet joints, the temperatures at the measuring points on the top plates of the steel box girders are also higher than the environmental temperature, showing a similar temperature change pattern to that of the wet joint measuring points.
(2) Temperature is an important factor affecting the strain and stress in wet joint concrete. Temperature differences can induce thermal stress in wet joints, and if the stress is too high, it can lead to the formation of temperature cracks in the wet joints. About 7 days after the wet joint concrete is cast, the changes in strains at each measuring point are generally negatively correlated with the change in temperature; different locations within the wet joints have respective impacts. The transverse wet joint of the diaphragm is prone to tensile cracking due to the influence of load factors and represents a weak point in the wet joint. Preventive measures must be taken during design and construction to prevent cracking at these weak points. Construction conditions also have an effect on the stresses and strains in wet joints. Tensioning the stay cables of this girder section results in both increased and decreased compression in the wet joint of this section, while further tensioning of the stay cables subsequently leads to an increase in compression in the wet joint.
(3) The top plate of the steel box girder is not fully bonded to the bottom surface of the wet joint. After being loaded, a certain strain difference will be generated, which is generally positively correlated with the temperature.
(4) The calculation method for the shear stiffness of connectors based on numerical simulation used in this study can provide a reference for calculating the stiffness of shear connectors in steel-concrete composite girders.
(5) The strain differences between the wet joint concrete and the steel box girder can cause interface slip in composite girders. Before the closure of the side span construction stage, the relative slip value is positively correlated with the cantilever length of the main girder. After the completion of the bridge construction stage, the relative slip value in the side span is smaller, while it is larger in the middle span, with the maximum relative slip occurring near the center of the middle span. Interface slippage leads to increased deflection of the composite girders and increased tensile stress in the bottom plate of the steel box girders.
Acknowledgement: None.
Funding Statement: The authors received no specific funding for this study.
Author Contributions: The authors confirm contribution to the paper as follows: study conception and design: Yang Wang, Zhe Wu, Kaixing Zhang and Youzhi Wang; data collection: Yang Wang, Zhe Wu and Kaixing Zhang; analysis and interpretation of results: Yang Wang, Zhe Wu, Kaixing Zhang and Youzhi Wang; draft manuscript preparation: Yang Wang, Zhe Wu and Kaixing Zhang. All authors reviewed the results and approved the final version of the manuscript.
Availability of Data and Materials: The data that support the findings of this study are available from the corresponding author upon reasonable request.
Ethics Approval: Not applicable.
Conflicts of Interest: The authors declare no conflicts of interest toreport regarding the present study.
References
1. Wang YL, Gao ZY, Chen ZH, Zhao WY, Shi JH, Liao MJ. The design and construction of cable‐stayed bridge over Bouregreg River, Morocco. Bautechnik. 2019;96(2):150–9. doi:10.1002/bate.201800063. [Google Scholar] [CrossRef]
2. Schlaich M, Subbarao H, Kurian J. A signature cable-stayed bridge in India-the Yamuna Bridge at Wazirabad in New Delhi. Struct Eng Int. 2013;23(1):14–7. doi:10.2749/101686613X13363929988179. [Google Scholar] [CrossRef]
3. Cui B, Wu H, Zhao C, Liu J, Guo Z. Steel-concrete composite cable-stayed bridge—main bridge of the Jiangxinzhou Yangtze River Bridge at Nanjing. Struct Eng Int. 2022;33(1):107–14. doi:10.1080/10168664.2021.1999191. [Google Scholar] [CrossRef]
4. Zhao Q, Du Y, Peng YF, Xu C, Huang GM. Shear performance of short channel connectors in a steel-UHPC composite deck. Int J Steel Struct. 2020;20(1):300–10. doi:10.1007/s13296-019-00289-1. [Google Scholar] [CrossRef]
5. Ruan Y, Sun L, Yang Y, Ma Y. Study on Anti-cracking technology for deck of composite girder Cable-Stayed Bridge in construction stage. J Highw Transp Res Dev. 2022;39(11):106–14. [Google Scholar]
6. Jia JF, Ren ZD, Bai YL, Li J, Li B, Sun YG, et al. Tensile behavior of UHPC wet joints for precast bridge deck panels. Eng Struct. 2023;282:115826. [Google Scholar]
7. Zhu J, Wang C, Yang Y, Wang Y. Hygro-thermal–mechanical coupling analysis for early shrinkage of cast in situ concrete slabs of composite beams: theory and experiment. Constr Build Mater. 2023;372:130774. [Google Scholar]
8. Zhan Y, Zhang C, Xu J, Huang W, Shao J. Experimental study on crack performance of steel and early-age BFRC composite beams in negative moment region. Eng Struct. 2024;300:117222. [Google Scholar]
9. Jia JF, Ren ZD, Li J, Li B, Yan XF, Wang YG, et al. Flexural behavior of UHPC wet joints for precast bridge deck panels. Structures. 2024;70:107702. [Google Scholar]
10. Zhao CH, Wang KK, Zhou QF, Deng KL, Cui B. Full-Scale test and simulation on flexural behavior of dovetail-shaped reactive powder-concrete wet joint in a composite deck system. J Bridge Eng. 2018;23(8):04018051. [Google Scholar]
11. Xiao JL, Guo LX, Nie JG, Li YL, Fan JS, Shu BA. Flexural behavior of wet joints in steel-UHPC composite deck slabs under hogging moment. Eng Struct. 2022;252:113636. doi:10.1016/j.engstruct.2021.113636. [Google Scholar] [CrossRef]
12. Pan WH, Fan JS, Nie JG, Hu JH, Cui JF. Experimental study on tensile behavior of wet joints in a prefabricated composite deck system composed of orthotropic steel deck and ultrathin reactive-powder concrete layer. J Bridge Eng. 2016;21(10):04016064. doi:10.1061/(ASCE)BE.1943-5592.0000935. [Google Scholar] [CrossRef]
13. Qiao J, Xu Y, Zhang X, Wang Q, Zhang C. Bonding performance of SAP self-curing wet joint mortise-tenon interface. Thermosetting Resin. 2023;38(1):7–11 (In Chinese). [Google Scholar]
14. Feng J, Hu Z, Jiang H, Hu J, Qiu Y. Influence of RPC grouting materials on shear behavior of wet joints in PCSBs with confining stress. Constr Build Mater. 2021;299:123993. doi:10.1016/j.conbuildmat.2021.123993. [Google Scholar] [CrossRef]
15. Huang D, Nie X, Zeng J, Jiang Y. Experimental and numerical analysis on flexural behavior of improved U-bar joint details for accelerated bridge construction. Eng Struct. 2023;289:116328. doi:10.1016/j.engstruct.2023.116328. [Google Scholar] [CrossRef]
16. Dong A, Li Z, Rong B, Wang C, Wang Z, Xu H. Flexural behavior of wet panel-to-panel groove-and-tongue joints provided with lapped U-bars. Eng Struct. 2024;299:117053. doi:10.1016/j.engstruct.2023.117053. [Google Scholar] [CrossRef]
17. Chen D, Zeng M, Su Q, Lou Y. Interfacial treatment measures of wet joints in composite bridge deck composed of steel and UHPC layer. China J Highw Transp. 2018;31(12):154–62 (In Chinese). [Google Scholar]
18. Lu K, Xu Q, Li W, Hu Y, Wang J, Yao Y. Fatigue performance of UHPC bridge deck system with field-cast dovetail joint. Eng Struct. 2021;237:112108. doi:10.1016/j.engstruct.2021.112108. [Google Scholar] [CrossRef]
19. Wang CS, Zhang WT, Yang MY. Shear lag effect of composite girders in cable-stayed bridges under dead loads. Eng Struct. 2023;281:115752. doi:10.1016/j.engstruct.2023.115752. [Google Scholar] [CrossRef]
20. Liu J, Liu YJ, Jiang L, Zhang N. Long-term field test of temperature gradients on the composite girder of a long-span cable-stayed bridge. Adv Struct. 2019;22(13):2785–98. doi:10.1177/1369433219851300. [Google Scholar] [CrossRef]
21. Deng XG, Liu MY. Nonlinear stability analysis of a composite girder Cable-Stayed Bridge with three pylons during construction. Math Probl Eng. 2015;2015:978514. doi:10.1155/2015/978514. [Google Scholar] [CrossRef]
22. Xiao JL, Dong B, Nie JG, Zhang Y, Fan JS, Dong YQ. Full-scale experimental study on continuous UHPC slabs of steel-UHPC composite deck system. Structures. 2022;43:1716–31. doi:10.1016/j.istruc.2022.07.047. [Google Scholar] [CrossRef]
23. Huang D, Wei J, Liu X, Xiang P, Zhang S. Experimental study on long-term performance of steel-concrete composite bridge with an assembled concrete deck. Constr Build Mater. 2019;214:606–18. doi:10.1016/j.conbuildmat.2019.04.167. [Google Scholar] [CrossRef]
24. Guo J, Zhou Z, Zou Y, Zhang Z, Jiang J, Wang X. Static behavior of novel shear connectors with post-poured UHPC for prefabricated composite bridge. Structures. 2022;43:1114–33. doi:10.1016/j.istruc.2022.06.061. [Google Scholar] [CrossRef]
25. Deng W, Xiong Y, Liu D, Zhang J. Static and fatigue behavior of shear connectors for a steel-concrete composite girder. J Constr Steel Res. 2019;159:134–46. doi:10.1016/j.jcsr.2019.04.031. [Google Scholar] [CrossRef]
26. Cao L, Zeng D, Liu Y, Li Z, Zuo H. Deflection calculation method for UHPC composite beams considering interface slip and shear deformation. Eng Struct. 2023;281:115710. doi:10.1016/j.engstruct.2023.115710. [Google Scholar] [CrossRef]
27. Zhang Q, Jia D, Bao Y, Dong S, Cheng Z, Bu Y. Flexural behavior of steel-concrete composite beams considering interlayer slip. J Struct Eng. 2019;145(9):04019084. doi:10.1061/(ASCE)ST.1943-541X.0002374. [Google Scholar] [CrossRef]
28. Deng XG, Liu MY. Construction scheme research of long-span cable-stayed bridge with three pylons based on structure stability. Appl Mech Mater. 2014;587–589:1527–34. doi:10.4028/www.scientific.net/AMM.587-589.1527. [Google Scholar] [CrossRef]
29. Zhao JD, Xu YL, Huang XK, Zhu AP, Wang XF, Fu JP, et al. Ministry of Housing and Urban-Rural Development of the People’s Republic of China. Code for design of concrete structures: GB 50010-2015. Beijing: China Architecture & Building Press; 2015 (In Chinese). [Google Scholar]
30. Wang YC. Deflection of steel-concrete composite beams with partial shear interaction. J Struct Eng. 1998;124(10):1159–65. doi:10.1061/(ASCE)0733-9445(1998)124:10(1159). [Google Scholar] [CrossRef]
31. Lam D, El-Lobody E. Behavior of headed stud shear connectors in composite beam. J Struct Eng. 2005;131(1):96–107. doi:10.1061/(ASCE)0733-9445(2005)131:1(96). [Google Scholar] [CrossRef]
Appendix A
Cite This Article
 Copyright © 2025 The Author(s). Published by Tech Science Press.
This work is licensed under a Creative Commons Attribution 4.0 International License , which permits unrestricted use, distribution, and reproduction in any medium, provided the original work is properly cited.
 Downloads
 Citation Tools