
 Submit a Paper
 Propose a Special lssue
 Open Access
ARTICLE

Experimental and Numerical Study of Bonding Capacity of Interface between Ultra-High Performance Concrete and Steel Tube
1 China Communications Third Highway Engineering Bureau Co., Ltd., Fuzhou, 350300, China
2 College of Civil Engineering, Fujian University of Technology, Fuzhou, 350118, China
* Corresponding Author: Wei Zhang. Email:
Structural Durability & Health Monitoring 2025, 19(2), 285-305. https://doi.org/10.32604/sdhm.2024.057513
Received 19 August 2024; Accepted 10 October 2024; Issue published 15 January 2025
 View Full Text
 Download PDF
Abstract
This study investigates the bond performance at the interfacial region shared by Ultra-High Performance Concrete (UHPC) and steel tubes through push-out tests. This study examines how changes in steel fiber volumetric ratio and thickness of steel tube influence the bond strength characteristics. The results show that as the enhancement of the steel tube wall thickness, the ultimate bond strength at the interface improves significantly, whereas the initial bond strength exhibits only slight variations. The influence of steel fiber volumetric ratio presents a nonlinear trend, with initial bond strength decreasing at low fiber content and increasing significantly as fiber content rises. Additionally, finite element (FE) simulations were applied to replicate the experimental conditions, and the outcomes showed strong correlation with the experimental data, confirming the exactitude of the FE model in predicting the bond behavior at the UHPC-Steel interface. These findings provide valuable insights for optimizing the design of UHPC-Filled steel tubes in high-performance structure.Keywords
The development of ultra-high performance concrete filled steel tube (UHPCFST) marks a significant milestone in composite construction materials [1–3]. Initially, normal-strength concrete filled steel tube (NCFST) were widely adopted because of their combination of the steel tension strength with the compression strength of concrete [4–6]. However, ultra-high performance concrete (UHPC), characterized by superior mechanical properties, durability, and reduced porosity, has expanded the potential applications of these composite systems [7]. UHPC’s high compressive strength and durability make it ideal for demanding structural applications, particularly in high-rise buildings and critical infrastructure [8]. UHPCFST are increasingly utilized in modern construction due to their exceptional strength and resilience [9–12], particularly beneficial in high load-bearing applications such as skyscrapers, long-span bridges, and seismic-resistant buildings [13]. The combination of UHPC and steel enhances structural integrity and allows for more slender, aesthetically pleasing designs [14], making these composite structures a preferred choice in both structural and architectural applications [15].
The use of UHPCFST offers significant benefits, including enhanced structural efficiency, reduced material use, and associated costs [16,17]. These systems improve overall ductility and energy absorption capacity, which is critical in seismic zones [1,3]. Furthermore, UHPC’s durability and low maintenance contribute to the longevity and sustainability of structures, aligning with the emphasis on sustainable building practices [18,19]. UHPCFST benefit from the synergy between UHPC’s high compressive strength and the steel tube’s confinement effect [18,20]. Bond strength between UHPC and steel is crucial for performance [4,5], ensuring effective load transfer and preventing premature failure [8,21]. This composite system offers superior crack resistance, enhanced durability, and improved resistance to harsh environmental conditions.
Recent scholarly investigations have concentrated on elucidating the determinants shaping the bond-slip characteristics of UHPCFST, with particular emphasis on parameters with the thickness of the steel tube walls, the fiber volumetric ratio incorporated into the UHPC matrix, and the methodologies employed for curing processes [22]. Thicker steel tube walls enhance the confinement effect, increasing bond strength [23], while steel fibers improve bonding by bridging cracks and distributing stresses [24,25]. Different curing methods, such as steam and chemical curing, optimize bond strength and overall performance [26]. The present investigation endeavors to conduct an experimental analysis to elucidate the influence mechanisms of tube thickness and the volumetric proportion of steel fibers on the bond strength at the interfacial area shared by UHPC and steel. Push-out tests will assess bond-slip characteristics by systematically varying these parameters, measuring bond strength under controlled conditions.
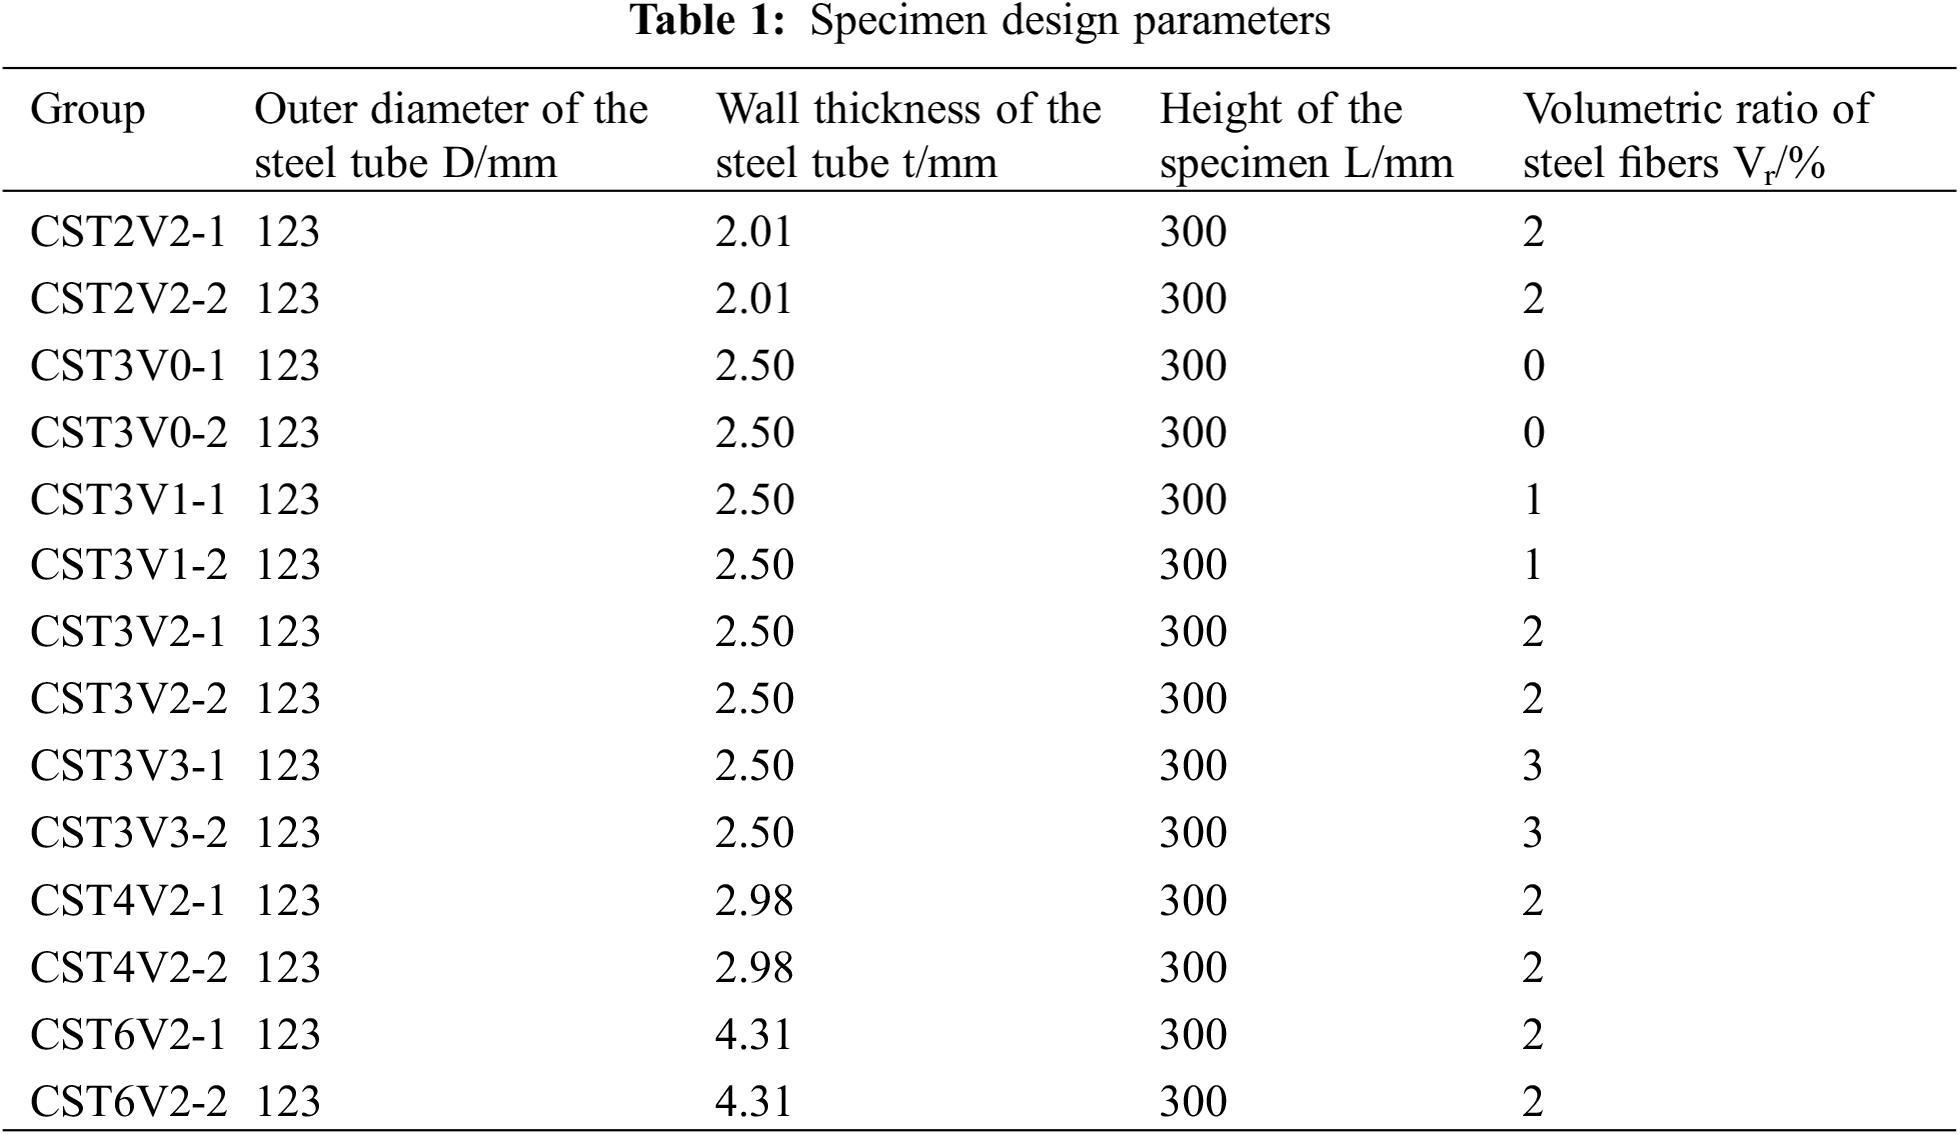
The present research produced five sets of UHPCFST specimens, totaling ten specimens, as detailed in Table 1. Each set consists of two specimens with the same parameters. The critical experimental parameters include the fiber volumetric ratio and steel tube wall thickness. In the specimen numbering system, The abbreviation “CS” signifies that the configuration of the steel is circular, “T” denotes the thickness of the steel, while “V” represents the volumetric ratio of steel fibers incorporated into the material. All specimens are made of 20# seamless tubes and are steam-cured at a high temperature of 90°C. The interior of the steel tube was filled with UHPC, forming a 250 mm-long bonding interface. To facilitate the test of push-out, a 50 mm section of the steel tube was left empty, providing the necessary space. A small 3 mm × 3 mm vent was strategically positioned 20 mm above the base of the steel tube, ensuring proper exhaust during the test and eliminating any potential impact of air pressure on the results. Additionally, a 10 mm thick, a 180 mm by 180 mm square plate of Q235 steel was positioned between the lower extremity of the application device and steel tube. This effectively reduced the risk of lateral slipping and ensured accurate and reliable test results.
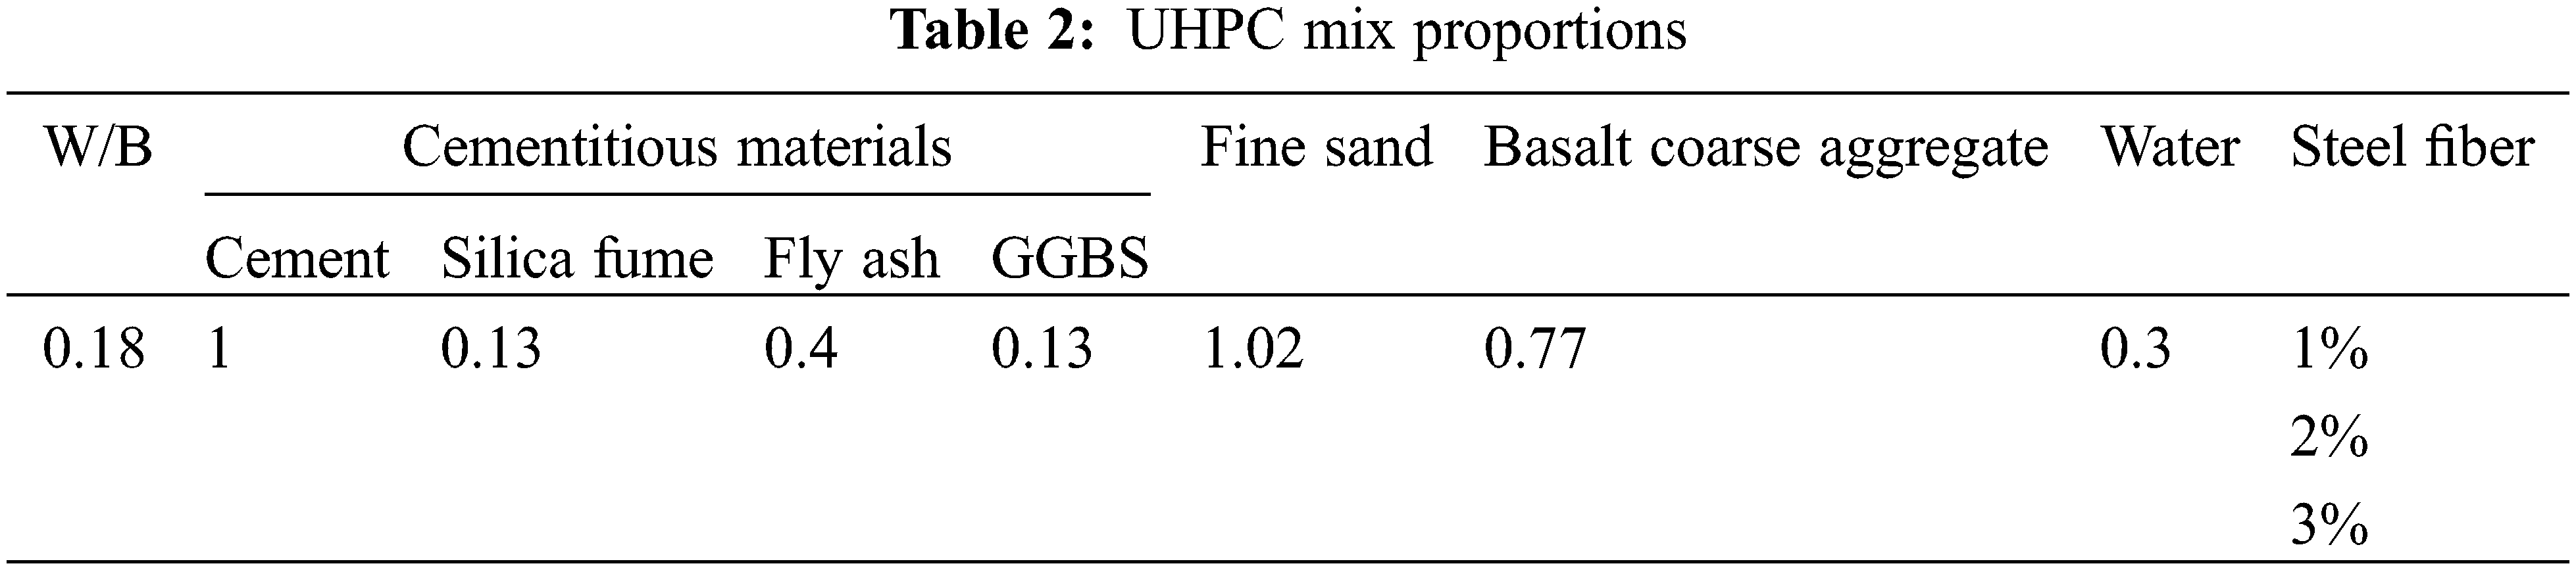
The materials used in this study are as follows: Cement: P42.5 Ordinary Portland Cement; Silica fume: containing a SiO2 content of at least 90%, an average particle size ranging from 0.1 to 0.15 μm; Fly ash: low-calcium fly ash, with 90% of particles having a diameter between 0.1 and 52.83 μm; Ground granulated blast furnace slag (GGBS): an alkaline slag with high content of basic oxides (Al2O3, CaO, MgO), and more than 70% of the particles are smaller than 5 μm; The diameter of basalt coarse aggregate particles falls within the range of 3 to 5 mm; Steel fiber: straight cold-drawn steel wire fibers, coated with a thin layer of golden copper, equipped with a nominal diameter measuring 0.20 mm and a nominal length of 13 mm, aspect ratio of approximately 65, The material exhibits a tensile strength of at least 2000 megapascals (MPa) and possesses an elastic modulus of 200 gigapascals (GPa); Fine sand: Minjiang river sand, with a particle size smaller than 0.63 mm and its density is 2.6 g/cm3; Superplasticizer: CX-8 polycarboxylate superplasticizer with a water reduction rate exceeding 25%, as illustrated in Table 2.
2.2.2 Steel Material Properties
(1) In compliance with the stipulations outlined [27], the longitudinal arc-shaped samples were used to evaluate the tensile property of steel materials. These samples were precisely extracted from steel tubes by wire cutting technology to ensure their representativeness. To obtain reliable data, three independent samples were selected for tensile testing. See Fig. 1 for the design and processing drawings of the samples.
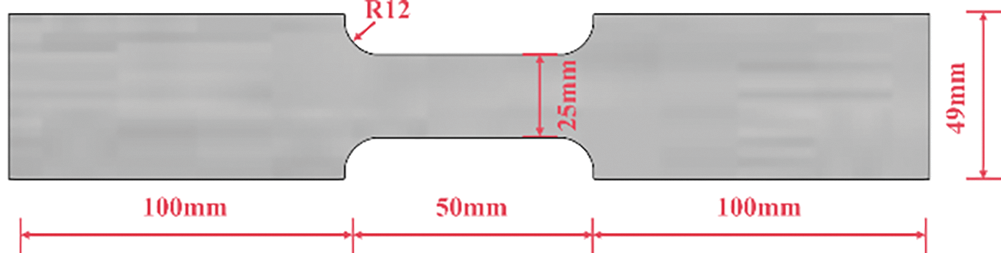
Figure 1: Steel tensile test specimen dimension diagram
(2) The middle sections on both sides of the samples were polished with sandpaper, Strain gauges were then affixed and linked to a data acquisition system. After centering and clamping on the testing machine, the samples were subjected to a 0.01 mm/s loading rate until they fractured, after which they were unloaded.
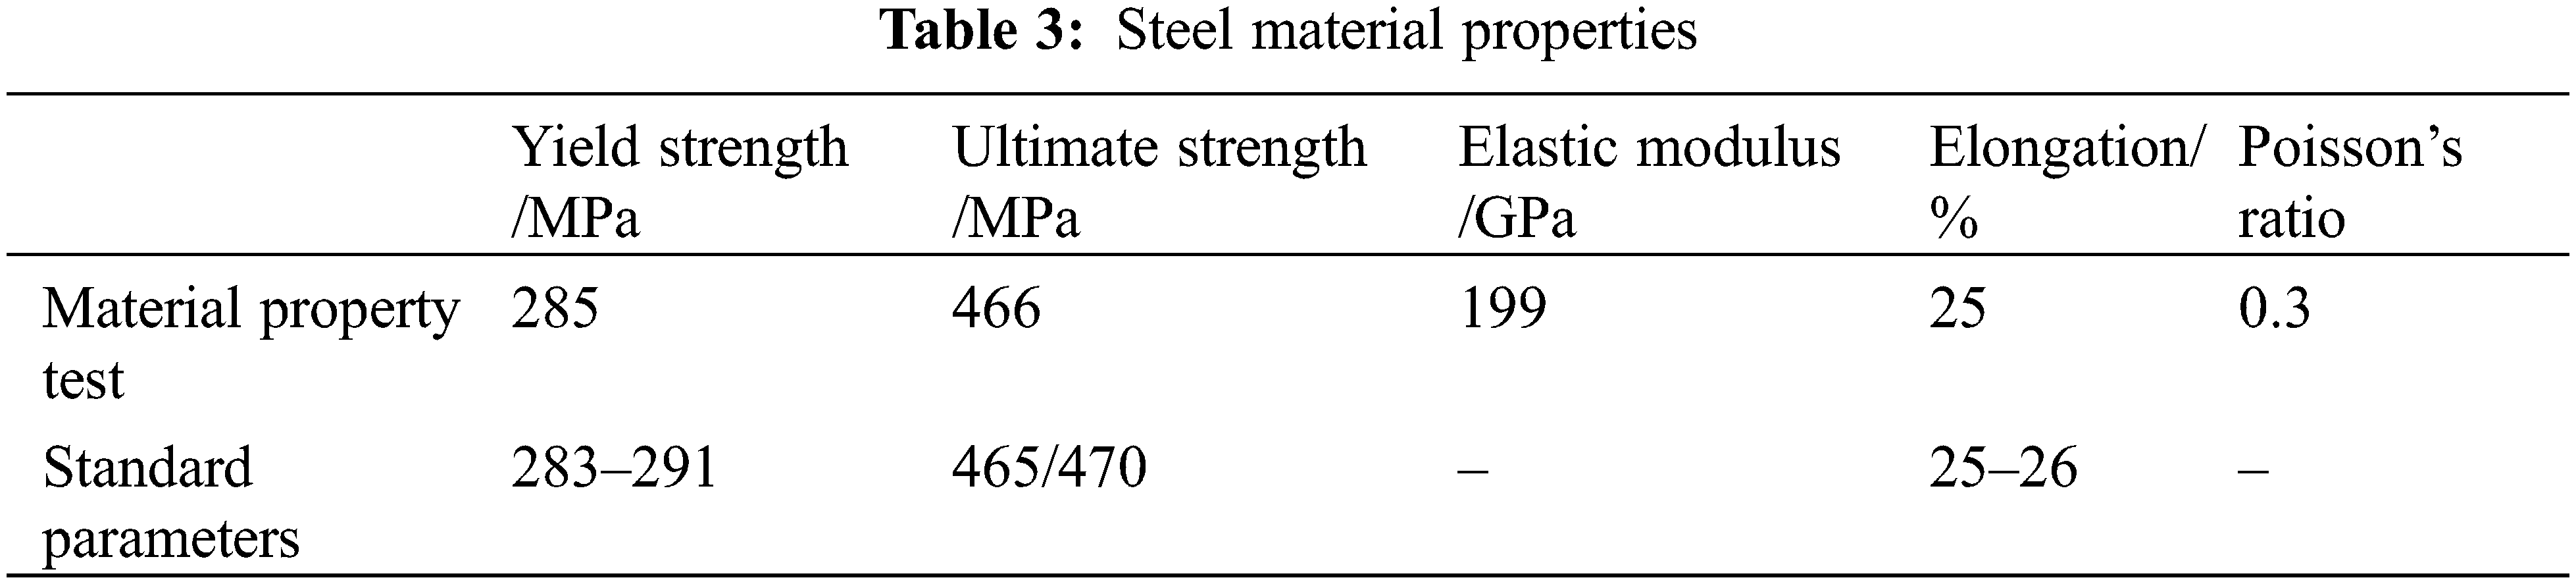
The results obtained from the steel material performance test were shown in Table 3, where each indicator of the material property test represents the average of three tests.
2.2.3 UHPC Material Properties
To explore the characteristics of interfacial phenomena, the mechanical prowess of UHPC assumes paramount relevance. To guarantee the reliability and effectiveness of the experimental data, the measurement of UHPC compressive strength and compressive modulus strictly followed the standard test methods [28,29].
(1) Compressive strength
For each set of UHPC parameters, three cubic specimens were created, with each sample exhibiting dimensions of 100 mm in length, width, and height. The samples were initially subjected to a prolonged, high-temperature steaming process that lasted for seven consecutive days, followed by standard curing for another twenty-one days. After the curing process was completed, mechanical performance tests were conducted on these specimens using a 200T universal testing machine. During the testing process, the loading rate was strictly controlled at 1.0 MPa/s. The specimens’ final failure modes were depicted in Fig. 2.
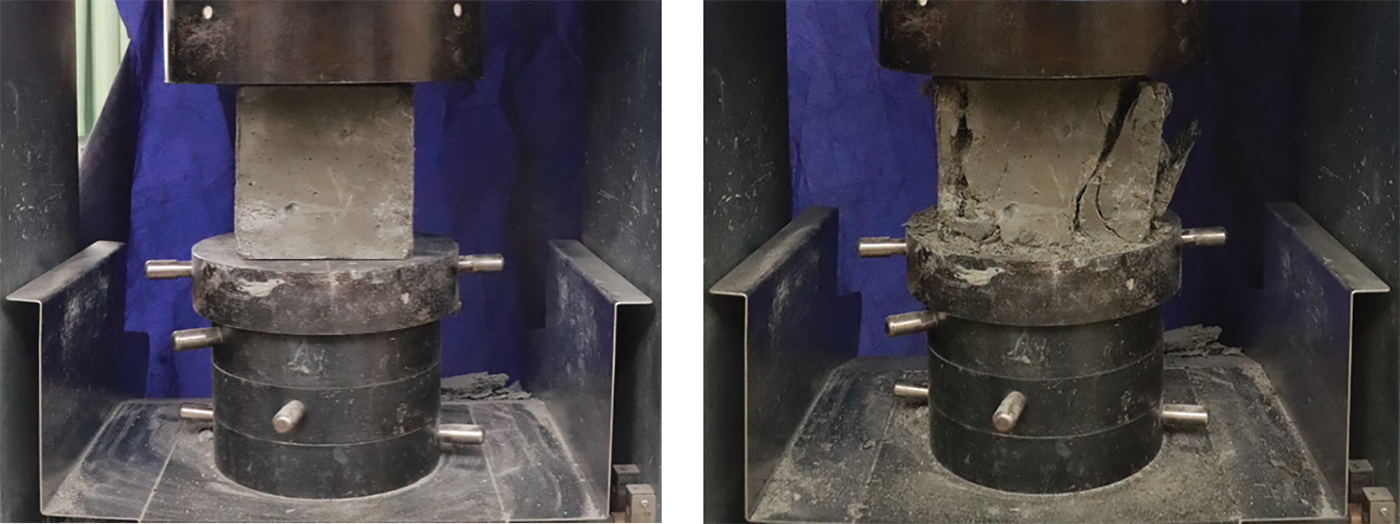
Figure 2: UHPC compressive strength test
(2) Compressive modulus of elasticity
For each set of UHPC parameters, three additional cubic specimens with size of 100 mm × 100 mm × 300 mm were fabricated. The specimens underwent an initial curing process involving high-temperature steaming for a duration of seven days, subsequently followed by a conventional curing phase extending for twenty-one additional days. Following the curing period, the specimens were evaluated using a 300T universal testing machine, with a 1.0 MPa/s loading rate established. The specimen is shown in Fig. 3a, and it was loaded according to the method illustrated in Fig. 3b.
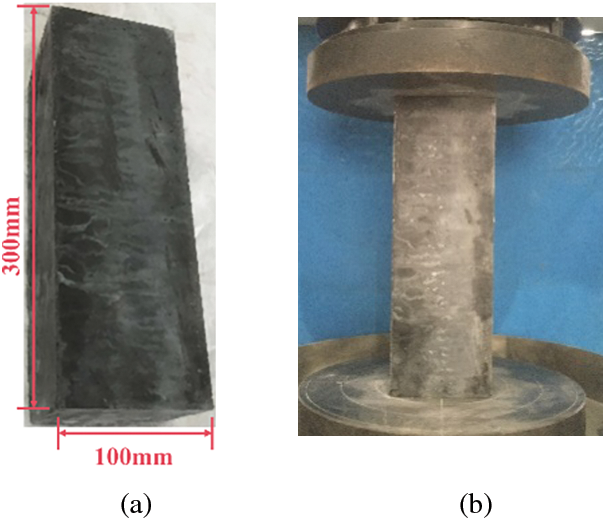
Figure 3: UHPC compressive elasticity modulus test: (a) compressive elasticity modulus specimen dimension diagram; (b) loading process of compressive elasticity modulus test
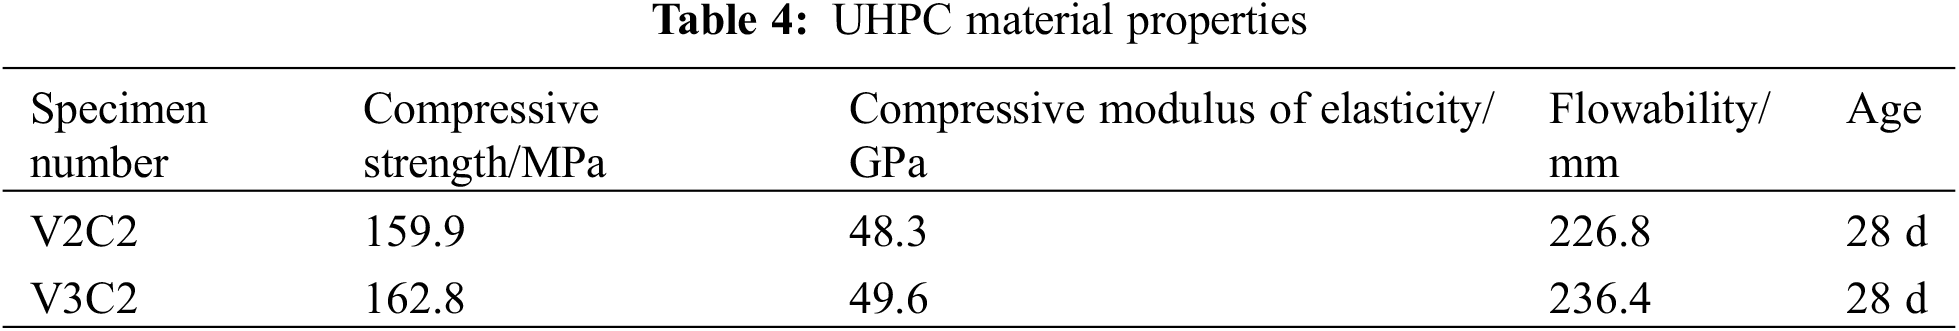
In this experiment, the testing of UHPC material properties was conducted strictly according to relevant specifications. To ensure data accuracy and reliability, test specimens with measurement results deviating more than 10% from the average were excluded. Comprehensive experimental results were found in Table 4.
The application of servo universal testing apparatus with 2000 kN facilitated the execution of the loading test. And a Distributed Control System (DCS)-200 numerical control system, as illustrated in Fig. 4. The UHPCFST was positioned on the fixed force transmission plate of the laboratory apparatus, and loading was applied to the UHPC through steel cushion blocks. The dimensions of the steel cushion blocks fell short of the steel tube inner diameter, and a level was utilized to ensure proper alignment. A pressure sensor was installed on the steel cushion blocks.
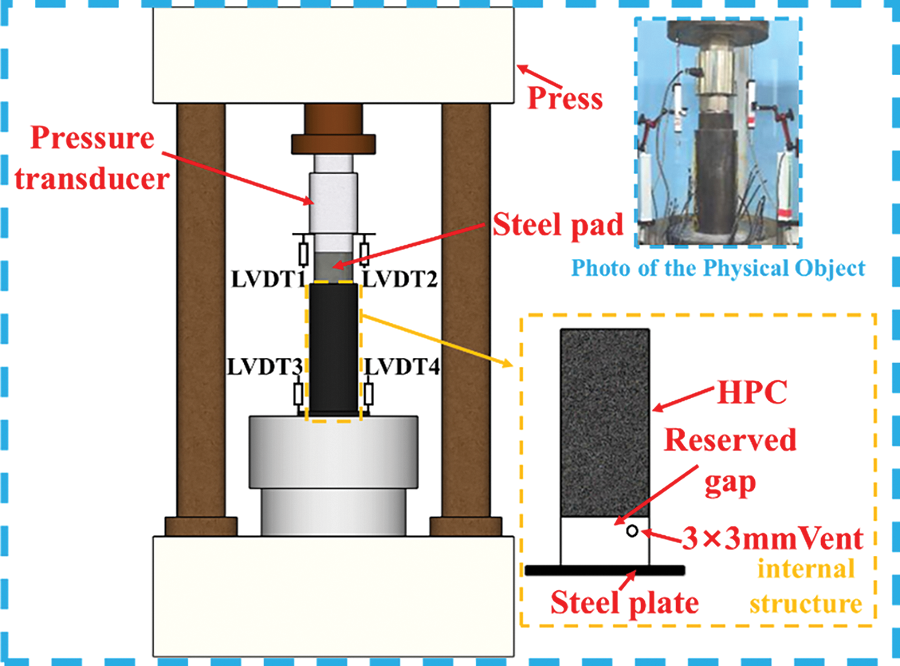
Figure 4: Push-out test setup
During the installation of the specimen, the end with the reserved gap was positioned downward, aligning it using the scale line on the lower loading plate. Prior to the formal loading process, thespecimen underwent pre-loading and equipment checks. This process included applying a load of 10 kN, stabilizing it, adjusting the top and bottom loading plates, steel cushion blocks, and the specimen for tight compaction, and checking the proper functioning of all equipment and strain gauges.
The empirical loading procedure utilized the displacement increment approach, characterized by a loading velocity of 0.2 mm per minute and a sampling rate of four hertz. During the entirety of the experimental procedure, a series of critical parameters were consistently observed and recorded. These encompassed the vertical load, the displacement of the steel cushion blocks and the strain experienced on the external surface of the steel tube, and the strain on the steel tube exterior.
2.4 Arrangement of Measuring System
Referencing Fig. 4, LVDTs 1 and 2 served to quantify the displacement within the UHPC contained within the steel tube, whereas LVDTs 3 and 4 were dedicated to tracking the displacement of the testing apparatus’s foundation. To accurately capture the deformation of the exterior wall of steel tube, employing resistive strain gauges measured both axial and circumferential strains. The circumferential strain gauges were placed at 1/4 intervals around the steel tube circumference, while the axial strain gauges were positioned at 1/6 intervals following the vertical axis of tube, which can be seen in Fig. 5.
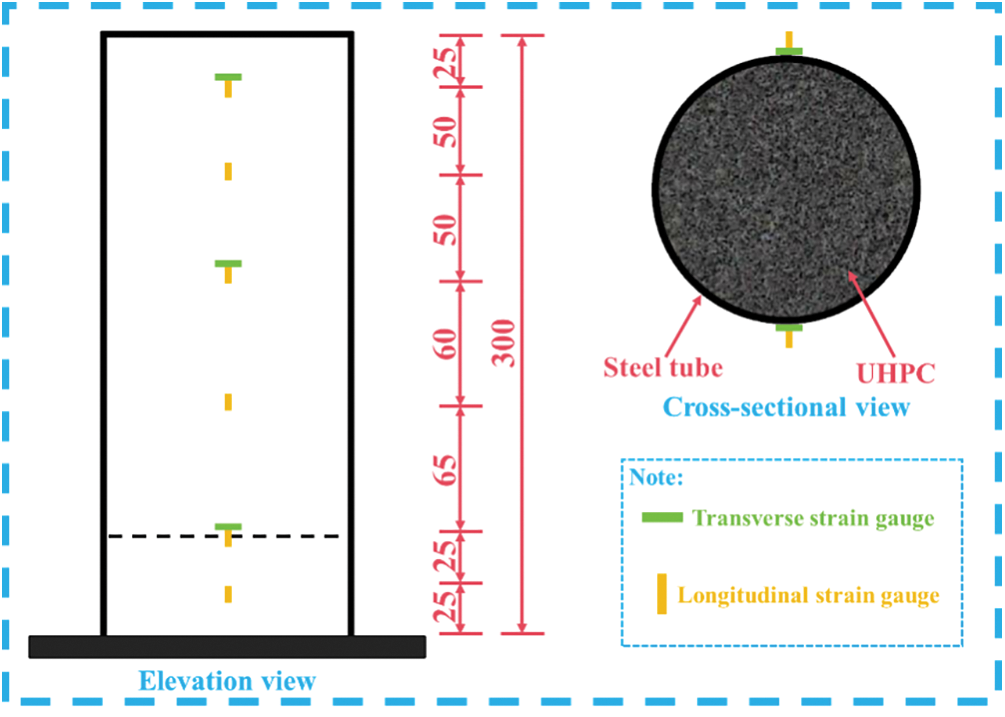
Figure 5: Strain measurement points arrangement (Length unit: mm)
3 Experimental Outcome and Discussion
At the preliminary stage of loading, the ultra-high performance concrete was tightly bonded to the steel tube wall, showing no obvious signs of damage. At the specimen’s end, slight damage to the chemical bond caused by UHPC and steel tube wall led to minor loosening. Upon incrementing the applied load to 75 kN, the steel cushion block in the upper part of the UHPCFST slightly sank into the steel tube. As the load approached its maximum threshold, a distinct grinding noise was audible at the interfacial area shared by UHPC and steel. Throughout the entire loading sequence, the surface of the steel tube exhibited no signs of alteration, and the UHPC material contained within the tube maintained its integrity, as illustrated in Fig. 6.
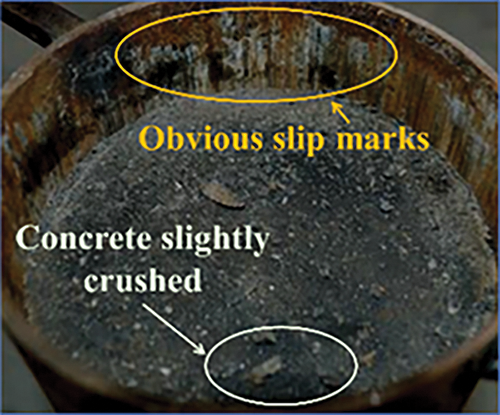
Figure 6: Specimen failure mode diagram
3.2 Axial Load-Bond Slip Curves
Based on the observations from Fig. 7, the UHPCFST specimens maximal slip measured in the experiment did not exceed 40 mm, and the load-slip curves all demonstrated a similar trend of displacement growth.
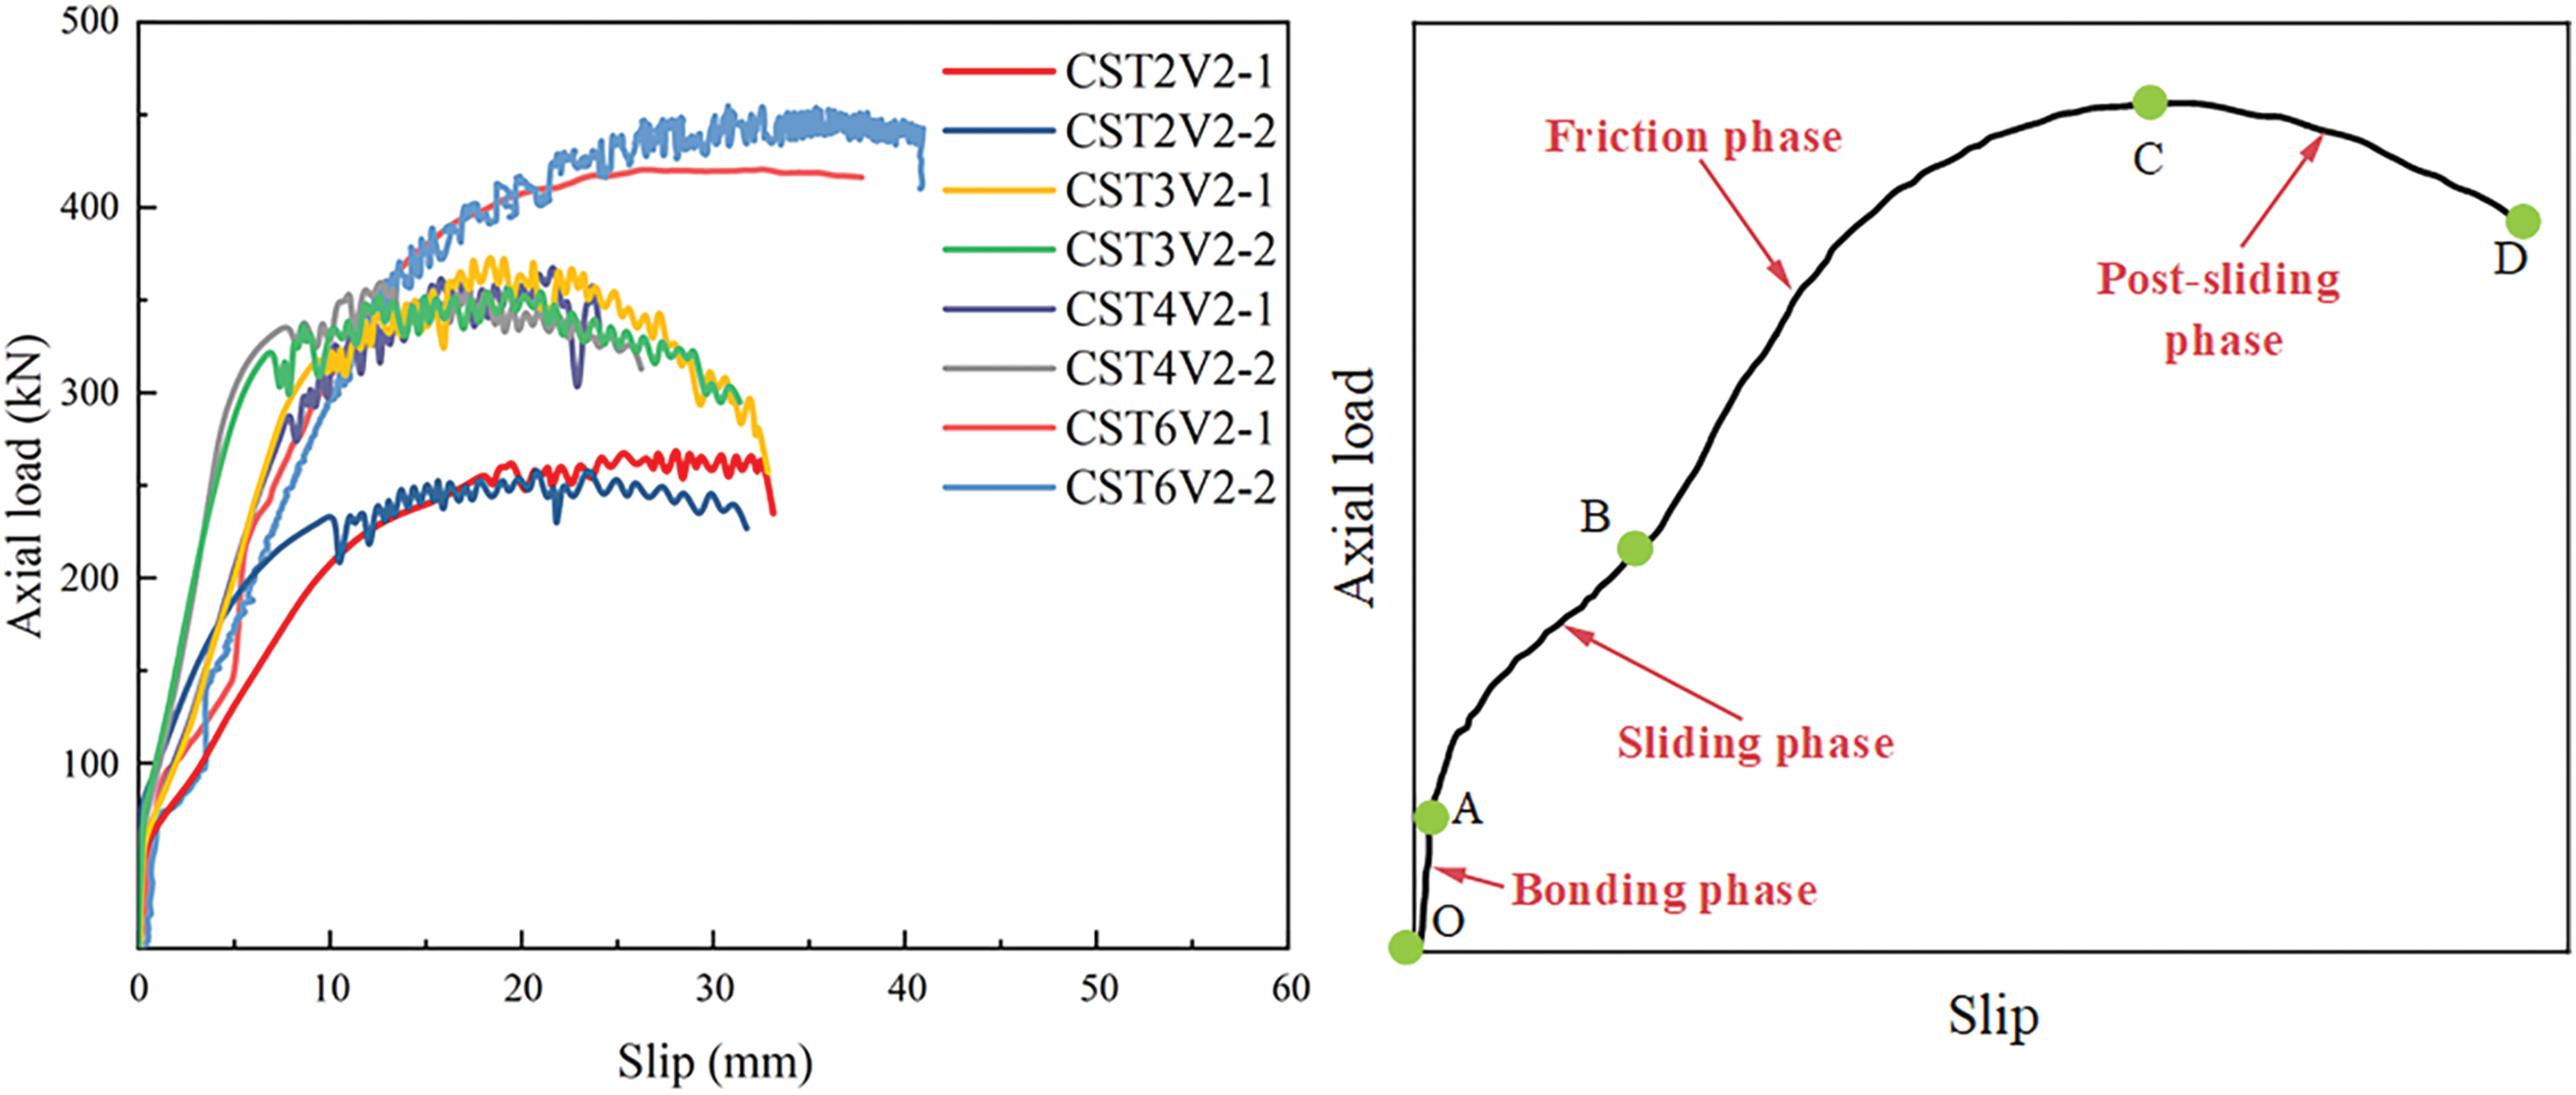
Figure 7: Axial load-bond slip curves for different steel tube wall thicknesses
Through a comprehensive analysis of the development process of the interfacial region shared by ordinary concrete and steel tube and the growth patterns of two types of load-slip curves, we have subdivided the development process of the UHPCFST interface into four steps: the bonding stage, the sliding stage, the friction resistance stage, and the post-sliding stage.
During the initial bonding phase (O–A phase), there was no discernible displacement between UHPC and the steel tube upon load application. Initially, the chemical bonding force was paramount. As loading increased progressively, a subtle slip manifested at the interface of steel tube and UHPC, altering the chemical cementation. Concurrently, mechanical interaction and friction forces started influencing the interaction. When the curve reached its initial peak or turning point, the chemical bonding force was fully lost, leading to an accelerated rate of deformation. At this stage, the interfacial bonding was primarily governed by friction and mechanical occlusion forces.
During the sliding phase (A–B phase), as loading persists, the load-slip curve exhibited a secondary ascent, featuring an initial slope rise followed by decline. This occurrence was partly attributed to the radial deformation of UHPC under the vertical force, incrementally boosting the normal pressure at the interfacial region shared by UHPC and steel. Concurrently, the friction zone expanded, resulting in a sequential enhancement of the interface’s strength.
When the load exceeds the load corresponding to Point B, it transitioned into the friction resistance stage. During this stage, as the chemical bonding force decreased, a gradual increase in mechanical occlusion and friction force occurred at the interface. This was reflected in the gradual decrease of the slope of the curve, although it was still in an upward trend until Point C. When the curve reached Point C, the friction force reached its maximum, and the curve exhibited a peak point.
In the post-sliding stage (C–D phase), the interface completely lost its chemical bonding force, and UHPC underwent overall rigid body sliding relative to the steel tube. The wear of the UHPC matrix at the interface caused a gradual decrease in friction force and mechanical occlusion force, manifesting as a decline in the curve.
Notably, while specimen CST6V2 stands apart, all other samples demonstrated a post-sliding phase. Indeed, the sliding displacement of CST6V2 markedly exceeded its counterparts, hinting that enhancing the tube wall thickness might substantially elevate the maximum bond failure load and the sliding displacement.
Fig. 8 illustrates the load-slip curves associated with steel fiber volumetric ratio of 1%, 2%, and 3%, featuring a steel tube wall thickness of 2.5 mm. It is evident that the introduction of steel fibers significantly enhances the frictional force, resulting in a marked increase in the maximum bond failure load, which directly corresponds to the elevated amount of steel fibers utilized.
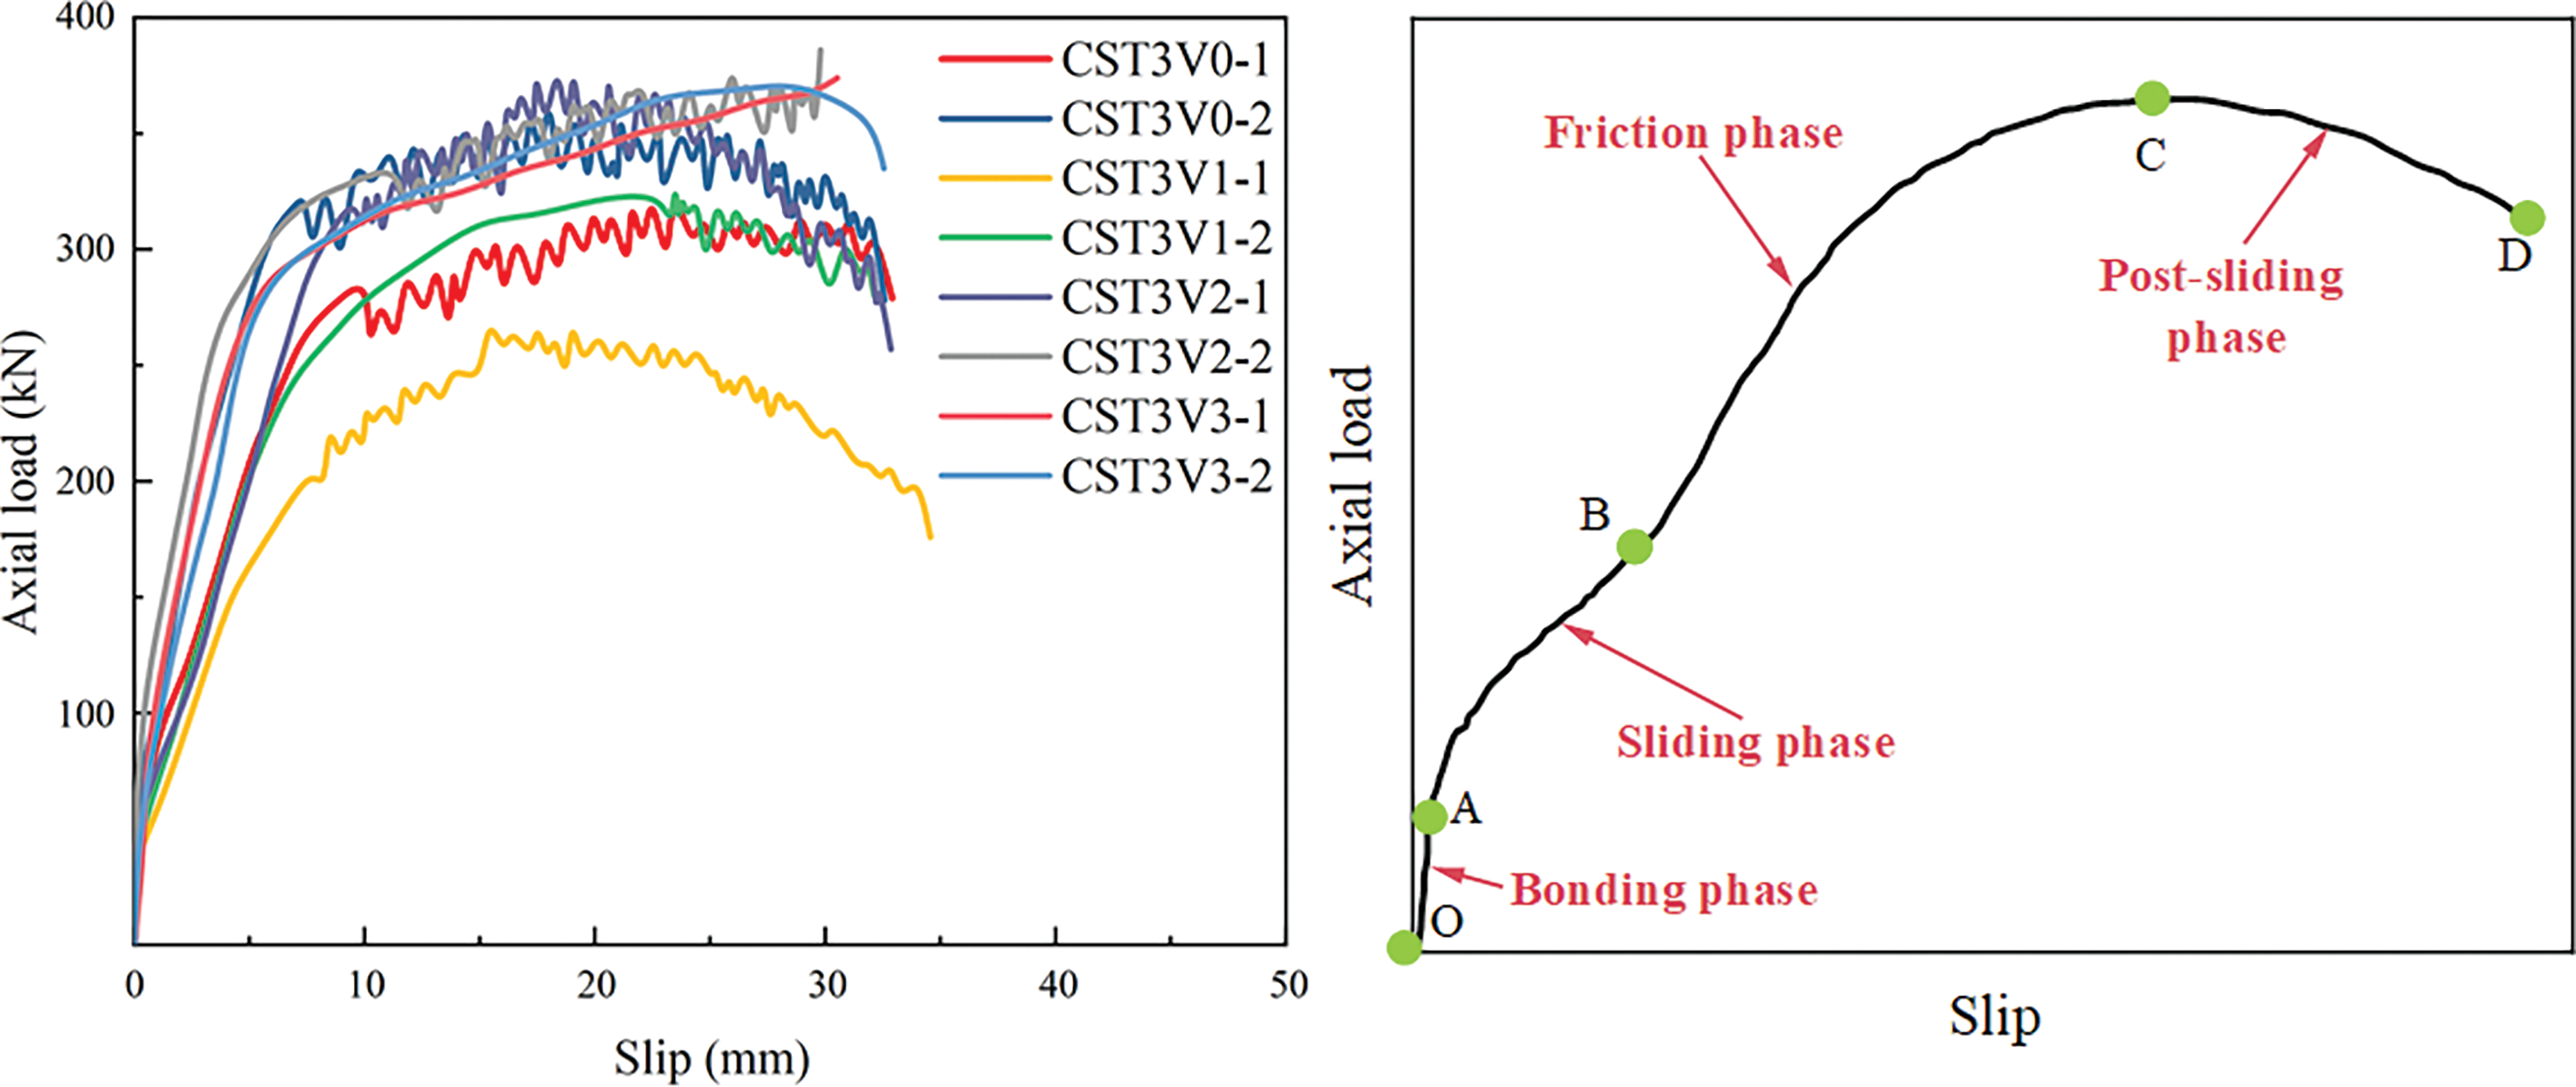
Figure 8: Axial load-bond slip curves for different steel fiber volumetric ratio
In comparison to the studies by Zhou and Li [30,31], the parameters are presented in Table 5. Notwithstanding the reduced bond interface area in UHPCFST compared to NCFST, the interface load-bearing capacity of UHPCFST exhibits a pronounced superiority over NCFST, as illustrated in Fig. 9.
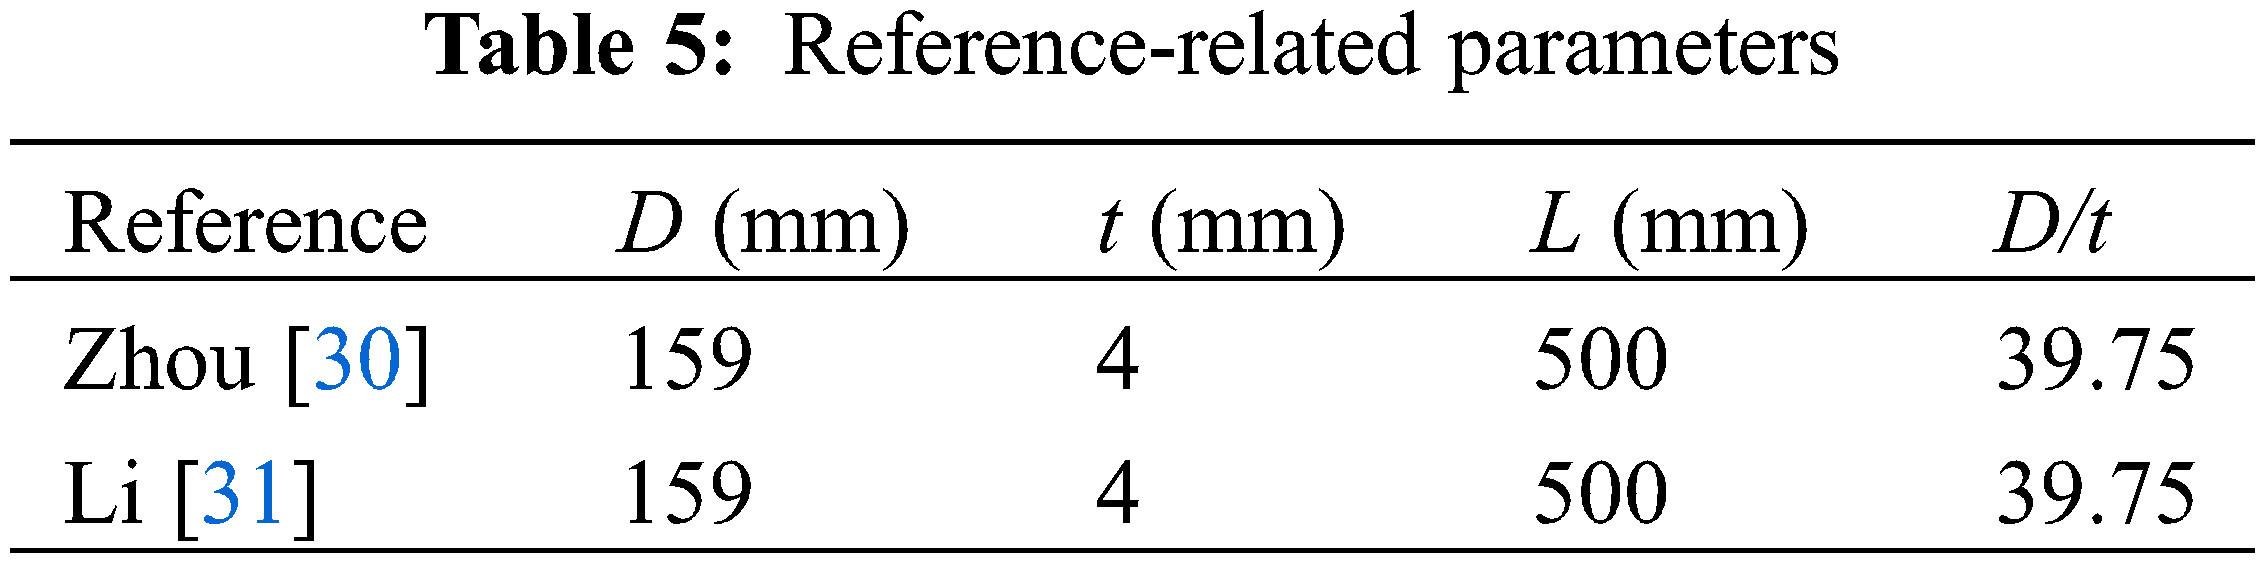
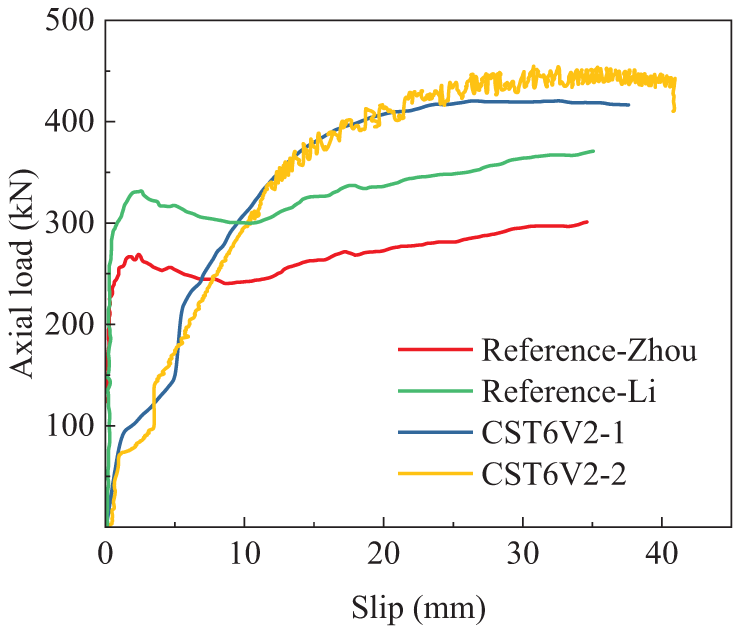
Figure 9: Axial load-bond slip curves for different steel fiber volumetric ratio
3.3 Steel Tube-UHPC Interface Bond Strength
The bond failure load, denoted as Np, serves as a pivotal metric for evaluating the strength at which a bond might fail. To accommodate various curve profiles, it’s essential to establish Np appropriately. In real-world engineering applications, permitting excessively high slip values is generally undesirable. Consequently, the load that aligns with the curve’s initial inflection point or its apex is designated as Np [32].
In the process of specimen production, initial flaws will inevitably arise from insufficient vibration, imperfect curing practices, and the unprofessionalism of the operators. The initial flaws of the UHPCFST production quality significantly impact the interfacial condition. Traditionally, assessing bond strength variations across different locations has been challenging due to conventional testing methodologies’ limitations. Consequently, it’s commonly believed that the bond strength is evenly distributed throughout the interfacial area shared by steel and UHPC. The quantitative assessment of the interface bond strength for UHPCFST samples is achieved via the utilization of the following equation:
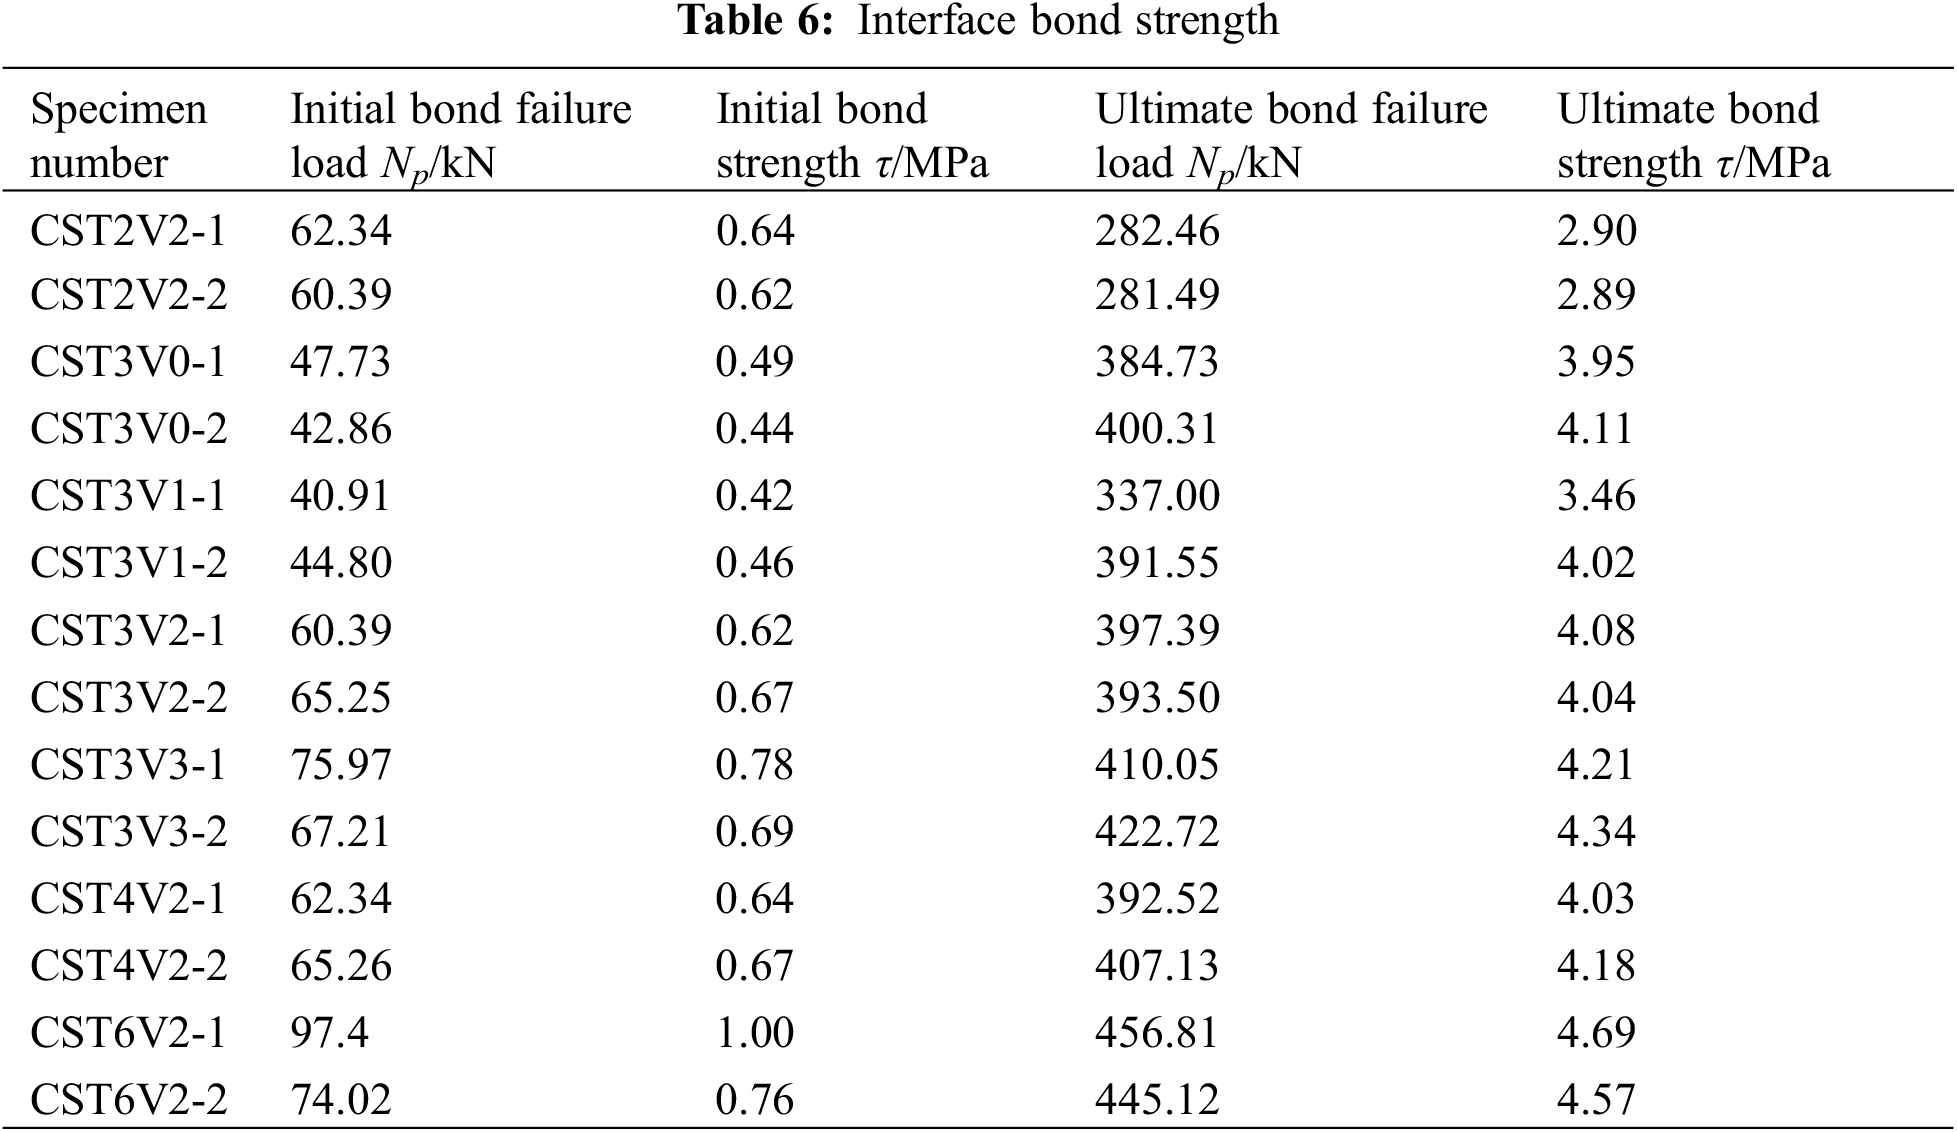
In equation, τ represents the interface bonding strength, Np denotes the bond failure load, di indicates the circular steel tube inner diameter, l refers to the length of bonding area along the axial direction of the interface. The computational outcome was presented in Table 6.
3.3.1 Effect of Steel Tube Thickness
Under axial pressure, UHPC underwent radial expansion deformation. At this time, the steel tube exerted constraints to limit its deformation. Notably, the steel tube wall thickness significantly influenced its constraining ability. Specifically, a thicker wall resulted in a stronger constraining effect. When relative movement happened between the steel tube and UHPC, friction arose at their contact interface. This frictional force was strongly associated with the physical situation of the bonding interface and the normal pressure it experienced. Based on this, the augmentation of the relative displacement of UHPC and steel yielded a corresponding enhancement of friction force within the interfacial area.
Figs. 10 and 11 reveal distinct patterns in the steel tube wall thickness influence on the initial and ultimate UHPC bond strengths. Specifically, for steel tubes with a wall thickness below 3 mm, the initial bonding strength showed insignificant fluctuation, irrespective of the differing thicknesses of the steel tubes combined with UHPC. Nevertheless, as the wall thickness increased, the ultimate bond strength demonstrated a noticeable increase, which appeared to follow a nearly linear relationship.
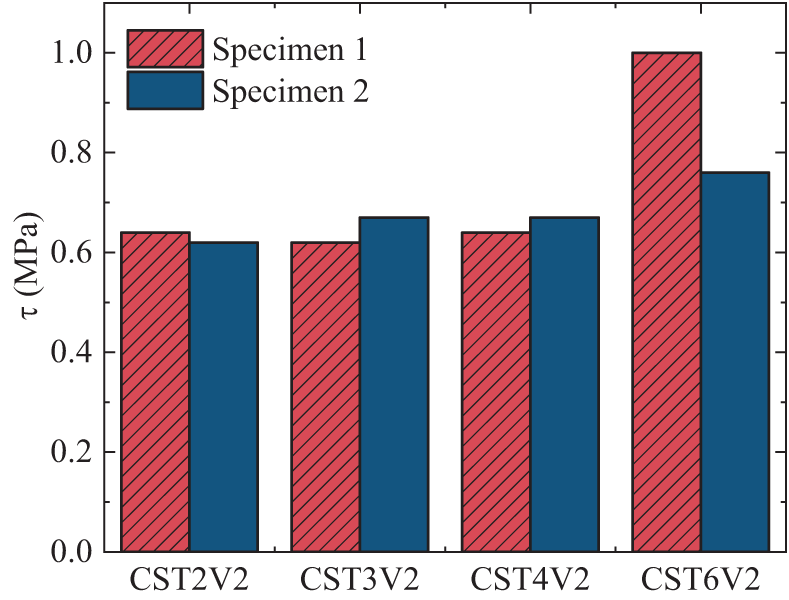
Figure 10: Initial bond strength of different steel tube wall thicknesses
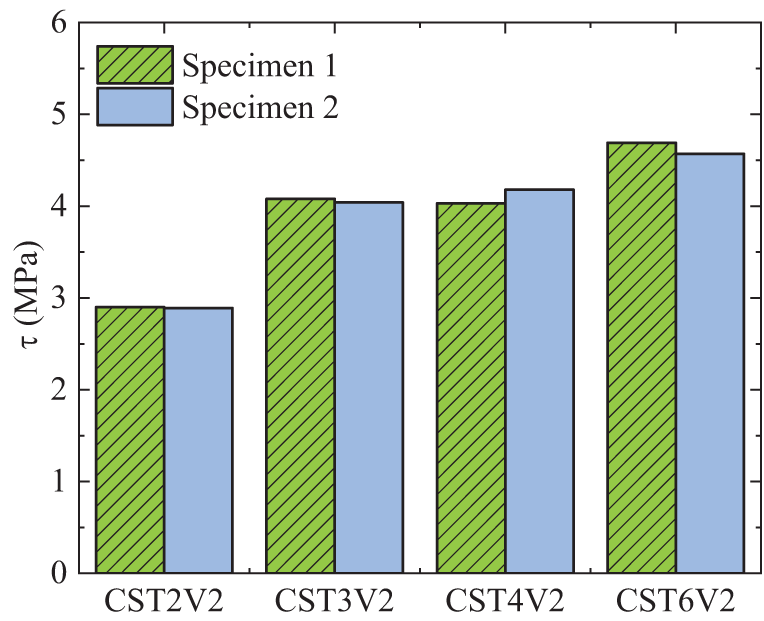
Figure 11: Ultimate bond strength of different steel tube wall thicknesses
Overall, the affect of tube thickness on the initial bonding strength is relatively minor, whereas it assumes greater significance in shaping the ultimate bonding strength. This phenomenon can be clarified by the observation that, at the preliminary phase of loading, the interaction caused by UHPC and steel primarily relies on chemical bonding and mechanical interlock. Considering the insignificant impact of minor fluctuations in the steel tube’s wall thickness on these forces, this variation does not notably affect the initial bond strength, its influence on initial bond strength is not pronounced. However, in the final phase of the loading process, the interface interaction gradually shifts to being dominated by friction and mechanical interlock. The ultimate bond strength is notably influenced by the steel tube’s wall thickness, which amplifies the friction force at the interfacial area shared by steel tube and UHPC. As the steel tube’s thickness escalates, its confinement effect on the UHPC intensifies, leading to a pronounced enhancement in this friction force. Thus, the steel tube’s wall thickness is the crucial factor in determining the ultimate bond strength.
3.3.2 Effect of Steel Fiber Volumetric Ratio
Fig. 12 elucidates the correlation between the initial interfacial adhesion strength and the steel fiber volumetric ratio with eight specimens. The analysis is performed under standardized conditions for the thickness of steel tubing wall and curing temperature. As depicted in Fig. 12, when the steel fiber volumetric ratio escalated from 0% to 1%, there was a notable decrease of 5.3% in bonding strength. By incrementing the fiber volumetric ratio from one percent to three percent, there was a notable rise in bonding strength, amounting roughly to a sixty-seven percent enhancement.
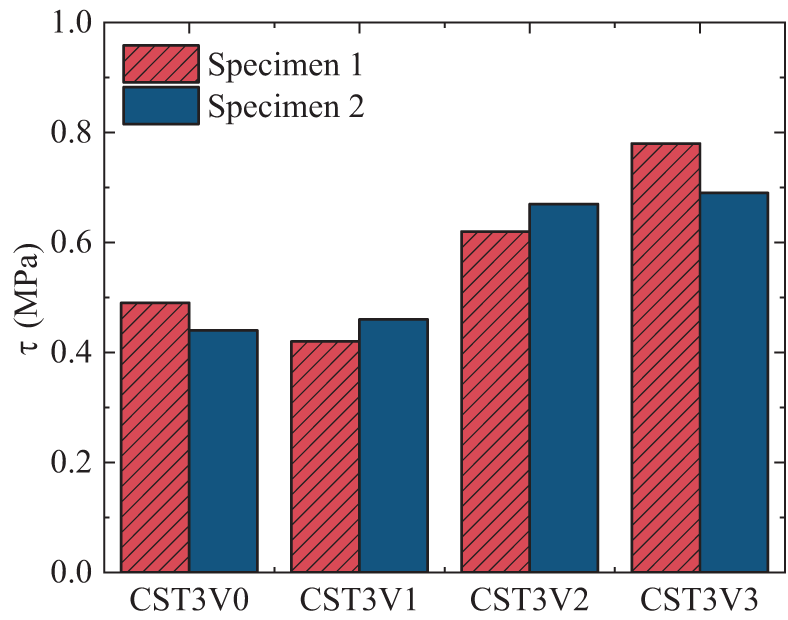
Figure 12: Initial bond strength of different steel fiber volumetric ratio
As the fiber volumetric ratio increases from 0% to 1%, an initial diminution in bond strength occurs, mainly owed to the diminished chemical bonding at the steel tube-UHPC interface, brought about by the inclusion of a slight quantity of steel fibers. Moreover, the augmentation in interfacial friction, consequent upon this addition, was notably restrained, falling short of offsetting the loss of chemical bonding force.
Transitioning from a steel fiber volumetric ratio of 1% to 3%, the reduction in chemical bonding, affected by the steel fibers, is largely offset by an enhanced interfacial friction. This augmentation in friction is a consequence of the increased steel fiber content at the interfacial area shared by UHPC and steel tube. This led to a striking 67% escalation in the initial bonding capacity at the junction of UHPC and the steel tube.
Analyzing Fig. 13’s data, when the fiber volumetric ratio escalated to 1%, there was a reduction of 7.2% in the peak bonding capacity. Conversely, upon ascending volumetric ratio of fiber from 1% to 3%, the ultimate strength witnessed an enhancement of 14.3%. Notably, relative to the baseline bond strength, the impact of altering the steel fiber volumetric ratio seemed to have a less pronounced effect. This observation results from the fact that by the time the specimens reached peak load, the UHPC had already experienced significant slippage. At this stage, the augmentation in interfacial friction attributed to the increase in steel fiber volumetric ratio exhibited a comparatively constrained effect.
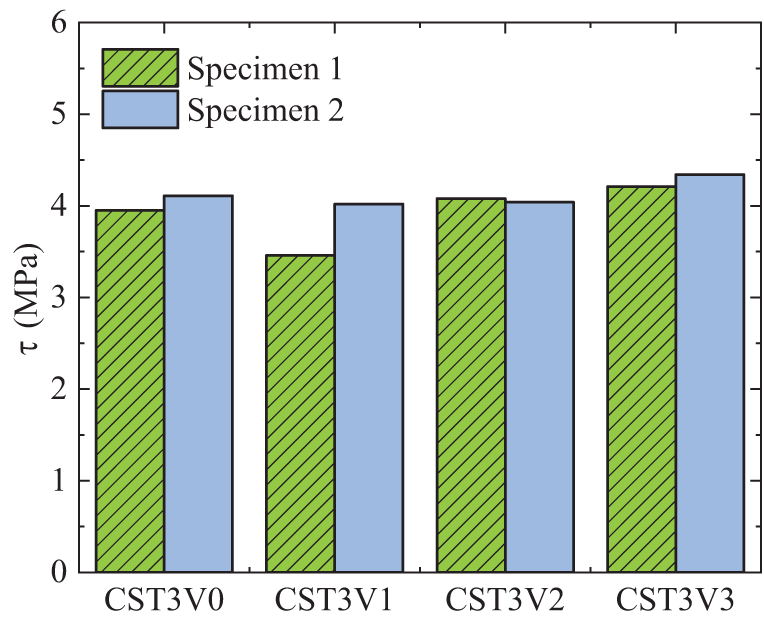
Figure 13: Ultimate bond strength of different steel fiber volumetric ratio
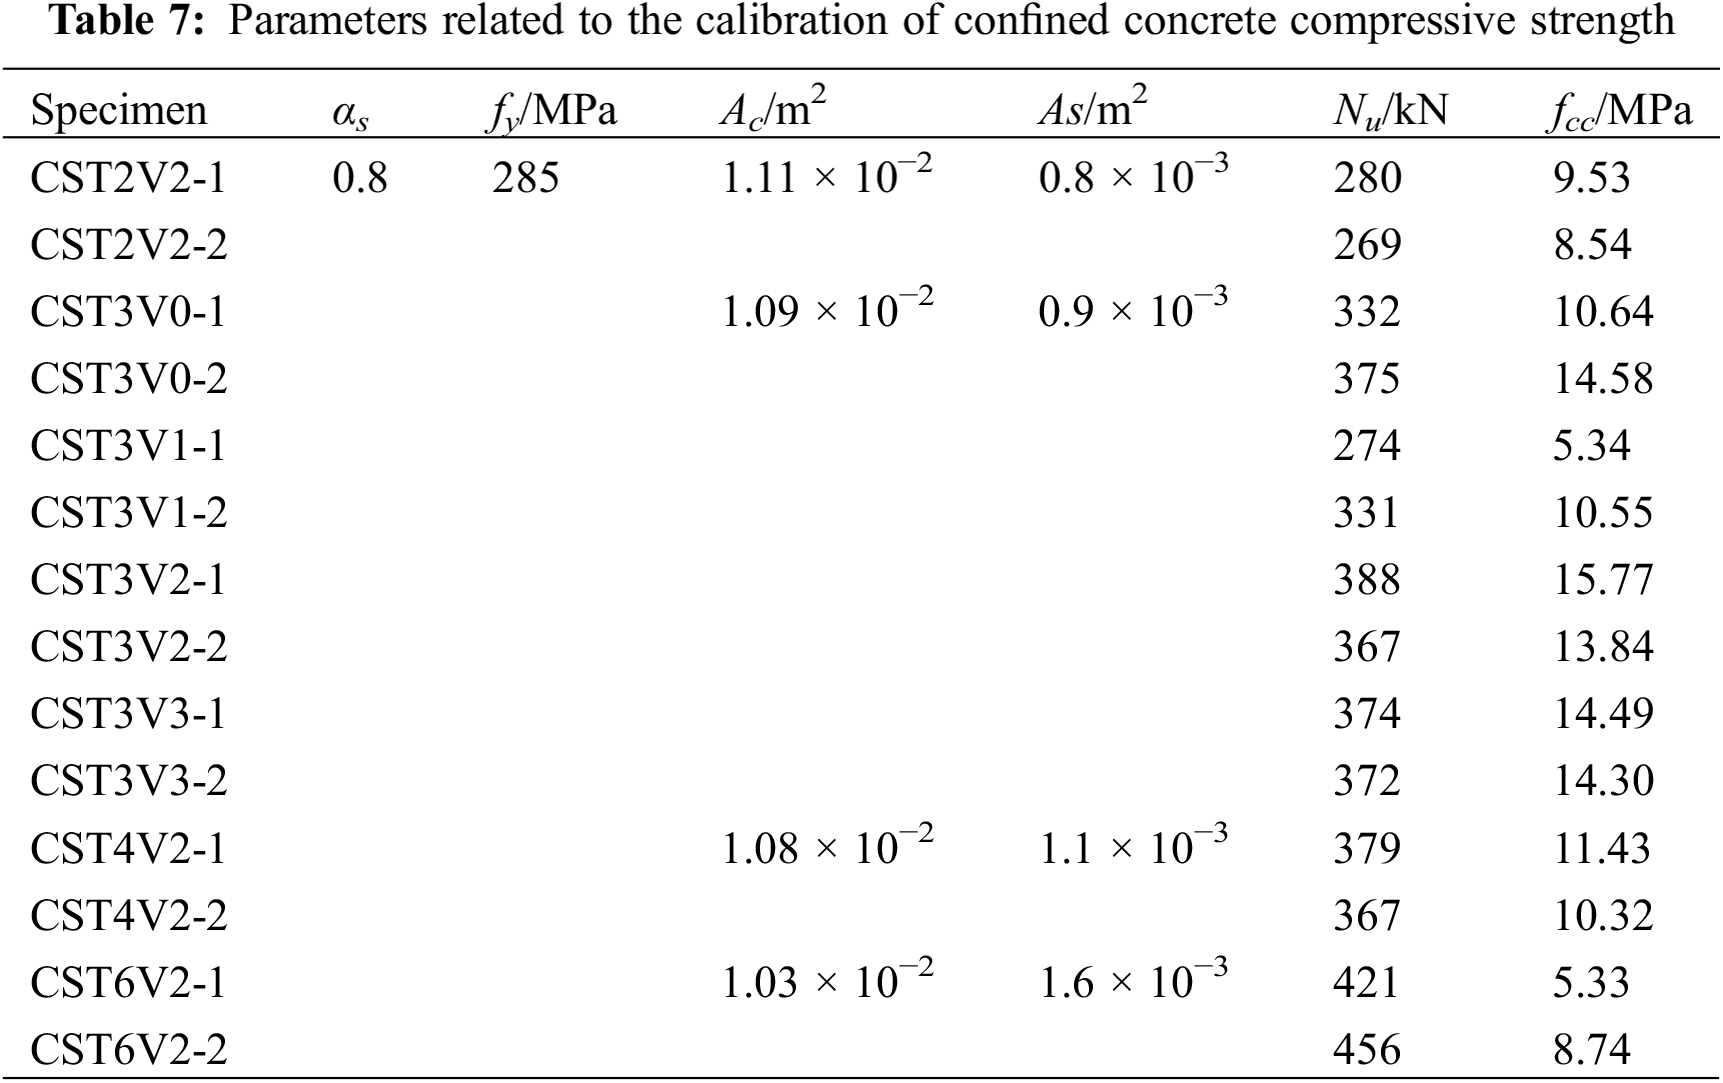
3.4 Calibration of Confined Concrete Compressive Strength
On the basis of antecedent research [32], the compressive strength of encased concrete in CFST is calibrated, and can be calculated as equation below:
The formula incorporates several key parameters: fcc, denoting compressive strength under the constrained condition; Nu, indicating the axial capacity of CFST; Ac signifies the cross-sectional area of the UHPC; αs, a corrective factor set at 0.8; fy, representing the yield strength of the steel; and As, which stands for the steel tube’s cross-sectional area, as detailed in Table 7.
A three-dimension (FE) model with the application of the plastic damage model was established to analyze the push-out phenomenon using the software ABAQUS [33].
4.1.1 Constitutive of Materials
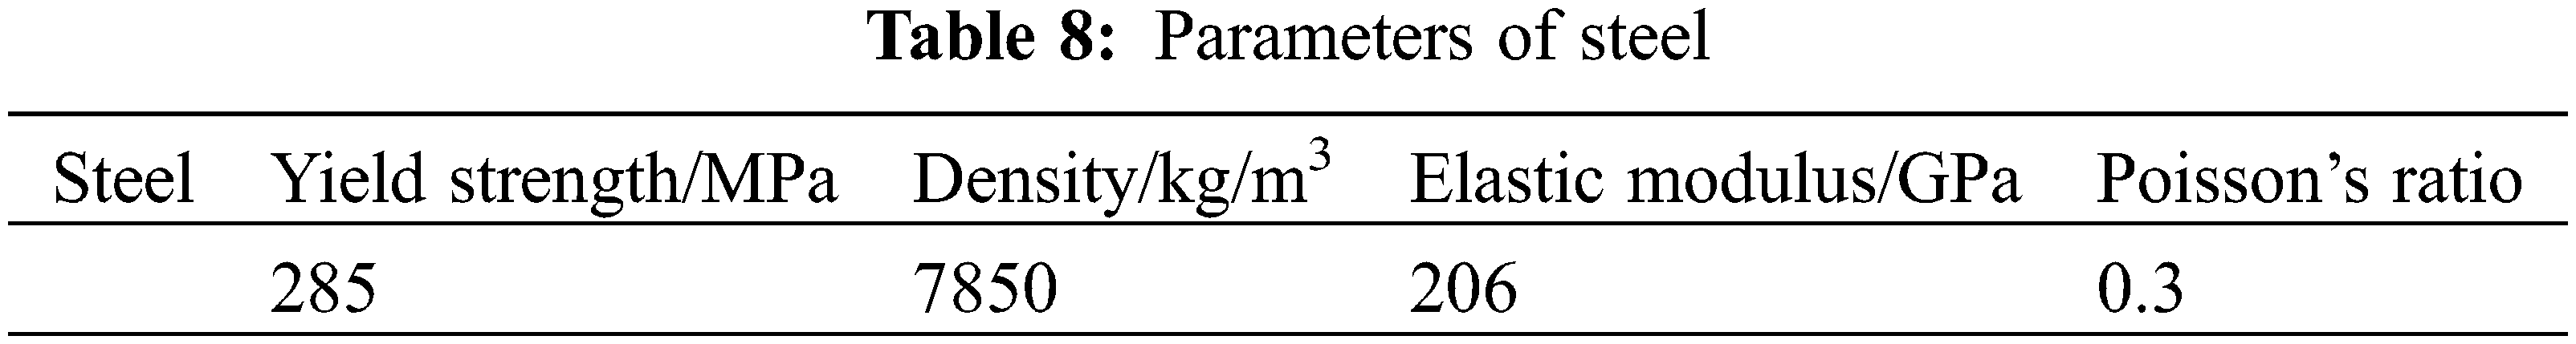
The application of the ideal elastic-plastic model and the plastic damage model were implemented on the constitutive relationship of UHPC and steel materials. According to test of materials, the parameters of steel was shown in Table 8. From the research of Xu et al. [34], quotient of biaxial ultimate compression divided by uniaxial ultimate compression fb0/fc0, eccentricity ε, dilation angle φ, constant stress ratio K and bonding coefficient μ were defined.
4.1.2 Stee Tube-UHPC Interface
In the FE model, the bonding behavior at steel tube-UHPC interface consisted of chemical adhesion, mechanical force and friction, which were simulated by application of cohesive zone model, initial imperfection model and Coulomb interfacial friction.
Cohesive zone model was applied using at interface shared with steel tube and UHPC to simulate the debonding behavior. In ABAQUS, there are two available options: surface-based cohesive behavior and cohesive element [33]. Generally speaking, the surface-based cohesive behavior is the better method to simulate the bonding behavior, but ABAQUS2021 natively includes a zero-thickness cohesive element plugin, enabling the simulation of adhesive layers without physical thickness. This feature is particularly suited for modeling curved surfaces and surfaces with varying heights, offering increased accuracy with the application of initial imperfection. Consequently, cohesive element was selected for purpose of simulation. The stress and fracture energy of cohesive elements would change based on predefined tension displacement relationship. When the stress decreased to zero, the cohesive elements failed. The setting of steel tube-UHPC interface was shown in Fig. 14. In the process of detachment between steel tube elements and UHPC elements, the distance between S1 and S2 was getting larger, which caused the enhancement of cohesive element stress. When the S1 and S2 were completely separated, the cohesive element would fully failed [35]. Every node in the steel tube-cohesive and cohesive-UHPC had three stages, namely linear elasticity, initial damage and failure, which were simulated by “traction-separation” in ABAQUS. The linear elastic constitutive model could be presented using following matrix:
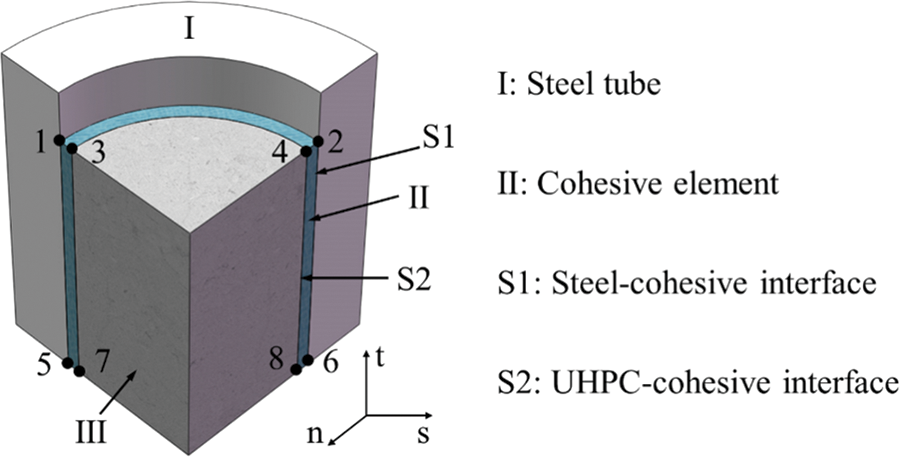
Figure 14: Setting of interface shared by UHPC and steel tube
where σn, σs and σt is normal, circumferential and axial stress components; δn, δs and δt is normal, circumferential and axial displacement components; [K] is the matrix of elastic stiffness; {δ} is the column vector of displacement. The value of σ and K were supposed to be determined based on test results. The stress was input as 20%–40% of bonding strength.
The interface constitutive model changed when either the stress or strain achieved the specified initial failure criterion. The max damage criterion was applied to simulate the interface of UHPCFST, as shown in the following expression:
After the bonding capacity of the single point at interface reached the initial failure strength, the stiffness began to decrease. The bonding behavior failed at the point where the bonding capacity attained zero. In this study, “effective separation” was applied to describe the development of damage, as shown in Fig. 15. The interfacial failure during the experimental process developed progressively, the consideration of the plastic behavior of the interface was necessary during this failure progression. As the steel tube-UHPC interface gradually degraded, the bonding behavior progressively deteriorated, resulting in a decline of the stiffness. This degradation is demonstrated in the traction-separation curves, where the gradient of the curve undergoes a discernible reduction as the amount of slip escalates. The linear mode is incapable of representing such a failure mode. As a result, the exponential mode was applied in the FEM. δ0m and δfm was displacement of initial damage and failure damage, which value were supposed to be determined following the load-displacement curve of test. After the determination of σn0, σs0, σt0, Knn, Kss and Ktt, δ0m could be defined.
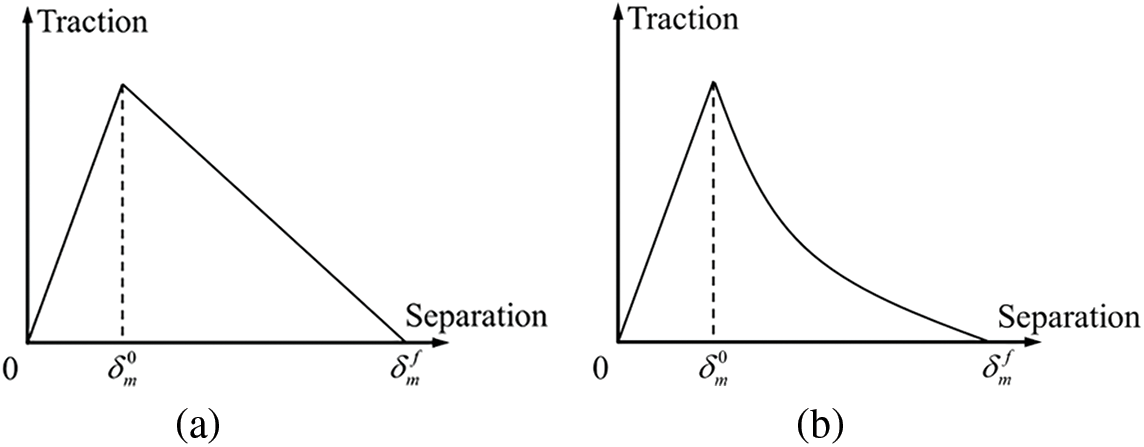
Figure 15: Patterns of destruction development: (a) linear mode; (b) exponential mode
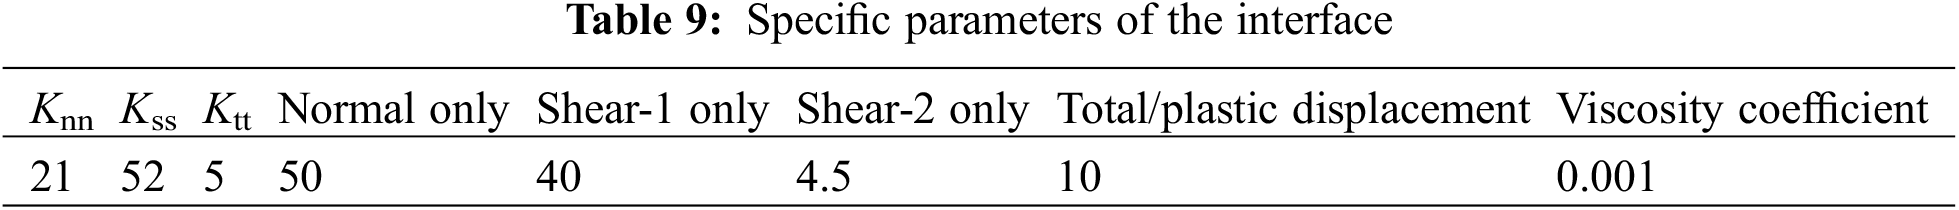
During the definition of the interface constitutive model, the stiffness definitions in the three directions are crucial. Specifically, Knn represents the normal stiffness, while Kss and Ktt represent the two mutually orthogonal tangential stiffness. For Eligible Slave Nodes options, the Only Slave Nodes initially in contact was chosen to specify the initial bonded contact conditions. As for the damage behavior, damage evolution and stabilization were specified. Maximal nominal stress was selected to formulate a damage initiation criterion that relies on the peak nominal stress criterion as the basis for cohesive elements, delineating the threshold at which damage commences. The displacement and the linear mode were defined as the type and softening of evolution. In addition, the viscosity coefficient was defined as 0.001. The specific parameters of interface were shown in Table 9.
The cohesive zone model, initial defect model and Coulomb friction model within the plastic damage finite element can well simulate the interaction at interface, but cannot effectively simulate the phenomenon of RPC detachment. So, for the purpose of representing the detachment, the cohesive elements were inserted between two elements. Upon failure of the cohesive force, the cohesive element slide and became wedged between the elements, which closely resembled the interface chipping and peeling observed during the sliding process of UHPCFST.
The cohesive element can control the bonding effect by setting element face or contact pairs, and the modeling method is similar to that of the plastic damage model. However, to achieve the batch insertion of cohesive elements into the entire model, it is necessary to use Inp file for input. This is accomplished through the secondary development of ABAQUS utilizing Python language, which enabled the embedding of cohesive elements between RPC elements. Upon the failure of these cohesive elements, cracks propagate freely along the element edges [33]. From Fig. 16, the four nodes (1-2-3-4) of the UHPC element (C3D8R) were selected, resulting in the generation of nodes from A to B. Then, four cohesive elements (COH3D8) with a thickness of 0.01 mm were established.
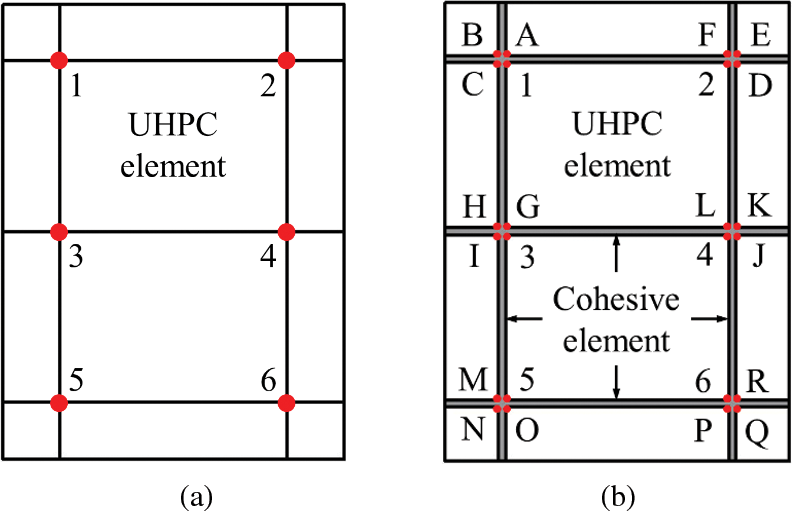
Figure 16: Generation method of cohesive element with duplication nodes from RPC element: (a) UHPC element; (b) UHPC-cohesive element
In summary, the numerical model was conducted, as illustrated in Fig. 17.
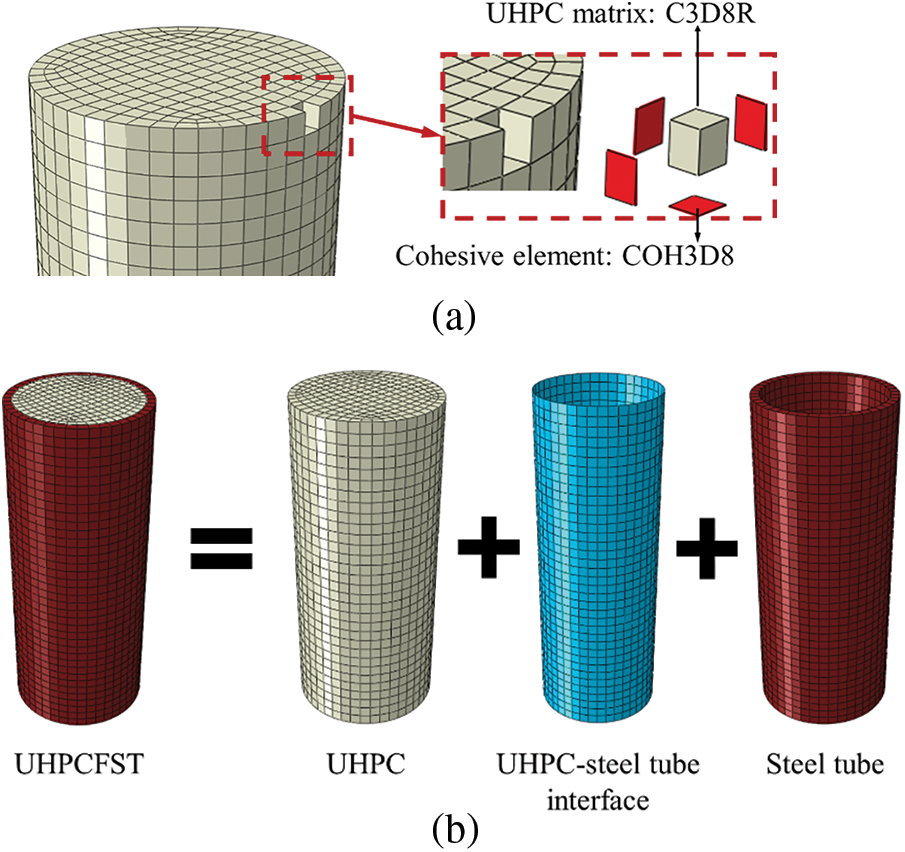
Figure 17: Model of UHPCFST column: (a) matrix and cohesive element setting of UHPC; (b) modeling process of UHPCFST
4.2.1 Comparison of FE Simulation and Test Results
From Figs. 18 and 19, the FE model’s validation can be examined by contrasting the curves of relationship between load and displacement from numerical simulation and experimental results.
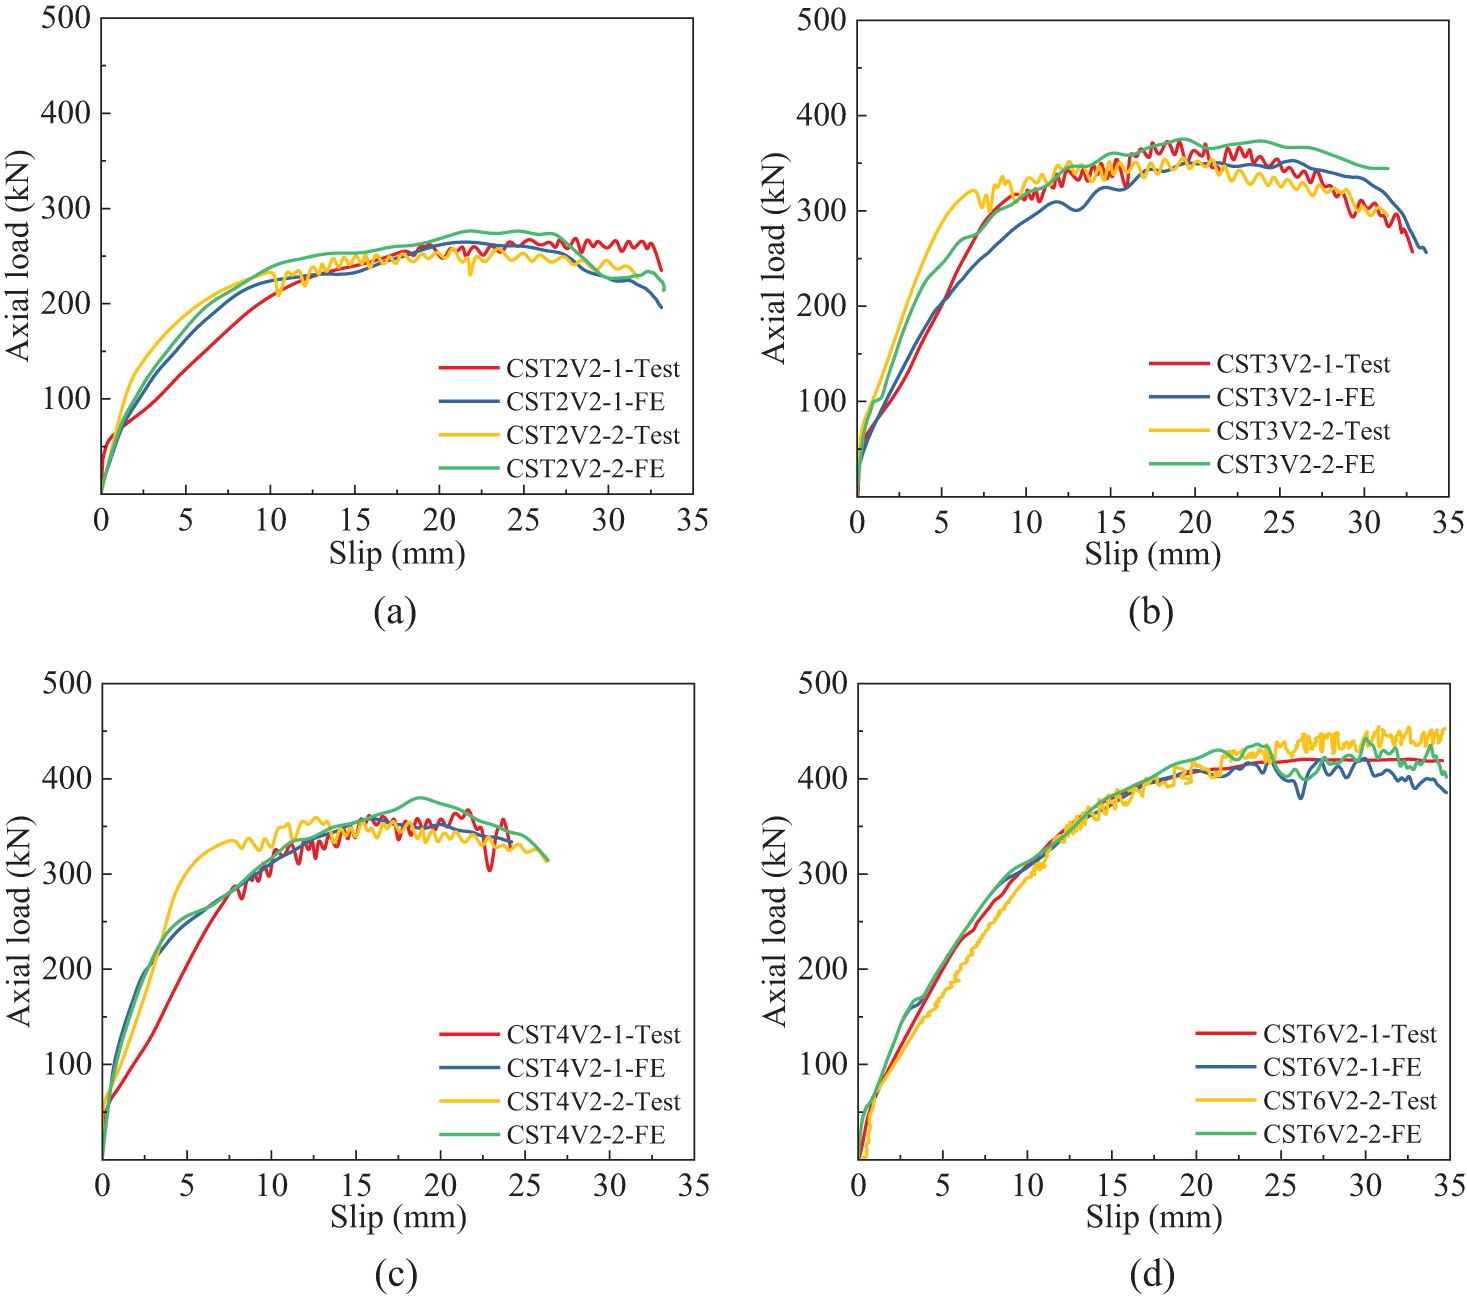
Figure 18: Contrast of load-displacement curves for (a) CST2V2; (b) CST3V2; (c) CST4V2; (d) CST6V2
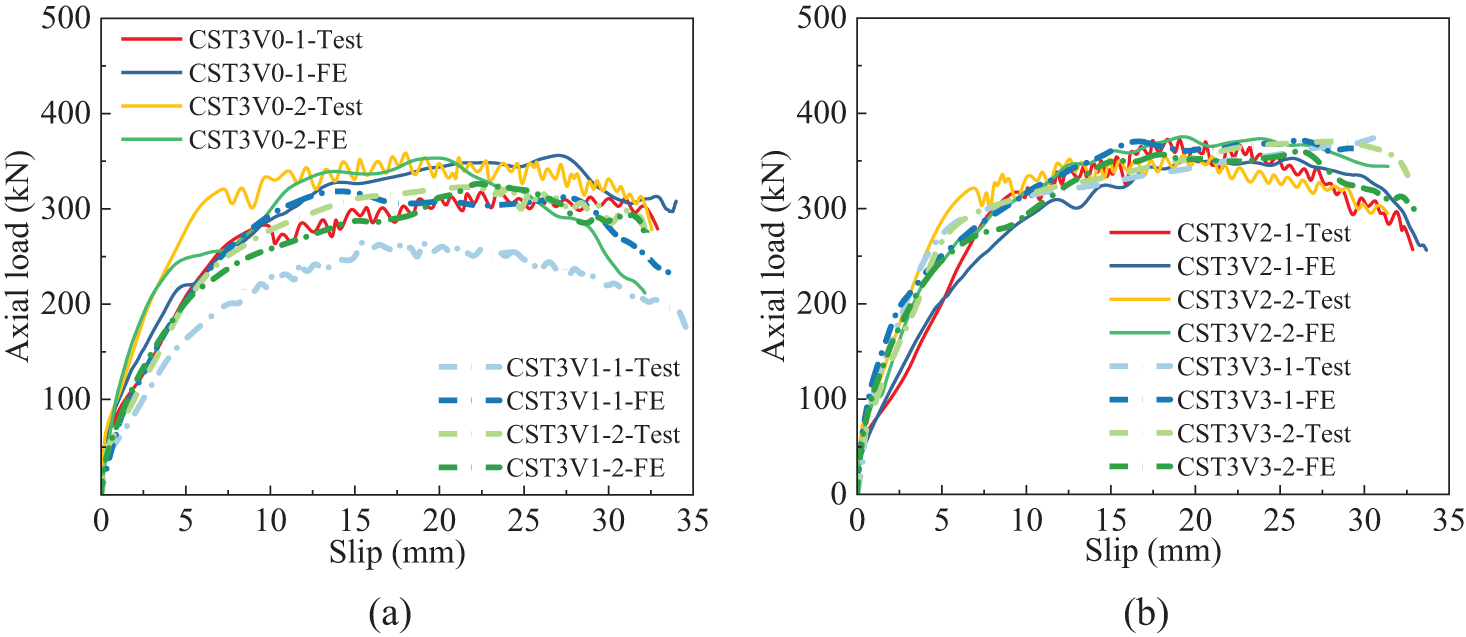
Figure 19: Contrast of load-displacement curves for CST3 series: (a) CST3V0 and CST3V1; (b) CST3V2 and CST3V3
From Fig. 18, the curves showed the relationship of displacement and load of FE simulation were closely aligned with the experimental results. Compared with test project, FE simulation was more idealistic and involved fewer factors that can affect the results. Therefore, the curves of test exhibited fluctuations in the later stage, whereas the results of FE simulation were more smooth. For both yield strength and ultimate strength, the discrepancy of the experimental results and numerical simulations was within a tolerance of less than 5%. Except for CST4 series, the initial stiffness in the FE simulation of the other series demonstrated a satisfactory correspondence with the experimental results. This is because the specimens in CST4 series were not sufficiently vibrated during production, resulting in inadequate bonding between UHPC and steel tube, which led to insufficient stiffness of the specimens. With the enhancement of thickness, the initial stiffness underwent imperceptible fluctuations, but there was a significant enhancement in both yield strength and ultimate strength. Overall, the initial stiffness, yield strength and ultimate strength showed good agreement between FE simulation and test project, indicating that the model can well represent the test results.
From Fig. 19, setting thickness as a fixed parameter, comparison was conducted among the specimens within CST3 series. With the volumetric proportion of steel fiber enhancement, both strength and ductility of the specimens improved (specimen CST3V1-1 encountered an error during the test and not be included in the comparative analysis). Comparing the curve distributions of Figs. 19a,b, it was observed that the dispersion between the two series of curves in (a) is larger than that in (b). The contribution of steel fibers content on specimens was restricted, and the enhancement effect became insignificant when content increased from 2% to 3%.
4.2.2 Influence of Length of Steel Tube
For the purpose of analyzing the impact of length of steel tube on bearing capacity under axial compressive load, a series of FE models featuring diverse lengths of steel tube were established. Taking CST3V2-300 as an example, the “300” means the length of steel tube is 300 mm. From the Fig. 20, increasing the length of specimens can provide more bonding area, thereby enhancing its bearing capacity under axial compressive load. Additionally, the specimen featuring a 400 mm steel tube length showed a buckling phenomenon in the steel tube, yielding a marked reduction in the bearing capacity when the axial load achieved about 246 kN. Similarly, when the length of specimen was ascended to 450 mm, the buckling phenomenon occurred earlier. Generally speaking, the increase in length can enlarge the bonding area while simultaneously increasing the slenderness ratio of the specimen. As a result, the bonding capacity under axial compressive force enhanced with the increasing length of steel tube, the degree of increase is limited, due to the influence of buckling.
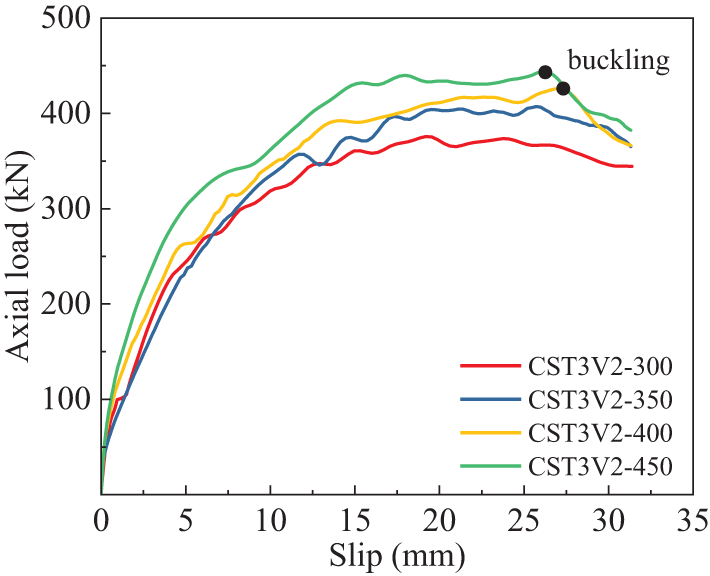
Figure 20: Comparison of specimens with different length of steel tube
This study investigates the bond performance and influencing factors at the interface of UHPCFST through push-out tests. Furthermore, a series of models have been established based on application of cohesive elements, which were applied to analyze the behavior of interface shared by UHPC and steel tube. Compared with the experimental results, numerical simulation showed a satisfactory correspondence of load-displacement curves. A parametric analysis was implemented by FE simulation. The conclusions of the study can be presented below:
1. From the experimental research and data analysis, the thickness of steel tubes is the emphasis in determining the ultimate bond strength of the interfacial area shared by UHPC and steel. With the enhancement of steel thickness, a nearly linear enhancement of the ultimate bonding strength was shown, while the initial bond strength changes only slightly. In essence, the steel tube thickness has a more pronounced effect in enhancing interface friction under high load conditions.
2. A complex relationship exists in how the steel fiber volumetric ratio intricately influenced the interfacial bond strength. In the ascending process of fiber volumetric ratio, the strength of bond initially rose and then fell, while the ultimate bond strength rose continuously. It is primarily accounts for the trend of strength that the weakening of chemical bonding behavior and the enhancement of frictional force by the steel fibers at the interface.
3. The experimental results demonstrate that optimizing the wall thickness of steel tube and steel fiber content can effectively enhance the overall bond performance at the UHPC-steel interface in high-strength applications, providing valuable reference for engineering design.
4. Modeling with the cohesive element, the proposed FE model can well represent the experimental phenomenon. With the increasing length of steel tube, the bearing capacity under axial compressive load correspondingly enhances. However, the magnitude of this augmentation is constrained by the emergence of buckling phenomena.
Acknowledgement: Specially thanks the professional technical support to the study by the members of our research group, who have provided a stimulating and collaborative environment.
Funding Statement: The work described in this paper is supported by grants from the Natural Science Foundation of Fujian Province (2021J011062); Minjiang Scholars Funding (GY-633Z21067).
Author Contributions: The authors confirm contribution to the paper as follows: study conception: Ruikun Xu, Jiu Li, Wenjie Li, Wei Zhang; data collection: Ruikun Xu, Jiu Li, Wejie Li; analysis and interpretation of results: Ruikun Xu, Jiu Li, Wei Zhang; draft manuscript preparation: Ruikun Xu, Jiu Li, Wenjie Li, Wei Zhang. All authors reviewed the results and approved the final version of the manuscript.
Availability of Data and Materials: The data that support the findings of this study are available from the corresponding author upon reasonable request.
Ethics Approval: Not applicable.
Conflicts of Interest: The authors declare no conflicts of interest to report regarding the present study.
References
1. Su Y, Wu CQ, Li J, Li ZX, Li WG. Development of novel ultra-high performance concrete: from material to structure. Constr Build Mater. 2017;135:517–28. doi:10.1016/j.conbuildmat.2016.12.175. [Google Scholar] [CrossRef]
2. Contento A, Aloisio A, Xue JQ, He JP, Briseghella B. Ultra-high performance concrete beam-to-beam connections in continuous bridges: experimental full-scale tests, FE analyses and design. Eng Struct. 2024;316:118594. doi:10.1016/j.engstruct.2024.118594. [Google Scholar] [CrossRef]
3. Saini D, Shafei B. Synergistic use of ultra-high-performance fiber-reinforced concrete (UHPFRC) and carbon fiber-reinforced polymer (CFRP) for improving the impact resistance of concrete-filled steel tubes. Struct Des Tall Spec. 2023;32:e2036. doi:10.1002/tal.2036. [Google Scholar] [CrossRef]
4. Yang YF, Han LH. Experiments on rectangular concrete-filled steel tubes loaded axially on a partially stressed cross-sectional area. J Constr Steel Res. 2009;65:8–9. doi:10.1016/j.jcsr.2009.04.004. [Google Scholar] [CrossRef]
5. Xia HJ, Basha SH, Hu HS, Yang ZJ. Behavior of circular ultra-high-strength concrete-filled steel tube columns subjected to combined high-axial and cyclic lateral loads. J Build Eng. 2024;96:110442. doi:10.1016/j.jobe.2024.110442. [Google Scholar] [CrossRef]
6. Chen HY, Wang FX, Luo CS, Yang MY, Fu CJ, Wang BZ, et al. Lateral impact test and inertial force of concrete-filled steel tube column. Constr Build Mater. 2023;401:132928. doi:10.1016/j.conbuildmat.2023.132928. [Google Scholar] [CrossRef]
7. Khodayari A, Rehmat S, Valikhani A, Azizinamini A. Experimental study of reinforced concrete t-beam retrofitted with ultra-high-performance concrete under cyclic and ultimate flexural loading. Materials. 2023;16:7595. doi:10.3390/ma16247595. [Google Scholar] [PubMed] [CrossRef]
8. Silva MLD, Prado LP, Félix EF, Sousa AMDD, Aquino DP. The influence of materials on the mechanical properties of ultra-high-performance concrete (UHPCa literature review. Materials. 2024;17:1801. doi:10.3390/ma17081801. [Google Scholar] [PubMed] [CrossRef]
9. Li PP, Brouwers HJH, Yu Q. Influence of key design parameters of ultra-high performance fibre reinforced concrete on in-service bullet resistance. Int J Impact Eng. 2020;136:103434. doi:10.1016/j.ijimpeng.2019.103434. [Google Scholar] [CrossRef]
10. Tao X, Zhang J, Zhang M, Cao W. Seismic performance of semi-precast high-strength recycled concrete columns with ultra-high-strength steel bar. Eur J Environ Civil Eng. 2023;27:831–59. doi:10.1080/19648189.2022.2066185. [Google Scholar] [CrossRef]
11. Wu QX, She ZM, Yuan HH. Experimental study of UHPC-encased CFST stub columns under axial compression. Structures. 2021;32:433–47. doi:10.1016/j.istruc.2021.03.053. [Google Scholar] [CrossRef]
12. Li PP, Yu QL, Brouwers HJH, Chen W. Conceptual design and performance evaluation of two-stage ultra-low binder ultra-high performance concrete. Cem Concr Res. 2019;125:105858. doi:10.1016/j.cemconres.2019.105858. [Google Scholar] [CrossRef]
13. Yu ZC, Li YF, Zhang J, Yuan HQ, Wei XL, Du GF. Research on seismic performance and restoring force model for square UHPC-filled high-strength steel tube column with end ribs. Structures. 2024;63:106403. doi:10.1016/j.istruc.2024.106403. [Google Scholar] [CrossRef]
14. Du YS, Zhang YT, Chen ZH, Dong SH, Deng XF, Qian K. Seismic behavior of CFRP confined rectangular CFST columns using high-strength materials: numerical analysis and restoring force model. Structures. 2021;34:4237–53. doi:10.1016/j.istruc.2021.10.010. [Google Scholar] [CrossRef]
15. Zhang JH, Shao YB, Hassanein MF, Patel VI. Axial compressive performance of ultra-high strength concrete-filled dual steel tubular short columns with outer stiffened tubes and inner circular tubes. J Constr Steel Res. 2023;203:107848. doi:10.1016/j.jcsr.2023.107848. [Google Scholar] [CrossRef]
16. Chen SM, Zhang R, Jia LJ, Wang JY, Gu P. Structural behavior of UHPC filled steel tube columns under axial loading. Thin Wall Struct. 2018;130:550–63. doi:10.1016/j.tws.2018.06.016. [Google Scholar] [CrossRef]
17. Cao X, Xie XD, Zhang TY, Du GF. Bond-slip behavior between high-strength steel tube and ultra-high performance concrete. Structures. 2023;47:1498–510. doi:10.1016/j.istruc.2022.11.052. [Google Scholar] [CrossRef]
18. Li J, Deng Z. Axial compressive behavior of ultra-high performance concrete-filled double skin high-strength steel tubular short columns. Struct Concrete. 2023;24:3857–76. doi:10.1002/suco.202200691. [Google Scholar] [CrossRef]
19. Karim R, Shafei B. Ultra-high performance concrete under direct tension: investigation of a hybrid of steel and synthetic fibers. Struct Concrete. 2024;25:423–39. doi:10.1002/suco.202200830. [Google Scholar] [CrossRef]
20. Yan JB, Yang X, Luo Y, Xie P, Luo YB. Axial compression behaviours of ultra-high performance concrete-filled Q690 high-strength steel tubes at low temperatures. Thin Wall Struct. 2021;169:108419. doi:10.1016/j.tws.2021.108419. [Google Scholar] [CrossRef]
21. Ronanki VS, Aaleti S, Valentim DB. Experimental investigation of bond behavior of mild steel reinforcement in UHPC. Eng Struct. 2018;176:707–18. doi:10.1016/j.engstruct.2018.09.031. [Google Scholar] [CrossRef]
22. Dong H, Chen X, Cao W, Zhao Y. Bond-slip behavior of large high-strength concrete-filled circular steel tubes with different constructions. J Constr Steel Res. 2020;167:105951. doi:10.1016/j.jcsr.2020.105951. [Google Scholar] [CrossRef]
23. Ke X, Sun H, Yang Z. Calculation on bond strength of high-strength concrete filled steel tube. In: Proceedings of the 2015 4th International Conference on Sensors, Measurement and Intelligent Materials, 2016; Shenzhen, China: Atlantis Press. doi:10.2991/icsmim-15.2016.183. [Google Scholar] [CrossRef]
24. Shao Y, Ostertag CP. Bond-slip behavior of steel reinforced UHPC under flexure: experiment and prediction. Cem Concr Compos. 2022;133:104724. doi:10.1016/j.cemconcomp.2022.104724. [Google Scholar] [CrossRef]
25. Xie K, Huang K, Huang L, Zhu T. Experimental study of bond behavior between concrete-filled steel tube and UHPC-encased. Constr Build Mater. 2023;409:134016. doi:10.1016/j.conbuildmat.2023.134016. [Google Scholar] [CrossRef]
26. Yan YX, Yan Y, Wang Y, Cai H, Zhu Y. Seismic behavior of UHPC-filled rectangular steel tube columns incorporating local buckling. Buildings. 2023;13:1028. doi:10.3390/buildings13041028. [Google Scholar] [CrossRef]
27. Gao YF, Dong L, Liu T, Huang X, Luo YD, Long J, et al. Metallic materials—tensile testing—part 1: method of test at room temperature (GB/T 228.1–2021). China: Architectural & Building Press; 2021. p. 12–21 (In Chinese). [Google Scholar]
28. Leng FG, Wang YH, Zhou YX, Gao C, Wang SL, Wang L, et al. Standard for test methods of concrete physical and mechanical properties (GB/T 50081-2019). China: Architecture & Building Press; 2019. p. 9–15 (In Chinese). [Google Scholar]
29. Zhang RC, Feng LQ, Que P, Wei LG, Zhu AL, Lin WX, et al. Technical specification for strength testing of high strength concrete (JGJ/T 294-2013). China: Architecture Industrial Press; 2013. p. 10–2 (In Chinese). [Google Scholar]
30. Zhou P. Experimental and theoretical study on the bond-strength of concrete-filled circular steel tubes (Master’s Thesis). Xi’an University of Architecture and Technology: Xi’an, China; 2007 (In Chinese). [Google Scholar]
31. Li X. Experimental study and finite element analysis of bond-slip between circular steel tube and concrete (Master’s Thesis). Xi’an University of Architecture and Technology: Xi’an, China; 2008 (In Chinese). [Google Scholar]
32. Contento A, Aloisio A, Xue JQ, Quaranta G, Briseghella B, Gardoni P. Probabilistic axial capacity model for concrete-filled steel tubes accounting for load eccentricity and debonding. Eng Struct. 2022;268:114730. doi:10.1016/j.engstruct.2022.114730. [Google Scholar] [CrossRef]
33. Simulia. Abaqus analysis user’s guide, version 2021. RI, USA: Dassault Systemes Providence; 2021. [Google Scholar]
34. Xu ZM, Huang Y. Finite element analysis of progressive collapse resistance of precast concrete frame beam-column substructures with UHPC connections. J Build Eng. 2024;82:108338. doi:10.1016/j.jobe.2023.108338. [Google Scholar] [CrossRef]
35. Qiu H, Zhu Z, Zhang R, Wang M, Wang F, Luo CS, et al. Experimental study on dynamic tensile strength of bimaterial Brazilian disc under different loading rates. Chin J Rock Mech Eng. 2020;39(6):1175–88 (In Chinese). [Google Scholar]
Cite This Article
 Copyright © 2025 The Author(s). Published by Tech Science Press.
This work is licensed under a Creative Commons Attribution 4.0 International License , which permits unrestricted use, distribution, and reproduction in any medium, provided the original work is properly cited.
 Downloads
 Citation Tools