
 Submit a Paper
 Propose a Special lssue
 Open Access
ARTICLE

A Damage Control Model for Reinforced Concrete Pier Columns Based on Pre-Damage Tests under Cyclic Reverse Loading
1 Offshore Oil Engineering Co., Ltd., Tianjin, 300461, China
2 Department of Bridge Engineering, School of Transportation, Southeast University, Nanjing, 21189, China
* Corresponding Author: Wen-Wei Wang. Email:
(This article belongs to the Special Issue: Sensing Data Based Structural Health Monitoring in Engineering)
Structural Durability & Health Monitoring 2025, 19(2), 327-346. https://doi.org/10.32604/sdhm.2024.054671
Received 04 June 2024; Accepted 10 September 2024; Issue published 15 January 2025
 View Full Text
 Download PDF
Abstract
To mitigate the challenges in managing the damage level of reinforced concrete (RC) pier columns subjected to cyclic reverse loading, this study conducted a series of cyclic reverse tests on RC pier columns. By analyzing the outcomes of destructive testing on various specimens and fine-tuning the results with the aid of the IMK (Ibarra Medina Krawinkler) recovery model, the energy dissipation capacity coefficient of the pier columns were able to be determined. Furthermore, utilizing the calibrated damage model parameters, the damage index for each specimen were calculated. Based on the obtained damage levels, three distinct pre-damage conditions were designed for the pier columns: minor damage, moderate damage, and severe damage. The study then predicted the variations in hysteresis curves and damage indices under cyclic loading conditions. The experimental findings reveal that the displacement at the top of the pier columns can serve as a reliable indicator for controlling the damage level of pier columns post-loading. Moreover, the calibrated damage index model exhibits proficiency in accurately predicting the damage level of RC pier columns under cyclic loading.Keywords
Concrete piers constitute the primary seismic elements of the bridge, tasked with dissipating significant amounts of energy to safeguard the superstructure. Different seismic impact grades can inflict varying degrees of damage on the bridge piers. Following the pier damage, the seismic resilience of the bridge structure diminishes, and reinforcing the piers becomes a viable means of restoring or enhancing its seismic performance. Without an accurate assessment of the extent of damage, repairing piers may result in over- or under-reinforcement. Over-reinforcement can lead to damage spreading from the pier to the foundation during strong earthquakes, while insufficient reinforcement renders the pier incapable of resisting subsequent seismic events. Consequently, a rational assessment of pier damage is essential before repair efforts [1,2].
The determination of the degree of injury to concrete piers is often empirically assessed based on the visible state of damage [3–6] or through quantitative injury assessment [7,8]. The empirical approach can be highly subjective, whereas quantitative injury assessment methods offer the advantage of reducing human bias and are thus of significant value in developing accurate evaluation models. However, due to the complexity of earthquake forces and structural response mechanisms, there is no unified approach to damage quantification [9–11]. Building upon previous research, this paper collects methods for damage quantification and validates them through experiments. Ultimately, a damage control method is proposed.
Damage quantification assessment methods have developed damage models that utilize displacement amplitude and energy consumption accumulation as parameters. These include single-parameter damage models based on displacement-induced damage or energy [12,13], as well as two-parameter models that incorporate both displacement and energy [14–16]. However, variations in understanding of concrete pier column damage among researchers worldwide have led to unclear damage intervals in some models, making it difficult to apply quantitative damage assessment in reinforcement decision-making. Therefore, this paper combines previous ocular studies, references their damage classification methods, and verifies the rationality of their quantitative damage models and classification techniques through experimental methods.
To improve the quantitative analysis of concrete pier column damage, this paper conducts the pre-damage testing of concrete pier columns under low-cycle repeated loading. Based on the test results, the two-parameter damage model incorporating displacement and energy is calibrated, and a displacement-based damage control method is proposed. This approach aims to provide a more objective and accurate framework for assessing concrete pier column damage and informing reinforcement strategies.
IMK (Ibarra Medina Krawinkler) model was initially introduced by Ibarra et al. [17], serving as a restoring force model that simulates the nonlinear behavior of beam-column members using plastic hinges. Compared to other models, IMK model can better simulate the stress characteristics of components, with strong versatility and simplified calculations, making it more applicable in engineering. The relevant curve is shown in Fig. 1. In the figure,
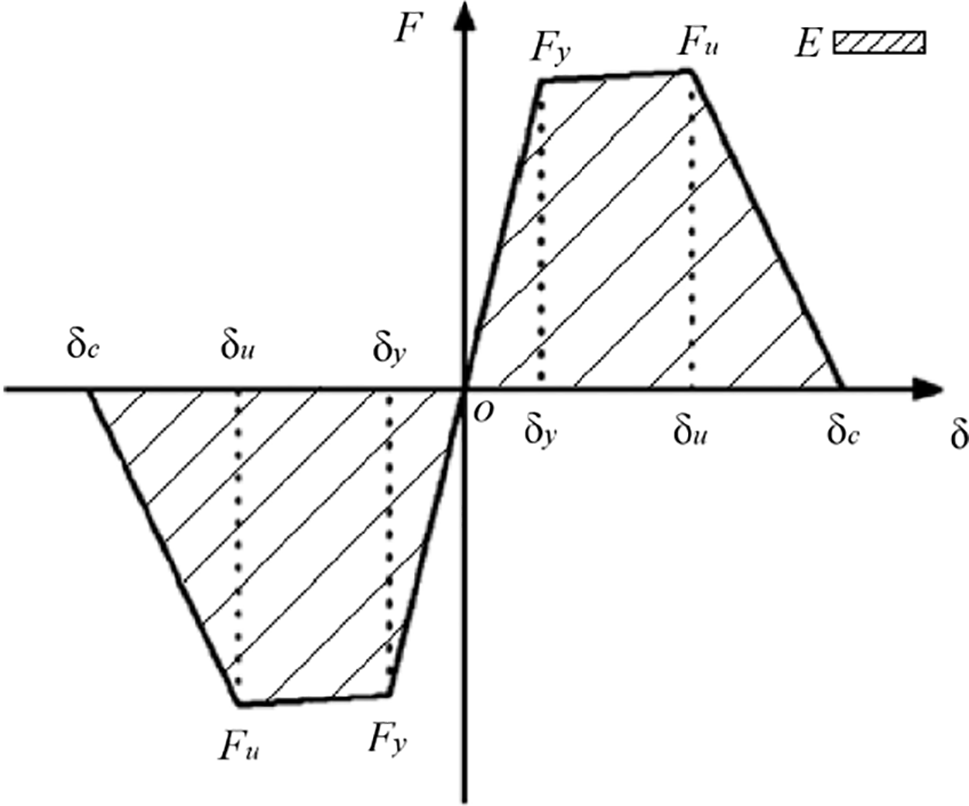
Figure 1: Skeleton curve of IMK model
Based on IMK model, a double-parameter damage index model for reinforced concrete (RC) pier columns under seismic loading conditions is proposed as follows:
where,
When utilizing Eq. (1), it is crucial to ascertain the yield load
In Eq. (1),
According to Eq. (1), numerically, when
2.1 Yield Load and Yield Displacement
It is evident from Eq. (1) that the yield load and yield displacement of a concrete pier column under horizontal loading are critical parameters for quantifying the extent of damage to the concrete pier column. However, there exists no uniform standard for determining these values. Conventionally, the yield point of a pier column is defined as the point where a significant change in stiffness occurs. Nevertheless, in numerous instances, the stiffness of concrete pier columns undergoes gradual changes, rendering the identification of the precise yield point a challenging task.
In this paper, the yield load and yield displacement are determined using a method illustrated in Fig. 2 [18]: a tangent drawn from the origin intersects a horizontal tangent from the peak point at point A. A vertical line from point A intersects the skeleton curve under monotone horizontal loading at point B. The line connecting the origin and point B intersects line AC at point C. The intersection of the vertical line through point C and the skeleton curve determines the yield point. The corresponding load at this point is the yield load
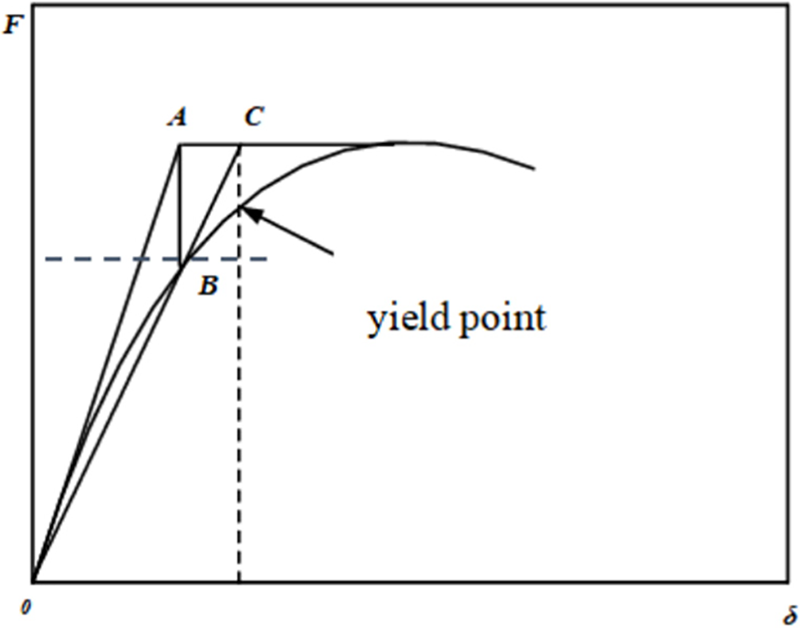
Figure 2: Determination of the yield load
During this process, the initial stiffness has a significant impact on the determination of yield points. Therefore, this paper selects the load and displacement values from 10 to 50 points after the formal loading of the pier column to fit and determine the initial stiffness of the pier column. For instance, in the ModelN2 testing column completed by the National Institute of Standards and Technology (NIST) [19], as depicted in Fig. 3, the initial tangential stiffness
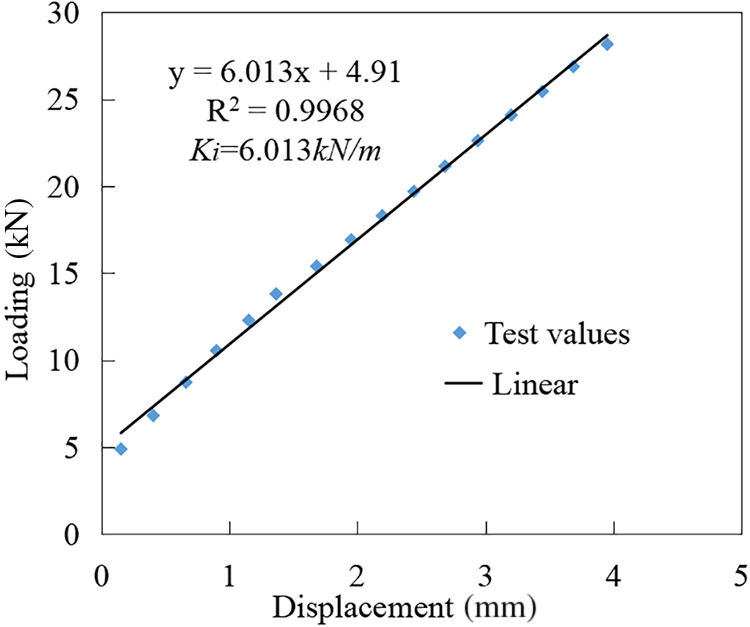
Figure 3: Determination of the initial stiffness and the yield displacement
2.2 Cumulative Energy Consumption
The energy dissipation of a RC pier column during an earthquake refers to the amount of energy absorbed by the pier column. In this paper, the cumulative energy consumption of the RC pier column is calculated using the simplified trapezoidal method. Specifically, the hysteresis curve is divided into equal intervals, and the trapezoidal formula is applied to each interval. Subsequently, the energy dissipation of the pier column is determined by summing the contributions from each interval. Notably, the calculated area is positive when the pier column is loaded and negative when unloaded.
To illustrate this method, we consider the ModelN2 test column completed by the National Institute of Standards and Technology (NIST) of the US National Institute of Standards and Technology [19]. Fig. 4a depicts the hysteretic test data of the ModelN2 test column under conventional loading conditions. The shaded area in Fig. 4b represents the energy dissipation of the pier during a single loading and unloading cycle. Fig. 4c presents the total energy consumption of the ModelN2 test column throughout the hysteretic loading process.
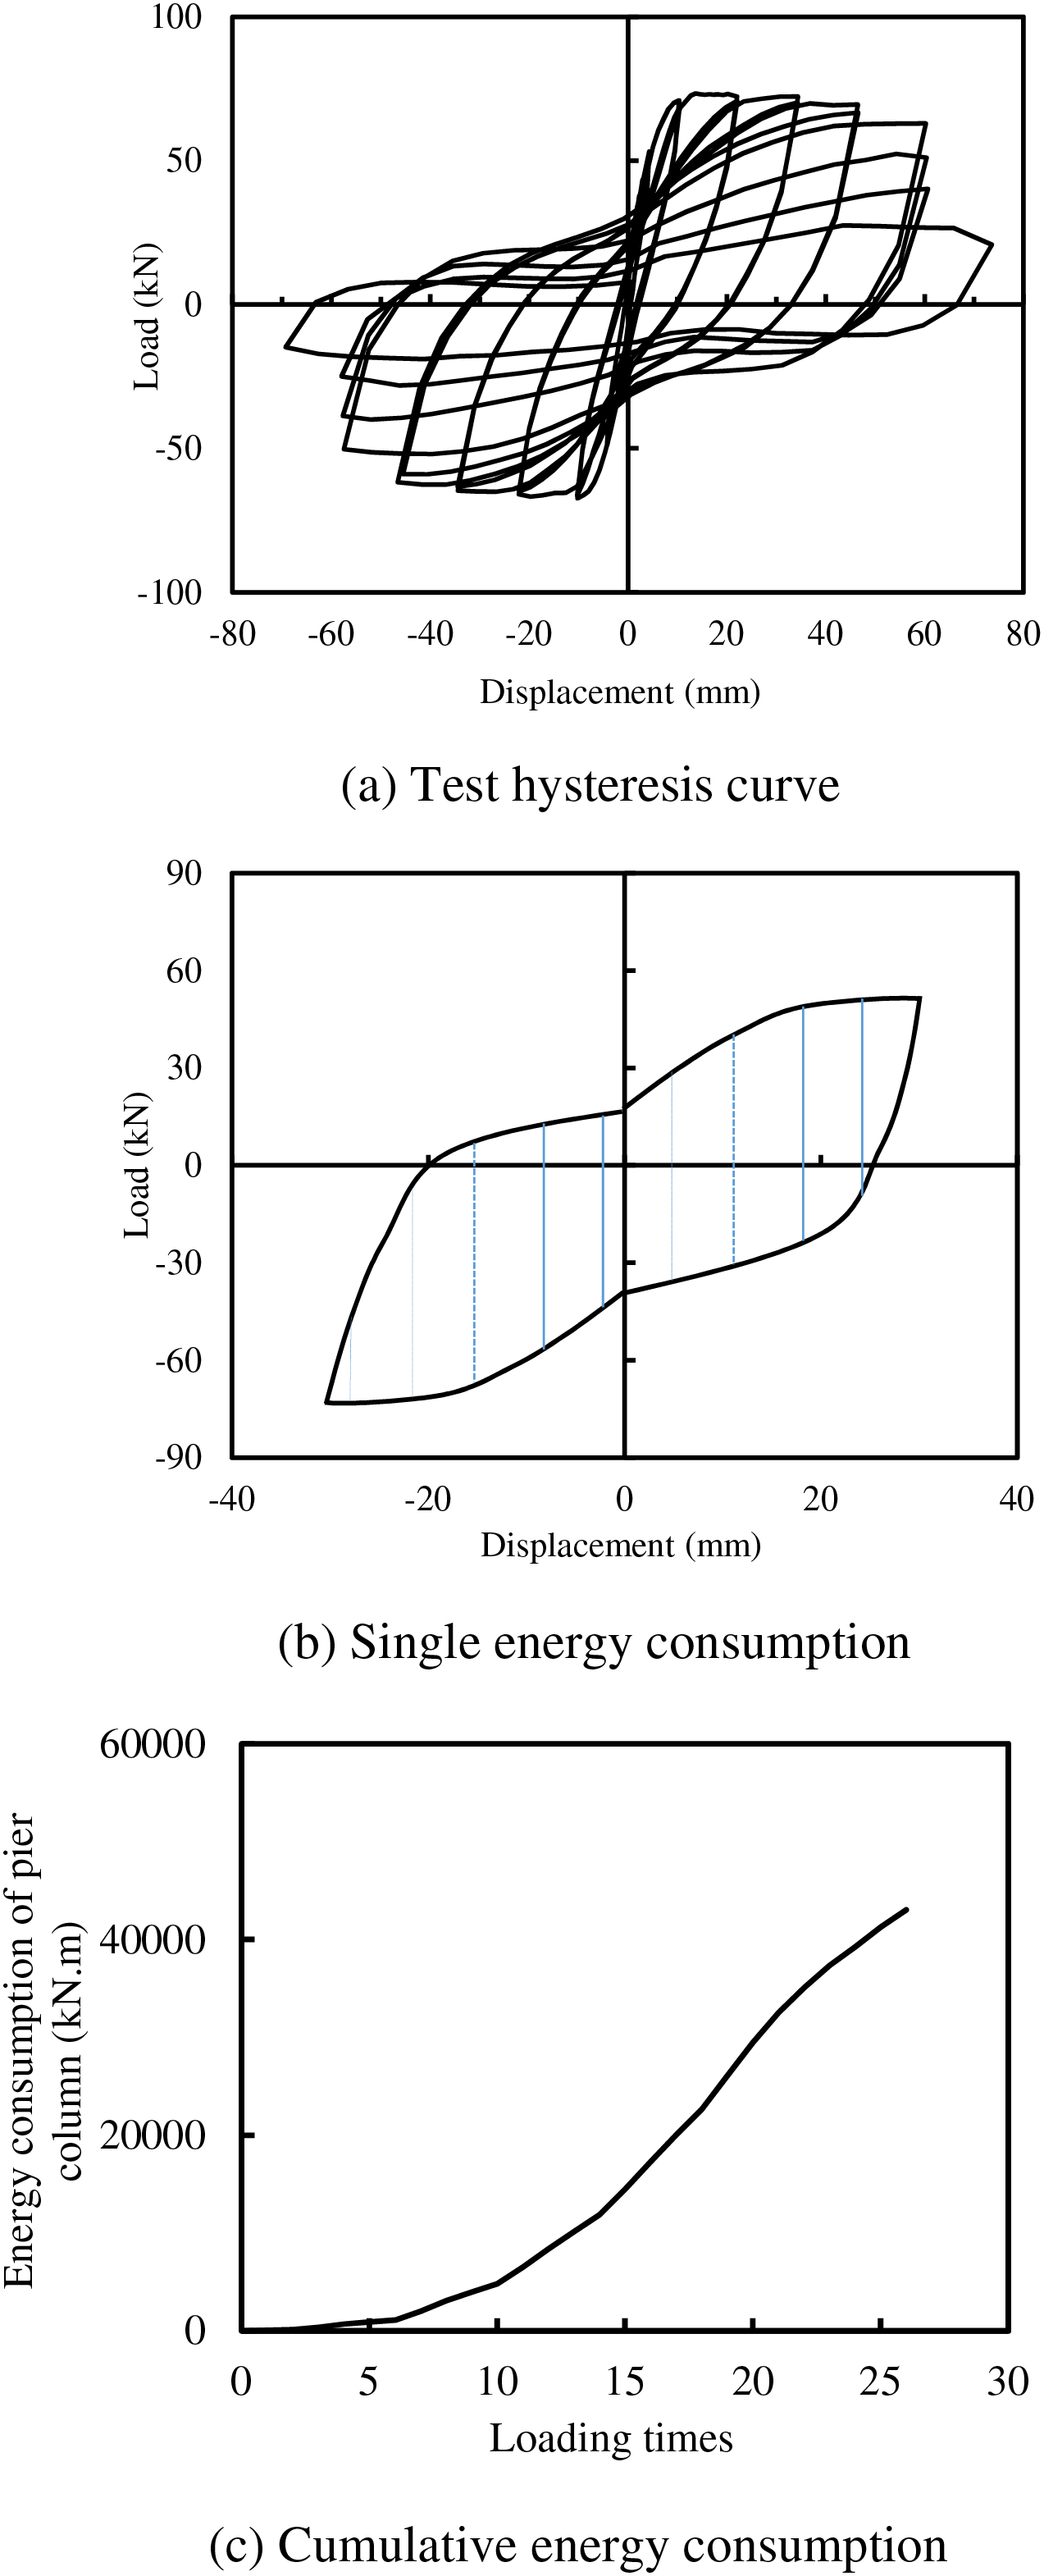
Figure 4: Energy consumption calculation of concrete pier column
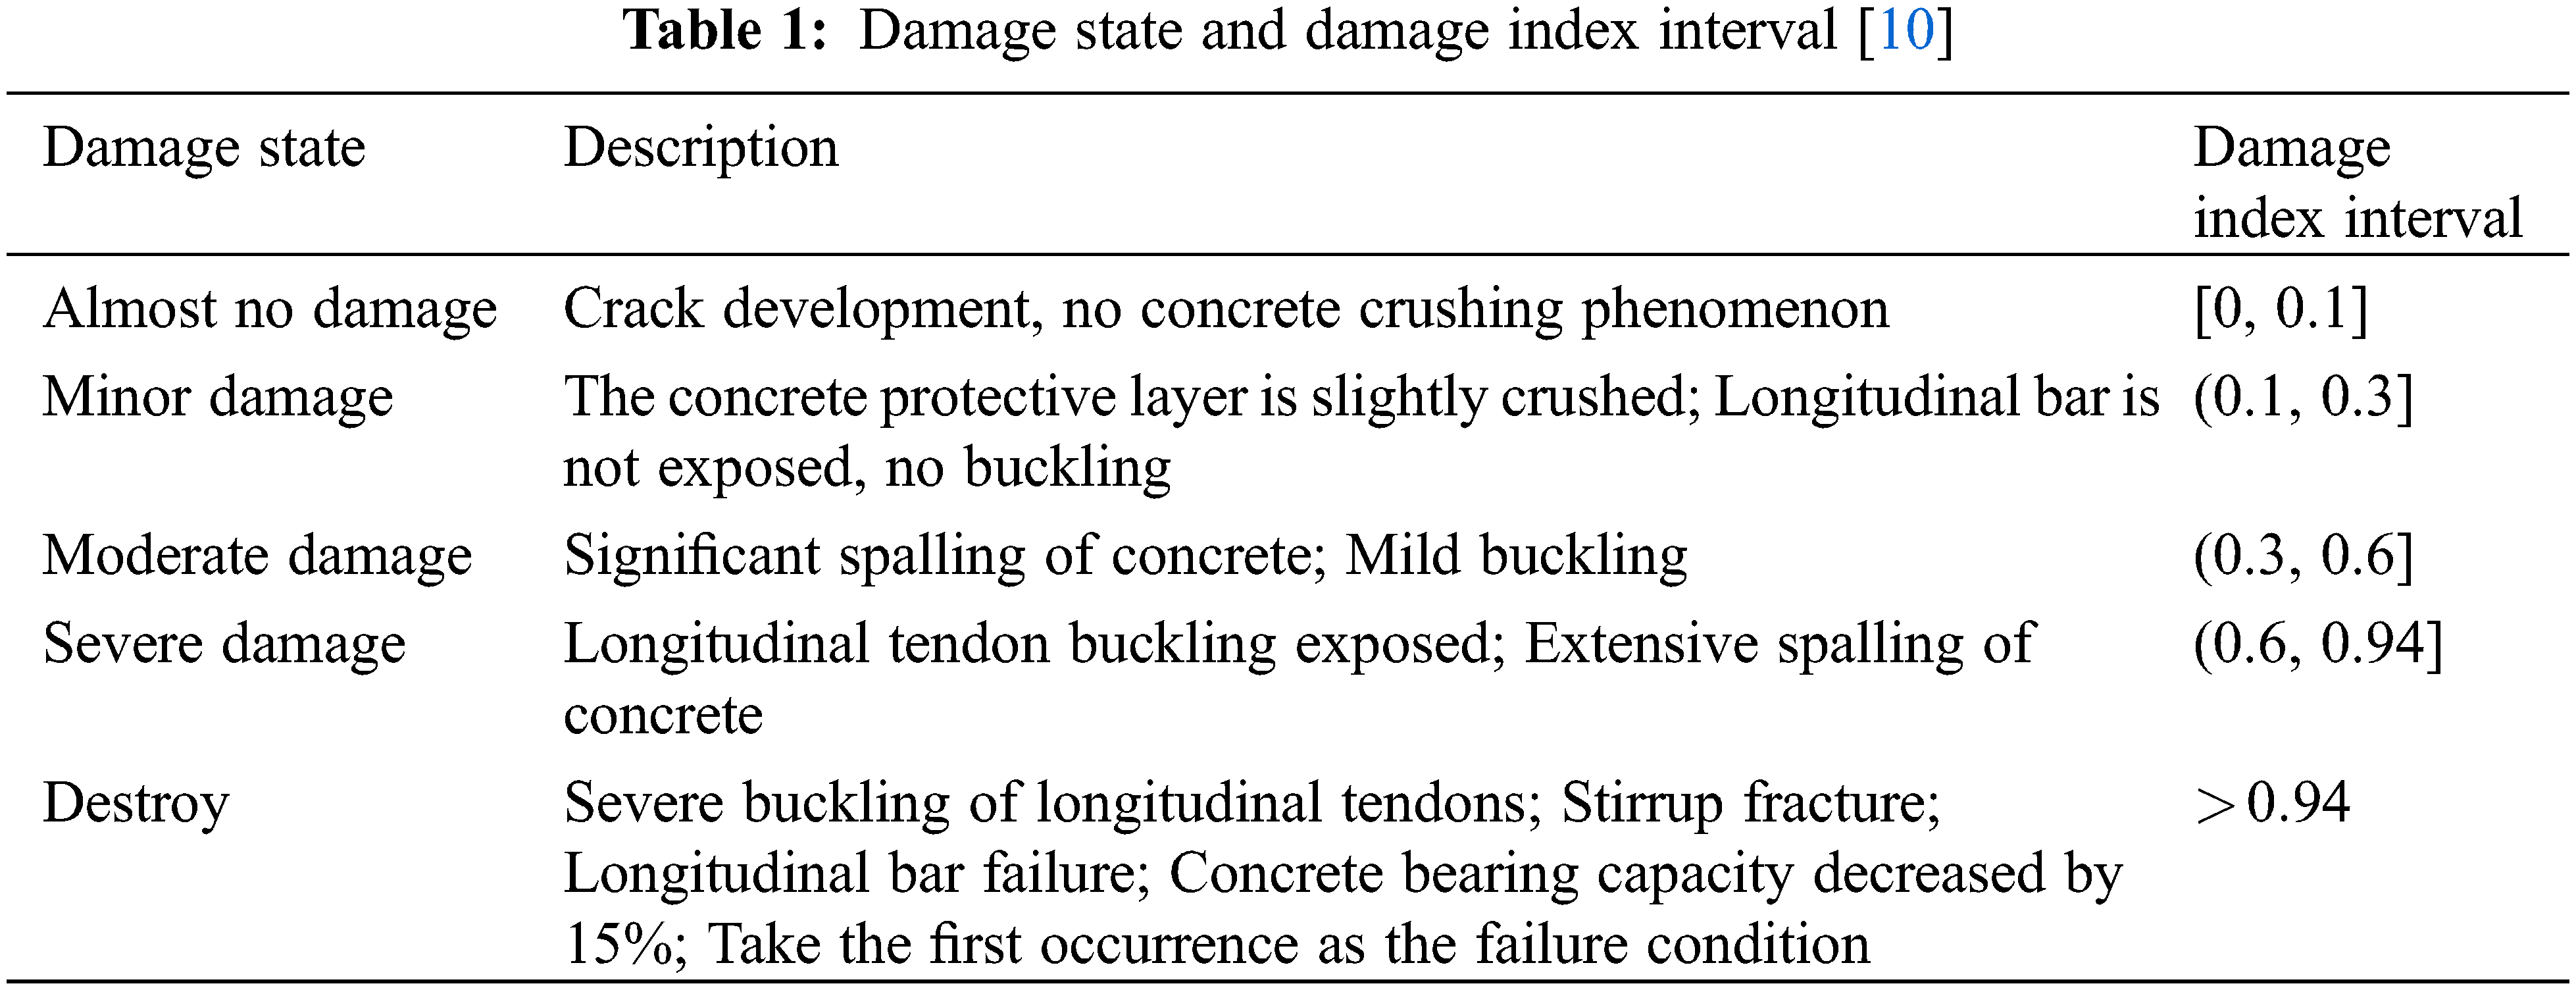
Wang’s previous studies have provided us with valuable insights regarding the classification of damage index [10]. RC pier columns were classified into five distinct damage states. Based on the test results of 72 RC pier columns, Eq. (1) was utilized to calculate the damage index, and the resulting distribution intervals were statistically determined as shown in Table 1.
To further validate the proposed interval distribution of the damage index from literature [10], this paper conducts a damage test on a reinforced concrete pier column under low cyclic loading. The purpose of this test is to experimentally determine the damage index values and compare them with the intervals predicted by the statistical analysis in the literature [10]. Such a validation study can provide insights into the accuracy and reliability of the damage index formula and its applicability to real-world structures.
3.1 Specimen Design and Material Properties
Five specimens of RC pier columns were carefully designed and constructed to study their performance under various loading conditions. As detailed in Table 2, the specimens vary in terms of their damage susceptibility under the applied forces. Specifically, CN0 is a control specimen designed to undergo failure under direct nappe due to simultaneous vertical and horizontal forces. CN1, on the other hand, is designed to experience damage resulting from a combination of vertical loading and horizontal cyclic loading, simulating the effects of repeated pushing and pulling.
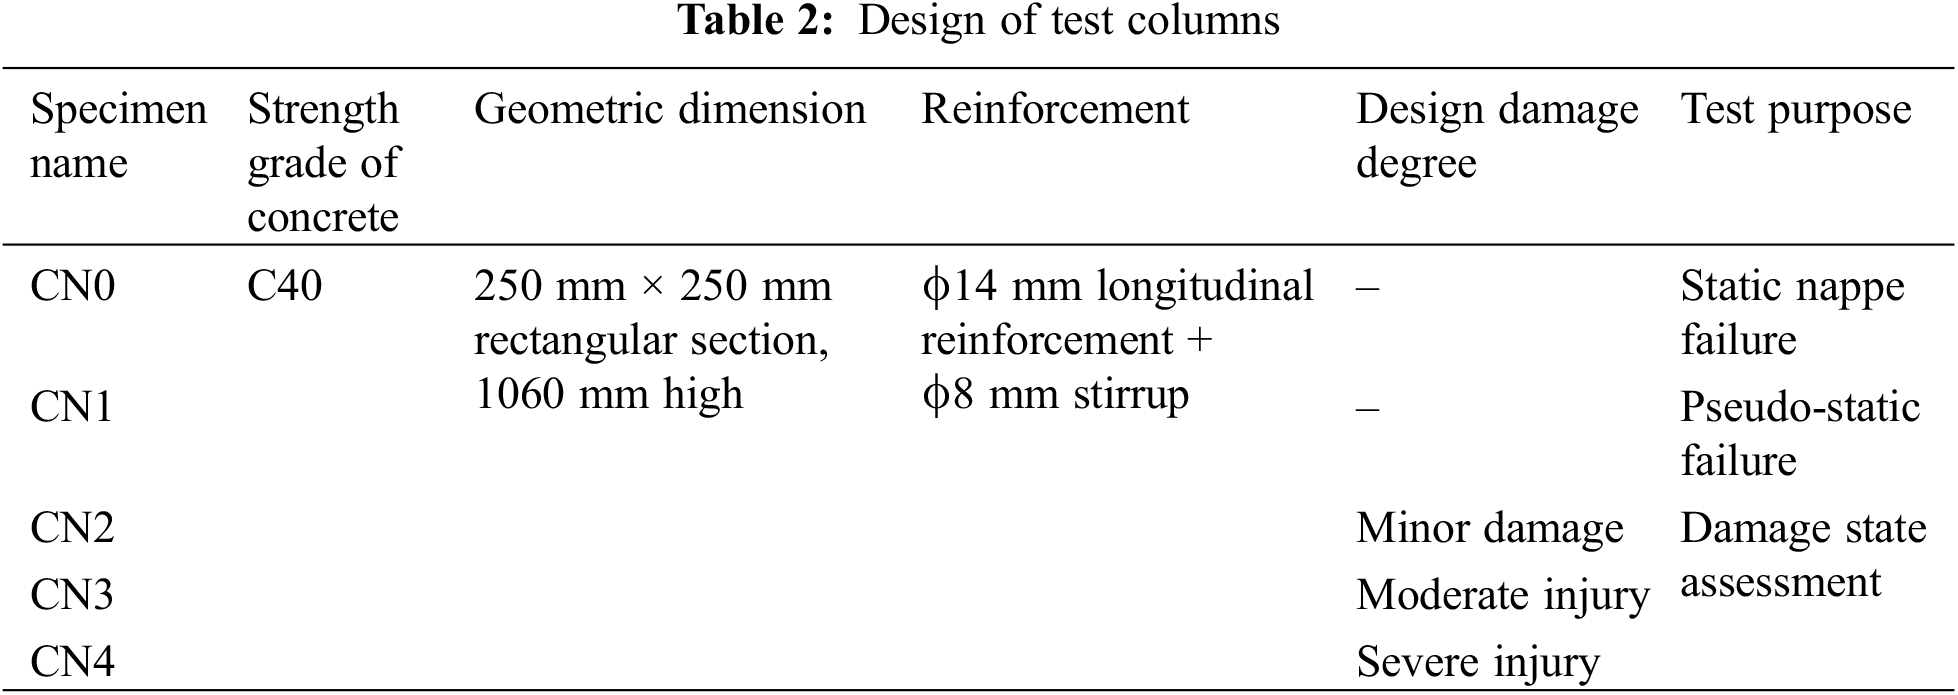
The damage degree of CN2 was intentionally designed to be minor, allowing for the study of initial crack formation and minor deformations. CN3 was designed to sustain moderate damage, providing insights into the behavior of the pier column under more significant stress levels. Finally, CN4 is intended to undergo severe damage, simulating extreme loading conditions to assess the ultimate failure mode of the pier column.
Table 2 provides a comprehensive overview of the specimen design parameters, including their damage levels, which will facilitate a detailed analysis and comparison of their performance during testing.
As indicated in Fig. 5, the specimens are comprised of a base and an upper pier column, both integral components. The cross-section of these specimens is a rectangular shape, measuring precisely 250 mm × 250 mm, with a total height of 1060 mm. The pier column is designed to withstand an axial pressure ratio of 0.1. The concrete used in the specimens is of grade C40, ensuring its strength and durability.
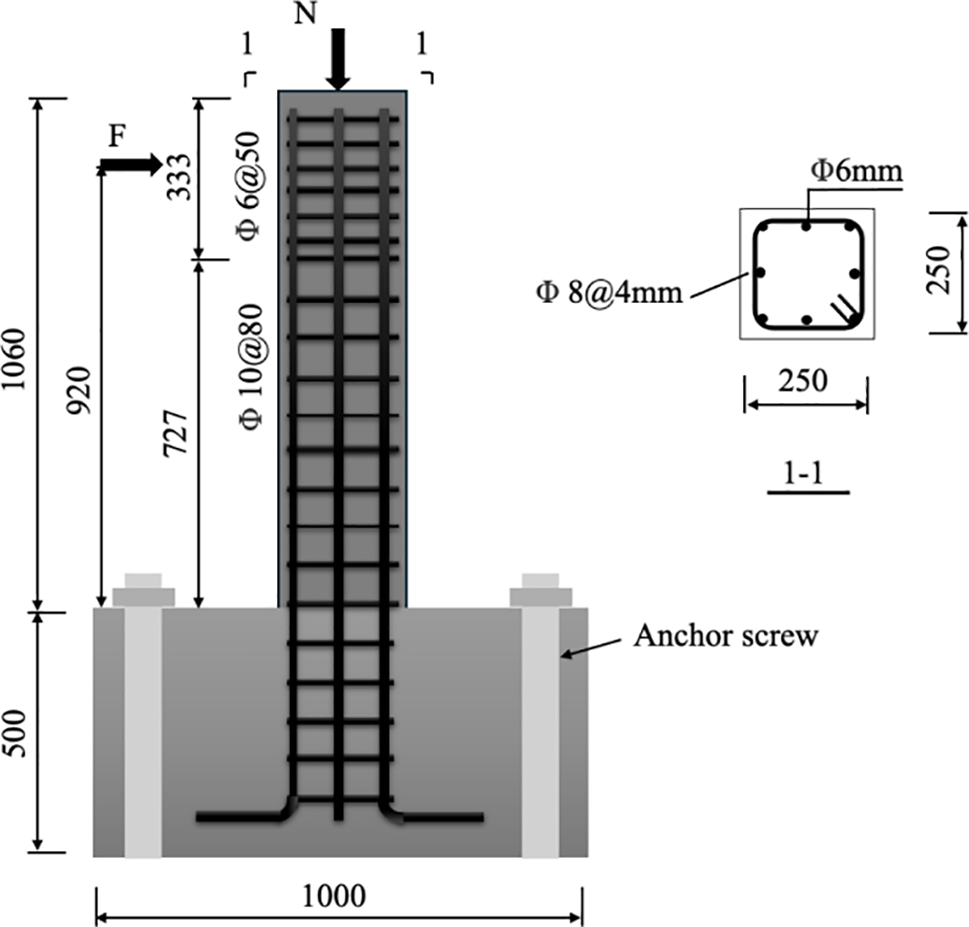
Figure 5: Specimen design (unit in mm)
For reinforcement, longitudinal bars are made of grade HRB400 steel with a diameter of 14 mm, while rebar of grade HPB300 with a diameter of 8 mm is also utilized. Additionally, threaded reinforcement is employed, and a concrete protective layer of 25 mm thickness is provided to safeguard the integrity of the structure. The stirrups are densified at the anchorage point of the loading position to prevent localized compression damage to the concrete.
Lifting rings are installed at the four corners of the pier column’s base for ease of handling and lifting. To securely fix the base to the channel, corresponding anchor screw positions are cut through, allowing for the anchoring of the base to the channel. Furthermore, a 2 mm thick steel plate is installed in the base groove to mitigate excessive local concrete crushing during pier column anchorage. Fig. 5 illustrates the detailed design of the pier column, showcasing its intricate composition and reinforcement setup.
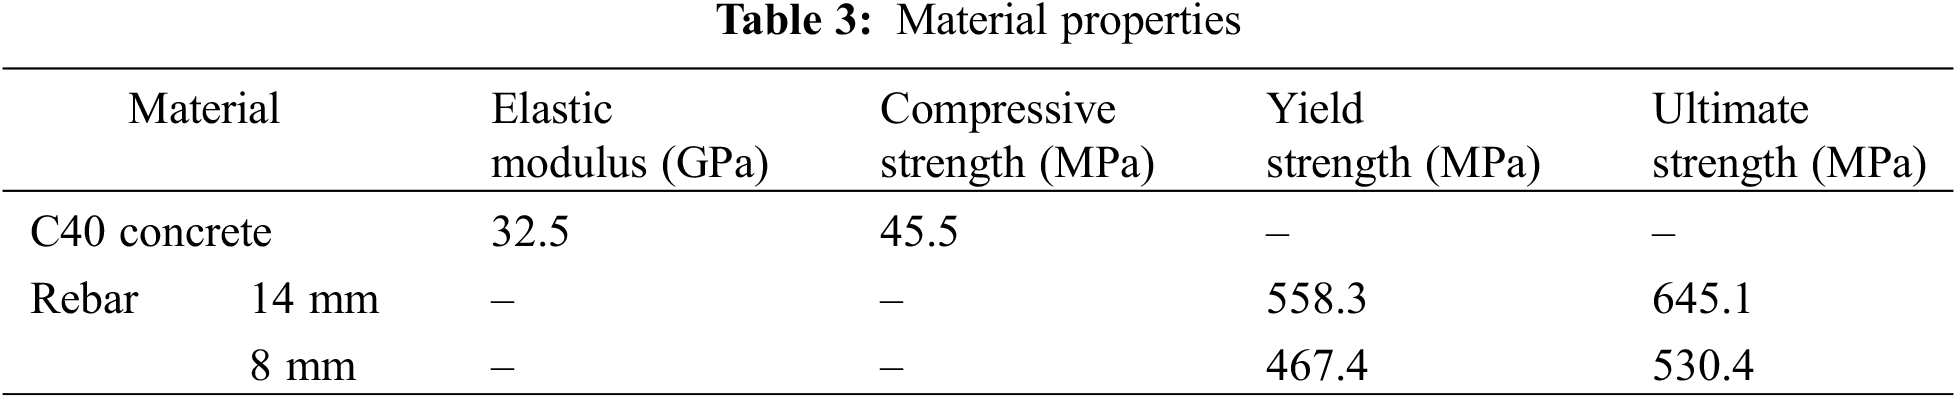
The concrete used in the specimens is C40 commercial concrete supplied by Nanjing Hailuo Cement Co., Ltd. (Nanjing, China). During the pier column pouring process, concrete standard cube test blocks with a side length of 150 mm are reserved. These test blocks undergo a compressive strength test after curing in the same external environment for 28 days.
In the fabrication of the steel skeleton for the specimens, tensile specimens are also reserved to assess the mechanical properties of the steel bars following the relevant provisions outlined in Steel for Reinforced Concrete Part 2: Hot-Rolled Ribbed Steel Bars (GB1499.2-2007) [20]. Table 3 provides a comprehensive overview of the material properties utilized in this process.
The test device comprises a vertical loading gantry, a horizontal actuator, and a transverse gantry, as depicted in Fig. 6. The vertical loading thrust frame incorporates a crossbeam, a pulley, a vertical loading jack, and a ball hinge. The pulley, positioned beneath the beam, enables the top of the pier column to move horizontally in a repetitive manner under the influence of horizontal force. The ball hinge, situated between the jack and the pier column’s top surface, ensures that the vertical force remains perpendicular to the pier column’s top surface at all times.
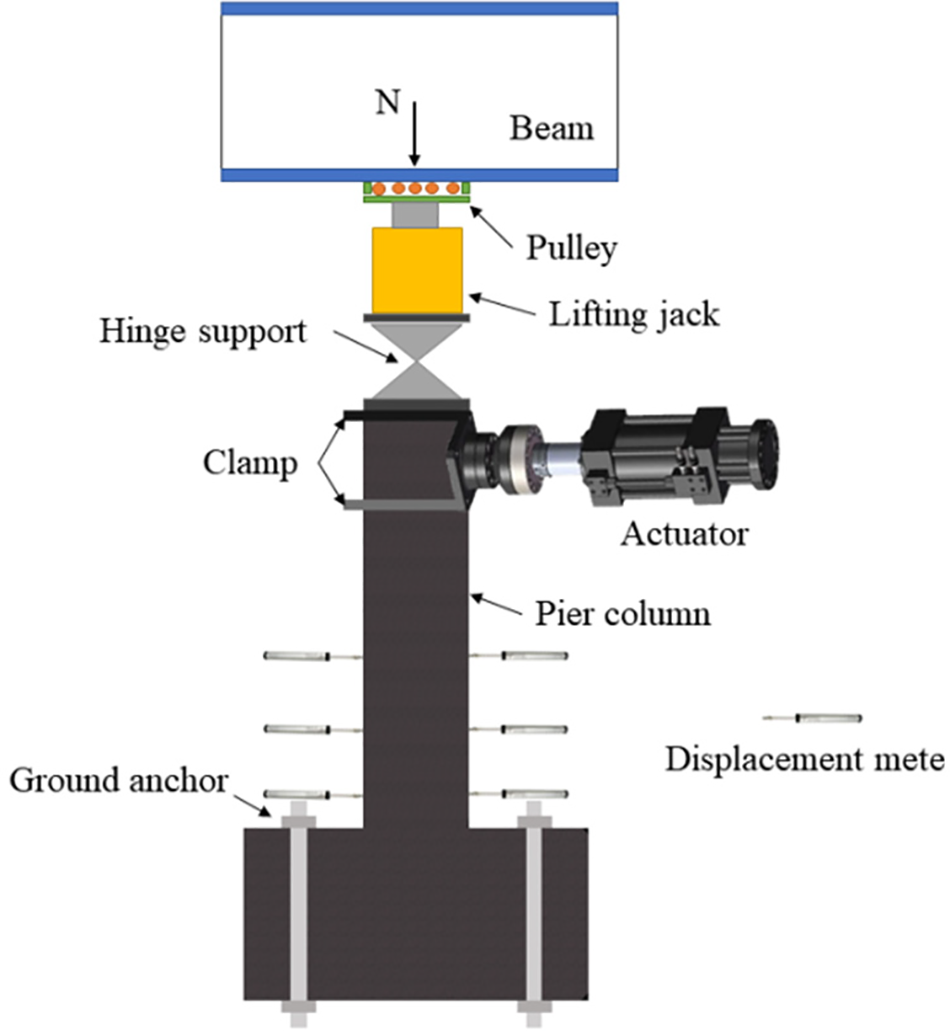
Figure 6: Test device
The transverse gantry serves to support the horizontal actuator, which is positioned at the top to maintain a consistent horizontal force. Additionally, to prevent the base from sliding due to repeated push-pull loading, a horizontal jack and a horizontal pull rod are installed between the horizontal thrust frame and the base, limiting the base’s displacement.
Three horizontal sections are selected on each specimen, and displacement meters are positioned on both the left and right sides of the pier column to gauge the curvature of these sections. The horizontal screws for the displacement meters are installed at 70, 230, 390, and 550 mm intervals, as indicated in Fig. 6.
The 25-ton range actuator was utilized to exert a horizontal load onto the pier column. The data acquisition system captured the displacement and load values at the loading point of the pier column. Once the pier column was installed, the following steps were taken: the height of the actuator’s telescopic arm end was adjusted, and its horizontal position was marked and secured. Then, the operating system’s elongation actuator force arm was extended to the surface of the pier column, where it was securely anchored with a fixture, along with the pier column itself. Subsequently, the loading mode depicted in Fig. 7a was employed for debugging purposes. After the successful commissioning of the pier column, each connection point was inspected and re-anchored to ensure a tight and robust connection.
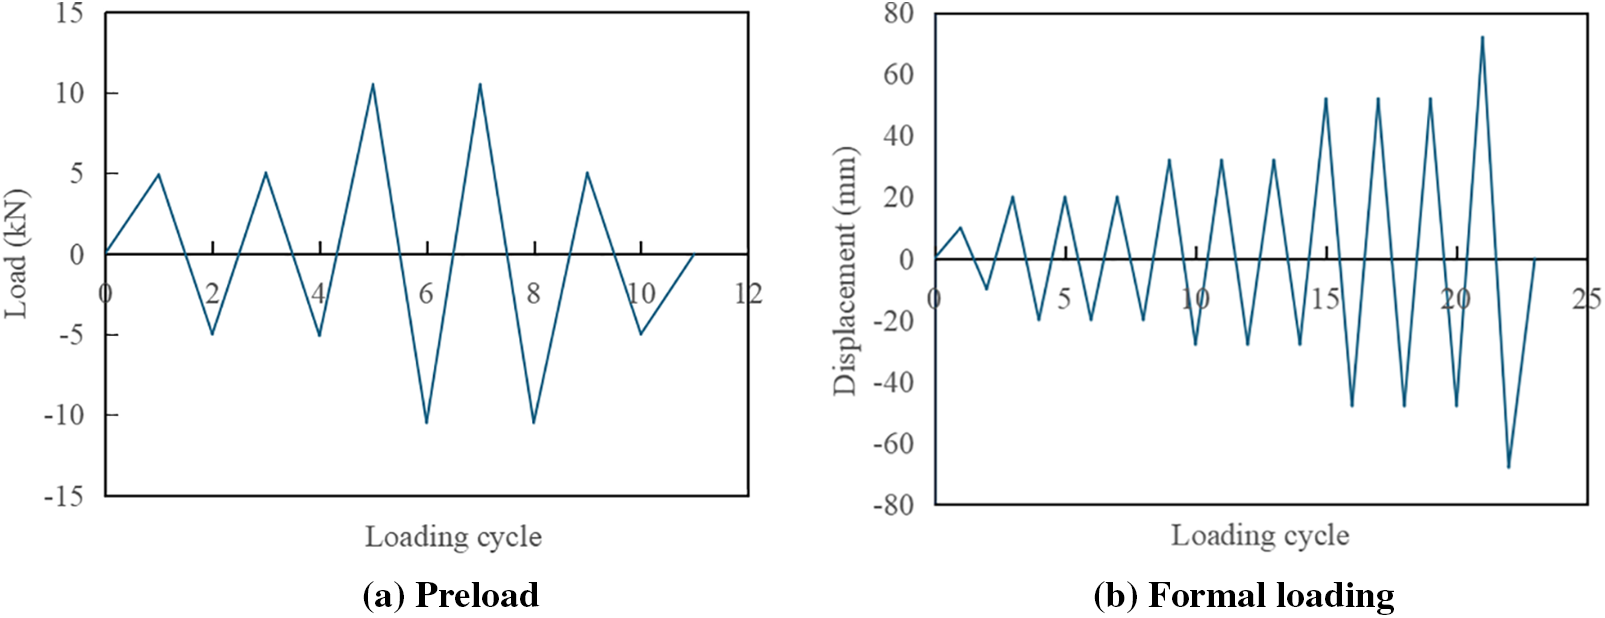
Figure 7: Specimen loading mode
After the successful commissioning, proceed with the calibration and installation of the corner displacement meter. Ensure that the displacement meter is mounted onto the anchor rod, maintaining a perpendicular alignment with the pier column base. Utilize the magnetic table seat fittings to securely connect the connecting rod singlet with the screw rod. Once the installation is complete, integrate the strain gauge and displacement meter by connecting, numbering, and marking them with the corresponding data acquisition box. Finalize the setup by debugging and initializing the data acquisition system.
The axial load is administered by a 30-ton range electric hydraulic jack. Given that the pier column is prone to significant displacement under the influence of horizontal loads, prompt adjustment of the axial load is essential to ensure stability. Therefore, the electric hydraulic jack remains in a continuous working state to apply the axial load. Before testing, a pressure sensor is utilized to calibrate the relationship between the load of the electric hydraulic jack and the oil pressure for each completed test cycle, ensuring accurate load measurements.
After thorough preparation, initiate the axial loading system, data acquisition system, and hydraulic servo control system in succession. Subsequently, conduct a low-intensity weekly repeated load test. During this test, halt the loading process once the desired target is observed and ensure to document all relevant pier test data. For the formal loading phase of the pier column, adopt the mixed loading mode as depicted in Fig. 7b. Initially, apply a loading displacement amplitude of 10 mm, followed by 20 mm in the second stage, repeating both stages three times each. Then, increase to 30 mm for the third stage and 50 mm for the fourth, repeating both stages three times. Upon completion of the fourth stage, continue adding 20 mm increments until the pier column reaches the target damage state or incurs damage.
Specimen CN0 is designed to undergo a monotone loading failure test. The loading mode is displacement-controlled, with a loading speed of 1 mm/s. As the displacement increases, distinct stages of crack development and failure are observed. When the displacement reaches 3 mm, fine transverse bending cracks emerge on the concrete surface of the pier column. As the load intensifies, reaching a displacement of 8 mm, the bending cracks propagate rapidly, and oblique cracks begin to form. At 10 mm displacement, prominent vertical cracks appear on the compression side of the concrete. As the displacement increases to 20 mm, the vertical cracks on the compression side significantly expand, leading to concrete spalling.
When the displacement reaches 30 mm, the concrete protective layer on the compression side is stripped off. Further displacement, up to 40 mm, reveals distinct shear cracks on the tension side, accompanied by extensive crushing of the concrete under compression. As the displacement advances to 50 mm, the longitudinal tendons on the compression side buckle, resulting in a decrease in bearing capacity. After this point, the load plateaus until the displacement reaches 70 mm, where the bearing capacity has diminished by approximately 30%, indicating that the pier column has reached a state of failure.
The progression of concrete cracks and ultimate failure of specimen CN0 are depicted in Fig. 8a, while the load-displacement curve is presented in Fig. 8b. Additionally, Fig. 8b includes the outer envelope or skeleton curve of the hysteresis curve for specimen CN1, providing a comparative reference.
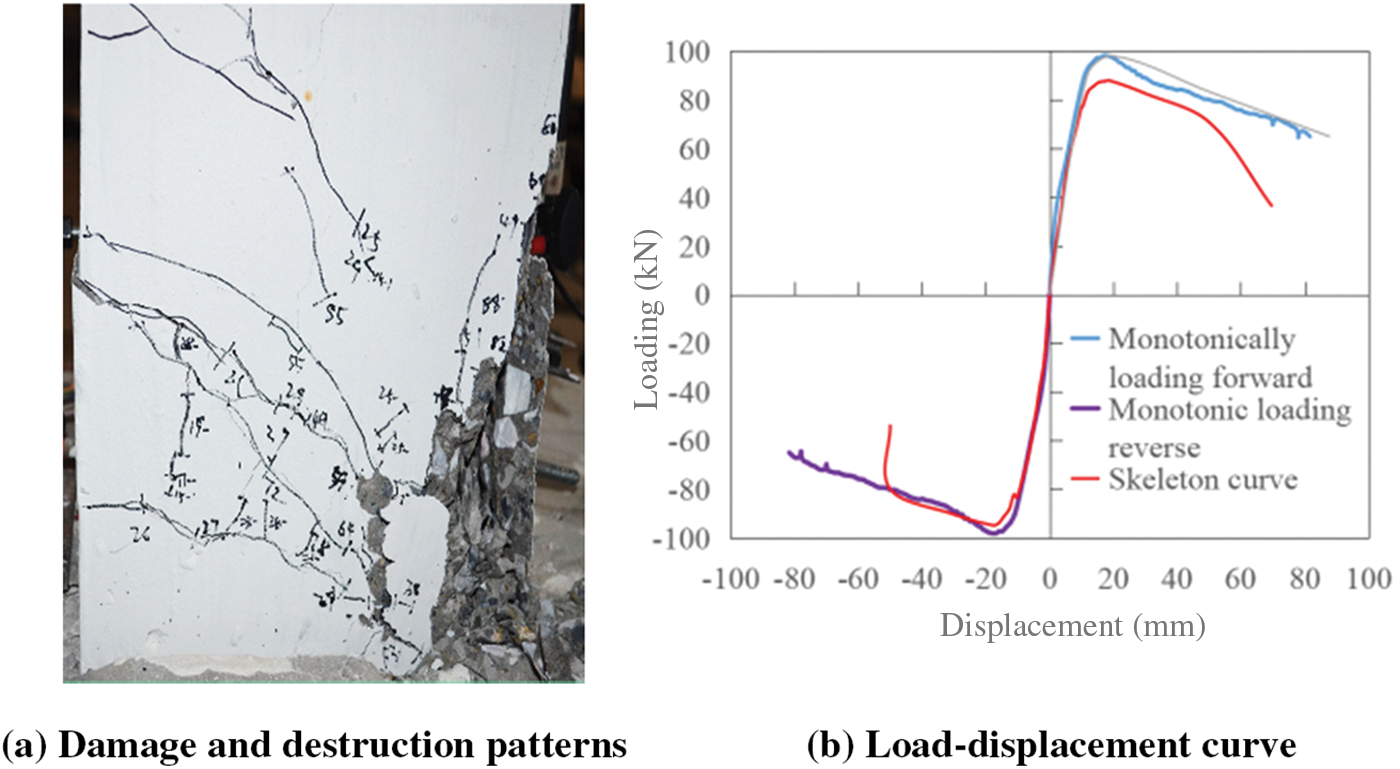
Figure 8: Failure mode and load-displacement curve of specimen CN0
The hysteretic loading failure test on Specimen CN2 employed a displacement loading mode as depicted in Fig. 7b, with a loading speed of 1 mm/s. During the initial loading cycle, with a displacement amplitude of 10 mm, bending cracks began to emerge in the concrete once the displacement reached 2.8 mm. As the displacement increased to 8 mm, the flexural fractures propagated, and oblique fractures started to form. Upon attaining a displacement of 10 mm, vertical cracks became visible at specific corners of the pier column.
During the subsequent loading cycle with a displacement amplitude of 20 mm, the vertical cracks on one side of the pier column, adjacent to the horizontal actuator, became notably more prominent and displayed a penetrating phenomenon when the displacement reached 20 mm. Once the displacement amplitude surpassed 20 mm, concrete spalling occurred in the corner regions, and the load-displacement curve began to decline. Despite repeated loading cycles with a 20 mm displacement amplitude, the vertical cracks continued to develop, albeit with insignificant changes in their width.
For the 30 mm displacement amplitude cycle, concrete peeling was observed at the beginning of the first column. During the third cycle of loading, the pier column concrete experienced significant falling. During the 50 mm displacement amplitude cycle, vertical cracks in the concrete continued to expand, and the crushing area expanded further, resulting in concrete peeling off in sheets. Upon completion of the first loading cycle with a 70 mm displacement amplitude, the longitudinal tendon became exposed and showed significant bending, while the stirrups contracted. During the cyclic loading, the fracture of the longitudinal tendon could be heard, and the final height of the vertical crack reached approximately 650 mm. Fig. 9a illustrates the crack development process and failure pattern of the CN1 pier column, while Fig. 9b depicts the corresponding load-displacement curve.
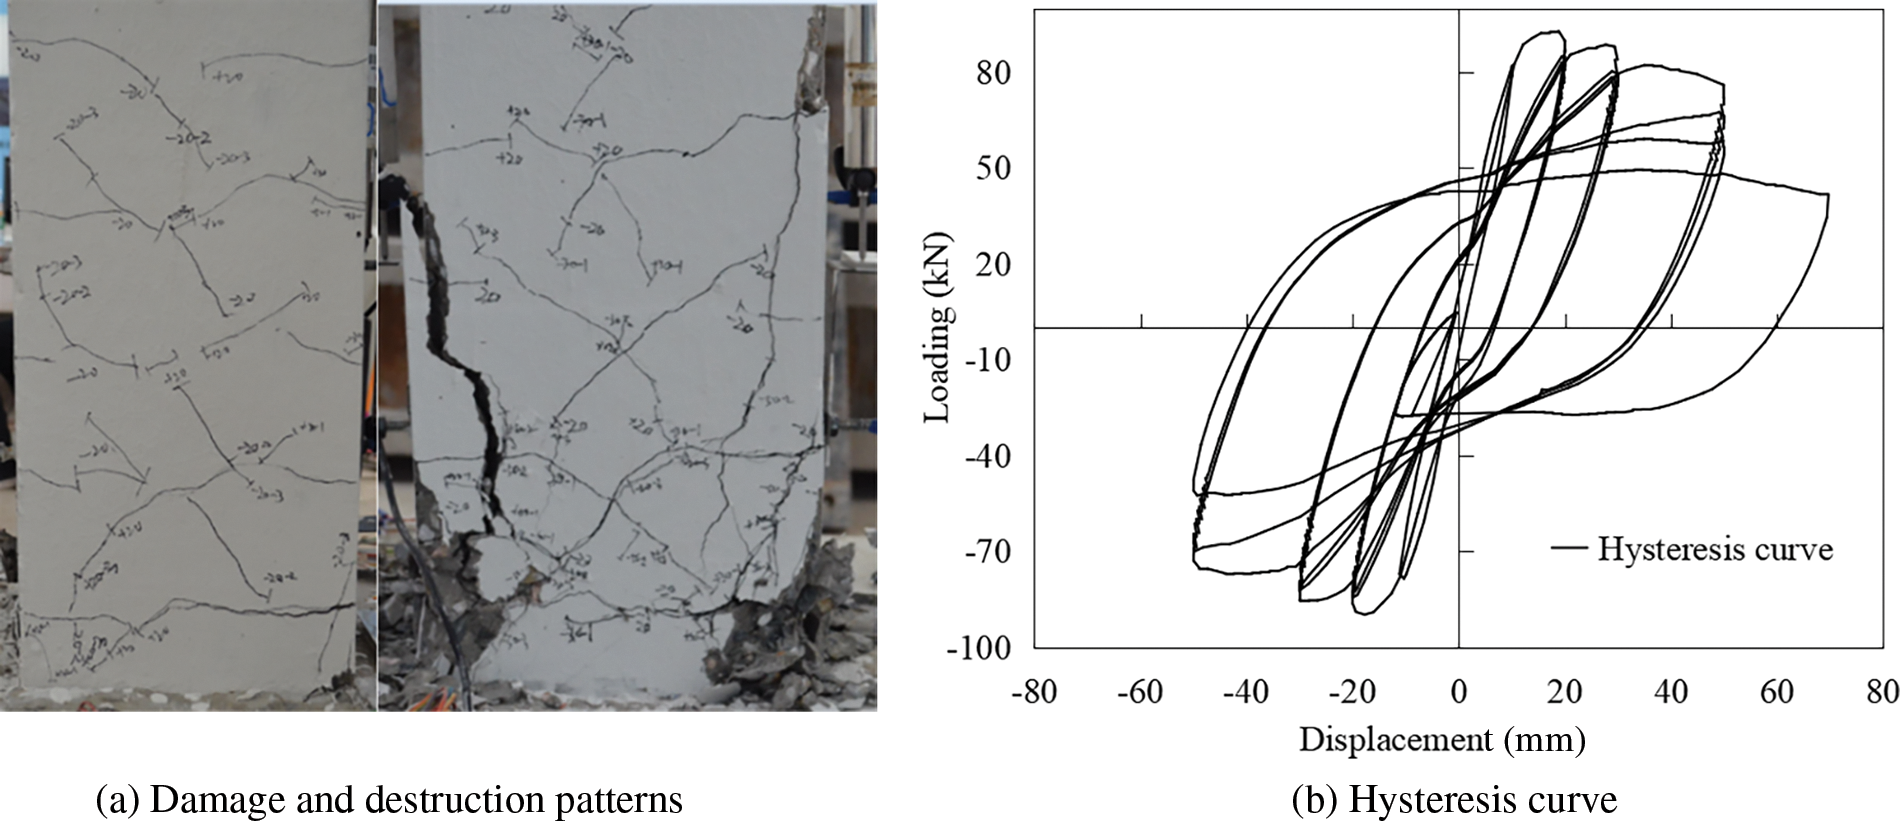
Figure 9: Failure mode and hysteresis curve of specimen CN1
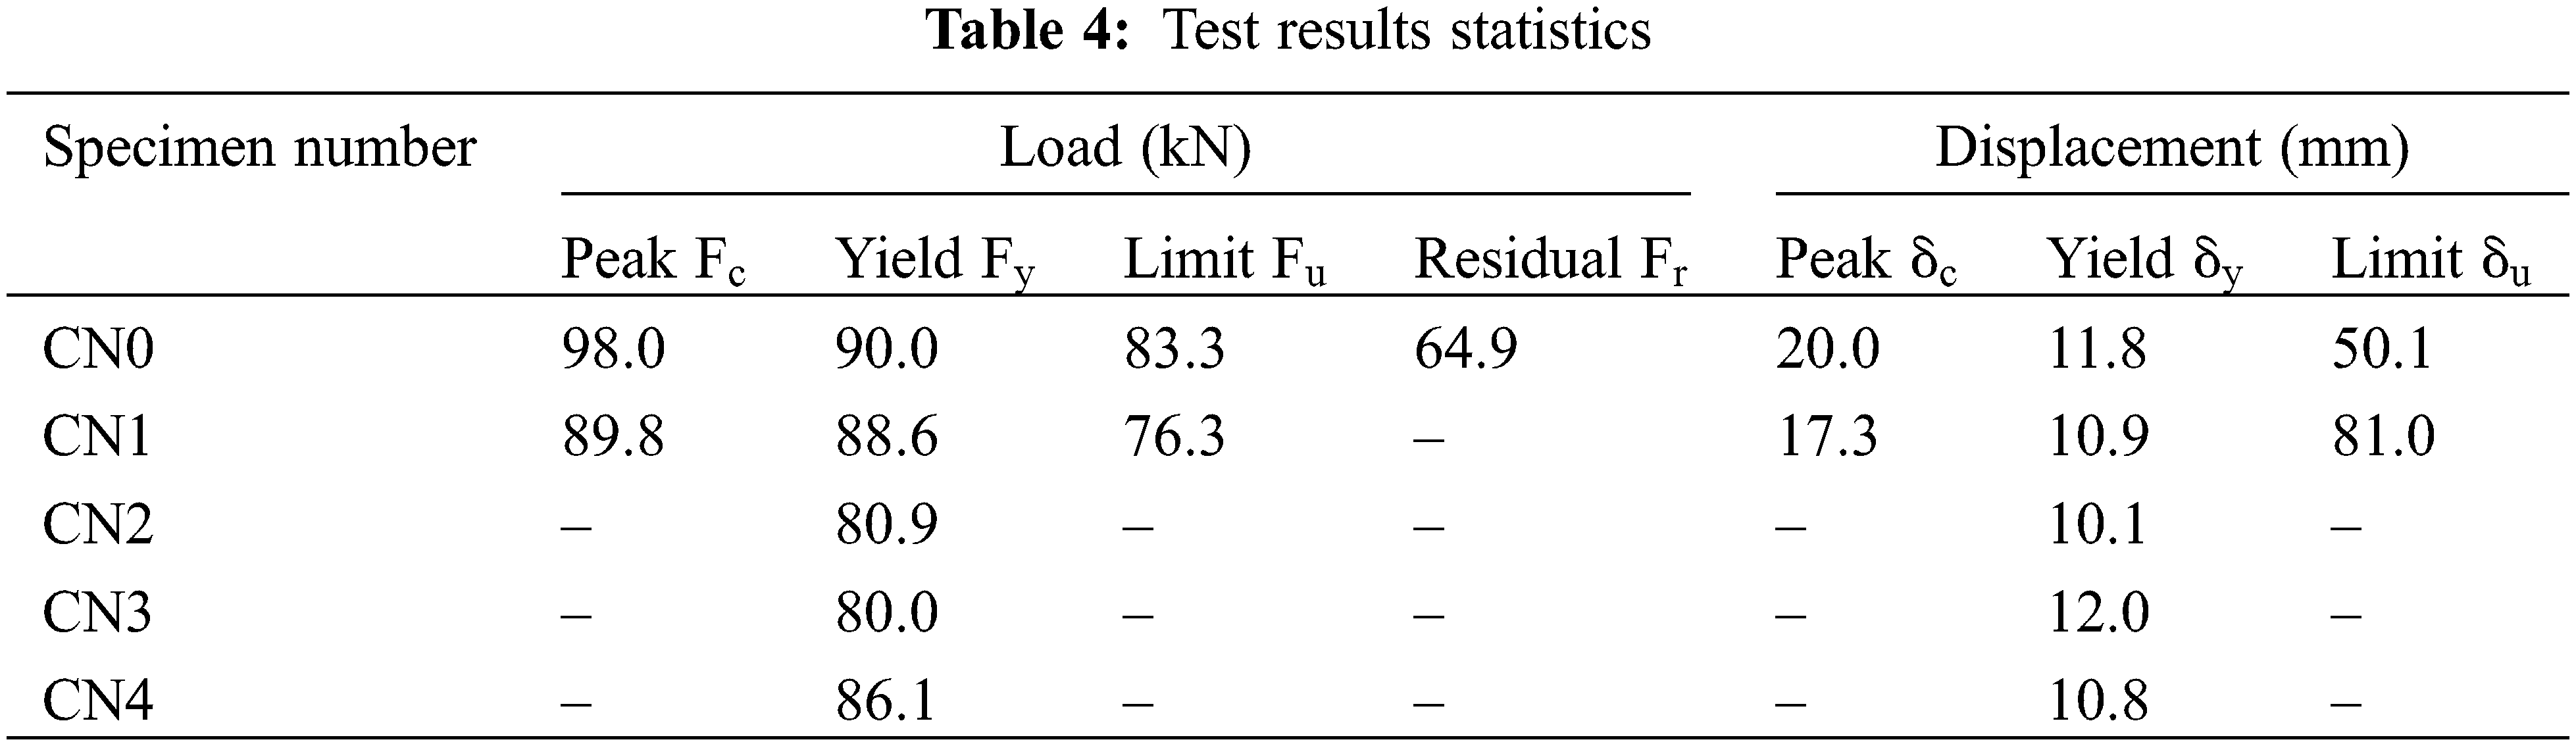
By comparing the test results of specimens CN0 and CN1, it is evident that the bearing capacity of specimen CN1 experiences a significant decrease once the displacement load reaches 50 mm. Therefore, for specimen CN0, the point at which the bearing capacity drops by 15% is adopted as the limit point [20–22], marking the turning point where the stiffness of the pier column undergoes a significant change at the yield point. Table 4 summarizes the performance characteristics of the CN0 piers. The analogous performance characteristic points of the CN1 pier column, derived using the same methodology, are also presented in Table 4.
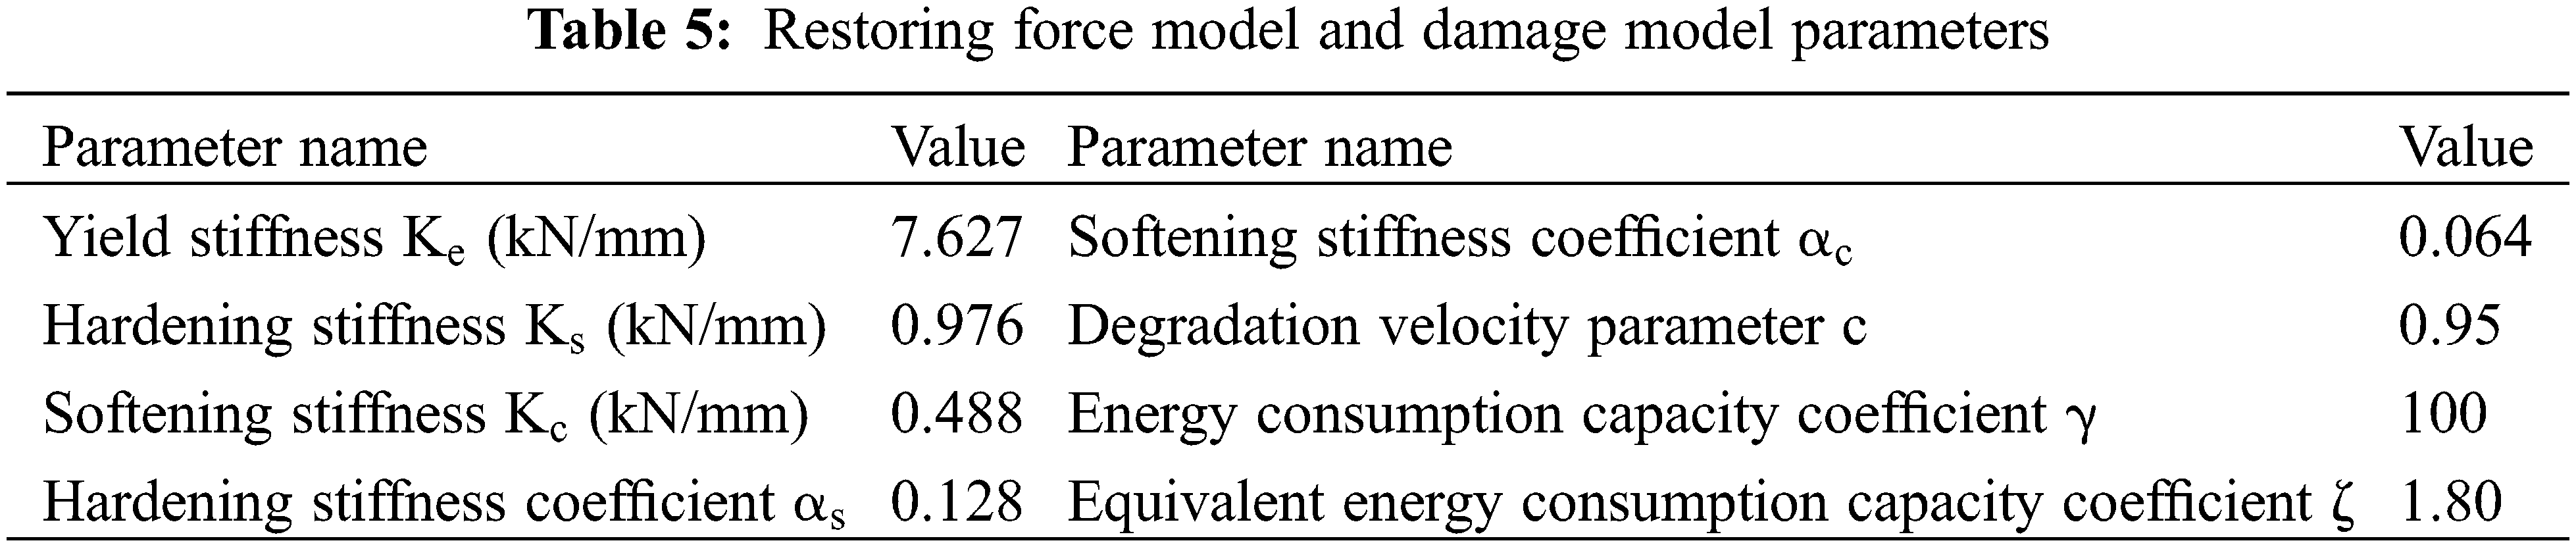
As delineated above, the proposed hysteretic energy dissipation capacity coefficient for the damage model in this paper is grounded in the IMK model [17]. This coefficient necessitates calibration and determination based on the empirical test results. Furthermore, the ultimate displacement value under the monotone loading mode must be ascertained through a static loading test.
The IMK model, comprising two-line models, pinch models, and peak-pointing models, has garnered significant attention and widespread application in the research of reinforced concrete pier columns in recent years. This model considers the degradation of both strength and stiffness, with the degradation commencing from the load-displacement curve of the pier column under monotonic loading conditions. The determination of the load-displacement curves under monotonic loading relies on five key parameters: initial stiffness
where,
By utilizing the IMK restoring force model to fit and optimize the test results of specimen CN1, the energy dissipation capacity coefficient of the pier can be derived. Once the energy dissipation capacity is established, the equivalent energy dissipation capacity coefficient can be calibrated under the condition that the limit point damage index equals 1. Prior to calibration, it is imperative to establish the load-displacement curve parameters (known as the skeleton curve) of specimen CN0 under static loading conditions, as outlined in Reference [17]. The yield strength, peak strength, and residual strength of specimen CN0 are presented in Table 3. Figs. 10 and 11 illustrate the fitting results, and the corresponding parameters of the restoring force model are detailed in Table 4.
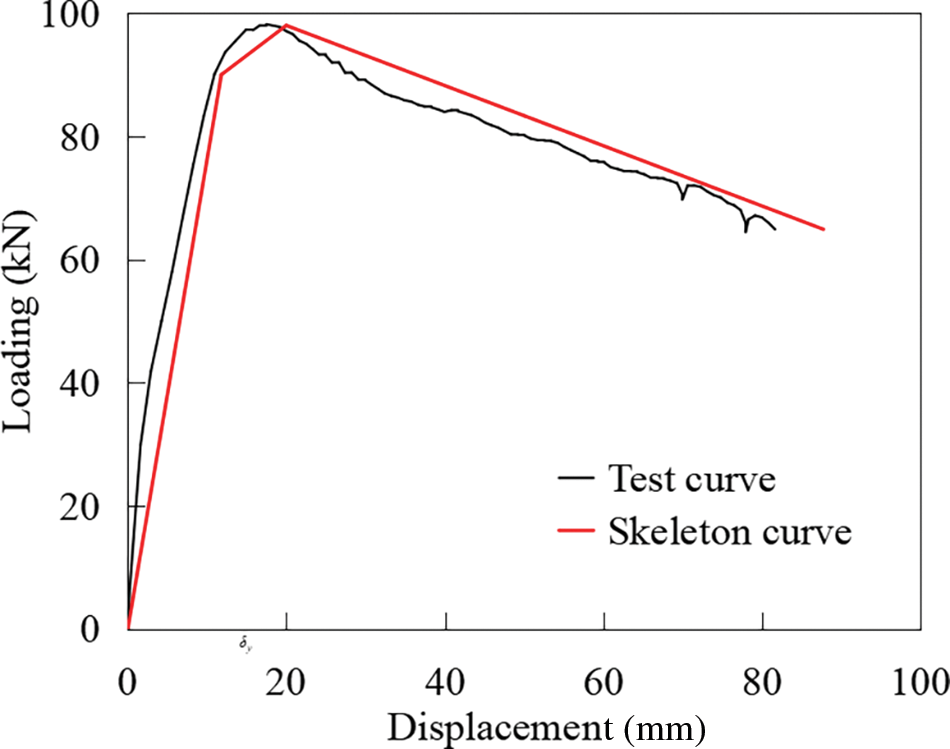
Figure 10: Fitting of the skeleton curve
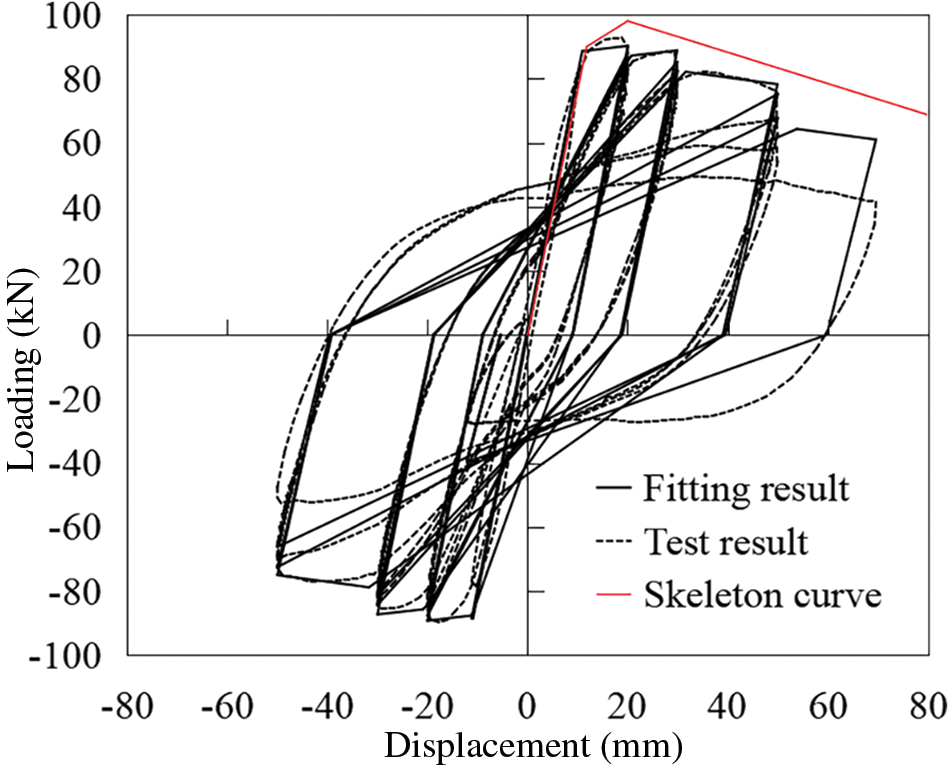
Figure 11: Trial CN1 retardation curve fitting
After the parameters of the damage model were determined, the damage indices of the CN0 and CN1 piers were calculated separately, and the results are presented in Fig. 12a,b. In the figure, the test value refers to the value obtained directly from the experimental data, while the calculated value is derived using the relevant parameters specified in Eq. (1) and Table 5. Notably, the calculated value for specimen CN0 is 1.
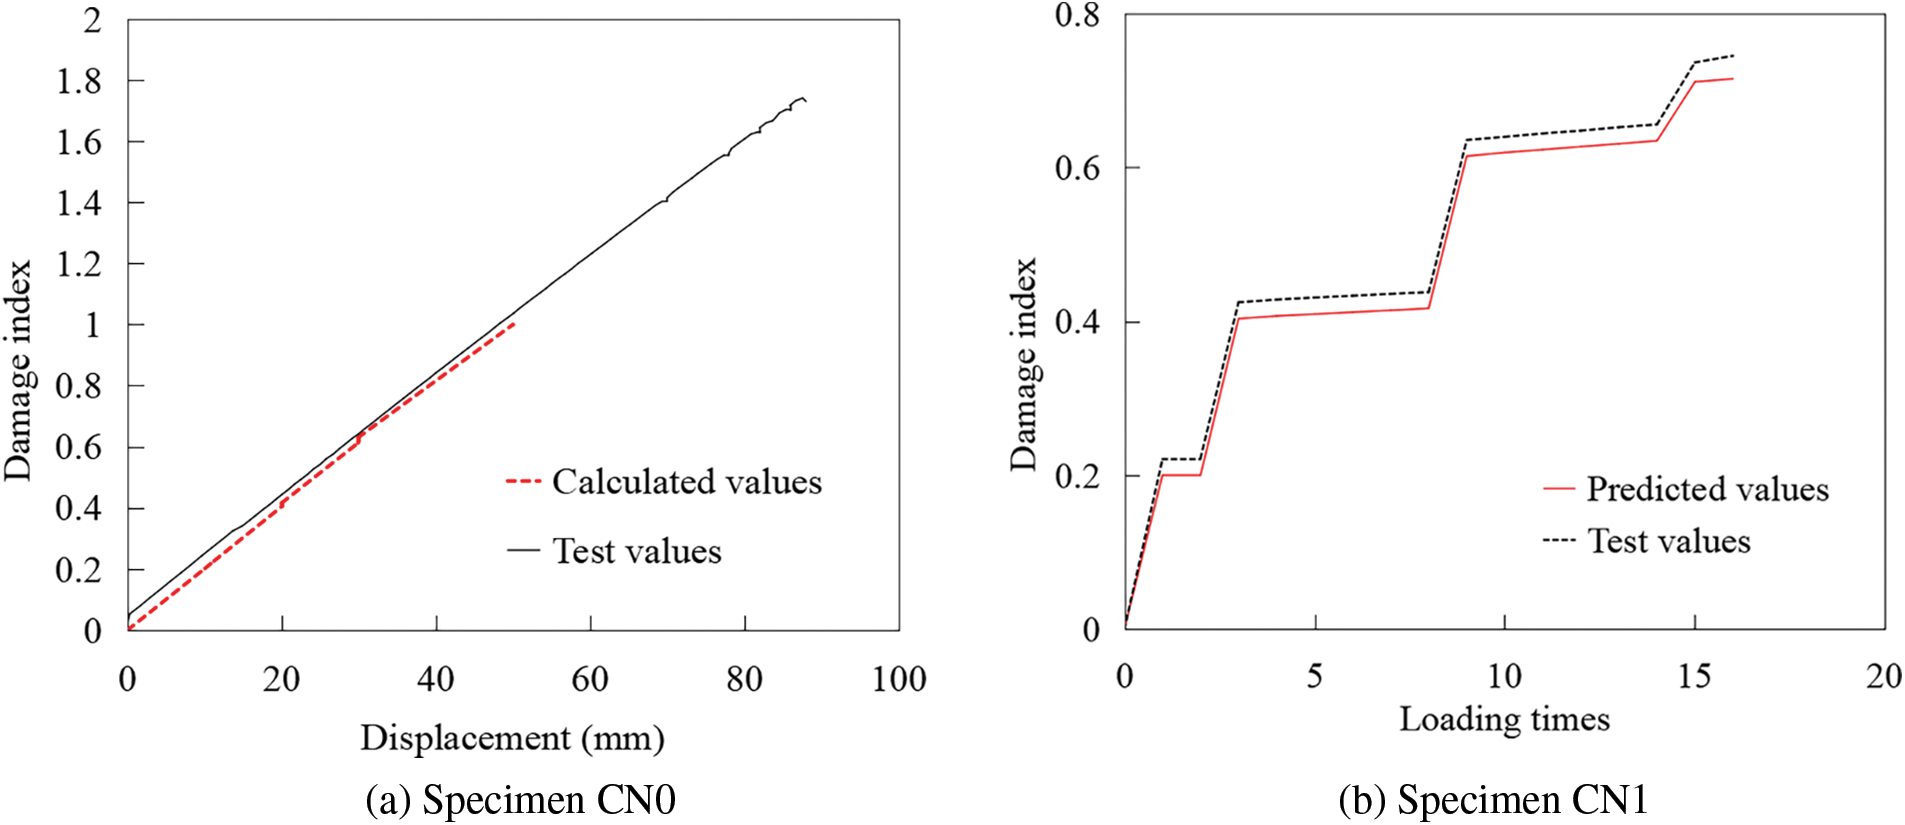
Figure 12: Damage index test value and calculated value
As evident from the figure, the damage index of the CN0 specimen, which bears a static load, increases linearly until failure. This trend aligns with the characteristics of static loading. In contrast, for the CN1 specimen that undergoes repeated push-pull loading, the damage index gradually increases with the increasing number of loading cycles, ultimately reaching a threshold of 1 at failure.
The close alignment between the calculated and experimental values suggests that the two-parameter damage model effectively predicts the damage condition of pier columns under both monotonic and cyclic loading conditions.
Fig. 13a,b illustrates a comparative analysis of the damage index composition for specimens CN0 and CN1, specifically highlighting the damage index reflected by displacement and that reflected by energy consumption. As evident from the figures, the development process of damage differs significantly between monotonic loading and cyclic loading modes.
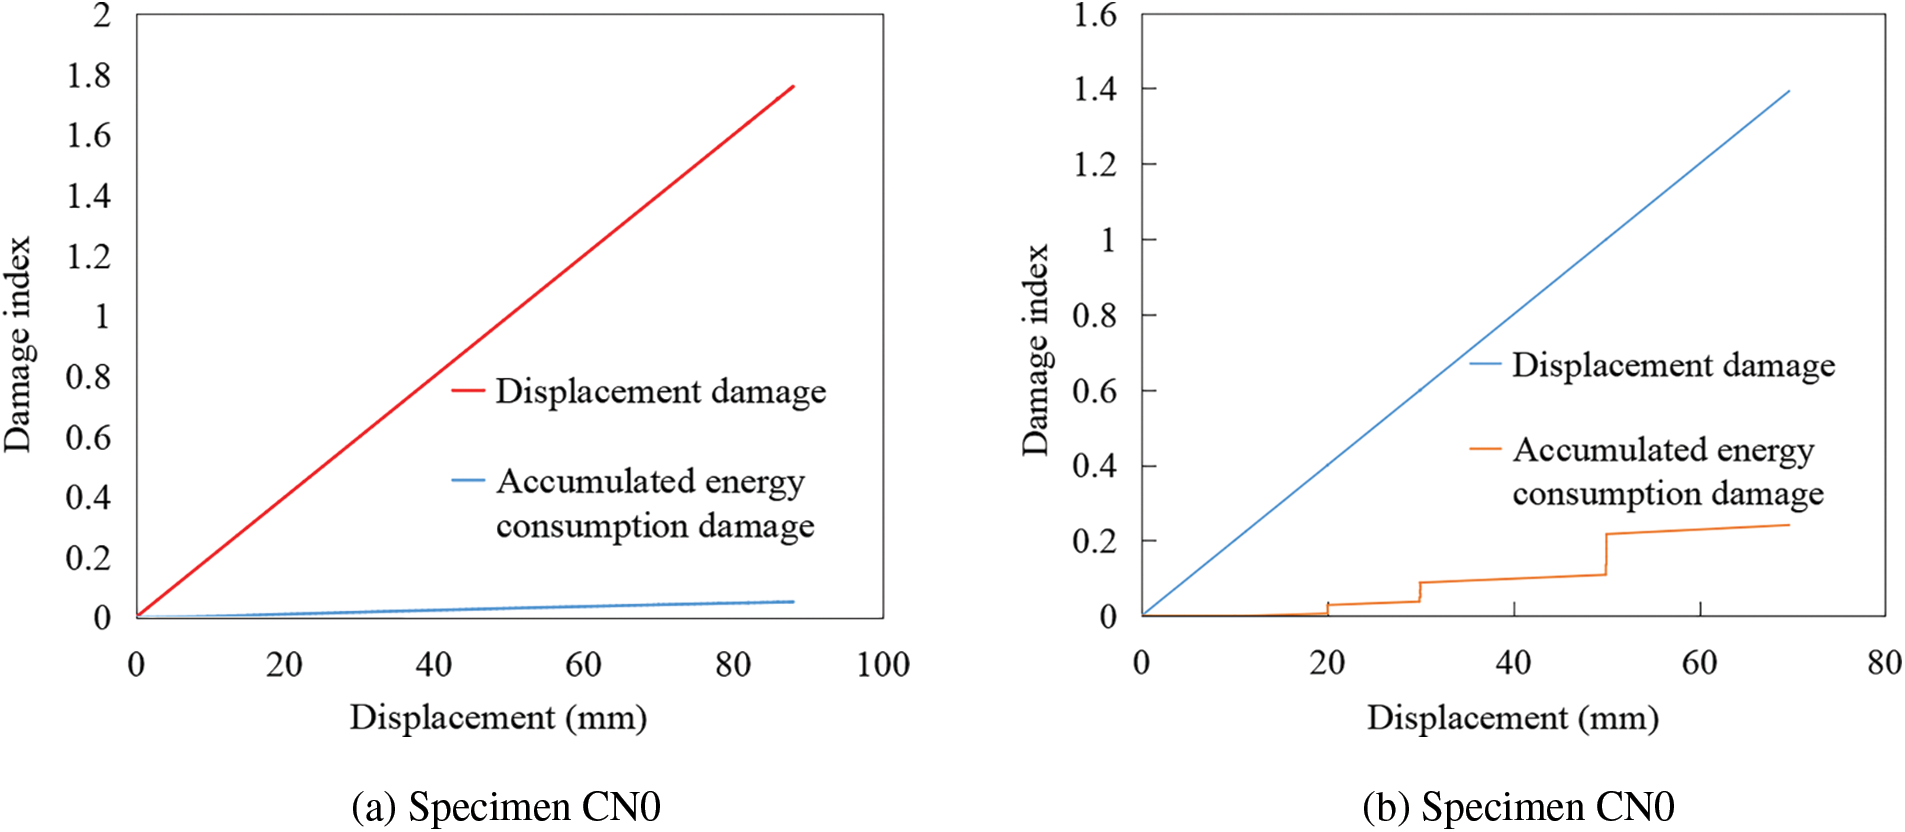
Figure 13: Composition of damage index
The loading mode of the pier column significantly impacts the evolution of damage, particularly evident in the step-wise growth pattern of energy consumption under cyclic loading. Throughout the entire process from no damage to complete failure, both displacement damage and energy consumption damage increase, but displacement damage tends to dominate.
Based on this observation, in the damage control of pier columns, displacement control can be designated as the primary method to determine the extent of damage. Monitoring and limiting displacement can provide a more effective means of assessing and managing the structural integrity and safety of pier columns, especially under cyclic loading conditions.
In this paper, the displacement loading mode was employed to achieve a quantitative control over the extent of damage inflicted on pier columns. Through this method, pre-damaged pier columns exhibiting minor, moderate, and severe damage levels were successfully obtained. The corresponding displacement load intervals associated with these three distinct levels of damage, within the same loading mode, are outlined in Table 6, which is further supported by the calculated damage index results. The categorization of damage severity is derived by quantifying the damage indices of multiple reinforced concrete columns. Based on the Reference [10], 72 RC pier columns were utilized to analyze the damage condition. According to statistics and observed phenomena, when the Damage index interval is within [0, 0.1] cracks develop without concrete crushing. When the Damage index interval falls between (0.1, 0.3], the concrete cover experiences slight crushing, and the steel reinforcement does not yield. When the Damage index interval is in the range of (0.3, 0.6], longitudinal steel bars show slight buckling, and concrete cracks and spalls. When the Damage index interval is within (0.6, 0.94], longitudinal steel bars buckle, and the concrete cover extensively spalls. When the Damage index interval exceeds 0.94, longitudinal steel bars severely buckle, stirrups break, and the concrete’s load-bearing capacity significantly decreases.
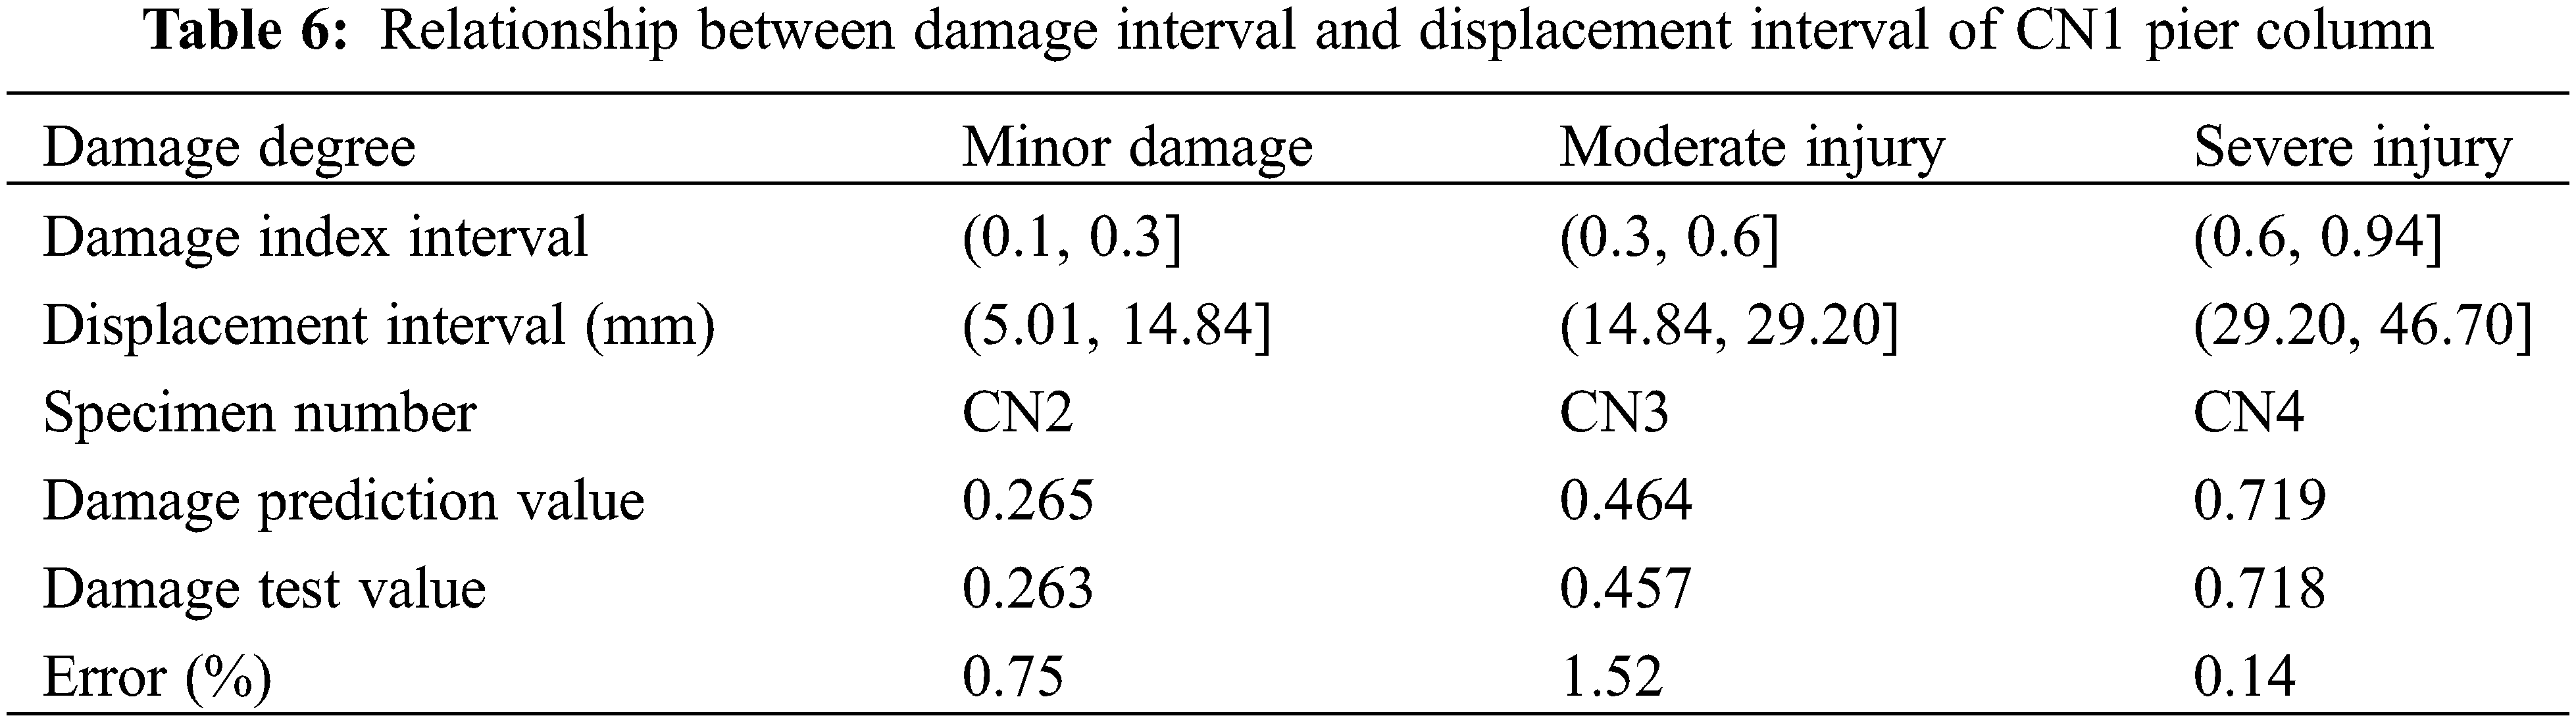
The maximum loading displacement amplitude for the minor damage design of the pier column is set at 13 mm. For the moderate damage design, the maximum loading displacement amplitude is increased to 22 mm, while for the severe damage design, it reaches 34 mm. The loading process concludes once the target loading displacement amplitude is fully achieved. The column loading patterns corresponding to the minor, moderate, and severe damage levels are illustrated in Fig. 14a–c.
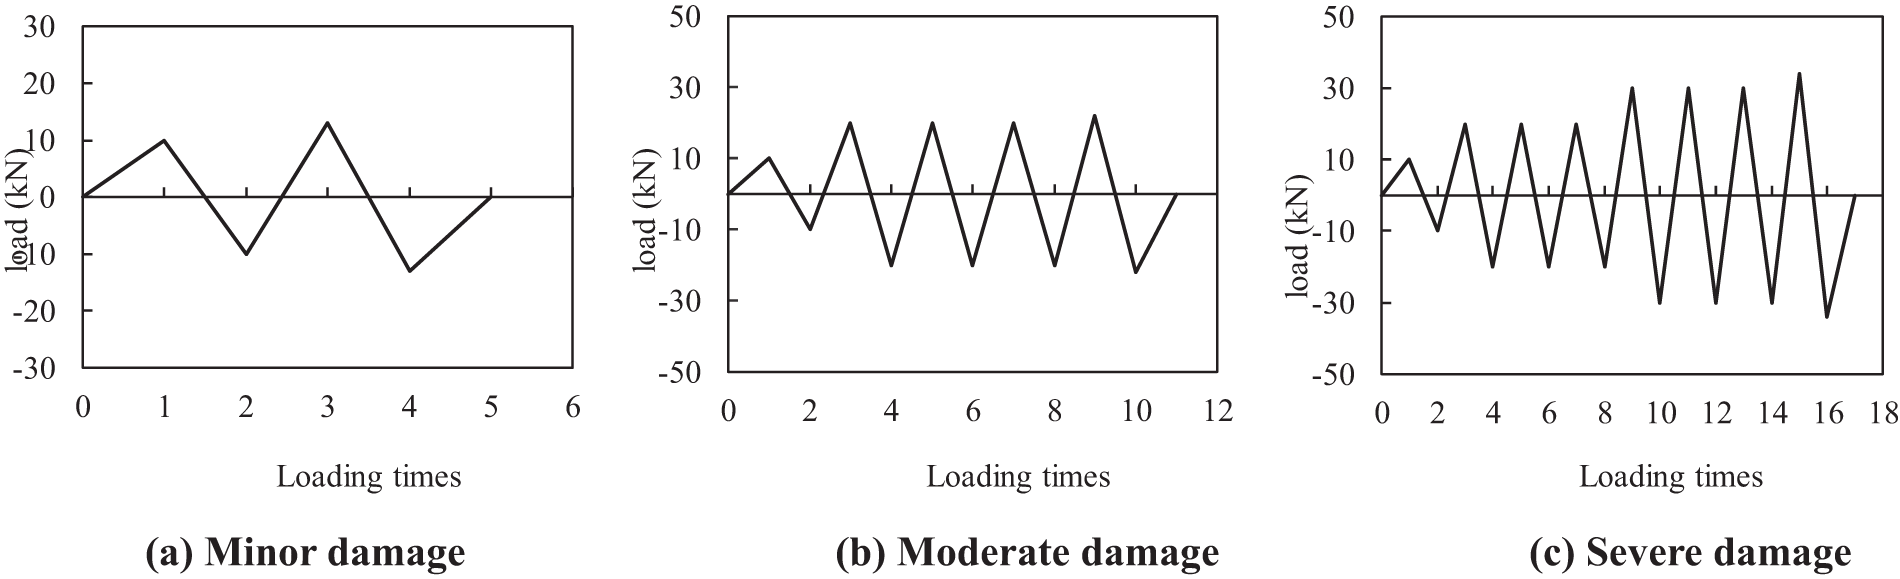
Figure 14: Predamage control test loading mode
Using the basic parameters of the CN1 pier column, a resilience model was formulated to predict the behavior of the pier column under the three displacement amplitudes: minor, moderate, and severe. As depicted in Fig. 15, under the application of the target displacement amplitudes corresponding to these three damage levels, the damage to the pier column progressively intensifies. Both the loading and unloading stiffness of the pier column exhibit significant reductions, while its hysteresis capacity gradually increases.
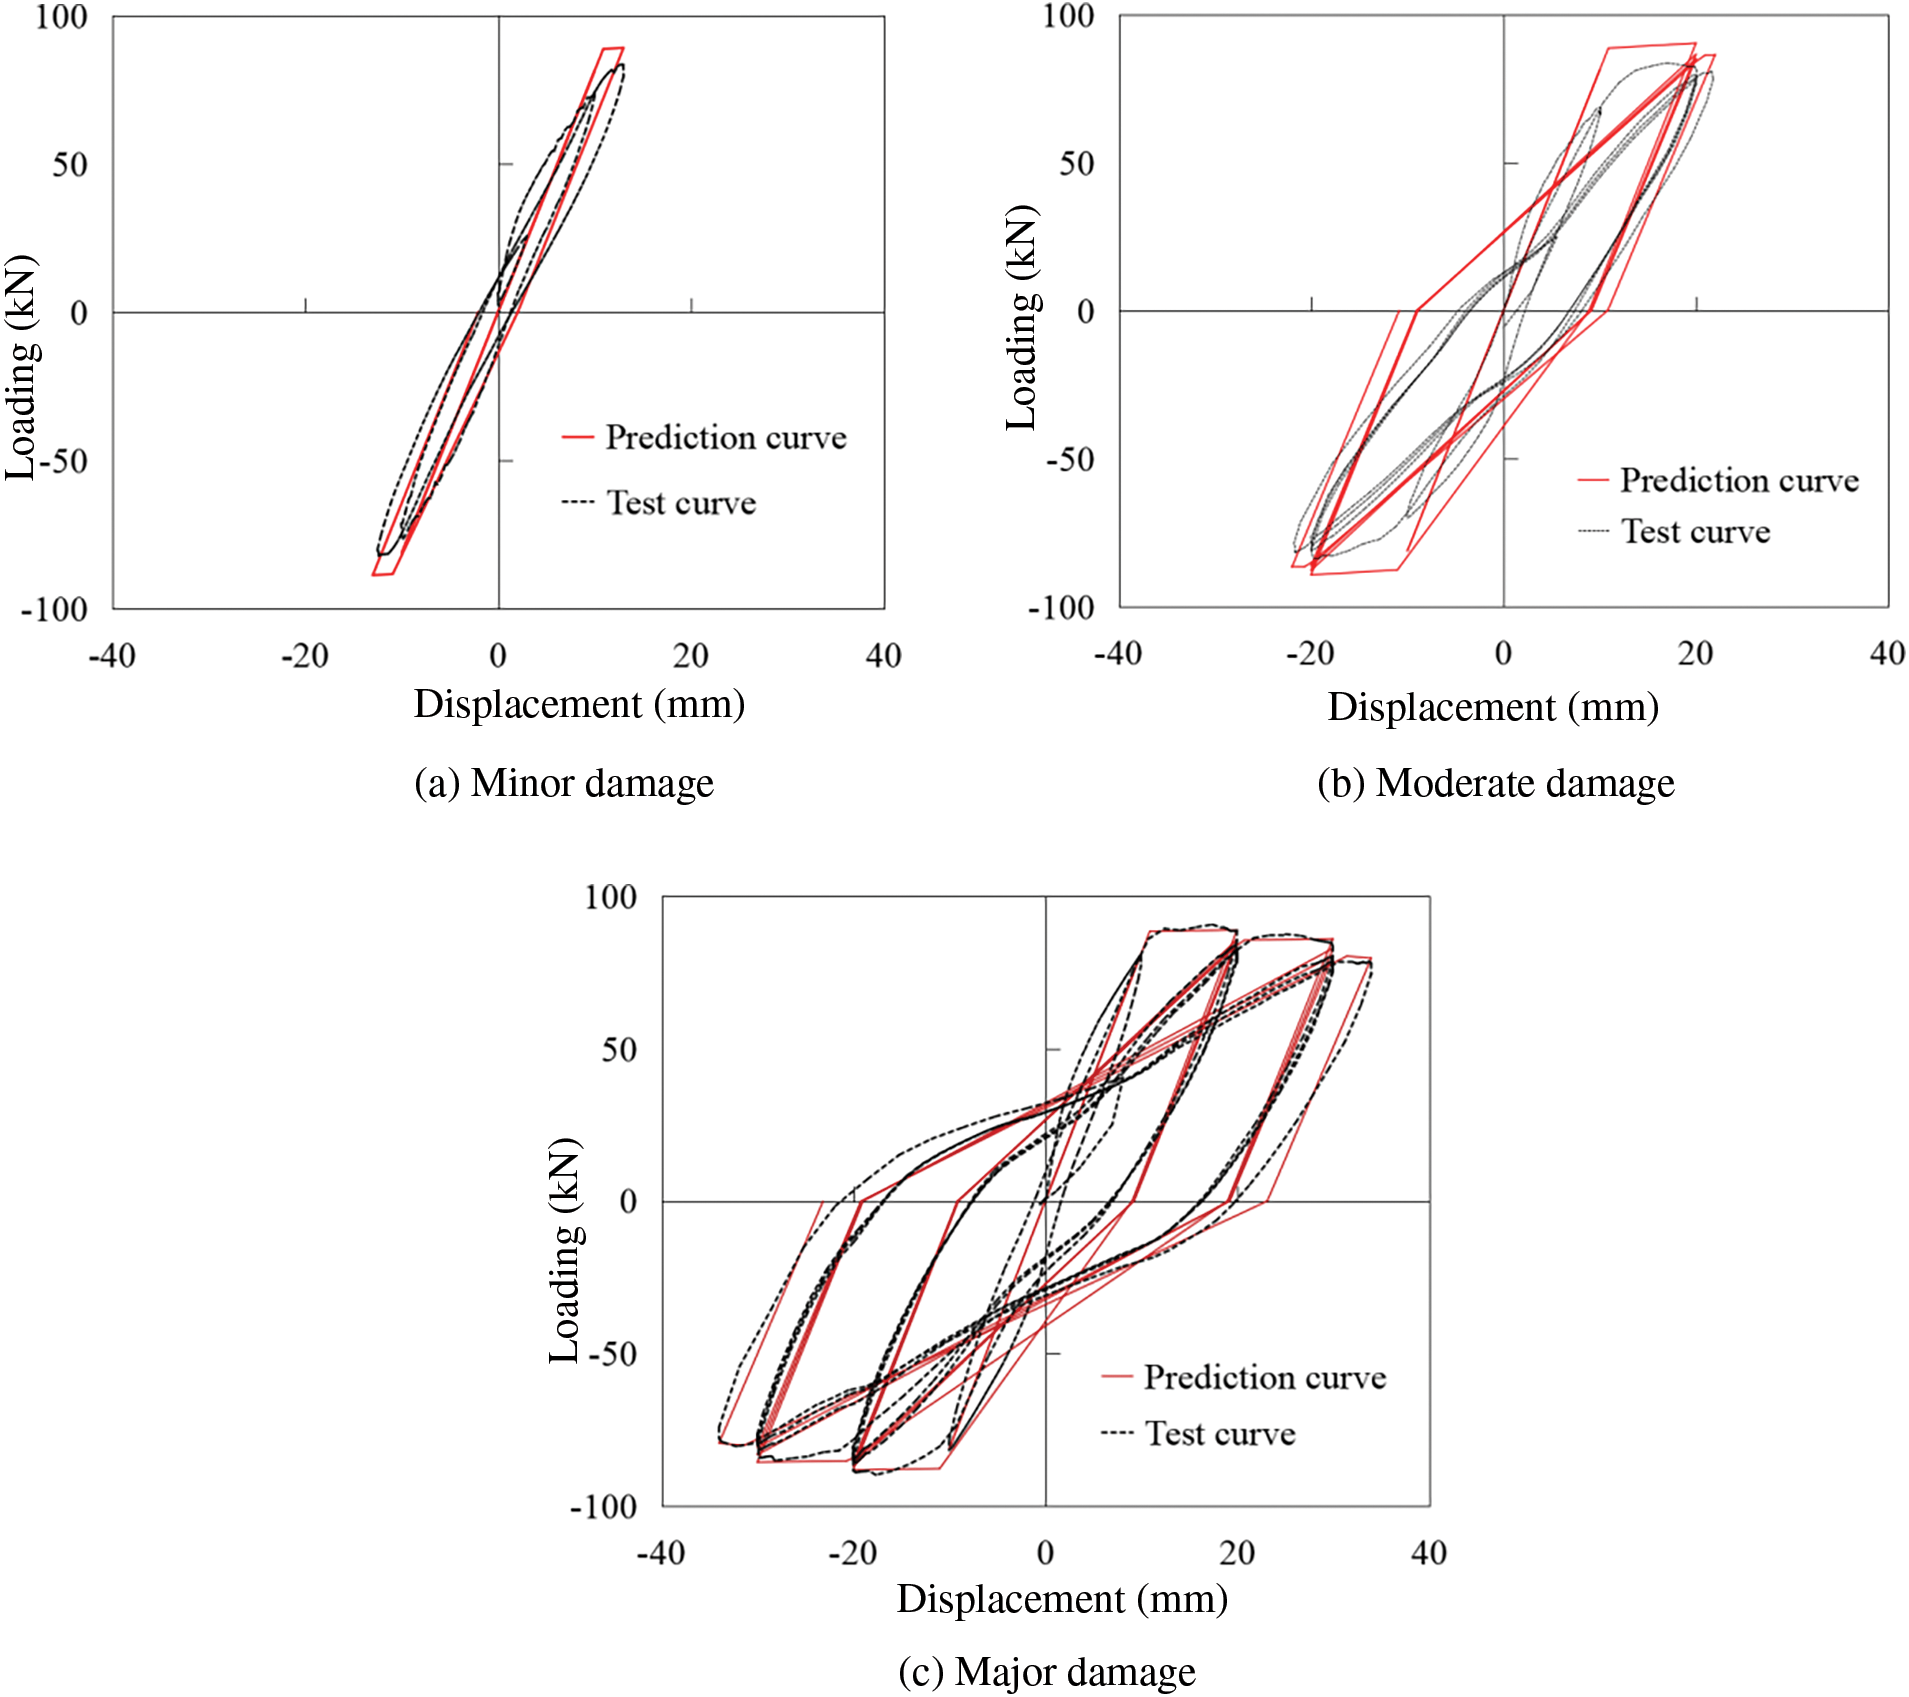
Figure 15: Predicted and test values of hysteresis curves with different degrees of damage
Fig. 16 illustrates the predicted damage index evolution with the number of loads. It is evident from the figure that the pre-designed displacement load values effectively control the damage degree of the pier column within the intended damage intervals. Specifically, the predicted damage index under minor damage is 0.26, indicating a relatively minor impact on the pier’s integrity. The moderate damage index is predicted to be 0.46, indicating a more significant degradation in the pier’s performance. Finally, under severe damage conditions, the predicted damage index reaches 0.72, suggesting a severe impairment of the pier’s structural capabilities.
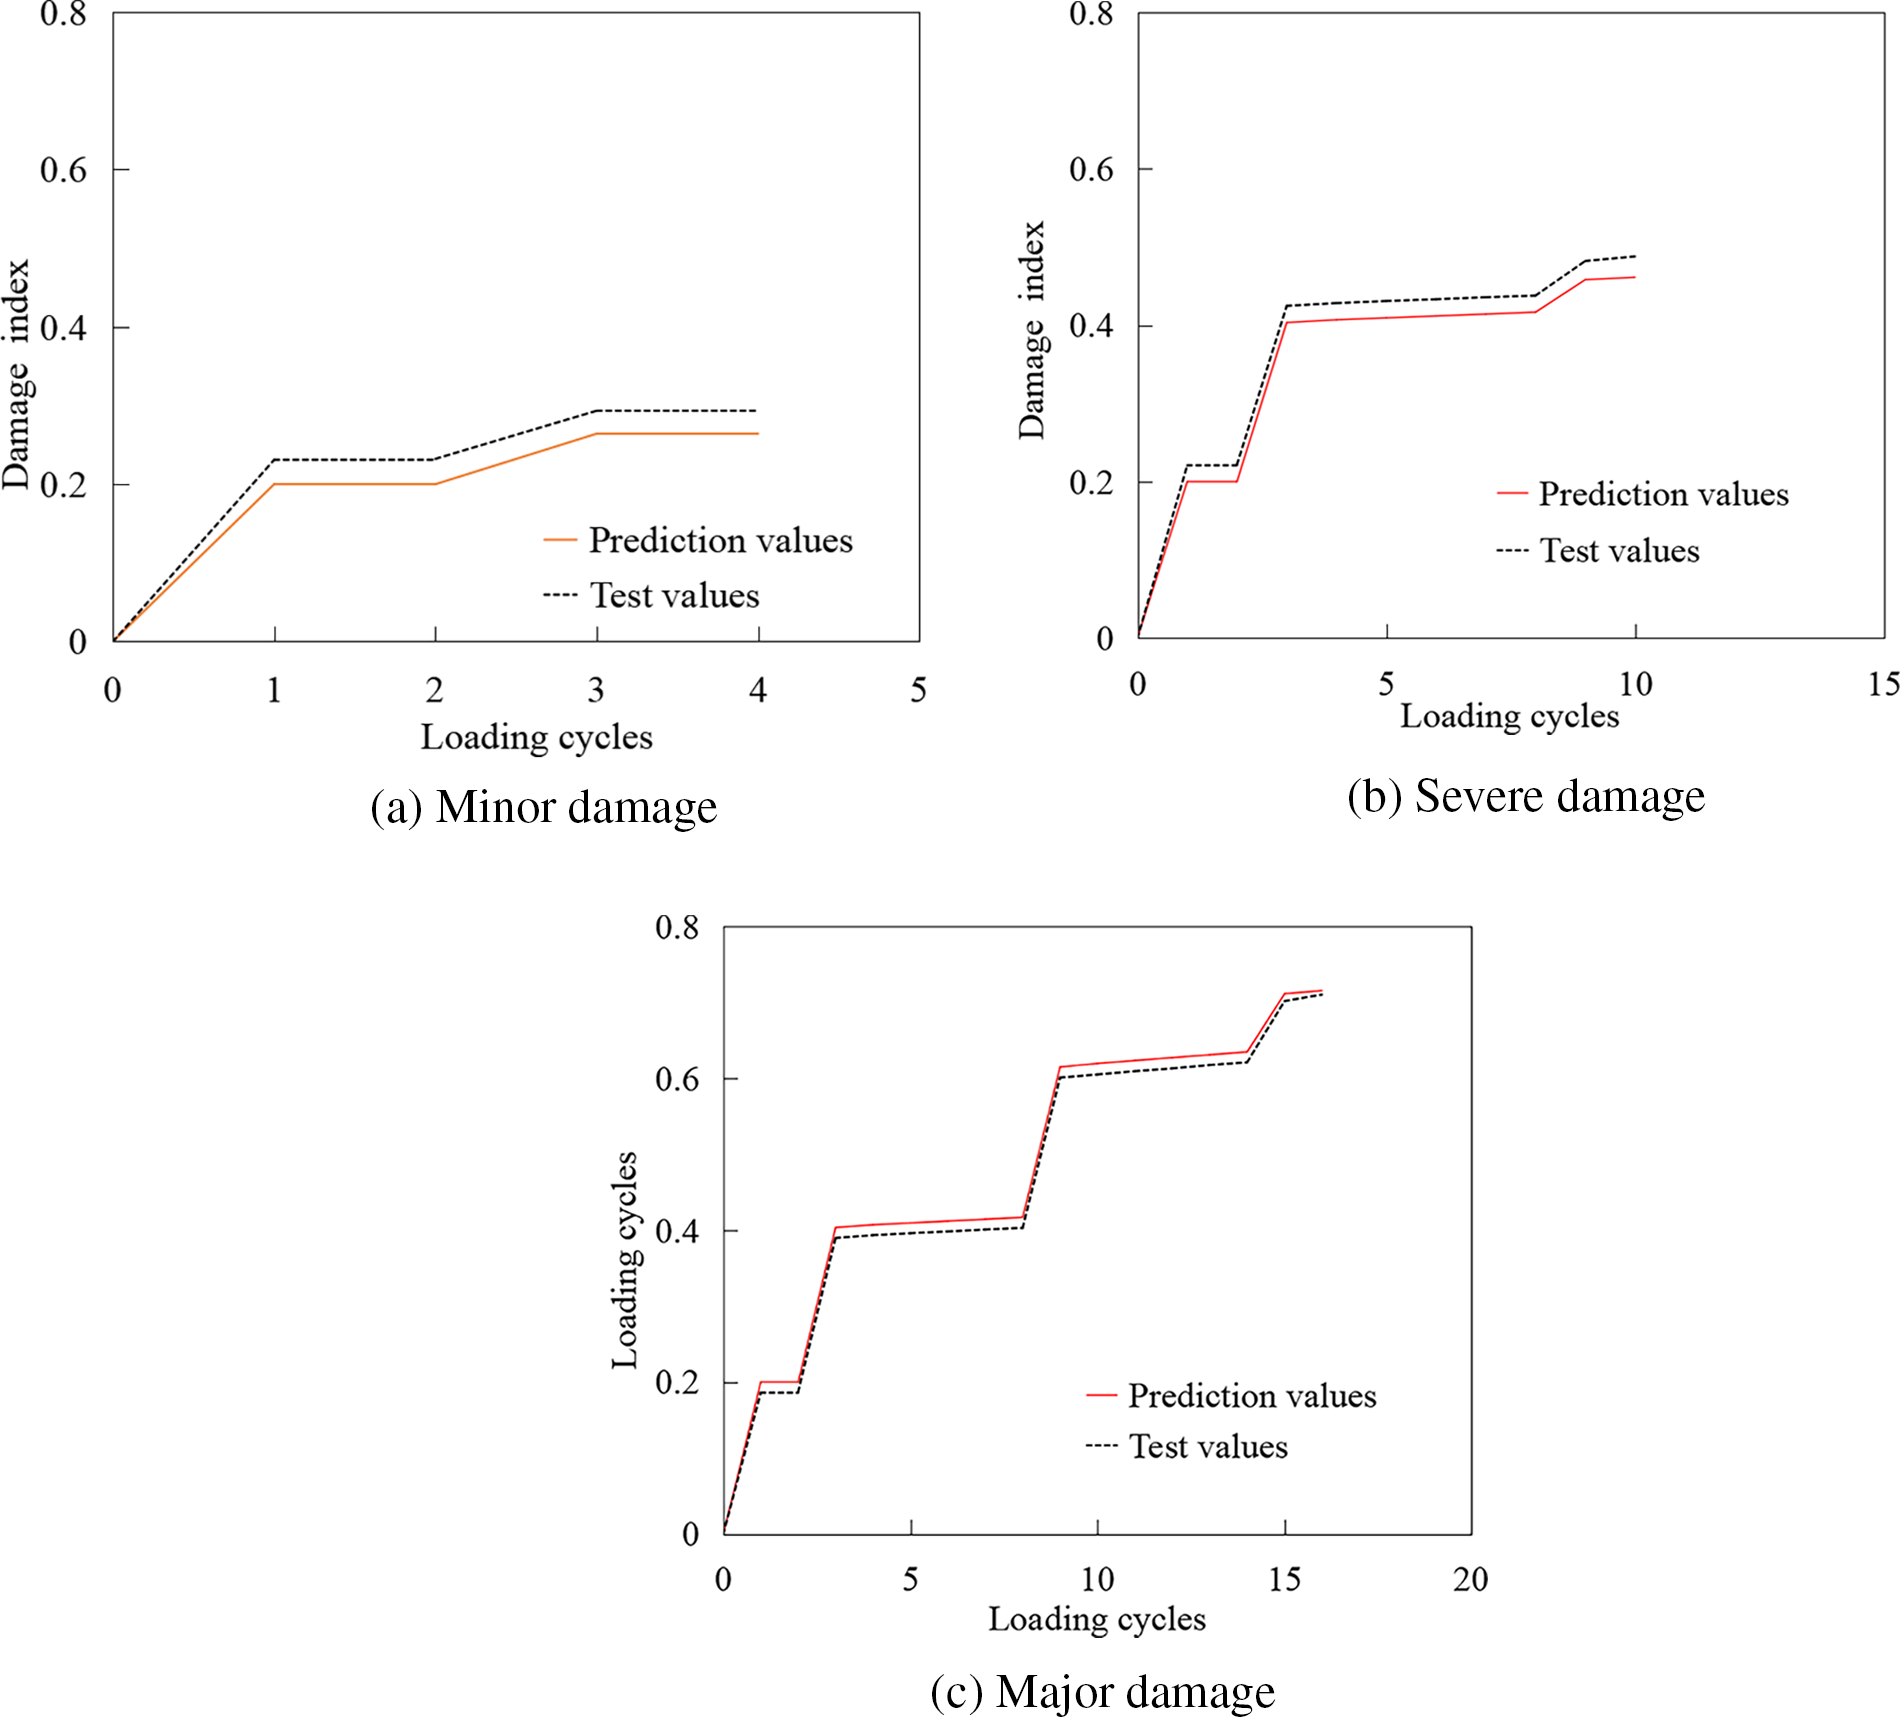
Figure 16: Predicted values and test values of damage index with different damage degree
After the target displacement loads are determined, the damage degree of the pier columns can be quantified and a pre-damage test can be conducted. The pre-damage test involves piers CN2, CN3, and CN4, which correspond to minor, moderate, and severe damage levels, respectively. The test preparation process for these piers follows the same protocol as for pier CN1, with loading applied according to the predetermined loading mode. This ensures consistency in the experimental conditions and allows for a comparison of the response of piers with varying degrees of pre-existing damage.
Fig. 17 provides a clear visualization of the different damage states observed in the test pier columns. As described, minor damage (specimen CN2) is characterized by the formation of transverse penetration cracks at the pier base, fully developed inclined cracks, and the initial appearance of vertical cracks. Moderate damage (specimen CN3) shows fully developed vertical cracks at the pier base, along with concrete peeling. Finally, severe damage (specimen CN4) its fully penetrated cracks at the loading side of the pier base, with the concrete protective layer having lost its effectiveness and fallen off in large areas.
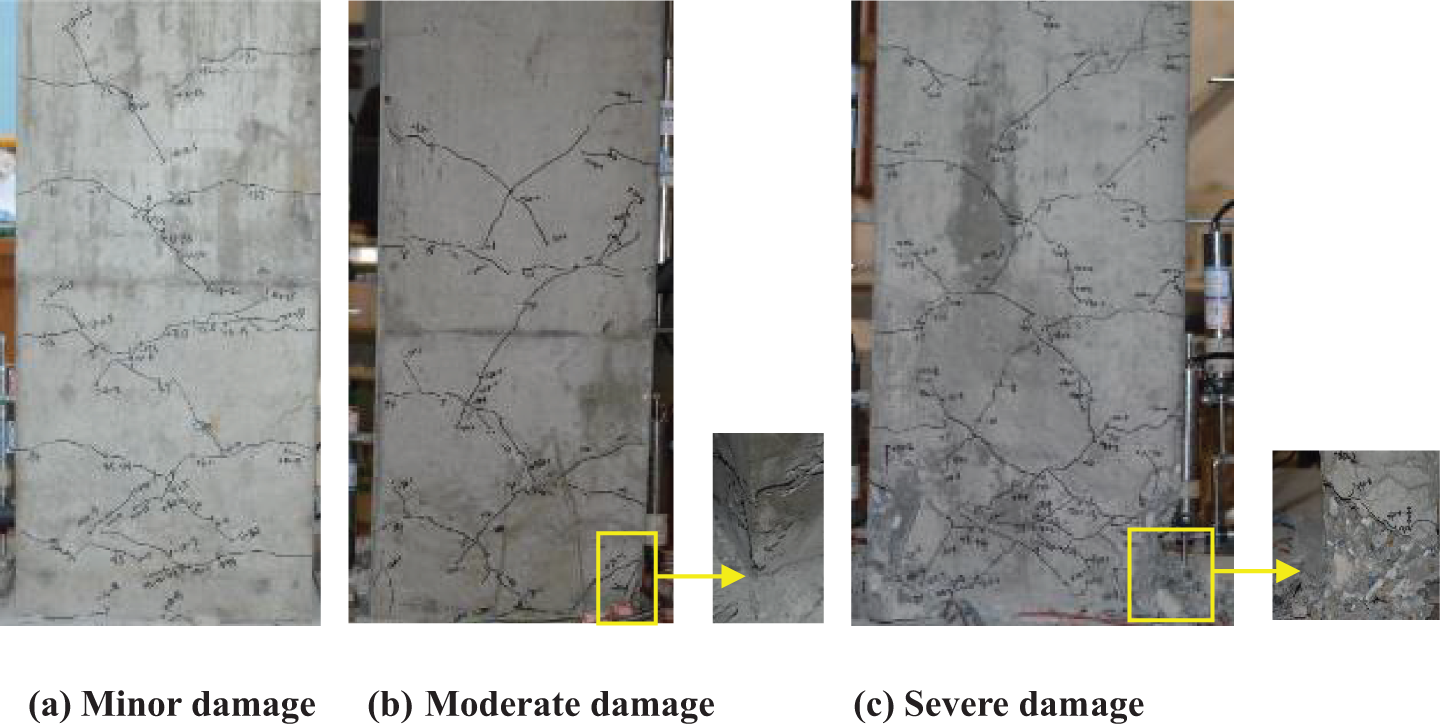
Figure 17: Observed damage state
The consistency between the observed test results and the corresponding damage intervals outlined in Table 6 validates the accuracy of the experimental procedures and analysis. This confirms that the predetermined displacement loads and loading modes were effective in inducing the desired damage levels in the pier columns. The ability to quantitatively assess and control damage levels in this manner is crucial for evaluating the performance of pier columns under different loading conditions and for developing appropriate design and retrofit strategies.
Before validating the damage index corresponding to various damage states, the pier column’s load-displacement curve was predicted utilizing the IMK resilience model, as depicted in Fig. 15. It is evident from the figure that the IMK model accurately predicts the load-displacement curve of the pier column across various damage scenarios, with the predicted load and displacement values at critical points closely aligning with the experimental data. Leveraging Eq. (1), the damage index of the tested pier column was analyzed. A comparison of the predicted and experimental values is presented in Fig. 16, and the corresponding calculation results are summarized in Table 6. According to the findings in Fig. 16 and Table 6, it is apparent that the pre-damage condition of the pier column remains within the predetermined damage threshold, with a relative error of less than 2%. The consistency between the predicted damage index and the experimental value underscores the efficacy of the pre-damage control method proposed in this study.
Given the challenge of accurately assessing the damage degree during the reinforcement process of damaged reinforced concrete pier columns, this paper addresses this issue by initially selecting two contrasting pier columns for static push and low-cycle repeated load tests to determine the relevant parameter values. Subsequently, it employs the IMK resilience model and a damage model to predict and control the damage, ultimately achieving a pre-damaged reinforced concrete pier column that closely aligns with the target damage degree. Based on the comprehensive analysis of these studies, the paper draws the following key conclusions:
1. Compared with the specimens subjected to static load tests, the bearing capacity and deformation capacity of specimens subjected to low-cycle repeated loads are reduced significantly. In contrast, the specimen CN0, tested under monotonic loading conditions, demonstrated a higher bearing capacity and deformation resistance. However, the specimen CN1, which underwent lagging loading, exhibited varying degrees of reduction in both its bearing capacity and deformation capacity.
2. The loading mode exerts a profound influence on the damage evolution process of the pier column, and the displacement damage significantly affects the overall damage progression. Utilizing displacement control emerges as an effective damage management strategy, allowing for the damage index to be precisely controlled through repeated loading cycles and adjustments to the displacement amplitude.
3. By adopting the displacement damage control method, the loading process of the pier column was quantitatively managed, resulting in the successful creation of pier columns with minor, moderate, and severe pre-damage levels. The stagnation curve of the pier column under the respective loading modes closely followed the predetermined displacement load design values. The damage control approach outlined in this paper effectively constrained the damage degree of the pier column within the desired target range.
Acknowledgement: None.
Funding Statement: This study was financially supported by National Natural Science Foundation of China (Project No. 51878156) and EPC Innovation Consulting Project for Longkou Nanshan LNG Phase I Receiving Terminal (Z2000LGENT0399).
Authors Contributions: Zhao-Jun Zhang carried out the theoretical analysis and experimental studies, participated in the sequence alignment and drafted the manuscript. Wen-Wei Wang guided the whole study and edited the writing of the article. Jing-Shui Zhen participated in the experimental studies. Bo-Cheng Li participated in the design of the specimens and performed the experimental data analysis. De-Cheng Cai helped to draft the manuscript. Yang-Yang Du participated in data processing and article editing. All authors reviewed the results and approved the final version of the manuscript.
Availability of Data and Materials: The data and materials in the current study are available from the corresponding author on a reasonable request.
Ethics Approval: Not applicable.
Conflicts of Interest: The authors declare no conflicts of interest to report regarding the present study.
References
1. Harle SM, Sagane S, Zanjad N, Bhadauria PKS, Nistane HP. Advancing seismic resilience: focus on building design techniques. Structures. 2024;66:106432. doi:10.1016/j.istruc.2024.106432. [Google Scholar] [CrossRef]
2. Yu LF, Ma SQ, Sun JF, Kadir A. Seismic analysis of reinforced concrete bridge piers based on ductile reinforcement. KSCE J Civil Eng. 2023;27:5216–30. doi:10.1007/s12205-023-0845-y. [Google Scholar] [CrossRef]
3. Xu JG, Cai ZK, Feng DC. Life-cycle seismic performance assessment of aging RC bridges considering multi-failure modes of bridge columns. Eng Struct. 2021;244:112818. doi:10.1016/j.engstruct.2021.112818. [Google Scholar] [CrossRef]
4. Chellapandian M, Prakash SS. Rapid repair of severely damaged reinforced concrete columns under combined axial compression and flexure: an experimental study. Constr Build Mater. 2018;173:368380. [Google Scholar]
5. Jung D, Wilcoski J, Andrawes B. Bidirectional shake table testing of RC columns retrofitted and repaired with shape memory alloy spirals. Eng Struct. 2018;160:171–85. doi:10.1016/j.engstruct.2017.12.046. [Google Scholar] [CrossRef]
6. Krish ZF, Kowalsky MJ, Nau JM. Seismic repair of circular reinforced concrete bridge columns by plastic hinge relocation with grouted annular ring. J Earthq Eng. 2019;2:1–35. [Google Scholar]
7. Jain S, Chellapandian M, Prakash SS. Emergency repair of severely damaged reinforced concrete column elements under axial compression: an experimental study. Constr Build Mater. 2017;155:751761. [Google Scholar]
8. Kumar P, Mosalam K, Abbasi S, Abbasi N, Kargahi M. Reinforced concrete bridge columns repaired with fiber-reinforced polymer jackets. In: Struct Congress 2014, 2014; Boston, USA. p. 429–40. [Google Scholar]
9. Gosain NK, Brown RH, Jirsa JO. Shear requirements for load reversals on RC members. J Struct Div. 1977;103(7):1461–75. doi:10.1061/JSDEAG.0004677. [Google Scholar] [CrossRef]
10. Cao X, Wang W, Song Y. Calculation method of damage index of reinforced concrete pier column under earthquake. J Arch Sci Eng. 2019;36(1):85–92 (In Chinese). [Google Scholar]
11. Mehanny SSF. Modeling and assessment of seismic performance of composite frames with reinforced concrete columns and steel beams (Ph.D. Thesis). Stanford University: California; 2000. [Google Scholar]
12. Huang W, An Y, Miao X, Quan W, Wang M. Research on seismic behavior and shear strength of precast composite walls with different reinforced concrete braces. Structures. 2024;61:106067. doi:10.1016/j.istruc.2024.106067. [Google Scholar] [CrossRef]
13. Kratzig WB, Meyer IF, Meskouris K. Damage evolution in reinforced concrete members under cyclic loading. In: Proceedings 5th International Conference on Structural Safety and Reliability (ICOSSAR 891989. vol. 2, p. 795–802. [Google Scholar]
14. Azandariani MG, Azandariani AG, Rousta AM, Nia HM. Seismic fragility assessment of reinforced concrete moment frames retrofitted with strongback braced system. Results Eng. 2023;20:101504. doi:10.1016/j.rineng.2023.101504. [Google Scholar] [CrossRef]
15. Niu D, Ren L. Improved two-parameter earthquake failure model of reinforced concrete structures. Earthq Eng Eng Vibrat. 1996;16(4):44–54 (In Chinese). [Google Scholar]
16. Wang D, Feng Q, Wang G. An improved Park-Ang seismic damage model considering low cycle fatigue life. J Civil Eng. 2004;37(11):41–9 (In Chinese). [Google Scholar]
17. Ibarra LF, Medina RA, Krawinkler H. Hysteretic models that incorporate strength and stiffness deterioration. Earthquake Eng Struct Dyn. 2005;34(12):1489–511. doi:10.1002/(ISSN)1096-9845. [Google Scholar] [CrossRef]
18. Feng P, Qiang H, Ye L. Definition and discussion of “Yield Point” for materials, members and structures. Eng Mech. 2017;34(3):11 (In Chinese). [Google Scholar]
19. Berry MP, Eberhard MO. Performance models for flexural damage in reinforced concrete columns. In: PEER report 2003-18. Berkeley, CA: Pacific Earthquake Engineering Research Center, University of California; 2004. [Google Scholar]
20. National Standards of the People’s Republic of China. Steel for reinforced concrete–part 2: hot-rolled ribbed bars. GB/T 1499.2-2018. Beijing: China Construction Industry Press; 2018 (In Chinese). [Google Scholar]
21. Ibarra LF, Krawinkler HA. Global collapse of frame structures under seismic excitations (Dissertation). Stanford University: California; 2004. [Google Scholar]
22. Zhang LW, Lu ZH, Chen C. Seismic fragility analysis of bridge piers using methods of moment. Soil Dyn Earthq Eng. 2020;134:106150. doi:10.1016/j.soildyn.2020.106150. [Google Scholar] [CrossRef]
Cite This Article
 Copyright © 2025 The Author(s). Published by Tech Science Press.
This work is licensed under a Creative Commons Attribution 4.0 International License , which permits unrestricted use, distribution, and reproduction in any medium, provided the original work is properly cited.
 Downloads
 Citation Tools