 Open Access
ARTICLE
Life-Cycle Bearing Capacity for Pre-Stressed T-beams Based on Full-Scale Destructive Test
1 China Construction Seventh Engineering Division Corp., Ltd., Zhengzhou, 450004, China
2 School of Water Conservancy and Transportation, Zhengzhou University, Zhengzhou, 450001, China
* Corresponding Author: Heng Liu. Email:
(This article belongs to the Special Issue: Advanced Data Mining in Bridge Structural Health Monitoring)
Structural Durability & Health Monitoring 2025, 19(1), 145-166. https://doi.org/10.32604/sdhm.2024.053756
Received 09 May 2024; Accepted 24 July 2024; Issue published 15 November 2024
Abstract
To investigate the evolution of load-bearing characteristics of pre-stressed beams throughout their service life and to provide a basis for accurately assessing the actual working state of damaged pre-stressed concrete T-beams, destructive tests were conducted on full-scale pre-stressed concrete beams. Based on the measurement and analysis of beam deflection, strain, and crack development under various loading levels during the research tests, combined with the verification coefficient indicators specified in the codes, the verification coefficients of bridges at different stages of damage can be examined. The results indicate that the T-beams experience complete, incomplete linear, and non-linear stages during the destructive test process. In the complete linear elastic stage, both the deflection and bottom strain verification coefficients comply with the specifications, indicating a good structural load-bearing capacity no longer adheres to the code’s requirements. In the non-linear stage, both coefficients exhibit a sharp increase, resulting in a further decrease in the structure’s load-bearing capacity. According to the provisions of the current code, the beam can be in the incomplete linear stage when both values fall within the code’s specified range. The strain verification coefficient sourced from the compression zone at the bottom of the flange is not recommended for assessing the bridge’s load-bearing capacity.Keywords
Pre-stressed concrete T-beams have been widely used in bridge construction projects because of their large span, low cost, and large bearing capacity. However, with the increase of the bridge’s service time, the beam’s pre-stressed continues to lose, weakening its bending and shear resistance, resulting in cracks, deflections, and other diseases of the beam, bringing great hidden dangers to traffic safety [1]. Therefore, it is of great significance to study the structural state of the bridge during its damage process and understand the change of the structural state during its whole life process.
The bridge load test is used to evaluate the bearing capacity of bridges, which is widely used in the acceptance of new bridges and the bearing capacity testing of old bridges [2,3]. With the increasing service life of bridges, many scholars began to use load test methods to assess the bearing capacity of reinforced bridges [4,5]. In recent years, bridge construction technology has been continuously developed, and bridge-bearing capacity assessment technology based on static load tests has been applied to a variety of new bridges [6,7]. However, in the process of using static load test to assess the bearing capacity of bridges, the full-scale test is expensive and difficult to implement, and few scholars conduct destructive tests on new full-scale bridges to study the changing trend of bearing capacity of new bridges in the destructive process [8]. In this research field, small-scale models or demolished bridges are often used to conduct destructive tests [9,10]. For the small-scale model, the test results can not reflect the real stress state of the structure in some aspects. For dismantled bridges, the mechanical properties and bearing capacity obtained by the test are often smaller than the test value of the bridge in good condition due to the accumulation of various damages during service [11]. Through the method of dynamic and static load tests of real bridges, the actual stress condition of the bridge under operational load can be judged, but it is not possible to accurately deduce the real bearing capacity of bridges for operational loads in the process of their destruction [12]. Therefore, conducting destructive tests on new full-length prestressed T-beams and exploring the structural changes during the destructive process can provide a reference for the structural evaluation of pre-stressed T-beams with damage, which has significant engineering significance.
In terms of the destructive test of a new pre-stressed concrete bridge, Fang et al. [13] carried out the destructive test on a 30 m full-scale pre-stressed concrete box girder, evaluated the applicability of the corresponding calculation formula in the code to the pre-stressed concrete box girder, and compiled a well-applicable program for the whole process of force performance analysis of the box girder. Subsequently, Yu et al. [14] conducted destructive tests to analyze the variations in the bearing capacity and stiffness of a 30-m pre-stressed concrete box girder and put forward the calculation formula of the residual bearing capacity based on the reduction coefficient of flexural stiffness. In addition, some scholars have also studied the change of bearing capacity of the structure in the destructive process through the destructive test of the pre-stressed concrete box girder of the new high-speed railway [15]. A few scholars conducted relevant studies in the destructive test of newly built pre-stressed concrete T-beams. For example, Zhang’s 30 m used the pre-stressed concrete T-beam to test the mechanical properties of the pre-stressed beam during the process of destructive loading and analyzed its deflection, strain, and crack development forms [16]. Liu et al. [17] verified the mechanical properties of the structure through the destructive test of a 30 m pre-stressed double T-beam, and the results showed that the bearing capacity of the structure could meet the requirements of the code. Pujol et al. [18] carried out destructive tests on 27 m unbonded pre-stressed concrete continuous T-beams by applying uniform load, and the test results showed that the beams had good ductility, and the structural bearing capacity reached 1.25 times the design value. The research team led by Wang et al. [19] conducted a comprehensive investigation into the failure mechanisms, mechanical characteristics, and maximum load-bearing capacity. The research introduced a novel approach for forecasting the remaining load-bearing capacity, utilizing the strain distribution patterns and the alterations in the section’s neutral axis position. This method established a theoretical foundation for assessing the flexural stiffness and load-bearing capabilities of pre-stressed concrete beams.
Most of the destructive tests on bridge spans mentioned above are concentrated in the range of 20∼30 m. These tests are often conducted using small-scale models or bridges that are to be dismantled. However, the results obtained from experiments using small-scale models may not fully reflect the actual stress state of the structure in some aspects. On the other hand, bridges that are to be dismantled usually exhibit accumulated damages over their service life, leading to mechanical properties and bearing capacity values obtained from tests being lower than the intact state of the bridge. Notably, there is a lack of destructive tests conducted on newly constructed 50 m pre-stressed concrete T-beams. Therefore, it holds great engineering significance to carry out destructive tests on full-scale newly built pre-stressed T-beams to investigate the structural changes during failure. Such tests can provide valuable insights for evaluating the structural condition of damaged pre-stressed T-beams. In terms of the economic research of bridge-bearing capacity assessment through load tests, because the bridge maintenance community is developing in the direction of life cycle cost optimization, this concept should also be used in load testing. Some scholars propose that the use of load tests for bridge bearing capacity assessment should not be regarded as an isolated event in the bridge life cycle, but should be included in the inspection, maintenance, and reinforcement of the bridge. It should be minimized by minimizing the total cost and maximizing bridge performance and life expectancy to determine the number of load tests to be performed over the life of the bridge and the optimal time [20,21].
Based on the above research background, this study is anchored on a comprehensive destructive test of a fully intact 50-m pre-stressed T-beam. The investigation focuses on the variations in beam deflection, strain, and crack development under incremental load levels throughout the experimental process. The analysis of the change in bearing capacity for 50 m T-beams during the destructive process, as per the “Highway Bridge Bearing Capacity Testing and Evaluation Regulations” (JTG/T J21-2011) and “Highway Bridge Load Test Regulations” (JTG/T J21-01-2015), focuses on the verification coefficient indicator [22,23]. The objective of this research is to elucidate the variability in the load-bearing capacity of such bridges throughout their service life, thereby further validating the rationality of using static load experimental to assess the load-bearing capacity of simply supported beams. This study provides a basis for the accurate assessment of the actual working state of damaged pre-stressed concrete T-beams.
In this paper, the model selected for testing originated from the Yellow River Super Large Bridge Project on the Puyang to Hubei Yangxin Expressway. It has an overall length of 50 m and a calculated span of 48.8 m. The precise specifications of the beam are illustrated in Figs. 1 and 2. The beam’s structural assembly was achieved using the post-tensioning technique, and it was constructed with a concrete grade of C55. High-strength and low-relaxation pre-stressed steel strands having a standard tensile strength of 1860 MPa were employed for pre-stressing, and the tension stress was controlled at 1395 MPa. The relaxation coefficient of the pre-stressed steel strands was measured to be 0.3. The individual dimensions of the beam plate and the arrangement of the prestressed steel strands are shown in Fig. 3. In this experiment, the experimental loading was applied using a simple support mode.

Figure 1: Beam elevation view (cm)
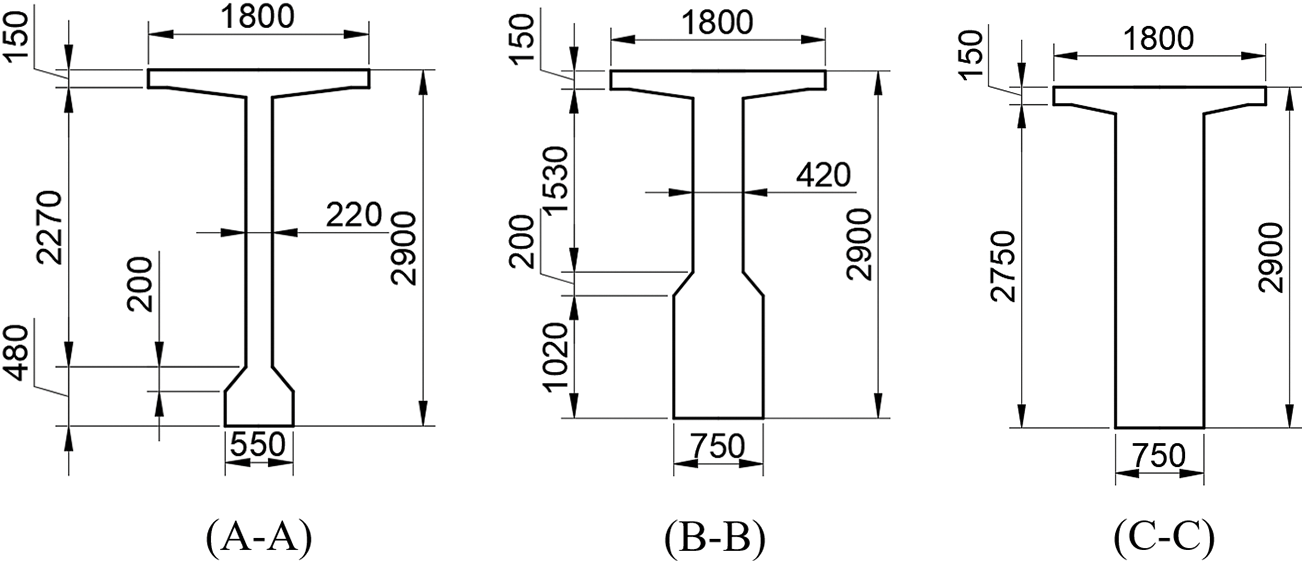
Figure 2: Cross-sectional view of different parts in the beam (mm)
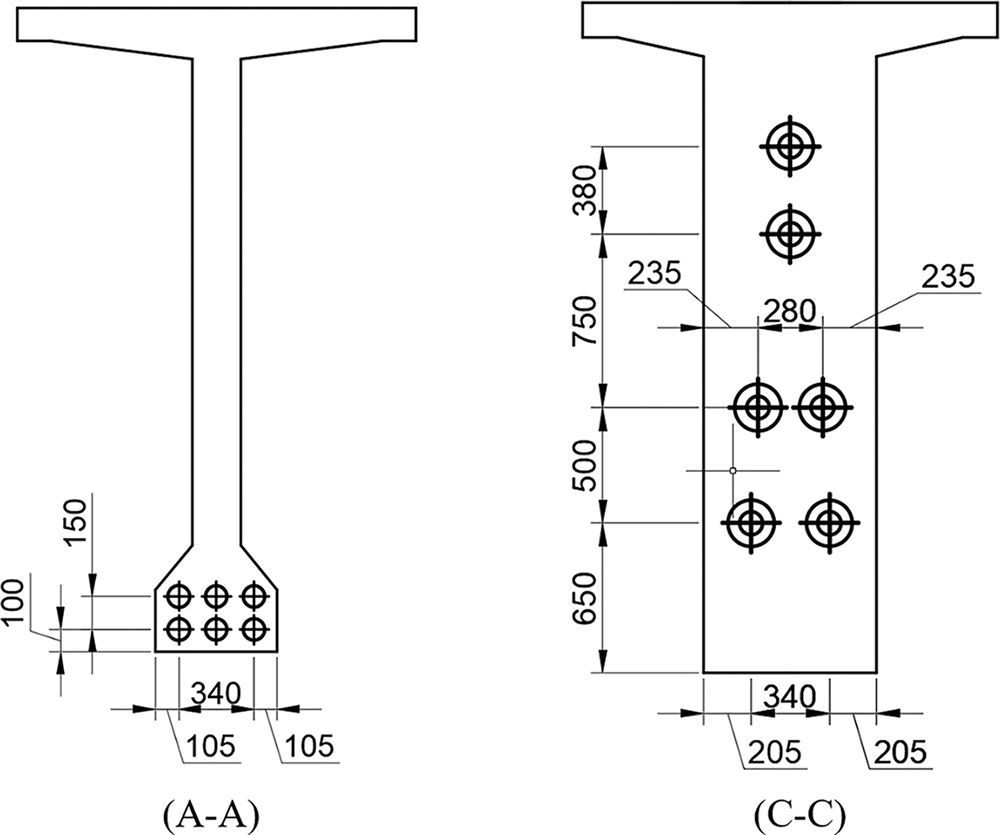
Figure 3: Layout of pre-stressed bundles at different sections (mm)
The parameters of materials are shown in Table 1.

2.2 Loading Device and Measurement Point Layout
The testing methodology employed a single-point loading technique, as shown in Fig. 4, with the load application focused on the beam’s most structurally vulnerable area, the mid-span, to counteract a positive bending moment. The apparatus for loading is elaborately illustrated in Figs. 5 and 6. The T-beam is simply supported at both ends, and the jack is located between the beam and the reaction force assembly. This assembly comprised a steel beam and two concrete resistance plates anchored to piles. When the jack is pressurized, the steel beam absorbs the upward force, converting it into the loading force of the T-beam. This meticulously designed loading setup facilitated accurate and controlled testing conditions for the experiment.
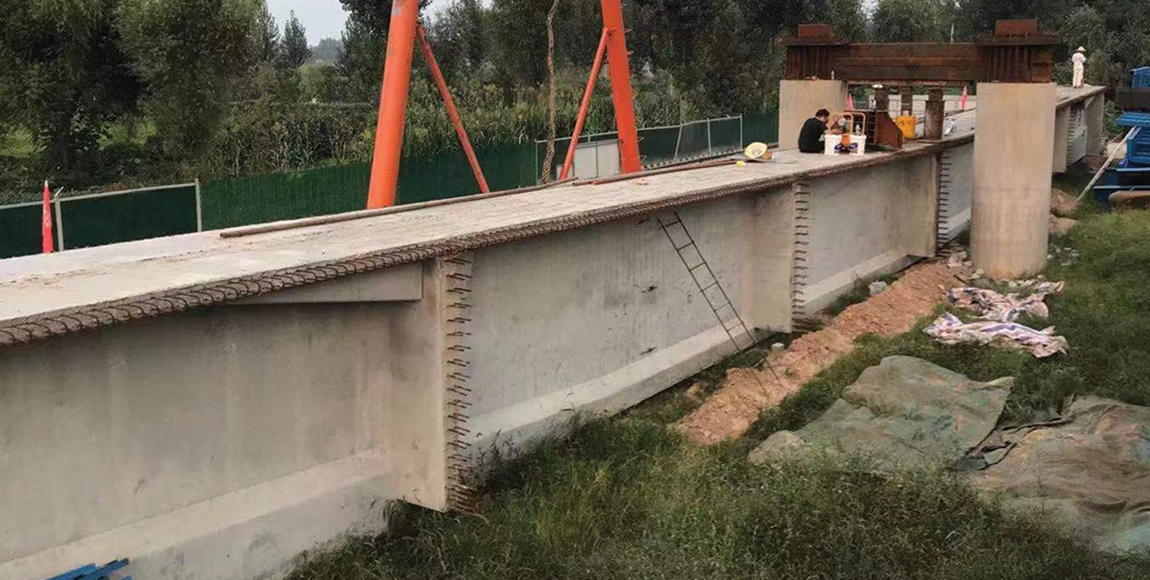
Figure 4: Site diagram of T-beam load loading

Figure 5: Elevation view of loading device
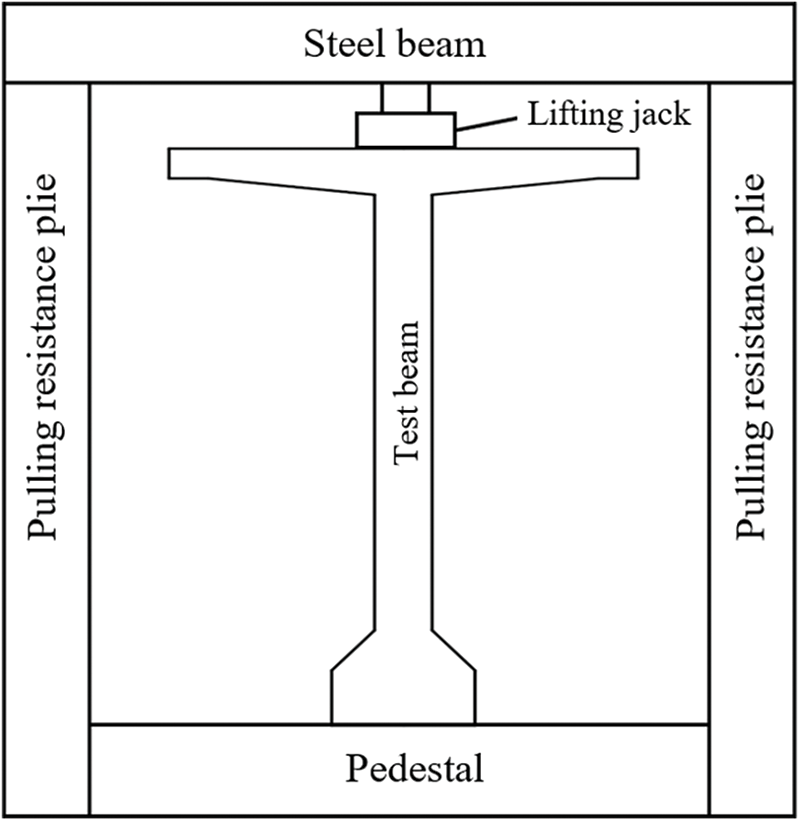
Figure 6: Cross-section view of loading device
2.2.2 Layout of Deflection Measurement
The layout for the deflection measurement points on the model is shown in Fig. 7.
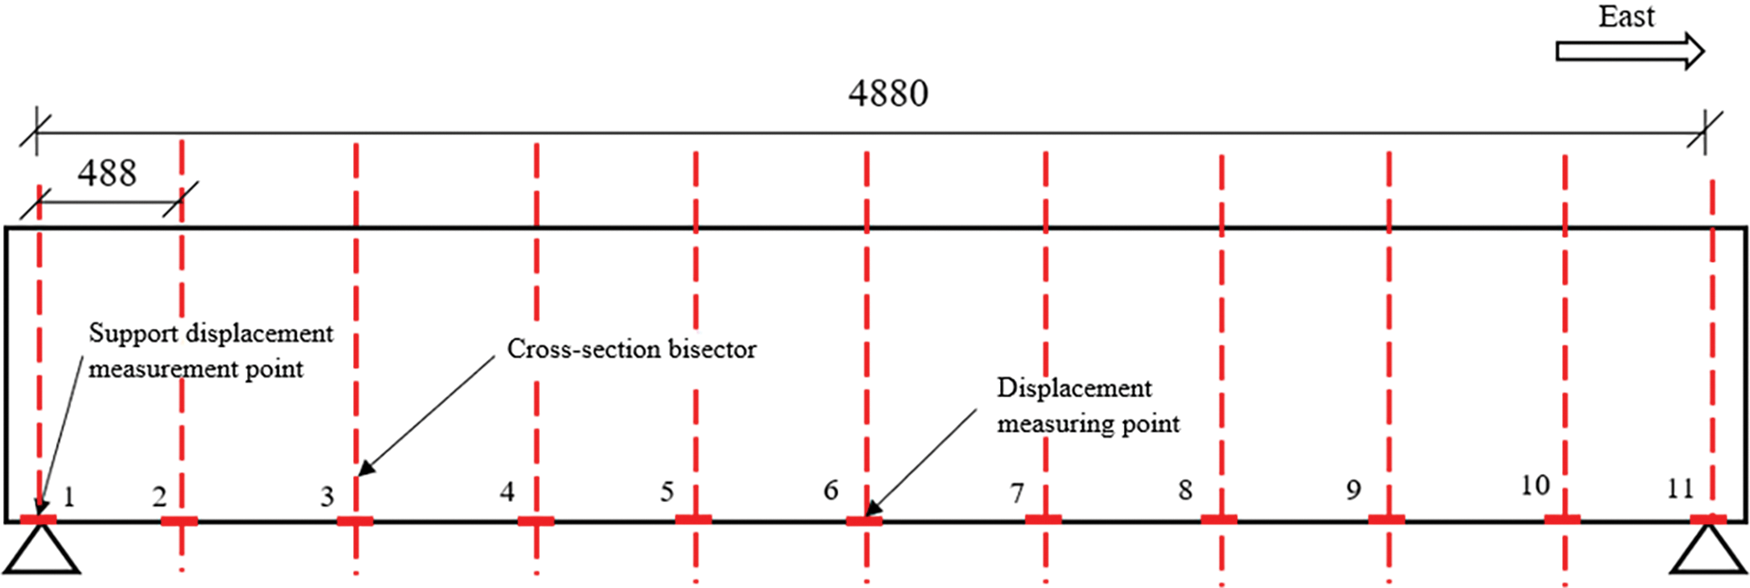
Figure 7: Cross-section layout of T-beam deflection measurement points
2.2.3 Layout of Strain Measurement
There were 10 points of strain measurement at three sections with 1/4, 1/2, and 3/4 span. They were symmetrically arranged, as shown in Fig. 8.
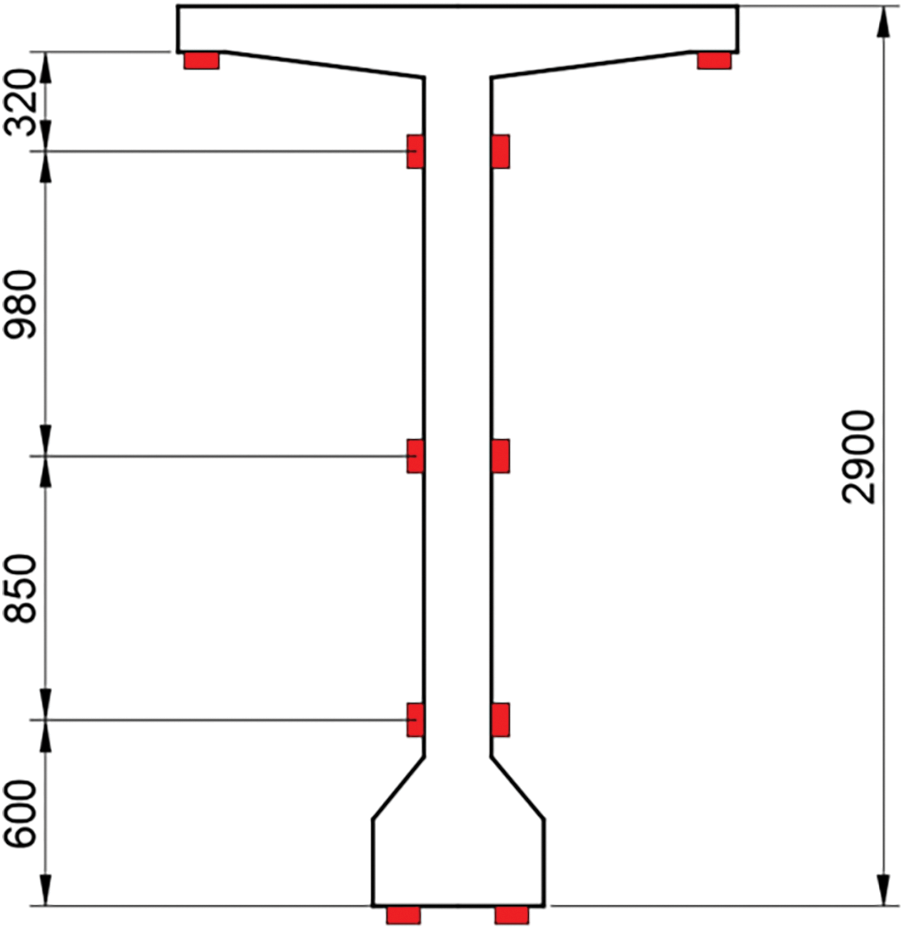
Figure 8: T-beam strain measurement point profile
The main measuring equipment used in this study is shown in Table 2 below.

The load values were harmonized with the stipulations of the “General Specifications for Design of Highway Bridges and Culverts” [24] to gain a deeper insight into the true state of the model across various phases of destructive. The transverse distribution coefficient for the central beam was computed using the rigid beam approach, and the vehicle load was applied following the Highway-I load standard. This standard entails a uniformly distributed load of 10.5 kN/m coupled with a concentrated load of 360 kN. The formula for calculating the transverse distribution factor for a simply supported beam in the rigid-frame theory is presented as follows:
where maxRi is the maximum value of the load R on the main beam, P is the concentrated load, and ηi (i = 1, 2, ..., n) is the force distribution factors.
Following each loading phase in the test, the process of unloading was executed until the deflection measurement at mid-span stabilized, ensuring accurate data collection for subsequent analysis. This iterative cycle, encompassing both loading and unloading stages, was repeated 14 times, corresponding to 14 distinct loading increments. The loading levels, meticulously planned to progressively challenge the structural integrity of the beam, were set at 315, 630, 1030, 1110, 1190, 1300, 1500, 1580, 1700, 1900, 2100, 2220, 2500, and 2540 kN. Upon completion of each loading cycle, a static load test was conducted to assess the beam’s response under static conditions. The bearing capacity was then evaluated according to the comprehensive data gathered from these static load tests. The concentrated force loaded in the static load test was 630 kN. Before the formal start of the structural loading test, preloading the structure is conducted to familiarize with the on-site loading process and to verify the operational status of the instruments, thereby preparing for the subsequent formal loading step. The overall process of destructive loading is shown in Fig. 9 and the load loading site diagram is shown in Fig. 10.
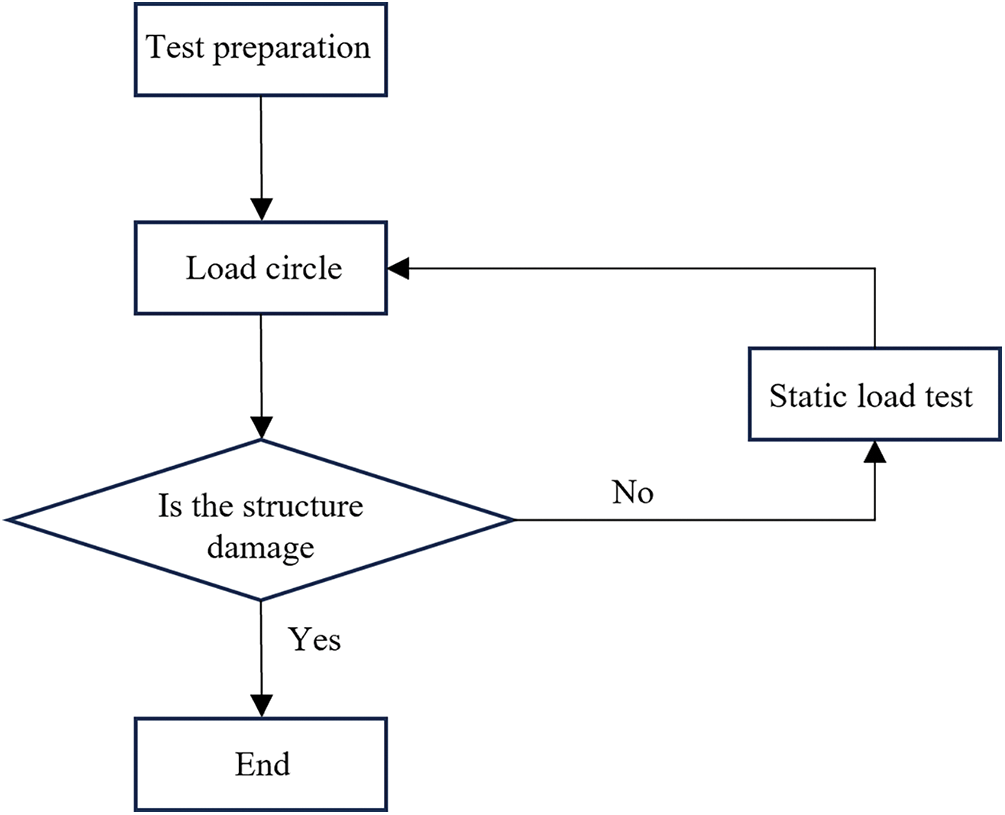
Figure 9: Destructive test loading flow chart
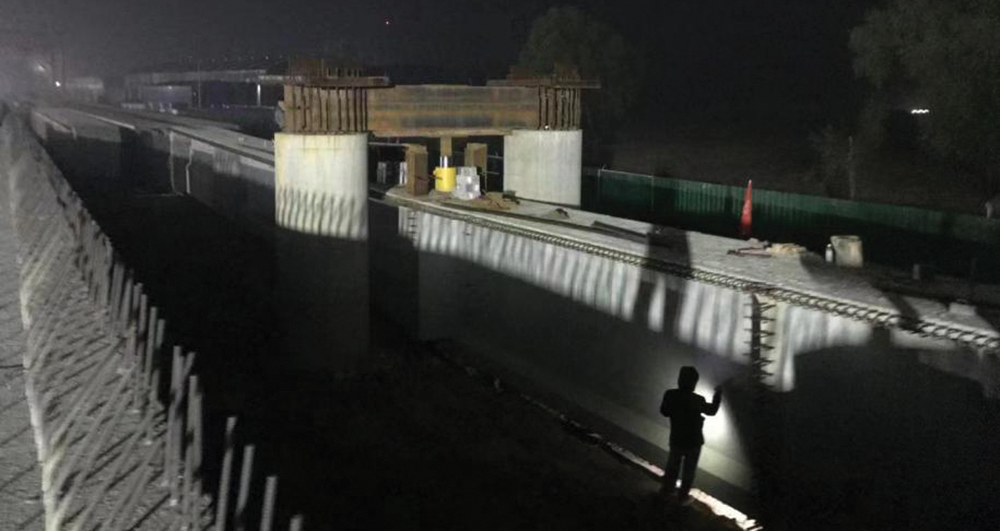
Figure 10: Field image of T-beam under load application
The layout of the test instrument and the on-site measurement method are reasonable to avoid the error caused by cracking as much as possible. The number of measurements is large to avoid occasional errors after cracking. As shown in Table 3.

From the above table, it can be seen that the corresponding strain value of each stage in each cyclic loading process needs to be measured, and the rationality of the test results is ensured by comprehensive comparative statistical analysis of the initial data of each stage in the cyclic loading process.
In the bridge detection theory utilized in this paper, it is initially assumed that the bridge is in an ideal service state, exhibiting complete elasticity. The theoretical strain values of the bridge are simulated based on the following assumption. It is worth noting that the calculation of the theoretical values does not take into consideration the shear hysteresis effect based on the minimal shear hysteresis effort of the T-beam during the full elastic phase of the test [25,26].
In this load test, the theoretical values of the deflection and strain of the test T beam under load are obtained by finite element simulation. Firstly, according to the design drawings and related data, the finite element model of the T-beam is established, the finite element calculation is carried out, and the specific steps can be divided into:
(1) Cross-section and element establishment: Based on the beam design drawing, the beam support section and the beam part are simplified to a certain extent, the beam fulcrum cross-section, variable cross-section, and mid-span cross-section are established by ABAQUS software, and then combined with the key point coordinates, the creation of the bridge structure model is quickly completed, as shown in Fig. 11.
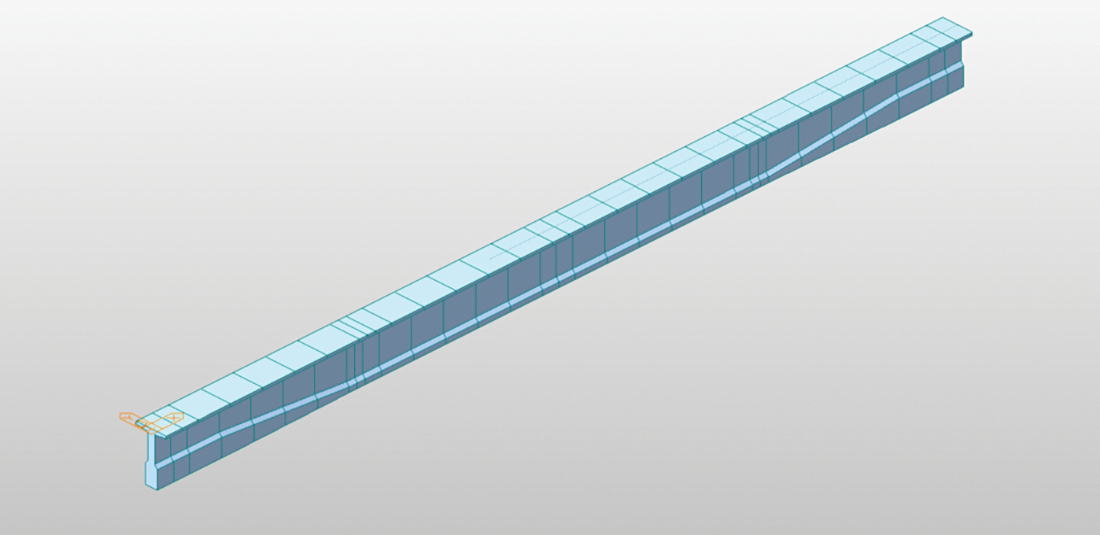
Figure 11: T-beam finite element model
(2) Material definition: The material information of the main beam is shown in Table 1, and the material meets the requirements of the relevant chapters of the “Code for the Design of Highway Reinforced Concrete and Pre-stressed Concrete Bridges and Culverts” (JTG G 3362-2018) [27].
(3) Boundary condition definition: The specification of boundary conditions is conducted in alignment with the criteria for simple supports.
(4) Establishment of pre-stressed reinforcement: The finite element model of prestressed reinforcement is constructed by integrating the material properties of prestressing steel and the design details delineated in the prestressing reinforcement drawings.
(5) Load application: The finite element model is subjected to loading in stages, mirroring the loading protocol employed in the actual load test. This approach enables the derivation of the theoretical structural states under the respective load increments, as depicted in Fig. 12.
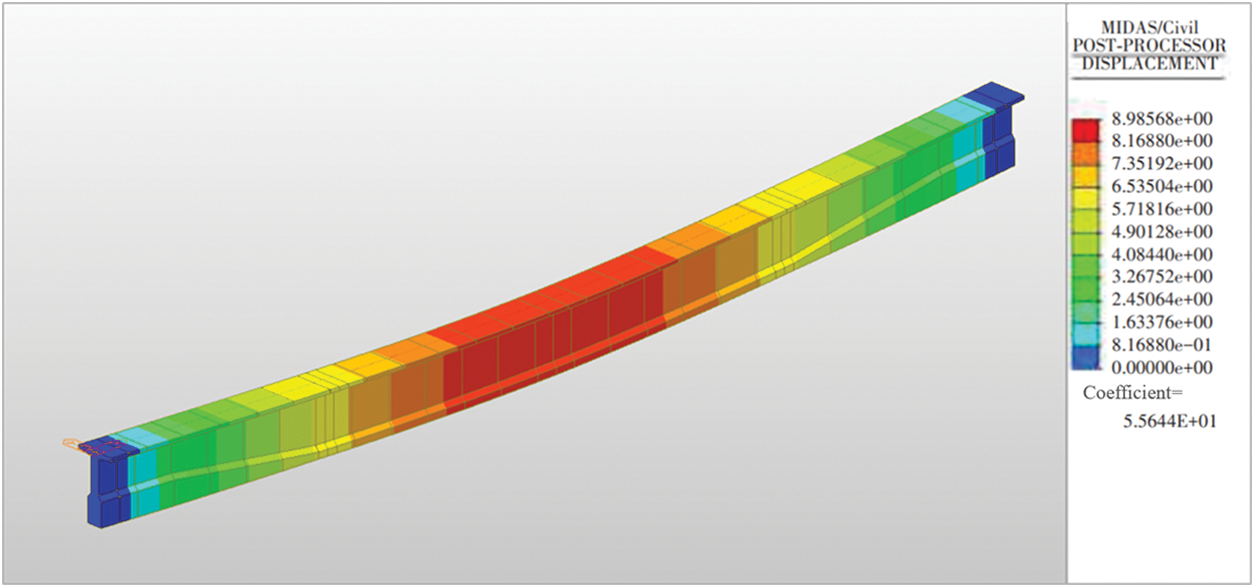
Figure 12: The experimental model loads the deformation
(6) Result extraction: Obtain the strain and deflection data at the specified position of the 1/4, 1/2, and 3/4 sections of the beam. Then, calculate the theoretical values of the deflection and strain for the structure under the test load. The results are presented in Tables 4 and 5 below.


Following the completion of each cyclic loading, the deflection data from the static load test of the test T-beam were collected and analyzed. These data were then compared with the theoretical deflection values obtained through finite element simulation. The deflection verification coefficient at the bottom of the mid-span beam was calculated using the formula provided in the specification, as detailed in Table 6 below.

Following the subtraction of vertical displacements, the deflections at either end of the support pedestal were found to be negative, reflecting the direction of bending. The beam’s deflection data were collected throughout each loading cycle. The resultant load-deflection plots can be observed in Fig. 13. For a more detailed analysis of how deflection responds to increasing loads, the mid-span deflections at each load increment were extracted and are illustrated distinctly in Fig. 14.
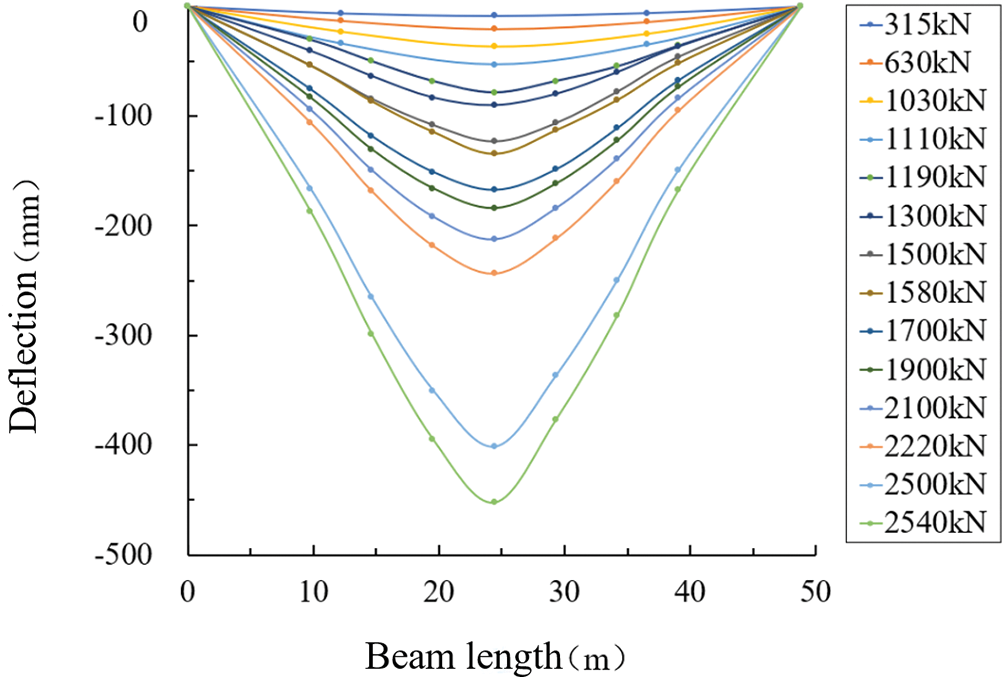
Figure 13: Load-deflection curve along the length of the beam
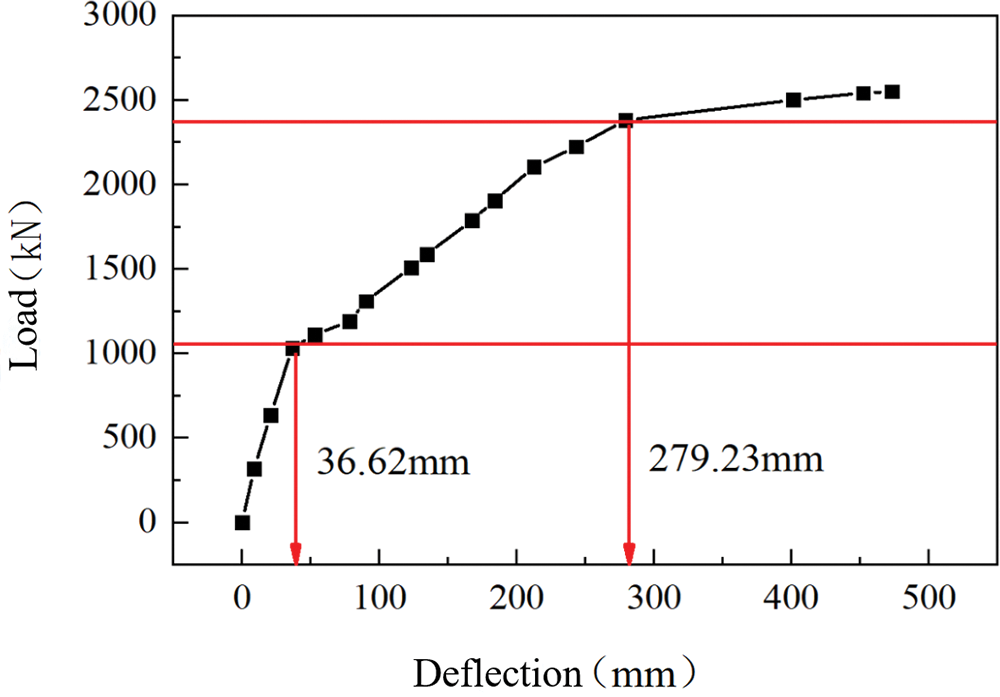
Figure 14: Load-deflection curve at the mid-span position of T-beam
Based on the mid-span load-deflection curve presented in Fig. 14, it is evident that the curve exhibits two distinct inflection points as the applied load progressively increases. The state of the T-beam is divided into three phases during the test:
(1) Complete linear stage: At the initial loading phase, characterized by minimal load values, the beam’s deflection increases at a gradual pace. The load-deflection plot for this stage demonstrates a direct linear correlation between the applied load and the resulting deflection, with the steepest slope observed. Cracking is absent at this juncture, and the T-beam maintains its structural stiffness, with the material of the beam fails to attain the yield phase.
(2) Incomplete linear stage: As cyclic loading is progressively applied, the structural load-bearing capacity experiences a steady decline. Concurrently, the deflection verification factor exhibits a pattern of exponential increase in correlation with the rising cyclic load magnitude. This suggests that, when evaluated against the deflection verification criterion, the structural load-bearing capacity does not conform to the standards necessary for standard operational conditions. When the load reaches 1030 kN, the mid-span deflection of the beam reaches 36.62 mm, and the first inflection point on the load-deflection curve appears. Following the application of 1030 kN of load, the test beam emitted a sustained auditory signal. Additionally, the first signs of cracking were observed at the beam’s bottom surface in the mid-span region. Crack propagation was predominantly confined to a 2.5-m zone centered around the beam’s mid-span, with the cracks displaying an oblique orientation. The mean width of the crack was measured to be 0.08 mm, with the widest crack reaching 0.12 mm. This value is nearly identical to the projected cracking load. Post the initial inflection point, the beam’s deflection increases nearly linearly with the applied load. Nevertheless, there is a decline in the slope of the load-deflection curve, signifying a reduction in the beam’s stiffness. During this loading phase, the cracks progressively extend towards both ends of the beam.
(3) Non-linear stage: Upon attaining a load of 2380 kN, the mid-span deflection reaches 279.32 mm, and the occurrence of the second inflection point occurs. At this time, the rate of deflection growth intensifies with the escalation of load, indicating the commencement of the beam’s plastic phase. When the load peaks at 2550 kN, the mid-span deflection escalates to 473.28 mm. The crack at the mid-span has nearly reached the beam’s uppermost edge, with its maximum width extending to 4.7 mm. Audible sounds of prestressing failure were emitted. Concurrently, the tensile reinforcement within the beam begins to yield.
3.2 Strain Results at the Mid-Span
After the completion of each cyclic loading, the static load test was carried out, and the strain curve at the mid-span section of the test beam along the beam height is shown in Fig. 15.
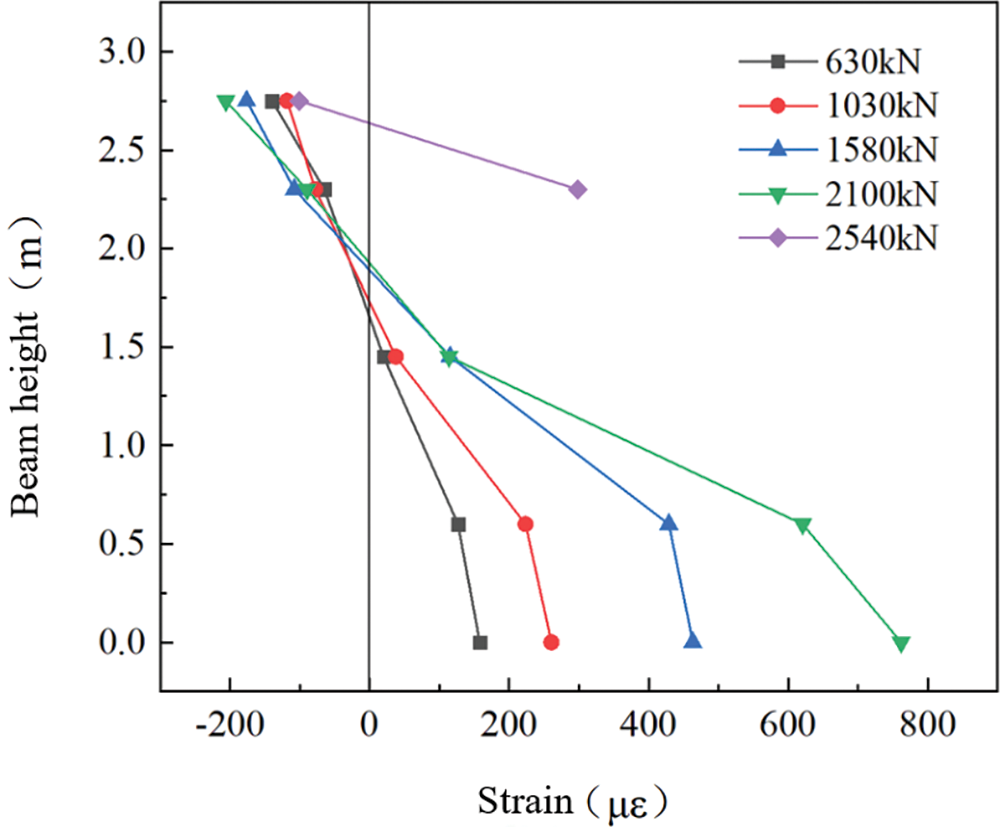
Figure 15: Mid-span section strain curve along beam height
In the stage of complete linear elasticity, the height of the neutral axis in the middle section of the beam is consistent with the theoretical value. The neutral axis of the T-beam appears to rise slightly in the load cycle (1030 kN) and the position is about 170 cm in the incomplete linear stage, which indicates the structure still has a better bearing capacity for the normal use of the static loads at this time. As the continuous increase of the structural cracking degree after the load cycle (1580 kN), the position of the neutral axis continues to slowly move upward. When the structure changes to the next stage, the neutral axis position rises rapidly due to the yielding of tensile reinforcement and the neutral axis position is about 2.7 m after the load cycle (2500 kN). The variation of the height of the neutral layer in the mid-span section is shown in Table 7. The variation curve of the neutral layer in the mid-span section is shown in Fig. 16.

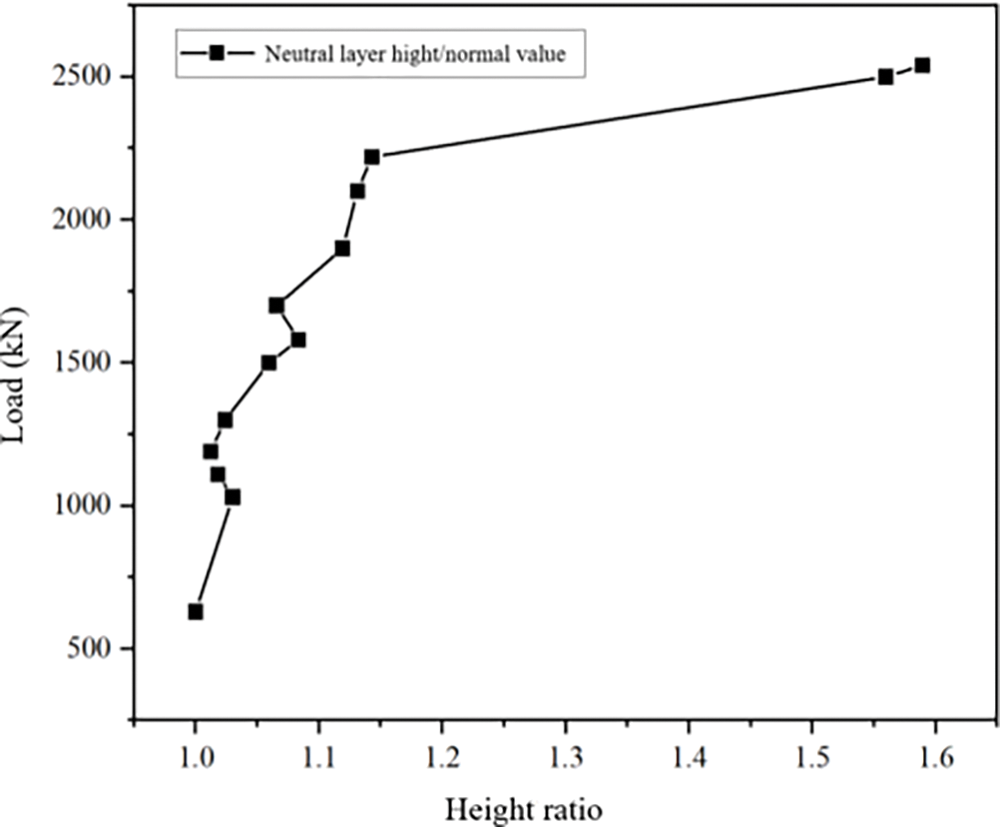
Figure 16: Curve of the neutral layer in the mid-span section
4 Analysis of Bearing Capacity During Destructive Test
The verification coefficient can be calculated from Formula (2) according to the specification [22].
where η is the verification coefficient, Se is the measured value of deflection (or strain) under test load, and Ss is the theoretical value of deflection (or strain) under test load.
When the structure is subjected to loading, the strain of the structure can reflect its strength information, and the deflection of the structure can reflect its stiffness information. When the load test is used to evaluate the bearing capacity of the bridge, the strength and stiffness of the structure can be quantitatively analyzed through the strain and deflection verification coefficient. The verification coefficient can reflect the bearing capacity of the bridge. For pre-stressed reinforced concrete bridges, the specification requires that the bridge verification coefficient is considered to meet the code requirements when the deflection verification coefficient ranges from 0.7 to 1.0 and the strain verification coefficient ranges from 0.6 to 0.9. When the verification coefficients are within the above range, the bearing capacity is good. The less of coefficient, the better the bearing capacity. In this paper, according to the verification coefficient in the specification, the change of the verification coefficients of the deflection and strain during the destructive test were analyzed.
4.2 Deflection Verification Coefficient
After each cyclic loading, the deflection data of the static load test of the test T beam (the test load is 630 kN) are counted, combined with the theoretical value of the deflection obtained by the finite element simulation, and the deflection check coefficient at the bottom of the mid-span beam is calculated by the formula given by the specification, as shown in Table 8.

According to Table 8, the relationship diagram between the deflection verification coefficients and the cyclic loading value is made, as shown in Fig. 16. The cracks of the beam initiate at point B in the figure, and develop gradually with the increase of the cyclic load. The structure is in the complete linear stage at the point in front of B, the verification coefficient is less than 0.69, indicating that the bearing capacity is good. And then enters the nonlinear working stage and gradually transitions to the damage stage; point C indicates that the rebars of the structure begin to yield, indicating that the structure begins to enter the failure stage. After this state, the damage degree of the structure begins to increase fast with the increase of cyclic load. Finally, the structure reaches a state of complete failure after point D.
According to Fig. 17, it can be found that the deflection verification coefficient of the structure changes very little, the value is between 0.6 and 0.7 while the structure is in a complete linear elastic state, which is between two points AB in the figure. It indicates that the structure has good bearing capacity and a large safety reserve under the evaluation index of the deflection verification coefficient. With the increase of the load cycle, the structure enters an incomplete linear stage, which is between two points BC in the figure. The value of the deflection check coefficient starts from 0.69 and increases with the increase of the load cycle, while the bearing capacity of the structure decreases, during this period. The deflection verification coefficient presents an index growth trend with the increase of the cycle. The deflection verification coefficient reaches 1.02 after the load reaches 1580 kN, which indicates that the bearing capacity of the structure cannot meet the requirements of the normal use state under the deflection verification coefficients. It can be considered that when the load reaches almost 3/4 of the calculated ultimate load (2019.86 kN), the deflection verification coefficient exceeds 1.0. In the CD section of the curve in the figure, the structure is in the damage stage. Upon attaining a load of 2380 kN, the interpolation of the corresponding deflection verification coefficient is 1.38, the structure has been significantly damaged when it is in this state, and the bearing capacity has long failed to meet the standard requirements.
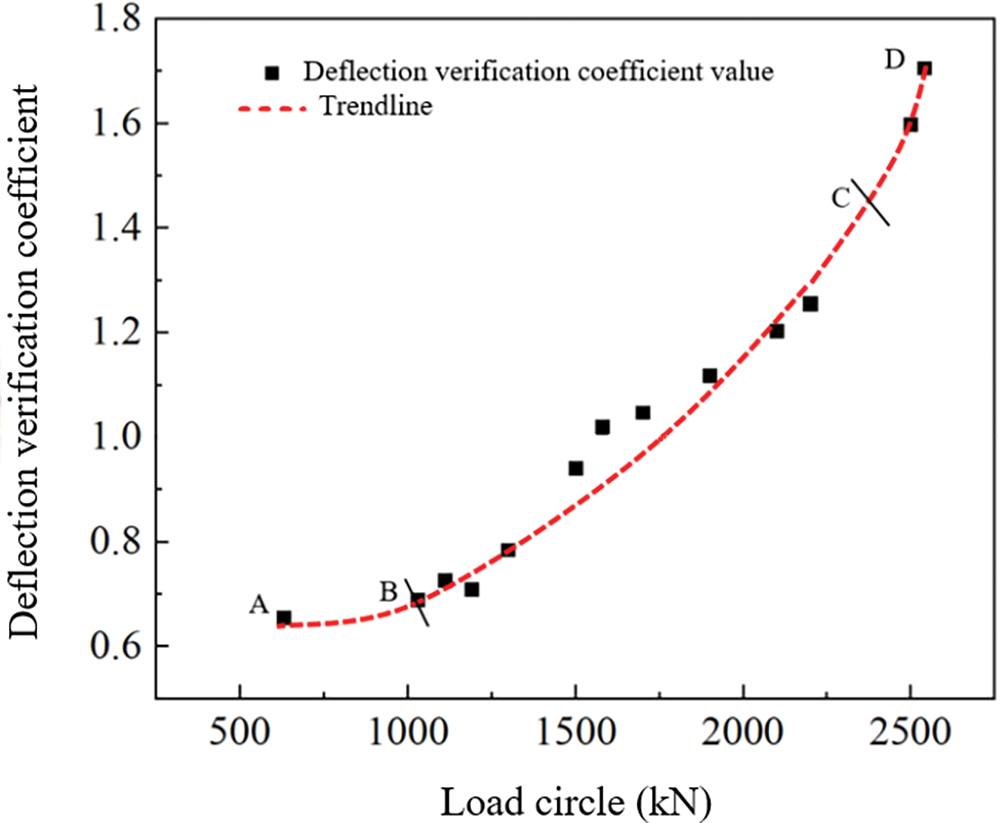
Figure 17: Relationship between deflection verification coefficient and load cycle
4.3 Strain Verification Coefficient
Due to the regular variation of strain values along the height of the beam, this paper selects the position with the maximum tensile stress and compressive stress at the mid-span, that is, the strain verification coefficients from the bottom of the beam and the bottom of the flange are calculated, as shown in Tables 9 and 10. They are plotted in Figs. 18 and 19.


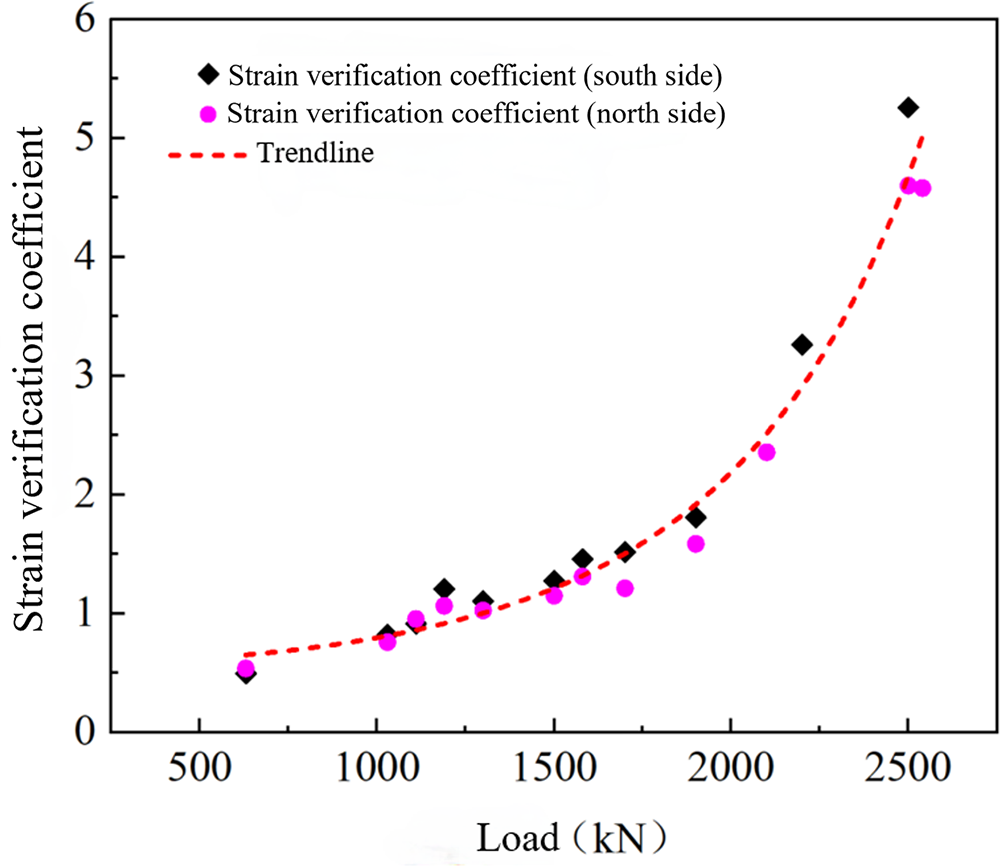
Figure 18: Strain verification coefficient (bottom of the beam-tensile strain)
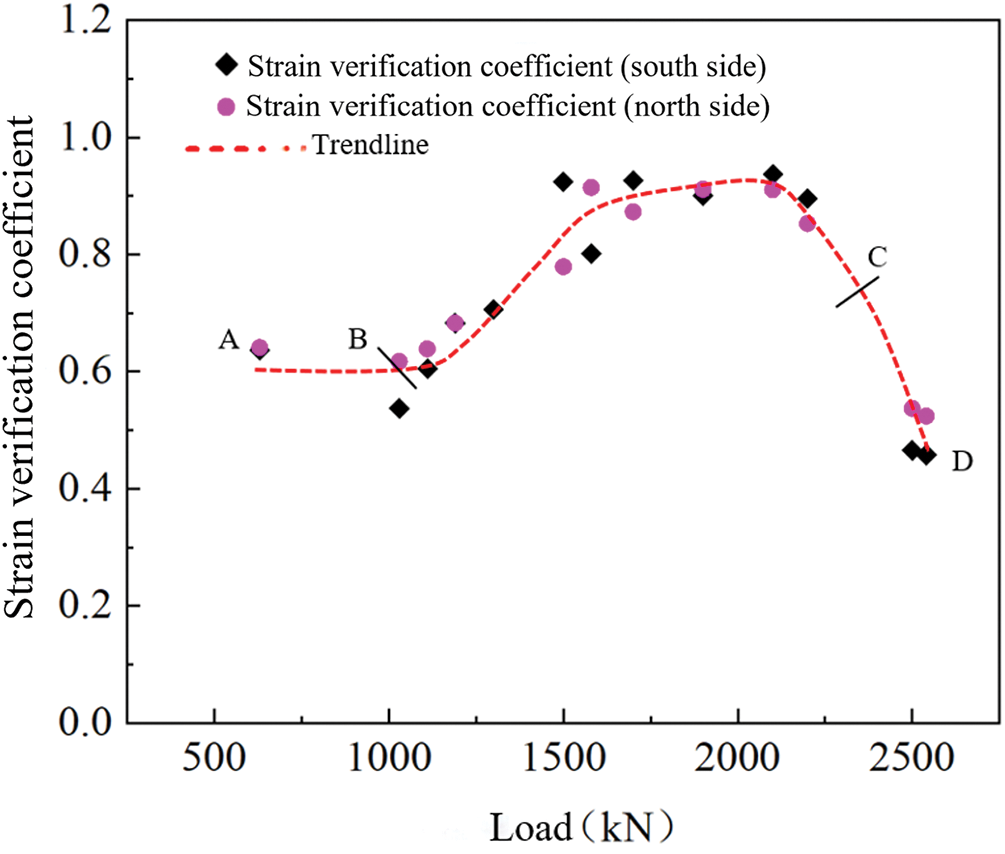
Figure 19: Strain verification coefficient (lower flange-compress strain)
Through Fig. 18, it can be found that the strain verification coefficients increase to a certain extent, with a maximum value of 0.82 being less than the specified value of 0.9 in the specification while the beam is in a complete linear elastic state, i.e., between the AB points in the figure. The result indicates that the bearing capacity of the beam is good. With the increase of the cyclic load, the structure enters an incomplete linear stage, named the BC stage in the figure, and the bearing capacity of the structure gradually decreases. There is a situation where the strain verification coefficient is greater than the standard requirements after the load reaches 1190 kN. It indicates that under the strain verification coefficient evaluation index, the bearing capacity of the structure can’t meet the requirements for normal use. In the CD segment of the curve in the figure, the structure enters the damage stage, with a sudden increase in the strain verification coefficient, and the bearing capacity of the structure further decreases until failure.
From Fig. 19, it can be observed that the strain verification coefficient of the beam remains stable within a certain range, and is less than the specified value in the specification when the beam is in the first state, i.e., between two points AB in the figure. With the increase of the load cycle, the beam changes to the incomplete linear stage, named the BC stage in the figure. During this process, the strain verification coefficient shows a trend of first increasing and then decreasing with the increase of the load cycle. The maximum strain verification coefficient is 0.91, which is slightly greater than the requirements of the specification. However, this phenomenon does not mean that the bearing capacity meets the requirements of the code. In the CD section of the curve in the figure, the strain verification coefficient rapidly decreases, but its actual bearing capacity continues to decrease until it fails.
It is because cracks begin to appear in the lower part of the beam body after the structure enters the incomplete linear stage, and the cracks continue to expand upward with the increase of load 14. The neutral axis also moves upward to the flange and continues to move upward until the beam body fails. It is shown in Table 7 and Fig. 16. When the neutral axis moves upward, the compressive strain of the concrete at the bottom of the flange will first increase with the increase of the load cycle. While the neutral axis moves closer to the bottom of the flange, the compressive strain value will gradually decrease. As the neutral axis continues to move upward, the compressive strain value will first decrease to zero and then appear as the tensile strain until the final failure of the beam. It can be seen that when the strain verification coefficient is used to evaluate the bearing capacity of the bridge, the position of strain measurement points should be rationally arranged, and the bearing capacity of the bridge should be evaluated according to the results of strain verification coefficient at different locations of the section.
Comparing the relationship between the deflection at the mid-span and the strain verification coefficient at the bottom of the beam with the variation of the load cycle, it is found that the trend of the two coefficients under the load cycle is the same. The strain verification coefficient exceeded the specification range in the third load cycle (1190 kN), and the deflection verification coefficient exceeded the specification range in the seventh cycle (1580 kN). When analyzing the verification coefficients of deflection and strain, it can be found that the values of the verification coefficients will be somewhat discrete under the same cycle. This phenomenon is partly due to the limitation of field instruments and the influence of errors between the actual applied load and the theoretical load under each cycle. Compared with the deflection verification coefficient, the strain verification coefficient has a higher sensitivity to the load cycle. A higher sensitivity will lead to a greater dispersion of measurement values, which requires more accurate measurement equipment for data collection. When using the verification coefficient to calculate the bearing capacity of bridges, analyzing the structural deflection and strain verification coefficient can obtain more reliable evaluation results. The changing trend of the verification coefficient obtained in this paper during the damage process can be used to make a preliminary judgment on the service status of the bridge. However, the compress strain coefficients should be paid more attention when the beam is damaged.
The verification coefficients of deflection and strain represented the bearing capacity of the pre-stressed T-beam and were analyzed by the life-cycle 50 m full-scale destructive test, some conclusions could be drawn as follows:
1. According to the load-deflection curve, the T-beam can be divided into three stages during the life-cycle destructive process, they are complete linear elasticity, incomplete linear, and non-linear stage.
2. Throughout the entire failure experiment process of the T-beam, it was observed that during the full elastic stage, the deflection and strain check coefficients provided an accurate assessment of the bridge’s load-bearing capacity. However, as the T-beam transitioned into the non-complete elastic state, significant disparities in the deflection and strain check coefficients were noted, with the strain check coefficient results more effectively reflecting the T-beam’s operational state. In the nonlinear stage, the check coefficient values exceeded the specified range, indicating that the bridge’s load-bearing capacity no longer met the required standards.
3. The verification coefficient for the compression zone at the bottom of the flange is generally between 0.6 and 0.9. The strain verification coefficient will first increase and then decrease as the neutral axis moves up. It cannot reflect the damage of the T-beam. It could not be recommended for evaluating the bearing capacity of bridges.
4. In this paper, the whole process failure test of a prestressed concrete T-beam is of practical significance for the subsequent analysis of the structural behavior of the whole bridge.
Acknowledgement: We would like to express our sincere appreciation to the Yellow River Bridge Management Department for the technical assistance. Their support and expertise were invaluable in the completion of this work.
Funding Statement: The authors received no specific funding for this study.
Author Contributions: The authors confirm contribution to the paper as follows: study conception and design: Yushan Ye, Tao Gao; data collection: Liankun Wang, Junjie Ma; analysis and interpretation of results: Yingchun Cai; draft manuscript preparation: Heng Liu, Xiaoge Liu. All authors reviewed the results and approved the final version of the manuscript.
Availability of Data and Materials: The data and materials supporting the findings of this study are available upon request. Researchers interested in accessing the data and materials should contact the corresponding author, Heng Liu (liuheng88@zzu.edu.cn), for further information.
Ethics Approval: Not applicable.
Conflicts of Interest: The authors declare that they have no conflicts of interest to report regarding the present study.
References
1. Rizzo P, Enshaeian A. Bridge health monitoring in the United States: a review. J Struct Monit Maintenance. 2021;8(1):1–50. [Google Scholar]
2. Alampalli S, Dan MF, Grimson J. Bridge load testing: state-of-the-practice. J Bridge Eng. 2021;26(3):e01035. [Google Scholar]
3. Miller R, Aktan A, Shahrooz B. Destructive testing of decommissioned concrete slab bridge. J Struct Eng. 1994;120(7):2176–98. doi:10.1061/(ASCE)0733-9445(1994)120:7(2176). [Google Scholar] [CrossRef]
4. Li Y, Wu Q, Yu Z, Liu Y. Destructive test study of the flexural load capacity of a full-scale reinforced concrete T-girder strengthened by externally pre-stressed CFRP plates. J Case Stud Constr Mater. 2022;16:e01035.doi:10.1016/j.cscm.2022.e01035. [Google Scholar] [CrossRef]
5. Hu B, Yang J, Sun Q, Zhang C. Experimental study on real bridge before and after simply supported-continuous reinforced concrete hollow slab. Civil Eng J. 2023;32(2):188–202. [Google Scholar]
6. Nie J, Zhu Y, Tao M. Optimized prestressed continuous composite girder bridges with corrugated steel webs. J Bridge Eng. 2017;22(2):1–16. [Google Scholar]
7. Graybeal B. Material property characterization of ultra-high performance concrete. FHWA-HRT-13-060. Mclean: Federal Highway Administration; 2006. [Google Scholar]
8. Bagge N, Popescu C, Elfgren L. Failure tests on concrete bridges: have we learned the lessons? J Struct Infrastruct Eng. 2018;14(3):292–319. doi:10.1080/15732479.2017.1350985. [Google Scholar] [CrossRef]
9. Tonelli D, Rossi F, Brighenti F, Verzobio A, Bonelli A, Zonta D. Pre-stressed concrete bridge tested to failure: the Alveo Vecchiovia duct case study. J Civil Struct Health Monit. 2022;13(4–5):873–99. [Google Scholar]
10. Deng J, Qin Y, Li X, Zhu M. Numerical and experimental investigation on the flexural stiffness of RC beams strengthened with prestressed CFRP plate exposed to wetting/drying cycles. J Case Stud Construct Mater. 2023;19:e02501. doi:10.1016/j.cscm.2023.e02501. [Google Scholar] [CrossRef]
11. Chen L, Jiang T, Gong J, Cai L. Study on damage effect of concrete bridge model under blast loading. J Applied Mechanics and Materials. 2015;777:116–20. doi:10.4028/www.scientific.net/AMM.777. [Google Scholar] [CrossRef]
12. Allawi A, Al-Sherrawi M, Al Gharawi M, El-Zohairy A. A case study to evaluate live load distributions for pre-stressed RC bridge. J Chall Mech Time Depend Mater. 2018;2:73–85. [Google Scholar]
13. Fang Z, Wang J, He X, Zhou G. Full-scale model test of mechanical behavior of pre-stressed concrete simply supported box girder. J China Highway Transp. 2011;24(6):49–56 (In Chinese). [Google Scholar]
14. Yu Z, He S, Ren L, Liu D. Study on calculation and variation law of residual bearing capacity of pre-stressed concrete box girder after damage. J China Highway Transp. 2021;34(9):242–52 (In Chinese). [Google Scholar]
15. Cui H, Li Z, Zhuo Y, Di H, Wei J, Xing Y, et al. Destructive testing and simulation for newly designed full-scale high-speed railway box girder. J Construct Build Mater. 2022;328:127112. doi:10.1016/j.conbuildmat.2022.127112. [Google Scholar] [CrossRef]
16. Zhang Z, Yu Z, Yu Z. Study on failure test mechanical performance of polygonal reinforced pre-stressed concrete T-beams. J Chin Foreign Highways. 2017;37(3):69–72 (In Chinese). [Google Scholar]
17. Liu Z, Lei H, Luo J, Zhang C, Ma B. Full-scale model test study on flexure performance of 30 m pre-tensioned pre-stressed double T bea. J China Bridge Construct. 2022;52(5):14–20 (In Chinese). [Google Scholar]
18. Pujol S, Fick DR, Fargier-Gabaldon LB. Test of 90-foot post-tensioned concrete girder with unbonded tendons. J ACI Struct J. 2021;118(5):115–22. [Google Scholar]
19. Wang C, Shen Y, Zou Y, Li T, Feng X. Stiffness degradation characteristics destructive testing and finite-element analysis of pre-stressed concrete T-beam. Comput Model Eng Sci. 2018;114(1):75–93. doi:10.3970/cmes.2018.114.075. [Google Scholar] [CrossRef]
20. Ang AS, De Leon D. Modeling and analysis of uncertainties for risk-informed decisions in infrastructures engineering. Struct Infrastruct Eng. 2005;1(1):19–31. doi:10.1080/15732470412331289350. [Google Scholar] [CrossRef]
21. Kong JS, Dan MF. Probabilistic optimization of aging structures considering maintenance and failure costs. J Struct Eng. 2005;131(4):600–16. doi:10.1061/(ASCE)0733-9445(2005)131:4(600). [Google Scholar] [CrossRef]
22. Ministry of Communications of the People’s Republic of China. JTG/TJ 21-2011 code for testing and evaluation of carrying capacity of highway bridges. China: People’s Communications Press; 2011 (In Chinese). [Google Scholar]
23. Ministry of Communications of the People’s Republic of China. JTG/TJ 21-01-2015 load test code for highway bridges. China: People’s Communications Press; 2015 (In Chinese). [Google Scholar]
24. Ministry of Communications of the People’s Republic of China. General specifications for design of highway bridges and culverts. JTG D60-2015. China: China Communications Press; 2015 (In Chinese). [Google Scholar]
25. Song T. Shear hysteresis effect of prestressed concrete T-beam throughout the entire process based on abaqus. J Highway Transp Res Dev. 2023;40(6):103–12. [Google Scholar]
26. Schulze-Ardey J, Bosbach S, Hegger J. Carbon reinforced concrete members under concentrated load. In: 10th International Conference on FRP Composites in Civil Engineering; 2021; Istanbul, Turkey. p. 1703–14. [Google Scholar]
27. Ministry of Transport of the People’s Republic of China. JTG G 3362—2018 specification for design of highway steel-concrete and prestressed concrete bridge structures. China: People’s Transport Press; 2018 (In Chinese). [Google Scholar]
Cite This Article
 Copyright © 2025 The Author(s). Published by Tech Science Press.
This work is licensed under a Creative Commons Attribution 4.0 International License , which permits unrestricted use, distribution, and reproduction in any medium, provided the original work is properly cited.


 Submit a Paper
 Propose a Special lssue
 View Full Text
 Download PDF
 Downloads
 Citation Tools