 Open Access
ARTICLE
Bending Stiffness of Concrete-Filled Steel Tube and Its Influence on Concrete Placement Timing of Composite Beam-String Structure
1 CCCC Third Highway Engineering Co., Ltd., Beijing, 101300, China
2 School of Civil Engineering, Chongqing Jiaotong University, Chongqing, 400074, China
* Corresponding Author: Renzhang Yan. Email:
Structural Durability & Health Monitoring 2025, 19(1), 167-191. https://doi.org/10.32604/sdhm.2024.053190
Received 26 April 2024; Accepted 25 June 2024; Issue published 15 November 2024
Abstract
When the upper chord beam of the beam-string structure (BSS) is made of concrete-filled steel tube (CFST), its overall stiffness will change greatly with the construction of concrete placement, which will have an impact on the design of the tensioning plans and selection of control measures for the BSS. In order to accurately obtain the bending stiffness of CFST beam and clarify its impact on the mechanical properties of composite BSS during construction, the influence of some factors such as height-width ratio, wall thickness of steel tube, elasticity modulus of concrete, and friction coefficient on the bending stiffness are analyzed parametrically by the numerical simulation technology based on an actual project. The calculation formula of the equivalent bending stiffness of CFST is also established through mathematical statistical simulation. Then, the equivalent bending stiffness is introduced into the construction and use stages of the composite BSS, respectively, and the mechanical properties such as prestress-tensioning control value, structural deformation, and internal force of key members are comparatively analyzed when adopting two different construction plans. Moreover, the optimal construction plan of concrete placement first and then prestress-tensioning is proposed.Keywords
In recent years, the composite structure of concrete-filled steel tube (CFST) has been applied to the upper chord beam of some beam-string structure (BSS) due to its good stiffness and stability, such as Shenyang International Exhibition Center and Shanghai Yuanshen Gymnasium [1]. It is known that BSS is a structure that the upper compression-flexure members are connected with the lower tension members by struts, and the upper structure will develop a camber when the lower cables are tensioned, which results in the reduction of the final deflection under loads and the improvement of the mechanical performance of the structure. At this time, the CFST is mainly subjected to bending, which is completely different from the compression that CFST columns commonly bear in engineering. Therefore, in order to accurately analyze the mechanical properties of the composite BSS, it is necessary to accurately grasp the bending performance of the upper chord beam of the steel and concrete composite BSS. However, previous studies on CFST mainly focus on its axial compression. For example, Contento et al. analyze the axial load capacity of CFST columns using a probabilistic model and establishes a physics-based probabilistic model, which incorporates deterministic components, probabilistic correction terms, and correction models for the effects of load eccentricity and deboning [2]. Yu et al. [3] propose the irregular-shaped CFST columns, analyze their buckling, fracture, and hysteretic performance under axial compression and cyclic lateral loads through testing, and establish a finite element model to study the impact of different parameters on the seismic performance. He et al. [4] investigate the axial compressive behavior of CFST columns, analyze influencing factors through testing of 10 samples, establish a finite element model for verification, and discuss the impact of load distribution and longitudinal reinforcement ratio on the ultimate load, in order to evaluate the accuracy and applicability of five prediction methods. Zhang et al. [5,6] analyze the axial compression behavior of concrete-filled wide rectangular steel tubular (CFWRST) stub columns and the stability of multi-cellular L-shaped CFST columns with finite element models for simulation and verification and provide solutions for the width-thickness ratio and ultimate axial load of CFWRST stub columns. Yang et al. [7] use ABAQUS software to analyze key parameters that affect the axial and eccentric compression capacity of cross-shaped CFST columns and propose practical design equations based on the experimental data, which provides an effective method for determining their maximum load capacity. And Wu et al. [8] investigate the performance of square CFST columns under reverse cyclic lateral loads with finite element models. In terms of the bending performance, Ji et al. [9] analyze the bending stiffness formulas applicable to steel tube recycled concrete columns under different eccentric loads, and suggest the use of Han’s formula for small eccentricities and AJJ (1997)’s formula for large eccentricities by comparing the formulas of various specifications with experimental data. Al Zand et al. [10] propose a new method for predicting the moment capacity and bending stiffness of CFST composite beams. Li et al. [11] obtain the moment-curvature curve of CFST under pure bending based on the finite strip method, obtaining the bending performance. Wang et al. [12] analyze an experimental study on the bending performance of five concrete-encased square steel tube truss (SSTT) beams, etc. Due to the significant impact of the cross-sectional shape of CFST on its bending performance, some scholars, such as Yang et al. [13] and Bogahawaththa et al. [14], also conduct researches on the bending performance of circular CFST beams and find that circular CFST beams have better energy dissipation and stiffness degradation capabilities compared to rectangular CFST beams, which shows better ductility and stability.
In terms of the calculation method for the bending stiffness of CFST, scholars at home and abroad have generally recognized that the bending stiffness of CFST is influenced by a variety of complex factors. Hu et al. [15] derive the calculation formulas for the effective bending stiffness and shear stiffness of CFST beams based on the perfect bond assumption. Hu et al. [16,17] also analyze the bending performance of CFST truss composite beams through experiments and analysis, establish and verify a finite element model, and propose a simplified prediction method for bending stiffness. Based on the general superposition method for concrete-filled rectangular steel tube components, He [18] analyze the bending internal force pattern of concrete-filled rectangular steel tubes, and a formula for the bending stiffness under the ultimate state was proposed. Yang et al. [19] establish a calculation formula for the bending stiffness of rectangular high-strength steel tube constrained beams during the use phase. Al Zand et al. [10,20] study the bending behavior of CFST and develop a new analysis method through static bending tests and finite element simulation to accurately predict the moment capacity and bending stiffness of CFST beams. It can be seen that scholars have proposed corresponding calculation formulas or prediction methods through various means such as experiments, numerical simulations, and analytical derivation. In particular, Lu [21] summarizes the calculation formulas for the bending stiffness of CFST members in various national specifications through comparative analysis and finds that each formula is different with its own applicability. Therefore, the relevant formulas cannot be directly applied in actual engineering projects.
Since the upper chord CFST beam will undergo a process from an empty steel tube to a CFST composite member during the construction process, the stiffness of the composite BSS will change. In particular, the timing when the stiffness of the upper chord beam changes during the construction process will have an impact on the key link of prestress-tensioning construction, and will also influence the safety of the construction time-varying structure. Therefore, in order to ensure the safety of the construction process of the composite BSS, and to clarify the mechanical properties of the structure during the usage stage, considering the lack of a unified method for calculating the bending stiffness of CFST, this paper first establishes a calculation method for bending stiffness that takes into account the multi-parameter variations of CFST based on the physical meaning of bending stiffness. Then, it is introduced into the mechanical performance analysis of the construction process and use stage of the composite BSS, in order to figure out the timing of the stiffness change of the upper chord beam, that is, the timing of concrete placement, which is an important construction control point.
2 Bending Stiffness Calculation of Concrete-Filled Steel Tube Beam
The roof of Hall 1 in Yellow River Delta Agricultural Products Trading Service Center is composed of 8 composite BSSs arranged longitudinally, as shown in Fig. 1. The span of each composite BSS is 6 + 63 + 12 m, of which the BSS has a mid-span of 63 m and cantilevers of 6 and 12 m on two sides, respectively. The upper chord beam of the BSS adopts a CSFT composite structure. The cross-section sizes of the outer steel tubes are □600 mm × 400 mm × 18 mm and □600 mm × 400 mm × 20 mm, and C30 concrete is filled inside. The lower cable-supported system is made of struts with the size of φ203 × 10, and high vanadium cables with a diameter of 98 mm. The prestress design value of every BSS is 800 kN.

Figure 1: Yellow river delta agricultural products trading service center (Unit: mm)
Prestress-tensioning is a key link in the construction process of BSS. In particular, when the upper chord beam is a composite beam, its bending stiffness will change greatly before and after concrete placement. Whether the cables are tensioned before or after concrete placement, it will have an impact on the prestress-tensioning control value and the mechanical properties of the overall structure during use. Therefore, to ensure the safety and rationality of the construction process of composite BSS, the bending stiffness of CFST should be first accurately calculated, and then the entire tensioning construction process of the composite BSS should be tracked, and the prestress-tensioning control values and mechanical properties of the overall structure when concrete is placed at different times should be compared and analyzed to formulate a reasonable construction plan.
Bending stiffness is the ability of a flexural member to resist bending deformation. Its value and distribution are directly related to the flexural deformation of the beam under bending moment. Taking the simply supported beam shown in Fig. 2 as an example, the axis ACB of the straight beam changes into a curve AC1B under the action of bending moment. Any point C(x, 0) on the axis ACB produces a flexural displacement w(x) in the direction of y. At the same time, the section where point C(x, 0) is located will produce an angular displacement θ(x). If it is specified that w is positive downward and θ is positive clockwise, θ(x) = w’(x) since θ is a small deformation. According to the basic principles of material mechanics, the curvature κ of the neutral layer of an elastically an equivalent straight beam under the action of pure bending moment can be expressed as Eq. (1).

Figure 2: Deflection curve of a simply supported beam
In the formula, ρ is the curvature radius of the deflection line, M is the bending moment, and EI is the bending stiffness of the equivalent straight beam.
Combined with the commonly used engineering dimensions, the span l of a beam is often greater than 10 times the cross-sectional height. At this time, the effect of shear force on w is very small, and it can be approximated according to Eq. (1).
It can be known from geometry that the curvature κ can be expressed as Eq. (2):
When substituting Eq. (2) into Eq. (1), the calculation formula for the bending stiffness of the equivalent straight beam is obtained, as shown in Eq. (3).
Since the deflection curve of a equivalent straight beam under the action of pure bending moment is continuous flat and smooth, w,2 in Eq. (3) can be ignored, so the bending stiffness EI of the equivalent straight beam can be calculated according to Eq. (4).
The core of the above calculation process is to establish the relationship between the bending moment M and the deflection deformation w of the equivalent straight beam. Therefore, the unified-theory of CFST can be used for reference, and the composite beam can be regarded as a homogeneous section, then the equivalent bending stiffness (EI)eq will be calculated through its ability to resist bending deformation.
2.3 Finite Element Calculation of Bending Stiffness of Concrete-Filled Steel Tube Beam
To calculate the bending stiffness quickly, and analyze quantitatively the influence of section size, and contact interface between steel tube and concrete, etc., on the stiffness, the finite element software ANSYS is used to establish a refined numerical model of simply supported CFST beam. Then its deflection curve under the action of pure bending moment is calculated, followed by the (EI)eq being obtained according to Eq. (4), which lays the foundation for the analysis of the overall structure.
According to the section size of the upper chord beam, a simply supported CFST beam is established, and the concentrated force F is applied at the three dividing point of the beam to ensure that the mid-span is under pure bending moment. In order to examine the impact of the interface relationship between steel and concrete on the bending stiffness, the Shell181 element is used to simulate the Q235 outer steel tube, the Solid65 element is used to simulate the internal concrete, and the Contat174 and Target170 elements are used to simulate the bond-slip performance between the steel tube and concrete. The mapping method is adopted in grid meshing, the mesh size is set to 100 mm uniformly, and the finite element model of simply supported CFST beam is established as shown in Fig. 3. Moreover, the span of the beam is taken as L = 9 m, and the Ux, Uy and Uz of the bottom of the leftmost section, and the Uy and Uz of the bottom of the rightmost section are both constrained at the same time. In terms of material properties, the outer steel tube is in the bilinear ideal elastic-plastic constitutive model of steel whose yield strength is set to 235 N/mm2, and the inner-filled concrete is in the classic bond-slip constitutive model of C30~C70 concrete in different samples whose compressive strength varies from 20.1 to 44.5 N/mm2, and tensile strength varies from 2.01 to 3.0 N/mm2 [22]. The contact relationship between the steel tube and concrete is defined as “hard” contact in the normal direction, and the Coulomb friction model is used in the tangential direction [23]. The friction coefficient μ = 0.5 is assumed in the preliminary calculation.

Figure 3: Finite element model
2.3.2 Verification of Finite Element Simulation Method
In order to verify the effectiveness of the finite element model establishment method, the finite element modeling method of this paper is verified using the test model parameters described in reference [24]. As shown in Fig. 4, the section size of the external steel tube of the test model is □220 mm × 220 mm × 4 mm, made of Q235 steel, with specific material properties shown in Table 1. The steel tube is filled with C30 concrete, and a four-point loading method is adopted in the test loading, measuring the vertical displacement at the mid-span, three-point, and support positions during the test.

Figure 4: Sample loading schematic diagram (Unit: mm)

According to the method similar to Section 2.3.1, the finite element model of the test model is established, with the material properties of the steel tube and concrete being completely the same as the test model. The interface friction coefficient between the steel tube and concrete is taken as μ = 0.3, the Shell181 element is used to simulate the Q235 outer steel tube, and the Solid65 element is used to simulate the internal concrete, the rest of the supports and loads are set according to the test conditions. The established finite element model is shown in Fig. 5.
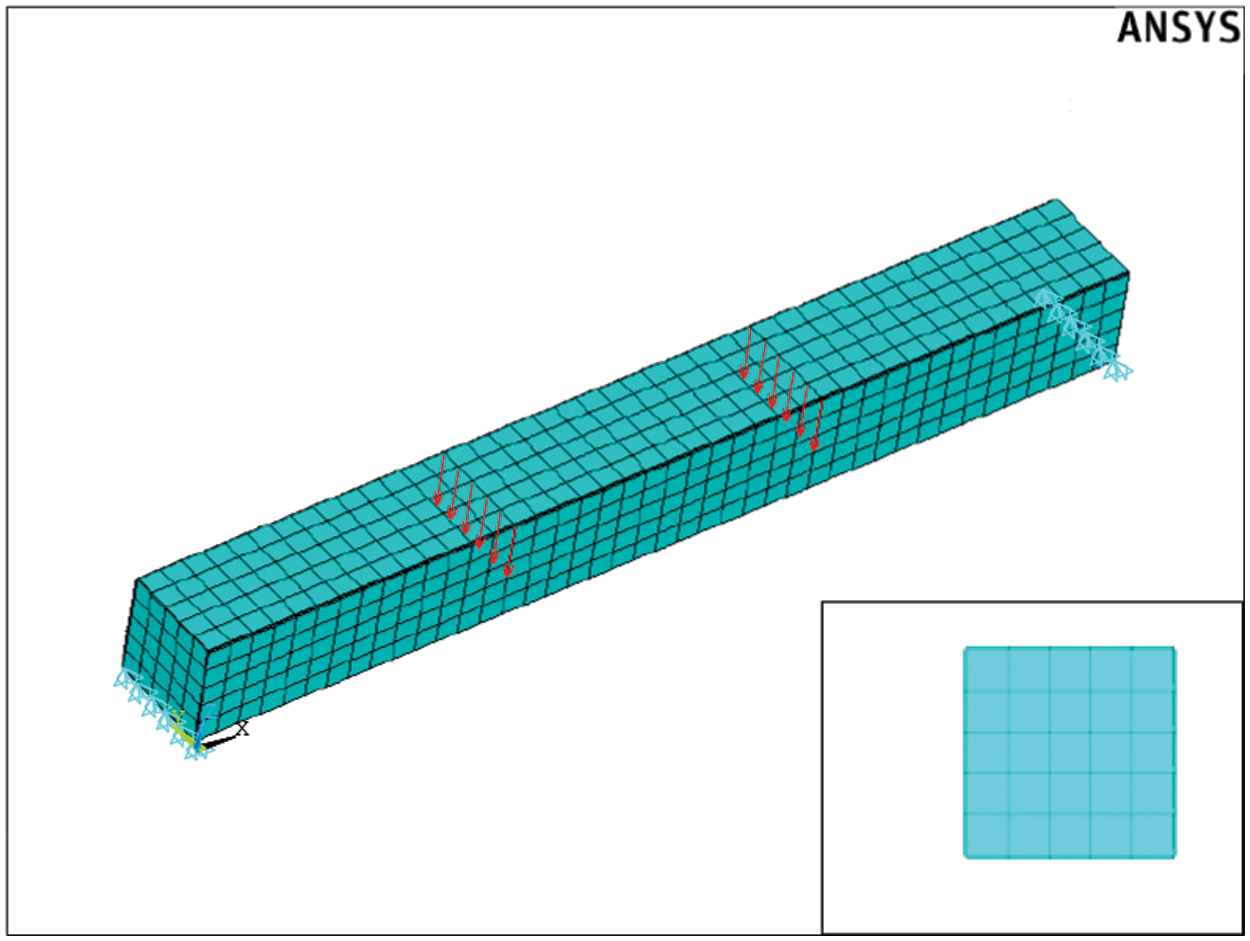
Figure 5: Finite-element modeling
Based on the calculation results, the load-displacement curve of the rectangular CFST beam is firstly drawn to compare with the experimental results in reference [24], as shown in Fig. 6. It can be observed that the finite element calculation results of this paper are very close to both the test curve and the simulation curve from reference [24], with the maximum error from the test curve being only 5%. Furthermore, the test sample had already failed at this point, with the failure location being the bottom tensile region. The finite element calculation results show that although stress concentration occurred at the loading points, as shown in Fig. 7, the maximum equivalent stress in this area has reached 371.6 N/mm², which is the material ultimate tensile strength, and other areas in the bottom tensile region are also close to the ultimate load. It can be seen that the experimental results are also very close to the finite element calculation results, indicating that the finite element modeling method used in this paper has a certain degree of reliability.
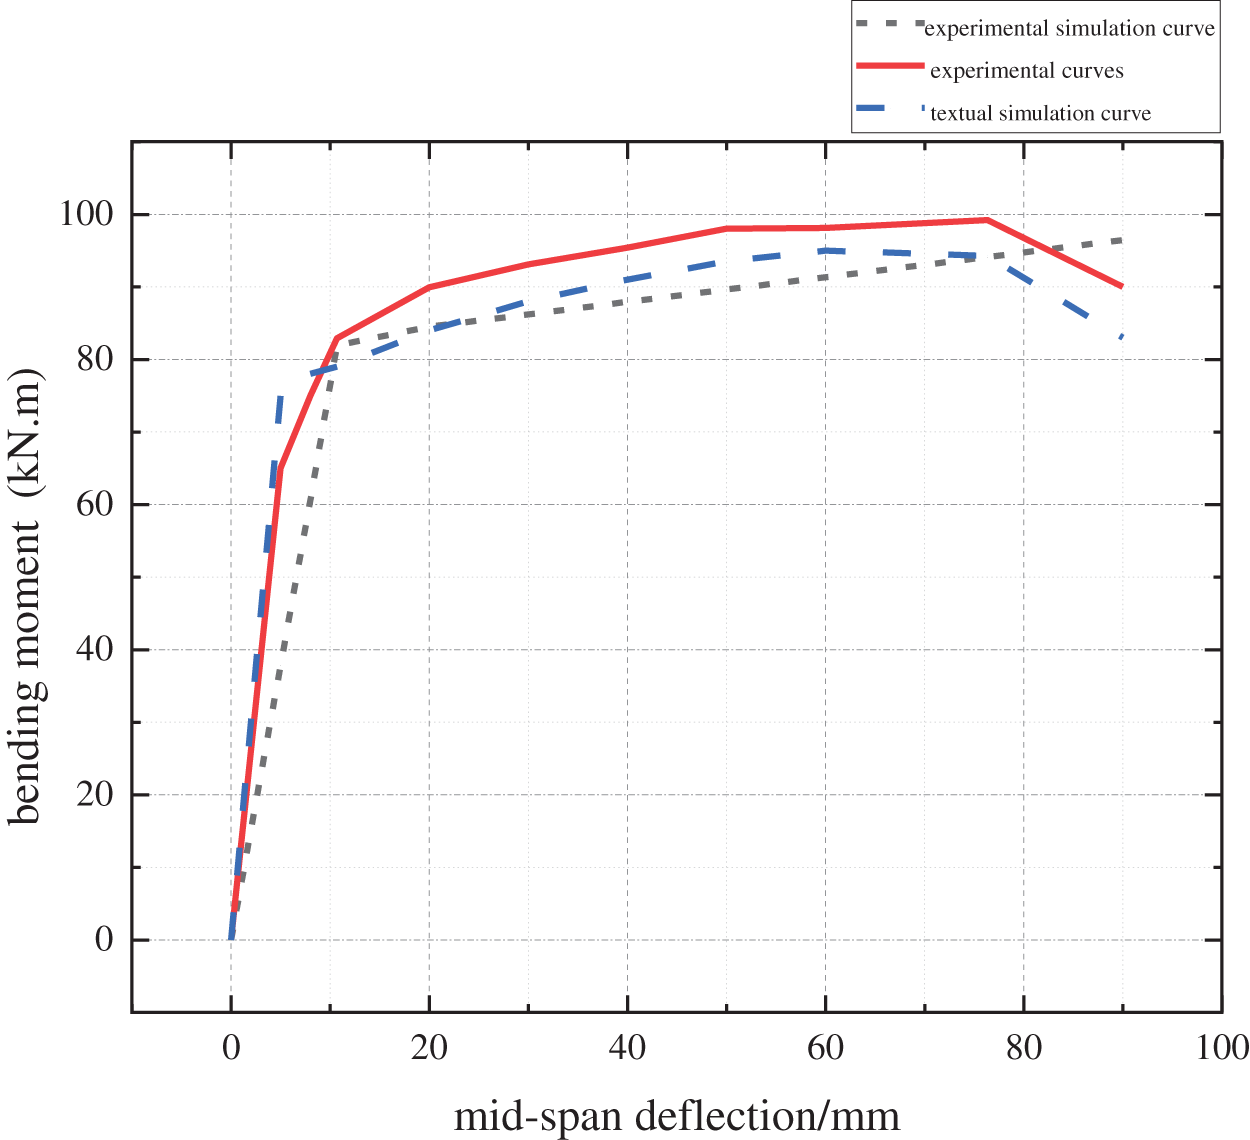
Figure 6: Bending moment-displacement curve diagram
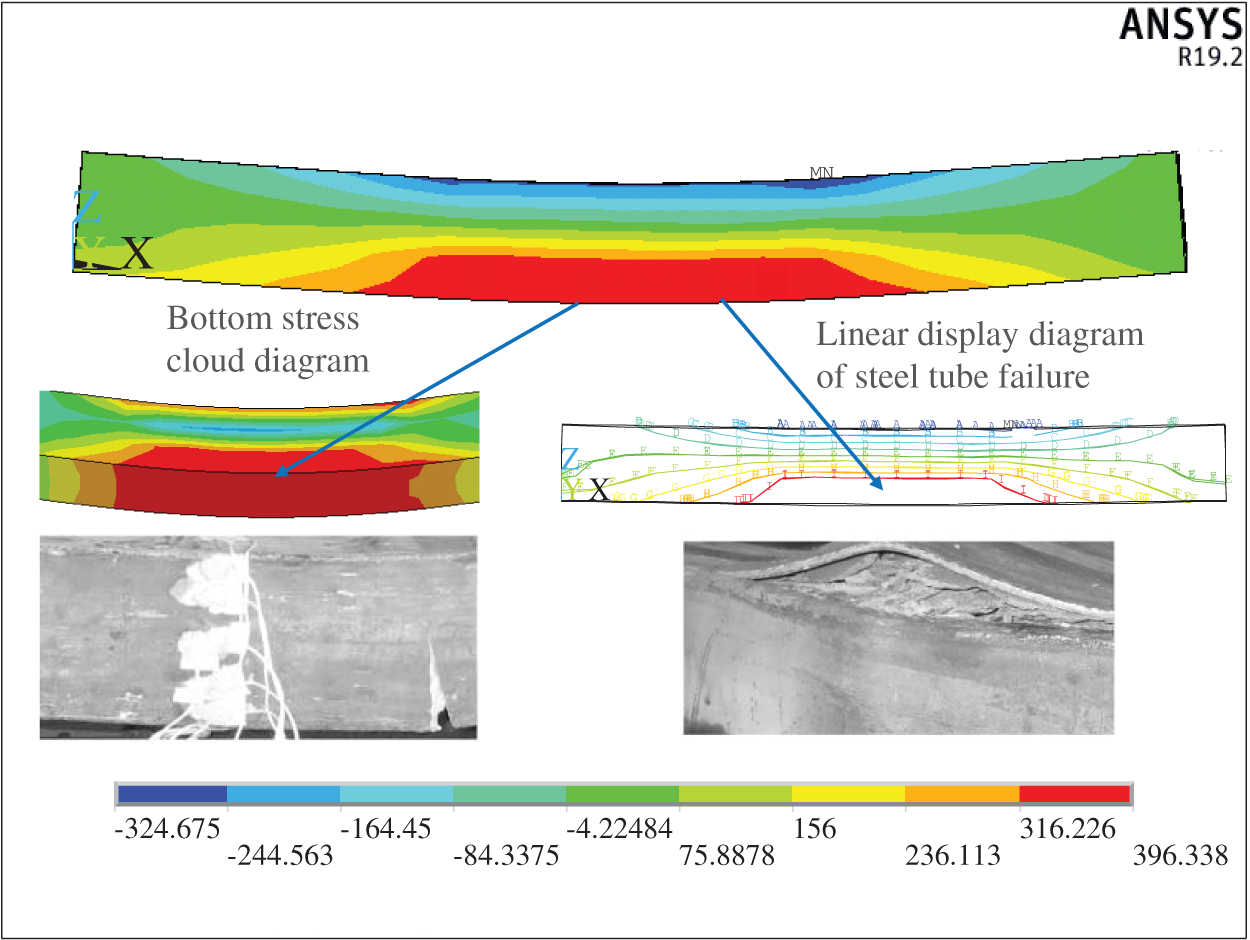
Figure 7: Results comparison diagram
2.3.3 Calculation Process of (EI)eq
In order to accurately obtain the bending stiffness of the CFST during the construction and use stages, the deflection curves of the composite beam under different P are sequentially drawn by tracking the bending process of the composite beam, and the corresponding equivalent stiffness (EI)eq is calculated according to Eq. (4), and its changing curve with P is drawn too, as shown in Fig. 8.
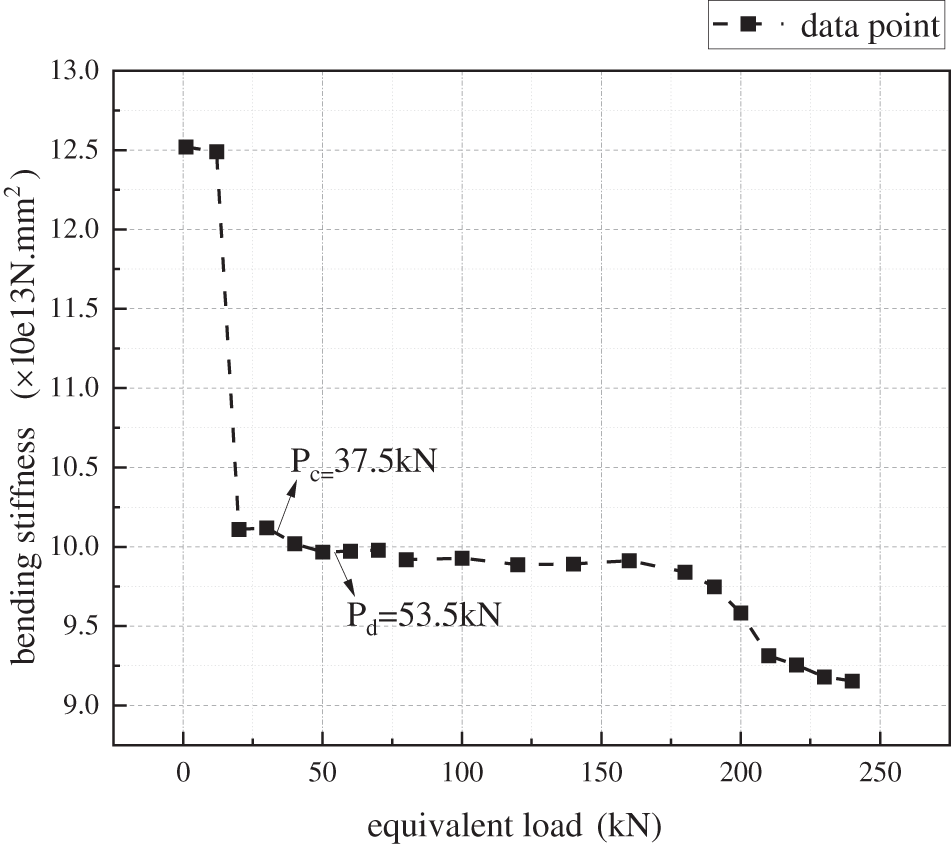
Figure 8: Relation between bending stiffness and force
The curve in Fig. 8 can be divided into 3 stages: When P ≤ 12 kN, the (EI)eq of the composite beam is the largest and remains unchanged briefly; When P exceeds about 12 kN, (EI)eq drops sharply, and then tends to be stable, which can be defined as the elastic stage; When P exceeds about 190 kN, the bending stiffness will show a nonlinear downward trend with the load, and the composite beam enters the plastic stage.
When P = 12 kN, the stress calculation results of the composite beam along the axial direction are extracted. It can be seen that the stress at the bottom of the concrete at this time is 1.77 N/mm2, and the concrete has not cracked yet. When P = 190 kN, the concrete cracking height has expanded to 316.84 mm from the bottom. When 12 kN < P < 190 kN, although the concrete cracking height gradually increases, due to the circumferential hoop of the steel tube, there is still a large bite force and friction force between the cracked concrete interfaces, thus maintaining stable resistance to shear deformation, and its bending stiffness also remains stable.
In actual projects, BSS mainly bear the structure’s self-weight during the construction stage and mainly bear the self-weight and live load of the roof during the use stage. The calculated maximum bending moments in the two stages are Mc = 112.5 kN·m and Mb = 112.5 kN·m, respectively, and the corresponding concentrated loads are Pc = 75 kN and Pb = 107 kN. Obviously, Pc and Pb are both less than the aforementioned 190 kN and greater than the cracking load of 12 kN, which shows they are both in the elastic stage. Therefore, any deflection curve at these stages can be used to solve the subsequent calculation of the bending stiffness of the composite beam.
3 Parametric Analysis of Bending Stiffness
3.1 Expression form of Bending Stiffness of CFST Beams
The expression forms of the bending stiffness of CFST are mainly based on the superposition theory, that is, the stiffness of the steel tube and concrete is calculated, respectively, and then the reduction coefficient of concrete stiffness α is introduced to obtain the total bending stiffness of the composite section, as shown in Eq. (5). Based on this form, this paper conducts a parametric analysis of the bending stiffness and reduction coefficient α of CFST beams.
In the above formula, Es and Ec are the elastic modulus of steel tube and concrete, respectively; Is and Ic are the inertial moments of steel tube and concrete, respectively.
The values of α in various countries are not uniform with great differences, such as, the α in AIJ (1997) is 0.2, in BS5400 (1979) is 1.0, in EC4 (1994) is 0.6, in AISC-LRFD (1999) is 0.8. As for α, scholars have also reached a consensus that it is related to the bonding effect between steel tube and concrete. Therefore, in order to establish a calculation method for the bending stiffness (EI)eq of CFST, a parametric analysis of α is first conducted.
3.2 Sensitivity Analysis of Parameters
In order to quantify the influence of various factors on the bending stiffness of CFST beams, the orthogonal test idea is used to design samples [25–27], and the factor levels are designed as shown in Table 2. Among them, μ is generally 0.2~0.6, for convenience of comparison, its value range is expanded as 0~1.0.

Each factor in Table 1 is set at 5 levels. According to the orthogonal test, the 4-factor and 5-level simulation test only needs to carry out for 25 times to analyze the influence of each factor on the bending stiffness. Table 3 shows the details of the samples.

According to Table 3, refined numerical models of 25 groups of rectangular CFST beams are established. After calculating the (EI)eq of each group according to the method in Section 2.2, the α of each group can be obtained according to Eq. (5). Fig. 9 shows the α distribution of the 25 groups of samples, it can be seen that the reduction coefficient α of all the models are all greater than 0, which indicates that the core concrete contributes to the bending stiffness to varying degrees. Among them, the α in group 6 is the largest, which is 0.483, and the α in group 10 is the smallest, which is 0.045; The average α of the 25 groups is 0.192, which is also closer to 0.2 in the specification AJJ (1999).
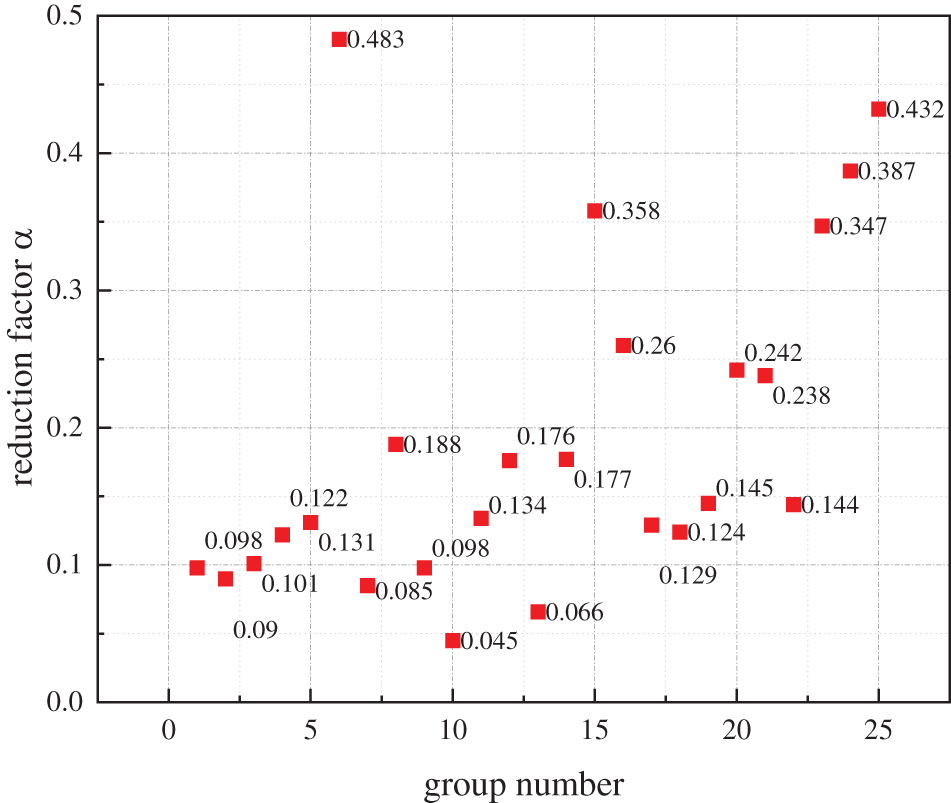
Figure 9: Distribution of α
Range analysis is an intuitive and clear analysis method for sensitivity analysis. The evaluation standard relies on the range value R. Range analysis is performed on 25 groups of models. The calculation results are shown in Table 4. Combined with the comparison of R values, it can be seen that h/b is the biggest factor, followed by μ, then t and Ec, that is, h/b > μ > t > Ec.

In addition, according to the Kavg calculation results in Table 3, the optimal level of each factor can be obtained. Specifically, h/b is optimal at the 5th level, t is optimal at the 1st level, Ec is optimal at the 5th level, and μ is optimal at the 4th level.
In order to verify the validity of the orthogonal design experiment and range analysis in evaluating the sensitivity of the parameters, we further apply the Morris method to calculate the sensitivity index and rank the parameters according to the influence of these indices on the parameters. Fig. 10 shows the results of the analysis, which agree with the parameter sensitivity ranking obtained through orthogonal design experiments and range analysis, h/b > μ > t > Ec. The results demonstrate that our parametric sensitivity analysis method based on the principle of orthogonal experimental design is appropriate.
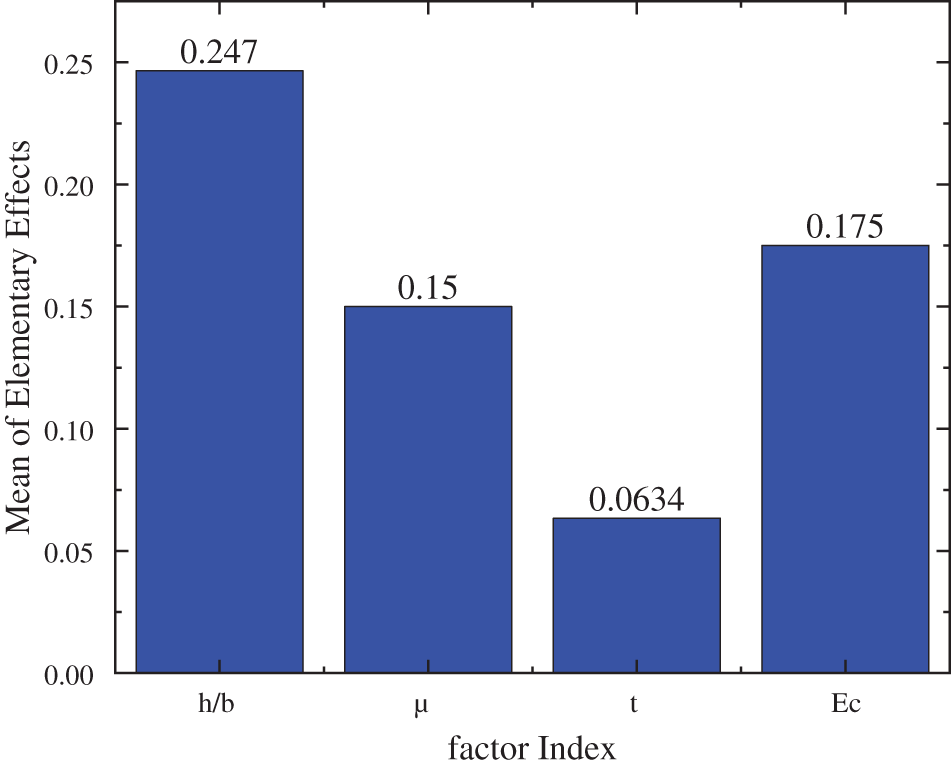
Figure 10: Morris method parameter sensitivity analysis results
The aforementioned analysis has obtained the influence of factors such as h/b, t, Ec, and μ on α. However, in order to calculate the specific value of α based on each factor, the quantitative relationship between α and each single factor should also be clarified. To this end, based on the calculation results in Section 3.2, taking the optimal levels of each factor as the benchmark, that is, h/b = 3, t = 8 mm, Ec = 3.7 × 10⁴ N/mm2, μ = 0.5, the changing rule of α is recalculated when a single factor changes. Taking the h/b as an example, five sets of models are re-established to ensure that the t, Ec, and μ of each model are at the aforementioned optimal levels, and the h/b is taken as 1.0, 1.5, 2.0, 2.5, and 3.0, respectively. The calculated curve of α with h/b is shown in Fig. 11. With the same method, when the remaining factors are calculated to be at optimal levels, the variation curves of α with single factors such as t, Ec, and μ are shown in Figs. 12–14, respectively. From Figs. 11–14, the relationship between α and h/b, t, Ec, and μ is obtained by the methods of mathematical statistics, as shown in Eqs. (6) to (9), respectively.
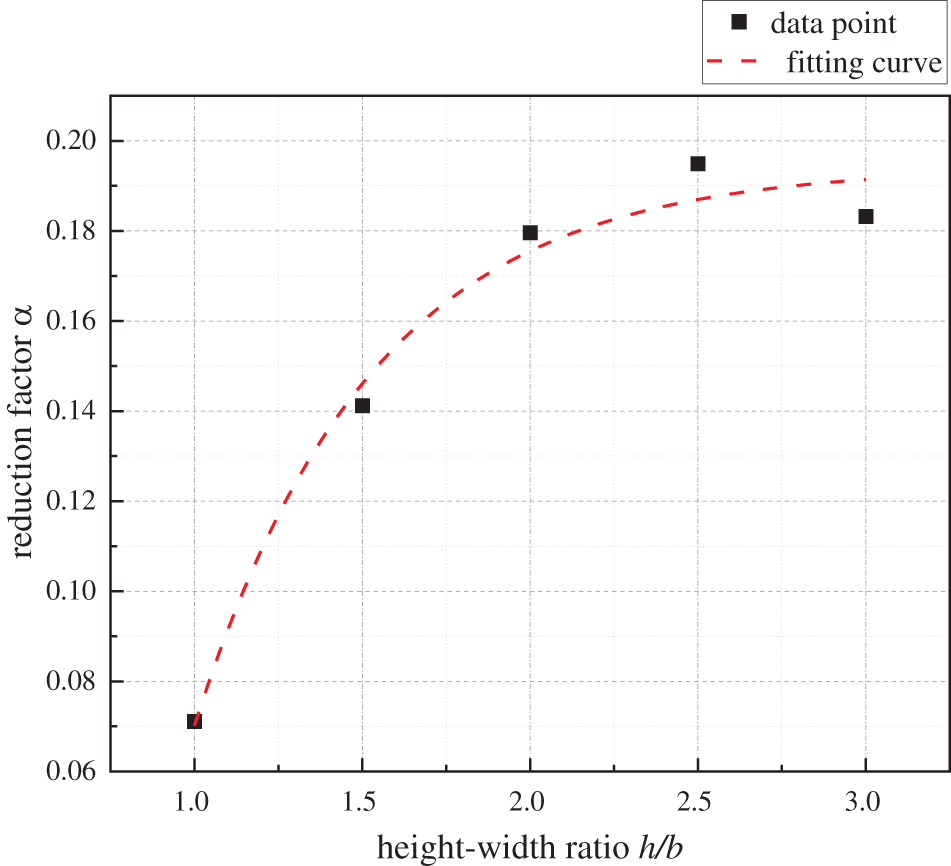
Figure 11: α changes with h/b
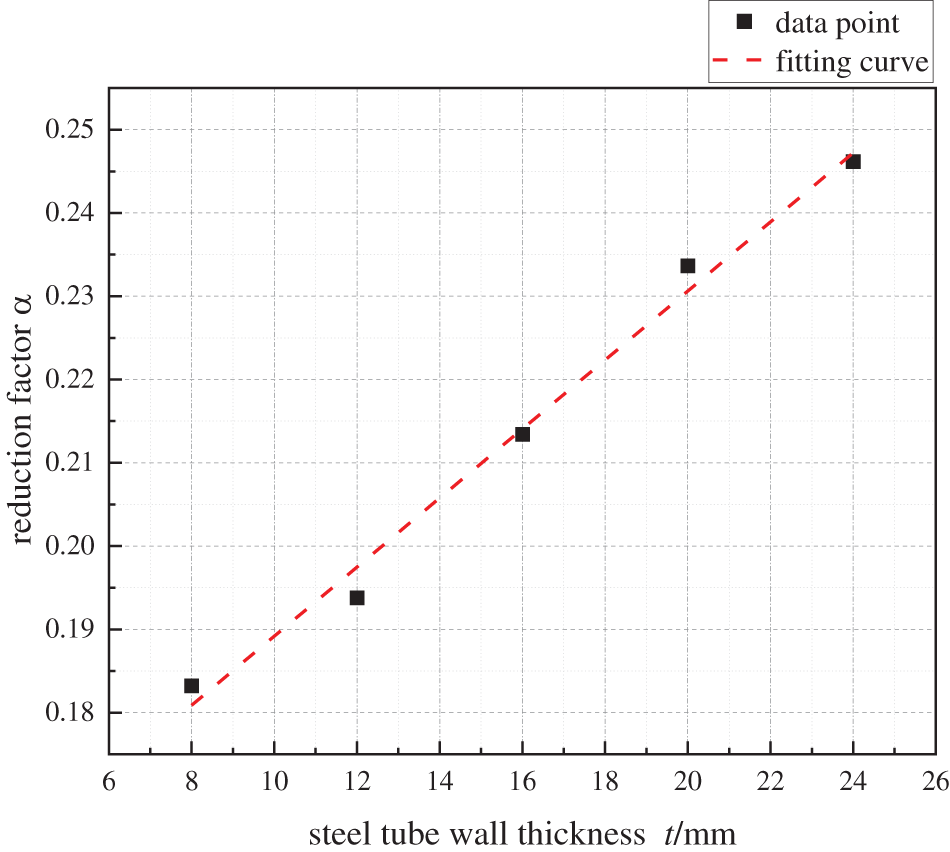
Figure 12: α changes with t
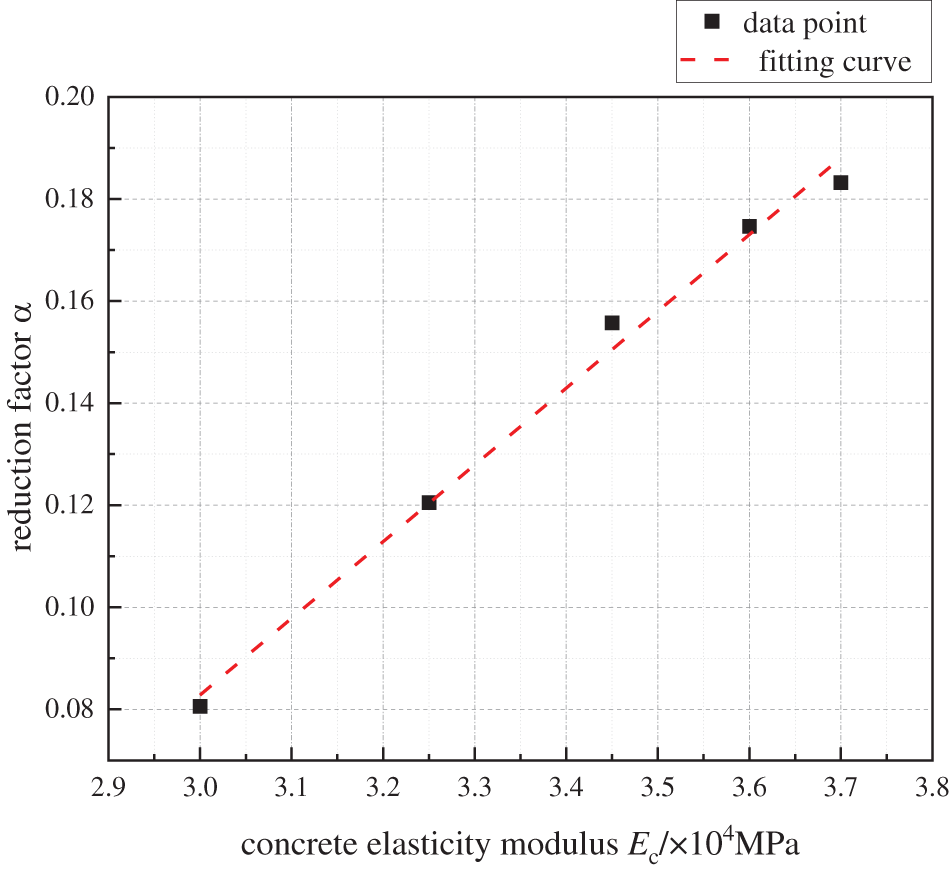
Figure 13: α changes with Ec
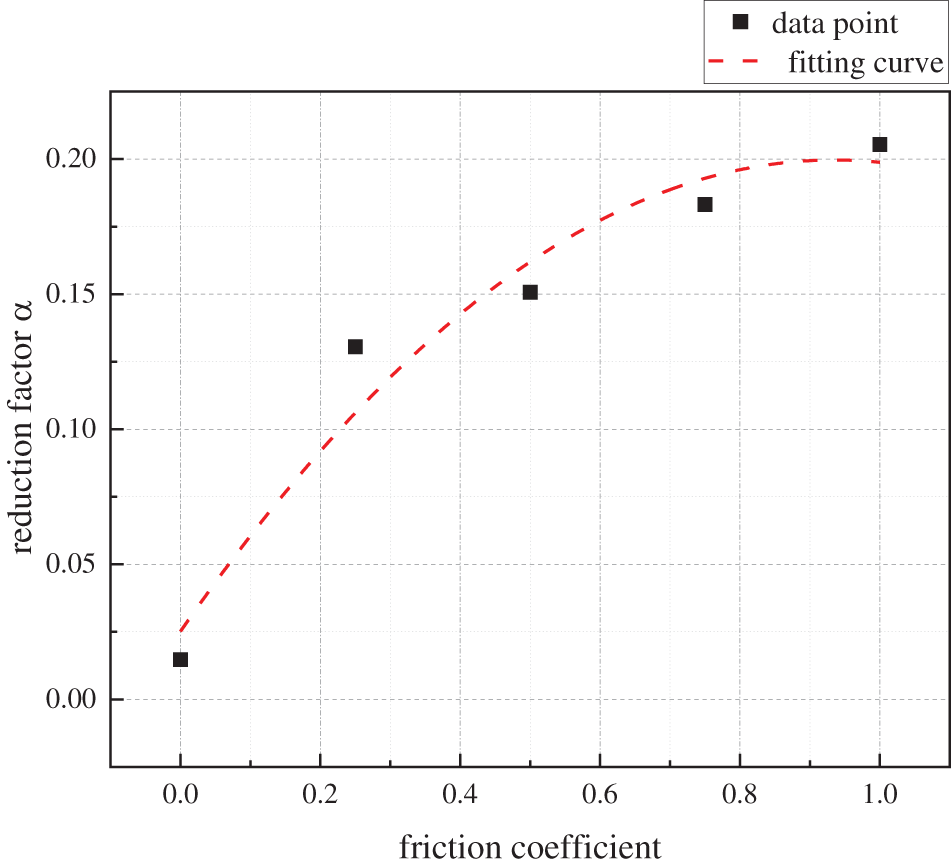
Figure 14: α changes with μ
With Eqs. (6) to (9), multiple nonlinear regression analysis methods are used to fit the data point curve formed by each factor. Thus, the multivariate fitting relationship between α and h/b, t, Ec, μ, and other factors is obtained, as shown in Eq. (10).
4 Impact of Bending Stiffness on Timing of Concrete Placement
During the construction of composite BSS, the timing of concrete placement has a great influence on the selection of construction equipment and control methods. As shown in Fig. 15, a temporary support frame is firstly set near the middle span before installing the upper chord beam, and then two segments of hollow steel tubes are welded and assembled into a whole beam on the temporary support frame at high altitude. At the same time, the lower cable-supported system composed of struts and cables is suspended below the upper chord steel beams without tensioning. Then, the upper hollow steel tubes are filled with concrete and the lower cable-supported system is tensioned. In theory, after the upper hollow steel tubes have been assembled, there will be two methods for the subsequent construction. The first one is to pour concrete into the hollow steel tubes first, and then tensioning prestress. The specific construction steps are: After the installation of the pure steel structure has been finished on the temporary supported frame, the concrete is poured into the steel tubes from both ends to the middle-span through two grouting holes near the left and right supports; When the strength of inner concrete reaches 80% of its design value, tensioning the lower cables in the cable-supported system, and the upper CFST composite beam will arch upward under the action of prestress, resulting in naturally detaching from the temporary supported frame; After the prestress reaches the control value, the cable can be anchored to complete the prestress-tensioning. The second method is tensioning first and then concrete placement. The specific steps are: After the assembly of the upper steel beam is completed, closely followed by tensioning the lower cable, at this time, the stiffness of the upper steel beam is relatively small, and the steel beam will have a large upward deformation and quickly break away from the temporary support frame. After the prestress reaches the design value, the temporary support frame can be removed, and concrete is poured into the upper hollow steel tube. Then the upper chord beam will deform downward due to the influence of the concrete’s own weight, and part of the pre-arch deformation will be offset in advance.
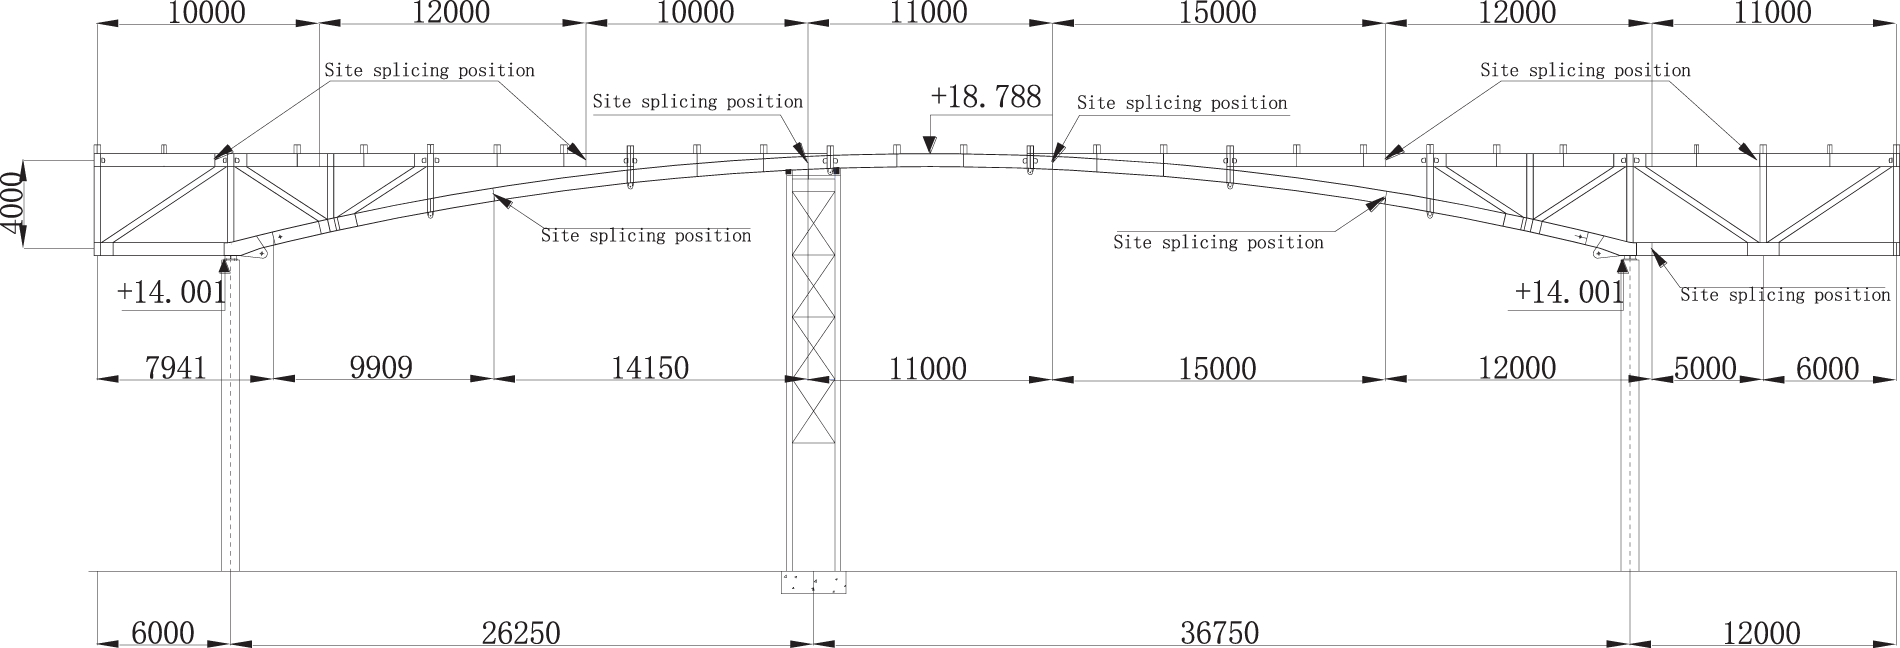
Figure 15: Schematic diagram of BSS construction processes (Unit: mm)
According to the above analysis, when the construction method of concrete placement first and then tensioning is adopted, the upper chord beam exerts the combined effect during the tensioning process. The structure is formed by one-time tensioning, and the structure has high stiffness and small deformation, which is easy to control during construction, however, the tensioning control force is large and the equipment requirements are high. When tensioning fist and then concrete placement is adopted, all prestress will be applied to the steel structure, so the internal stress of the concrete is small and it is not easy to crack. However, the steel tube is subject to large forces and deforms during the tensioning process, which is not conducive to construction control. Both plans have their own advantages and disadvantages, and they need to be analyzed in depth to determine the optimal timing of concrete placement.
ANSYS is used to establish the finite element model of the composite BSS. The upper chord CFST beam and other truss members are simulated with Beam188, the struts are simulated with Link8, and the cables are simulated with Link10. The Combin14 spring elements are adopted to simulate the horizontal stiffness of the rubber supports in actual engineering with the spring constant k = 2 × 10³ N/mm. At the same time, all rotation constraints at the support joints are released. According to the design requirements, the design value of the prestress is 800 kN. Only the self-weight of the structure is considered during the construction stage. The live load of the roof 0.5 kN/m2 is considered during the use stage and converted into a linear load of q = 6 kN/m. According to the actual section size of BSS, the equivalent stiffness reduction coefficient α of each upper chord beam are calculated according to Eq. (10), that is the α of the mid-span section B5 is 0.280, and the α of the other sections is 0.202.
The timing of concrete placement will not only affect the load on the structure, but more importantly, it will change the stiffness of the upper chord beam. Therefore, in order to accurately obtain the impact of concrete placement time on structural performance, it is necessary to accurately simulate the stiffness and load of the BSS during the construction process. The simulation methods of the two construction methods are introduced below.
4.1.1 Concrete Placement First and Then Tensioning
When the construction method of concrete placement first and then prestress-tensioning is adopted, the structure will enter the load-bearing stage after two construction stages. The structural forms, loads and other information of each stage are shown in Table 5.

Remarkably, when the tensioning is completed, the internal force of the cables should be exactly their prestressed control value, that is, Pcontrol = 800 kN, and the prestress value of cables f1 in the load-bearing stage will be greater than the prestressed control value of 800 kN. The calculation process is shown in Fig. 16, when ANSYS finite element software is used for analysis.
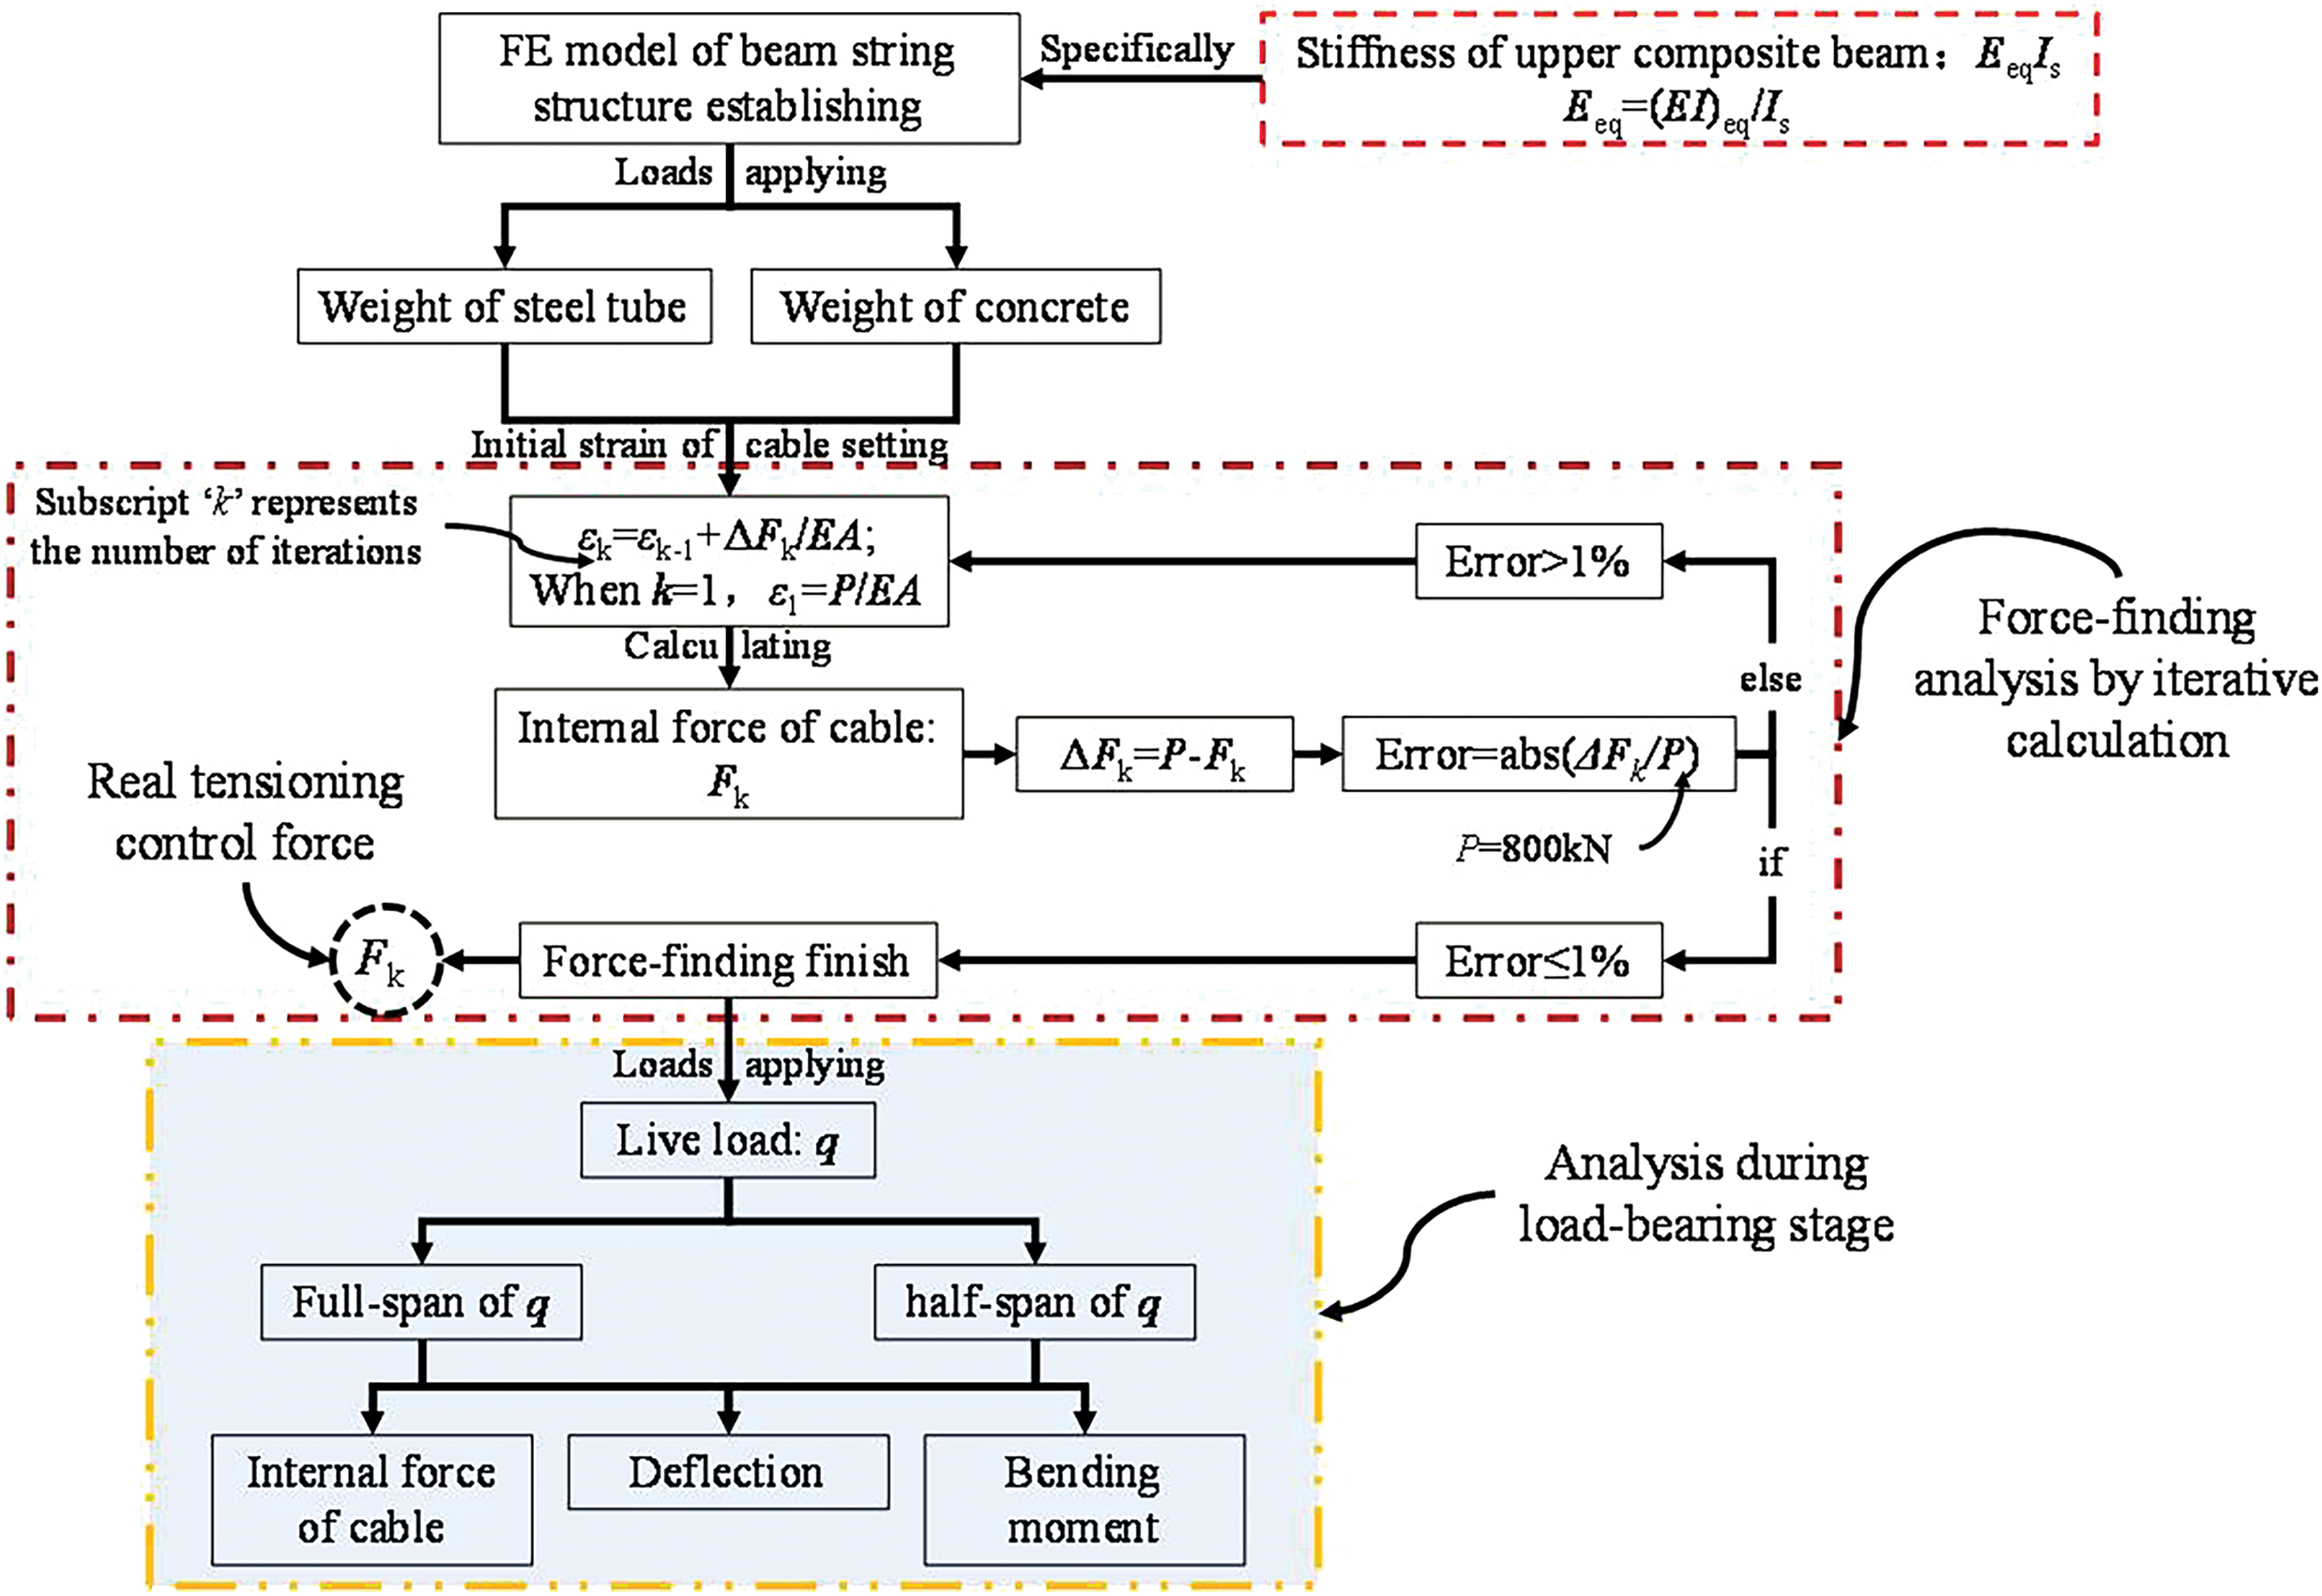
Figure 16: Finite element calculation process of first concrete placement and then tensioning
4.1.2 Tensioning First and Then Concrete Placement
Similarly, when the method of tensioning first and then concrete placement is adopted, the structural forms of each stage are shown in Table 6.

When the construction method of tensioning first and then concrete placement is adopted, the prestressed control value P1 in the tensioning stage is not equal to Pcontrol in the structural design. A new force analysis should be performed to ensure that the prestressed value of the structure when the concrete placement is completed, that is, when the construction of the overall structure is completed, is exactly Pcontrol. Therefore, the prestressed control values of the two construction methods are different, and the internal forces and deformations of the structure during the construction and use stage are also different. The specific calculation process is shown in Fig. 17.
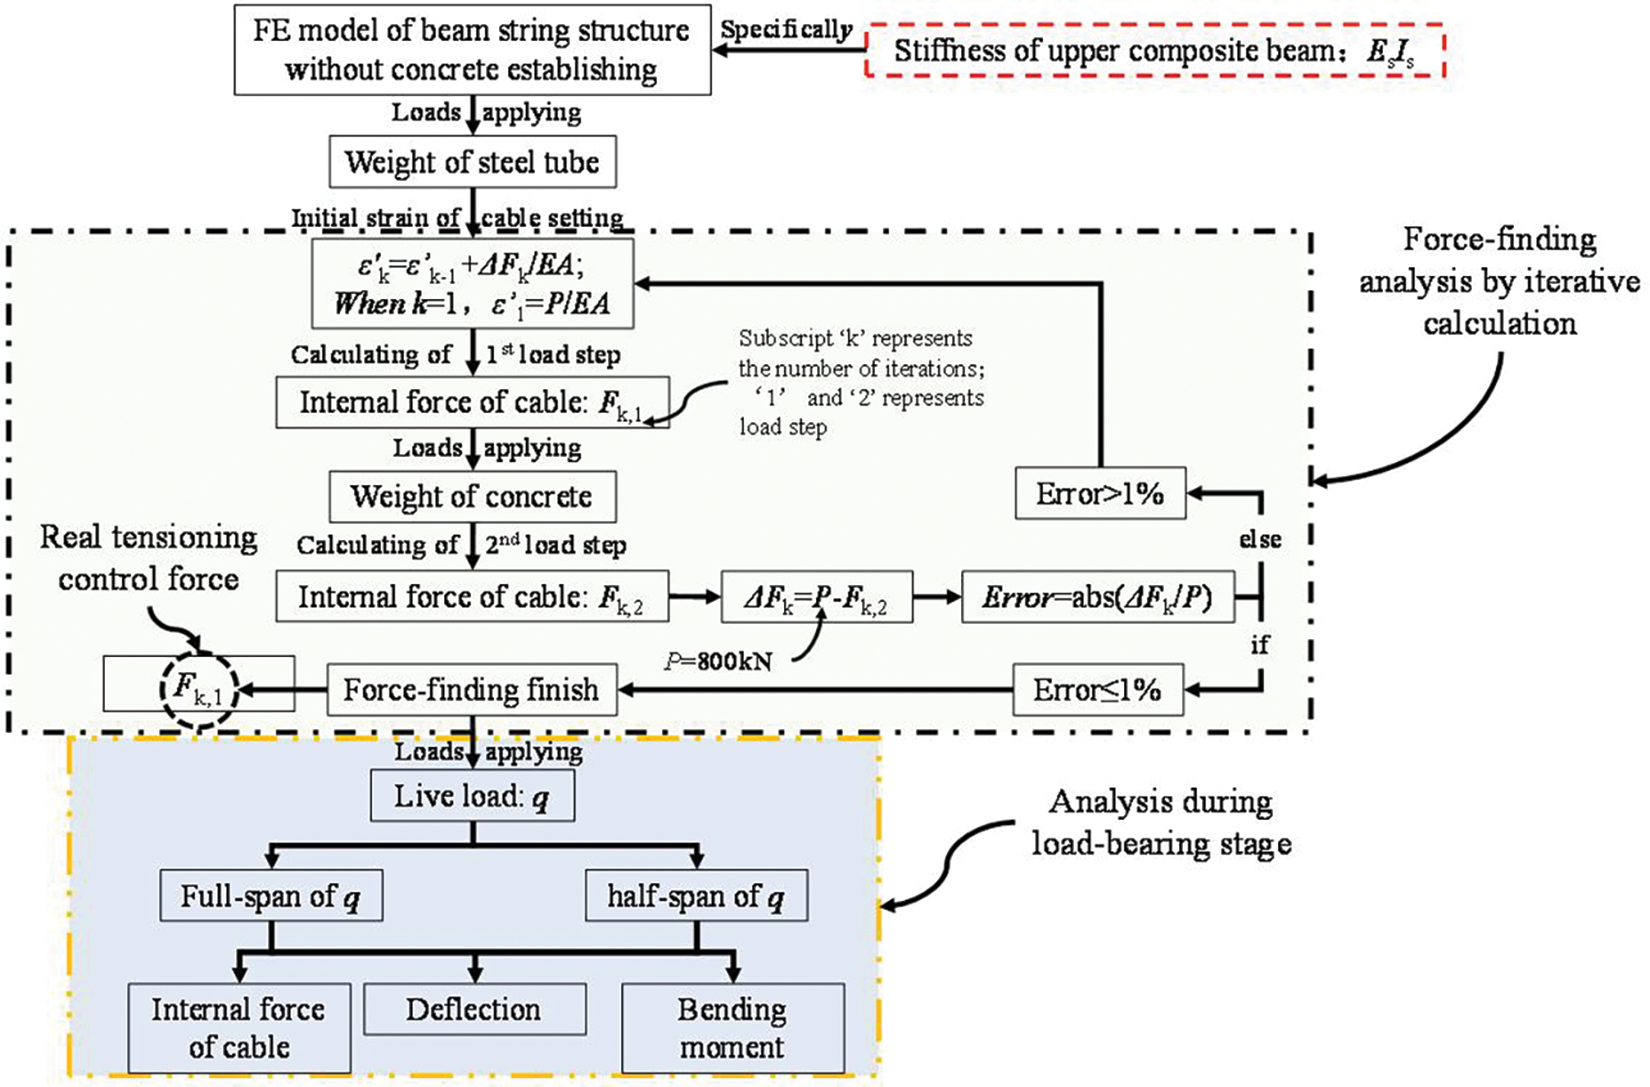
Figure 17: Finite element calculation process of first tensioning and then concrete placement
For the convenience of description, the construction plan of placement first and then tensioning corresponding to Table 4 is briefly named as Plan①, and the construction plan of tensioning first and then placement corresponding to Table 5 is briefly named as Plan②. Among them, Plan② corresponds to two stages during calculation: stage②-1 refers to the period before tensioning is completed; stage②-2 refers to the period before concrete placement is completed. The following is a comparative analysis of the two construction plans from the mechanical performance during the construction process and use stage.
4.2.1 Comparative Analysis of Mechanical Properties during Construction
1) Internal force of cable and tensioning control force
The finite element model corresponding to Plan① and Plan② is analyzed, respectively, and the internal force values of the cables at each stage of Plan① and Plan② are extracted and shown in Table 7.

It can be seen from Table 7 that when adopting Plan①, if the prestress is tensioned at both ends, the tensioning control force can be taken as 798.2 kN. When using Plan②, the prestress-tensioning construction occurs in stage② -1, and the tensioning control force at both ends is only 436.7 kN, thus the requirements for tensioning equipment are lower. Therefore, only from the perspective of tensioning control value, Plan② is better than Plan①.
2) Vertical deformation
The vertical deformation results of each stage of Plan① and Plan② are extracted, as shown in Fig. 18. It can be seen that when the construction is completed, the values of arch camber at the mid-span of Plan① and Plan② are 140.6 and 150.7 mm, respectively, and that of Plan② increases by 7.2% compared to that of Plan①. From the perspective of the construction process, in Plan②, during the process of prestress-tensioning, the vertical deformation at the mid-span gradually increased from 0 to 214.2 mm at the end of stage②-1 and then dropped to 150.7 mm after the concrete placement is completed at the end of stage②-2, thus the maximum control value of deformation during the construction process is 214.2 mm.
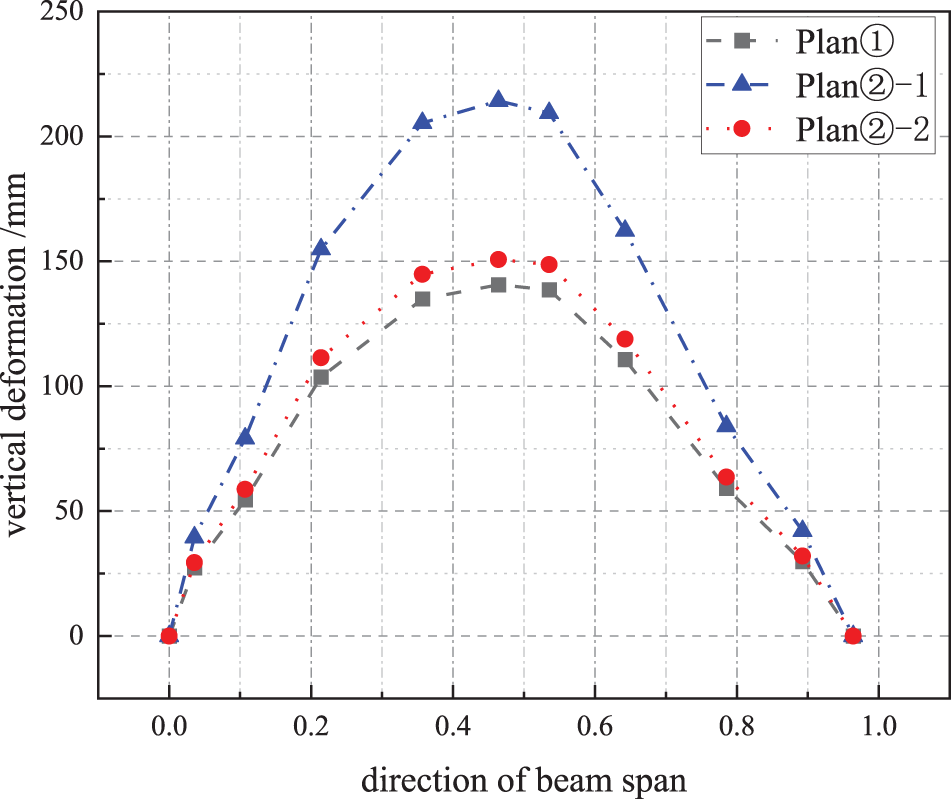
Figure 18: Curve of vertical deformation
It can be seen from the above analysis that although the final estimated value of arch camber of Plan② is greater than that of Plan①, the difference between them is only 7.2%, which is negligible. At the same time, the deformation range of Plan② during the construction process is nearly twice that of Plan①, and the construction control measures are more complicated. Therefore, from the perspective of vertical deformation, it is recommended to adopt Plan①.
3) Internal force of upper chord
The variation curves of the equivalent bending moment of the upper chord composite beam along the span direction in each stage of Plan① and Plan② are extracted and shown in Fig. 19. When the construction is completed, the laws of bending moment distribution of the upper chord beams of Plan① and Plan② are consistent. The maximum bending moment are 172.5 and 165.4 kN·m, respectively. Plan① can reserve more prestressed internal force in the upper chord beam for the use stage. Plan② will produce a large bending moment due to the weak stiffness of the hollow steel tube at the end of the stage②-1, reaching 271.7 kN·m. Therefore, from the perspective of the internal force of the upper chord, Plan① is better than Plan② in terms of both prestressed internal force reserve and construction process safety.
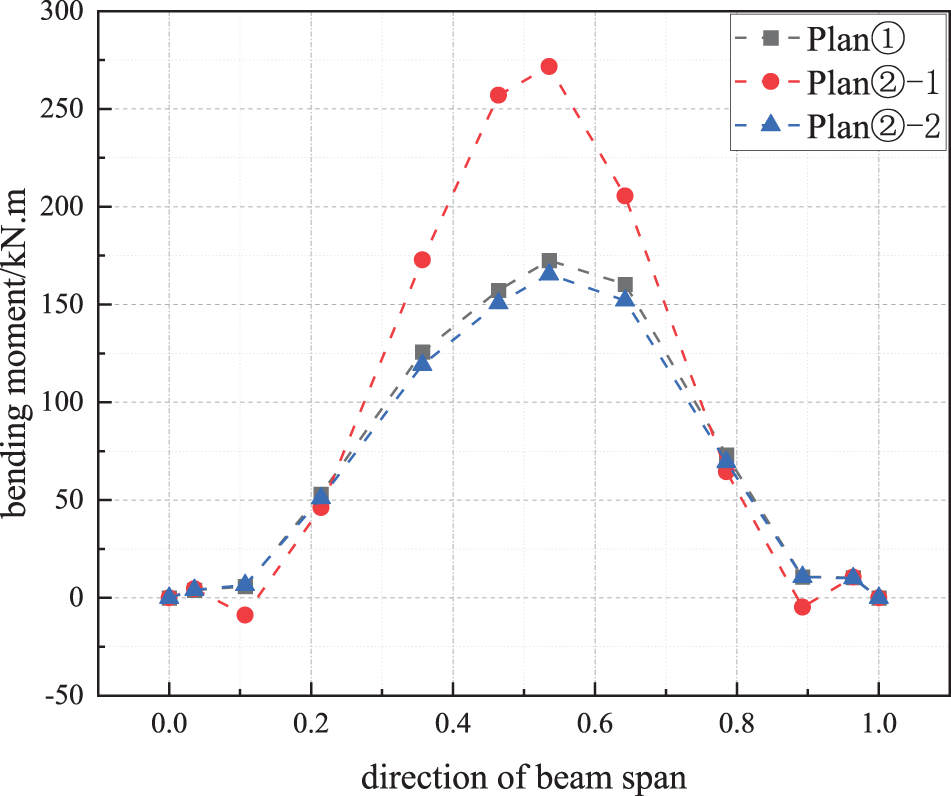
Figure 19: Curve of bending moment of upper chord beam
4.2.2 Comparative Analysis of Mechanical Properties during Use Stage
In order to ensure that the analysis results are representative to a certain extent, the full-span arrangement and half-span arrangement with live load are considered in the structural bearing stage.
1) Vertical deformation
The calculation results of vertical deformation under the action of full-span and left half-span live load corresponding to the two construction plans are extracted, and their variation curves along the span direction are drawn, as shown in Figs. 20 and 21.
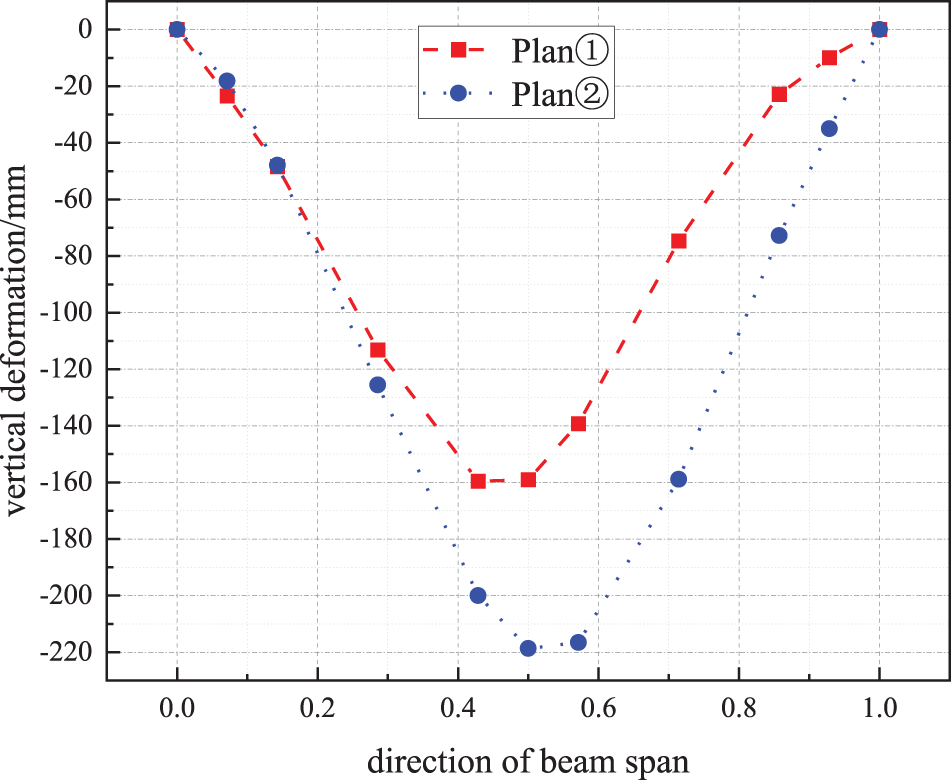
Figure 20: Deflection of upper chord beam under full-span live load
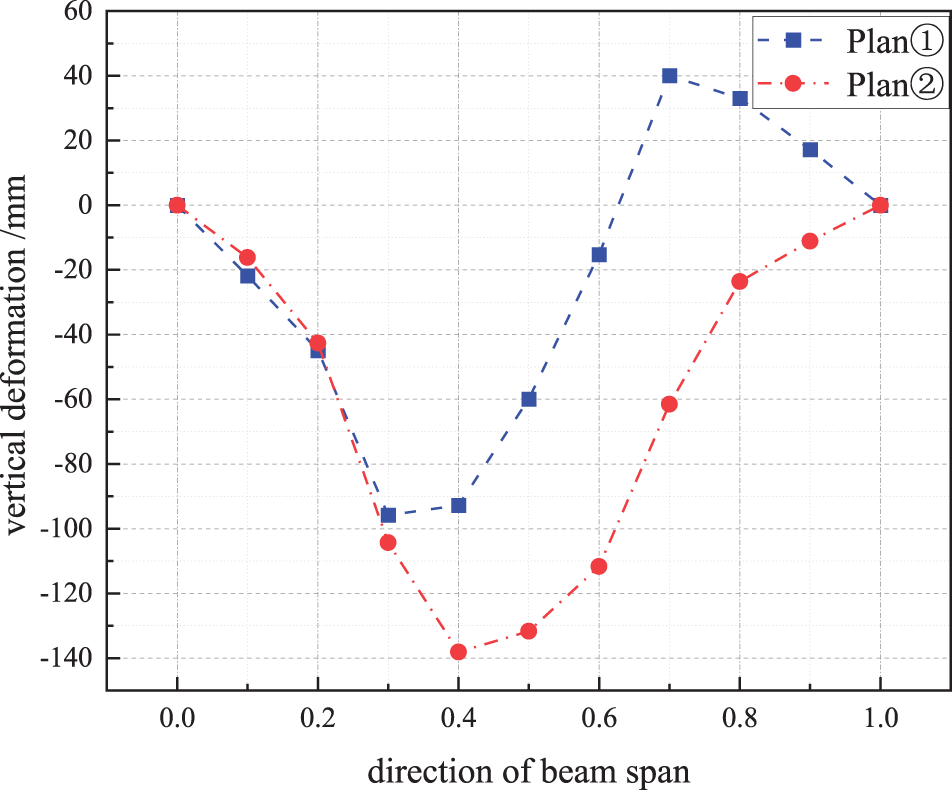
Figure 21: Deflection of upper chord beam under left half-span live load
It can be seen from Fig. 20 that under the action of full-span live load, the maximum values of deflection displacement of Plan① and Plan② both occur near the mid-span, which are −159.6 and −218.7 mm, respectively, and the latter is 37.0% higher than the former. At the same time, it can also be seen from Fig. 18 that no matter which construction plan is adopted, the deformation of the upper chord beam under the uniform full-span live load is not symmetrical. The main reason is that the cantilevered spans on the left and right sides are not equal, and the cantilevered span on the right side is larger and the load is relatively larger, which can reduce the vertical deformation in the middle-span near the right side.
It can be seen from Fig. 21 that the deflection displacement curves of the upper chord beam of Plan① and Plan② both show asymmetric distribution. In the left half-span with the distribution of live load, the change range is large. The deflection values at mid-span are −58.9 and −131.7 mm, respectively, and the difference between the two is doubled.
From the above results, whether it is under the action of full-span or half-span live load, the maximum value of displacement of Plan② has a larger deviation. Therefore, from the perspective of vertical deformation, it is recommended to adopt Plan①.
2) Internal force of upper chord beam
Under the action of full-span live load, the equivalent bending moment curves of the upper chord composite beam in each stage of Plan① and Plan② that change with the beam span direction are shown in Fig. 22. It can be seen from Fig. 18 that under the action of full-span live load in Plan① and Plan②, the trend of curves is roughly the same, and the bending moment curves are distributed in an inverted ‘W’ shape. At the position close to the supports, positive bending moments are mainly distributed, and at the mid-span, negative bending moments are mainly distributed. The maximum bending moments (absolute values) of Plan① and Plan② are 459.3 and 435.6 kN·m, respectively, both appearing at the mid-span. The difference between the maximum bending moment values of Plan① and Plan② is only 5.4%.
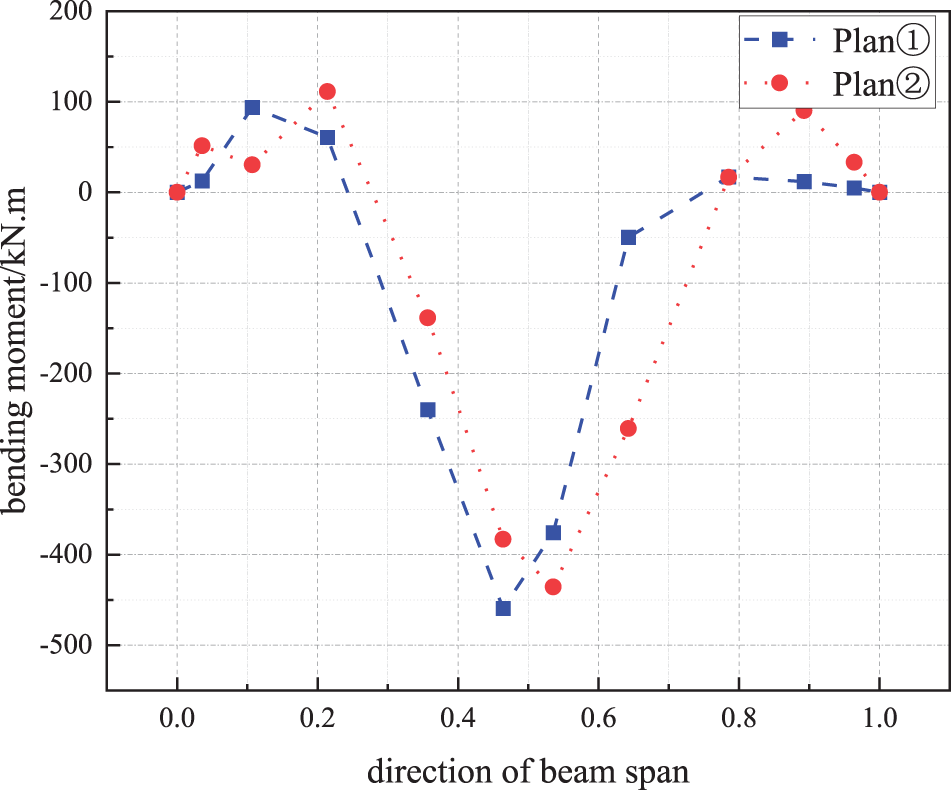
Figure 22: Curve of bending moment of upper beam under full-span load
Under the action of live load on the left half-span, the equivalent bending moment curves of the upper chord composite beam in each stage of Plan① and Plan② change with the beam span direction are shown in Fig. 23. It can be seen that in Plan① and Plan②, under the action of live load on the left half-span, the trend of curves is roughly the same. However, the bending moment appears asymmetrically distributed. In the left half-span with the distribution of live load, the bending moment changes greatly. In the right half-span where there is no live load, the bending moment changes slightly. The bending moment reaches the negative maximum value near the mid-span. The maximum negative bending moments of Plan① and Plan② are 443.5 and 331.6 kN·m, respectively.
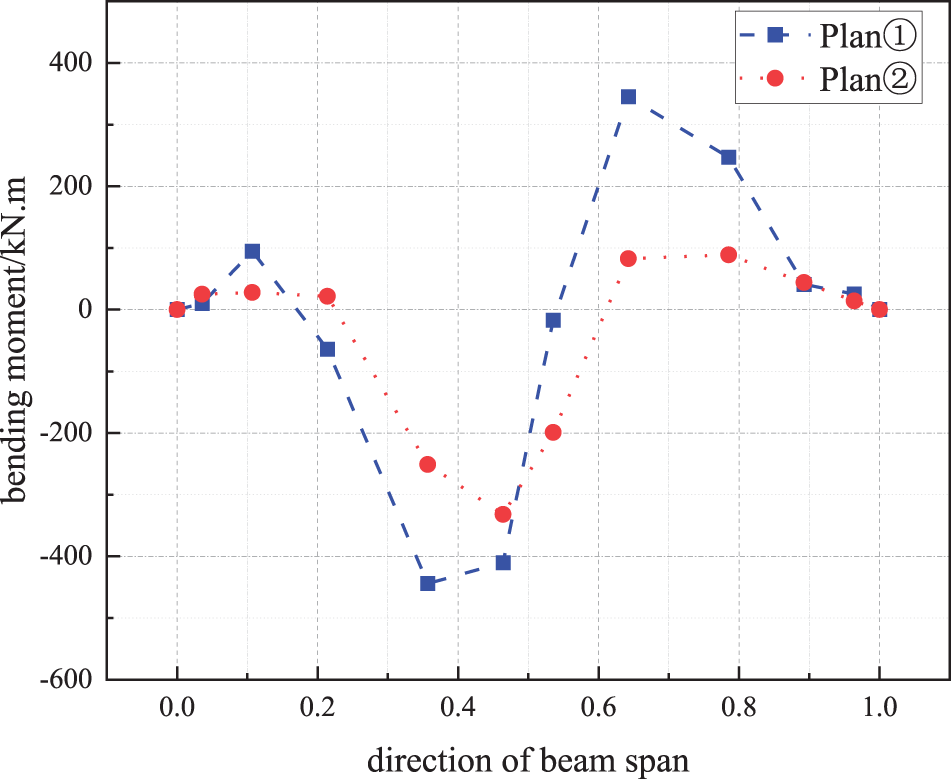
Figure 23: Curve of bending moment of upper beam under half-span load
Therefore, only from the perspective of the internal force of the upper chord, Plan② is better than Plan① for both the full span and the half-span live load.
In order to clarify the impact of the bending stiffness of CFST on the mechanical properties of composite BSS during construction and use stages, this paper relies on actual projects to conduct research on the calculation method of the equivalent bending stiffness of CFST and its impact on key construction links. And a calculation formula for the equivalent bending stiffness of CFST composite beams that takes into account multi-parameter changes is established. Then the calculated equivalent bending stiffness is introduced into the construction and use stages of the composite BSS, respectively, structural deformation and internal force of key members are comparatively analyzed when adopting two construction methods of first prestress-tensioning and then concrete placement and first concrete placement and then prestress-tensioning.
Acknowledgement: None.
Funding Statement: The authors received no specific funding for this study.
Author Contributions: Zhenyu Zhang and Quan Jin: study conception and design; Haitao Zhang and Zhao Liu: data collection; Yuyang Wu and Longfei Zhang: analysis and interpretation of results; Zhenyu Zhang and Renzhang Yan: draft manuscript preparation. All authors reviewed the results and approved the final version of the manuscript.
Availability of Data and Materials: Not applicable.
Conflicts of Interest: The authors declare that they have no conflicts of interest to report regarding the present study.
References
1. Xue WC, Liu S, Su XL, Lu P. Design optimization and experimental study on prestressed beam string of Shanghai Yuanshen Arena. J Build Struct. 2008;29(1):16–23 (In Chinese). doi:10.14006/j.jzjgxb.2008.01.004. [Google Scholar] [CrossRef]
2. Contento A, Aloisio A, Xue J, Quaranta G, Briseghella B, Gardoni P. Probabilistic axial capacity model for concrete-filled steel tubes accounting for load eccentricity and debonding. Eng Struct. 2022;268(4):114730. doi:10.1016/j.engstruct.2022.114730. [Google Scholar] [CrossRef]
3. Yu CQ, Tong GS, Tong JZ, Zhang JW, Li XG, Xu SL. Experimental and numerical study on seismic performance of L-shaped multi-cellular CFST frames. J Constr Steel Res. 2024;213(2):108360. doi:10.1016/j.jcsr.2023.108360. [Google Scholar] [CrossRef]
4. He F, Li C, Chen B, Briseghella B, Xue J. Axial compression behavior of steel tube reinforced concrete column. Eng Struct. 2024;303(1):117548. doi:10.1016/j.engstruct.2024.117548. [Google Scholar] [CrossRef]
5. Zhang L, Zhang YJ, Tong JZ, Tong GS, Fu B, Xu YM. Experimental study on multi-cellular L-shaped CFST slender columns under biaxial eccentric compression. Structures. 2022;45(8):2210–25. doi:10.1016/j.istruc.2022.10.009. [Google Scholar] [CrossRef]
6. Zhang L, Yang SL, Tong GS, Tong JZ. Numerical analysis on concrete-filled wide rectangular steel tubular (CFWRST) stub columns under axial compression. Structures. 2021;34(8):4715–30. doi:10.1016/j.istruc.2021.10.074. [Google Scholar] [CrossRef]
7. Yang M, Yu D, Qiu Q, Yu Y. Finite element analysis and bearing capacity calculation of cross-shaped CFST columns under compressive load. Heliyon. 2024;10(7):e28715. doi:10.1016/j.heliyon.2024.e28715. [Google Scholar] [PubMed] [CrossRef]
8. Wu S, Liu W, Zhang J, He W, Guo Y. Experimental and analytical investigation of square-shaped concrete-filled steel tube columns. J Constr Steel Res. 2023;201(1):107737. doi:10.1016/j.jcsr.2022.107737. [Google Scholar] [CrossRef]
9. Ji C, Du XK, Zhang D. Research on flexural rigidity of recycled concrete-filled square steel tube column at elastic stage. J Hebei Agri Univ. 2016;39(5):105–8 (In Chinese). doi:10.13320/j.cnki.jauh.2016.0116. [Google Scholar] [CrossRef]
10. Al Zand AW, Badaruzzaman WHW, Tawfeeq WM. New empirical methods for predicting flexural capacity and stiffness of CFST beam. J Constr Steel Res. 2020;164(1):105778. doi:10.1016/j.jcsr.2019.105778. [Google Scholar] [CrossRef]
11. Li LM, Jiang XL, Chen ZH, Li N. Numerical analysis of CFRT under bending load and Its simplified calculating method. J Tianjin Univ (Science and Technology). 2007;40(8):990–4 (In Chinese). doi:10.3969/j.issn.0493-2137.2007.08.019. [Google Scholar] [CrossRef]
12. Wang K, Zhu Z, Omar AA, Yang Y, Zhang L. Experimental study on the flexural performance of concrete-encased square steel tube truss beams. J Build Eng. 2022;49(13):104053. doi:10.1016/j.jobe.2022.104053. [Google Scholar] [CrossRef]
13. Yang Z, Li G, Lang Y, Fang C. Flexural behavior of high strength concrete filled square steel tube with inner CFRP circular tube. KSCE J Civil Eng. 2017;21(7):2728–37. doi:10.1007/s12205-017-0579-9. [Google Scholar] [CrossRef]
14. Bogahawaththa PBMR, Madhuranga KP, Baskaran K, Hidallana-Gamage HD. Study on concrete filled steel circular and square tubes. In: 2020 Moratuwa Engineering Research Conference (MERCon); 2020; Moratuwa, Sri Lanka: IEEE. p. 42–7. doi:10.1109/MERCon50084.2020.9185319 [Google Scholar] [CrossRef]
15. Hu HS, Nie JG, Wang YH. Effective stiffness of rectangular concrete filled steel tubular members. J Constr Steel Res. 2016;116(6):233–46. doi:10.1016/j.jcsr.2015.09.016. [Google Scholar] [CrossRef]
16. Hu B, Wang J. Experimental investigation and analysis on flexural behavior of CFSTTC beams. Thin-Walled Struct. 2017;116(4):277–90. doi:10.1016/j.tws.2017.03.024. [Google Scholar] [CrossRef]
17. Hu B, Che R, Wang J, He X, Li L, Kundu T. Analytical investigation into the flexural behavior of steel tubular truss-and-concrete (STTC) composite beams. Structures. 2023;50(4):670–88. doi:10.1016/j.istruc.2022.11.106. [Google Scholar] [CrossRef]
18. He M. Study of calculation methods on flexural stiffness of concrete-filled rectangular steel tubes. J Build Struct. 2006;27:472–74+479(In Chinese). [Google Scholar]
19. Yang YF, Zhang YQ, Fu F. Flexural behaviour of rectangular double-opening concrete filled sandwich steel tube (DCFSST) beams. J Constr Steel Res. 2024;215(2):108512. doi:10.1016/j.jcsr.2024.108512. [Google Scholar] [CrossRef]
20. Al Zand AW, Ali MM, Al-Ameri R, Badaruzzaman WHW, Tawfeeq WM, Hosseinpour E, et al. Flexural strength of internally stiffened tubular steel beam filled with recycled concrete materials. Materials. 2021;14(21):6334. doi:10.3390/ma14216334. [Google Scholar] [PubMed] [CrossRef]
21. Lu H. Comparison on ultimate flexural bearing capacity and flexural stiffness of concrete filled steel tubes calculated by different design codes. Fujian Architect & Construct. 2005;2:127–30 (In Chinese). [Google Scholar]
22. GB 50936-2014. Technical Code for Concrete Filled Steel Tubular Structures. Beijing, China: China Building Industry Press; 2014 (In Chinese). [Google Scholar]
23. Du YS. Theoretical analysis and experimental study on rectangular concrete-filled steel tube columns using high-strength steel (Ph.D. Thesis). Tianjin University: Tianjin, China; 2017 (In Chinese). doi:10.7666/d.D01421830. [Google Scholar] [CrossRef]
24. Liu X, Wu YB. Experiment and simulation analysis of bearing capacity of concrete-filled rectangular steel tube beam. Industrial Construction. 2010;40(7):91–4+104 (In Chinese). doi:10.13204/j.gyjz2010.07.023. [Google Scholar] [CrossRef]
25. Deng JX, Li X, Li XJ, Wei TB. Analysis of the performance of recycled insulation concrete and optimal mix ratio design based on orthogonal testing. Materials. 2023;16(16):5688. doi:10.3390/ma16165688. [Google Scholar] [PubMed] [CrossRef]
26. Wei P, Yin G, Shi M, Zhang W, Feng J. Performance investigation and parameter optimization of ultra-light aerated concrete using orthogonal experimental design. Case Stud Constr Mater. 2023;18(1):e01841. doi:10.1016/j.cscm.2023.e01841. [Google Scholar] [CrossRef]
27. Wang L, Xiang Y, Tao H, Kuang J. An analytical model coupled with orthogonal experimental design is used to analyze the main controlling factors of multi-layer commingled gas reservoirs. Water. 2023;15(17):3052. doi:10.3390/w15173052. [Google Scholar] [CrossRef]
Cite This Article
 Copyright © 2025 The Author(s). Published by Tech Science Press.
This work is licensed under a Creative Commons Attribution 4.0 International License , which permits unrestricted use, distribution, and reproduction in any medium, provided the original work is properly cited.


 Submit a Paper
 Propose a Special lssue
 View Full Text
 Download PDF
 Downloads
 Citation Tools