 Open Access
ARTICLE
Moment Redistribution Effect of the Continuous Glass Fiber Reinforced Polymer-Concrete Composite Slabs Based on Static Loading Experiment
1 Offshore Oil Engineering Co. Ltd., Tianjin, 300461, China
2 Department of Bridge Engineering, School of Transportation, Southeast University, Nanjing, 211189, China
* Corresponding Author: Wen-Wei Wang. Email:
(This article belongs to the Special Issue: Advanced Data Mining in Bridge Structural Health Monitoring)
Structural Durability & Health Monitoring 2025, 19(1), 105-123. https://doi.org/10.32604/sdhm.2024.052506
Received 03 April 2024; Accepted 14 June 2024; Issue published 15 November 2024
Abstract
This study aimed to investigate the moment redistribution in continuous glass fiber reinforced polymer (GFRP)-concrete composite slabs caused by concrete cracking and steel bar yielding in the negative bending moment zone. An experimental bending moment redistribution test was conducted on continuous GFRP-concrete composite slabs, and a calculation method based on the conjugate beam method was proposed. The composite slabs were formed by combining GFRP profiles with a concrete layer and supported on steel beams to create two-span continuous composite slab specimens. Two methods, epoxy resin bonding, and stud connection, were used to connect the composite slabs with the steel beams. The experimental findings showed that the specimen connected with epoxy resin exhibited two moments redistribution phenomena during the loading process: concrete cracking and steel bar yielding at the internal support. In contrast, the composite slab connected with steel beams by studs exhibited only one-moment redistribution phenomenon throughout the loading process. As the concrete at the internal support cracked, the bending moment decreased in the internal support section and increased in the mid-span section. When the steel bars yielded, the bending moment further decreased in the internal support section and increased in the mid-span section. Since GFRP profiles do not experience cracking, there was no significant decrease in the bending moment of the mid-span section. All test specimens experienced compressive failure of concrete at the mid-span section. Calculation results showed good agreement between the calculated and experimental values of bending moments in the mid-span section and internal support section. The proposed model can effectively predict the moment redistribution behavior of continuous GFRP-concrete composite slabs.Keywords
List of Abbreviations
| GFRP | Glass fiber reinforced polymer |
| FRP | Fiber reinforced polymer |
| RC | Reinforced concrete |
Fiber Reinforced Polymer (FRP)-concrete composite slabs have emerged as a new type of structural element in civil engineering. These composite slabs consist of FRP profiles, which are typically manufactured from processed fiber bundles using resin, positioned in the tension zone, while the concrete layer is placed in the upper compression zone [1–5]. This combination creates a composite structural element that effectively reduces the self-weight of the structure and offers excellent mechanical performance and cost-effectiveness [2]. Additionally, the FRP profiles can also serve as formwork during concrete pouring and contribute to load-carrying capacities during subsequent operational stages. In bridge engineering applications, this composite slab can be utilized as the bridge panel, bonded or mechanically connected to the steel main beams with specific spacing, forming the superstructure as shown in Fig. 1. Under the influence of vehicle loads, the steel main beams act as support components, resulting in the formation of either simply supported or continuous slabs in terms of force distribution. In the case of continuous composite slabs, the bending moment values at the internal support decrease due to concrete cracking and steel reinforcement yielding, while the bending moment values at the mid-span section increase. This redistribution of internal forces, such as bending moment, occurs. However, in continuous FRP-concrete composite slabs, unlike traditional reinforced concrete (RC) continuous slabs, the concrete layer in the mid-span section remains in the compression zone, and the lower FRP profile does not experience cracking. This structural characteristic sets it apart from traditional RC continuous slabs.

Figure 1: Application of the FRP-concrete composite slab
In earlier studies, Triantafillou et al. [6] developed a novel composite beam design that combined a glass fiber reinforced polymer (GFRP) box profile with a concrete layer cast on the top flange. They also introduced a thin carbon fiber reinforced polymer (CFRP) laminate bonded to the tension zone as an indicator of impending failure. Saiidi et al. [7] proposed a composite beam consisting of a concrete slab and a pultruded CFRP I-shaped profile. The flexural and shear behaviors of six concrete graphite/epoxy composite beams were experimentally investigated using a four-point bending test. Subsequently, Koaik et al. [8] and Neagoe et al. [9] conducted similar tests on analogous composite beams. Fam et al. [10] introduced a built-up trapezoidal box girder composed of a trapezoidal pultruded GFRP sheet pile, a flat GFRP plate, and concrete cast on the flat section. Kim et al. [11] performed numerical simulations on single-beam and girder-group systems with the same cross-section shape, demonstrating the effective cross-section properties under torsional effects. Hai et al. [12] conducted early research on the mechanical performance of composite beams consisting of FRP I-beams and ultra-high-performance, fiber-reinforced concrete (UHPFRC) slabs. The experimental setup involved using anchor bolts with or without epoxy bonding in the tested beams. The test results revealed significant enhancements in stiffness and strength properties for all composite beams compared to single FRP I-beams without a UHPFRC slab.
In recent years, Zou et al. [13] have proposed and investigated a novel assembly of FRP-concrete hybrid beams/decks system. Their study focuses on evaluating the performance of the FRP shear key (SK) connector, FRP stay-in-place (SIP) form, and their combination in the context of FRP-concrete hybrid beams/decks. Push shear tests were conducted to assess the effectiveness of these components. The beam test results demonstrated that this connection system provided full composite action until the failure of the FRP girder. However, there has been limited research on FRP-concrete continuous composite slabs or beams thus far. Zhang et al. [5] conducted experimental studies on continuous FRP-UHPC hybrid beams to improve the mechanical performance and durability of continuous beams under hogging moment. However, their research did not specifically address the issue of internal force redistribution within the composite structure.
In the case of reinforced concrete (RC) continuous slabs, the analysis of internal forces typically involves numerical analysis methods or elastic-plastic analysis methods. These approaches allow for the determination of the moment redistribution coefficient and the establishment of limit values for moment amplitudes [14–16]. However, there has been limited research conducted by scholars on the flexural performance of FRP-concrete composite slabs [17,18]. Consequently, there is a gap in the availability of mechanical analysis methods that can be applied throughout the entire loading process of FRP-concrete composite slabs.
Zhang et al. [19] observed the occurrence of internal force redistribution in two-span steel-concrete composite beams subjected to symmetric mid-span loading. They proposed a method to calculate the bending moment amplitude coefficient in response to this phenomenon. Similarly, Han et al. [20] utilized the concept of internal force redistribution to calculate the creep actions in continuous composite beams affected by support settlement. They also introduced a method for analyzing the internal forces in such continuous composite beams. The presence of concrete cracking, support settlement, and displacement, among other factors, renders the use of elastic theory inadequate for accurately analyzing the internal forces within composite slabs. Therefore, it becomes necessary to develop a method that considers the internal force redistribution when analyzing the internal forces in composite slabs.
This paper focuses on an experimental investigation into the flexural behavior of two-span continuous GFRP-concrete composite slabs. Through the experimental study, the researchers obtained insights into the typical failure characteristics exhibited by composite slabs and gained an understanding of the bending moment redistribution process in continuous composite slabs through data analysis. Based on the findings from the experimental research, the paper presents an analysis method that can be used to calculate the redistribution of bending moments.
The experiment included two specimens named GC-1 and GC-2, representing two-span continuous GFRP-concrete composite slabs. Both specimens had identical section forms, geometric dimensions, and reinforcement details. Each span of the composite slab measured 1800 mm in length, with a net span of 1725 mm. The total length of the two-span continuous slab was 3600 mm, and the width of the composite slab was 500 mm, as depicted in Fig. 2a. To establish the necessary support conditions, three steel beams were positioned beneath each span of the composite slab, consisting of two side steel beams and one internal steel beam. The connection between the steel beams and the composite slab differed between the specimens: GC-1 was bonded using epoxy resin, while GC-2 utilized a series of studs for connection.
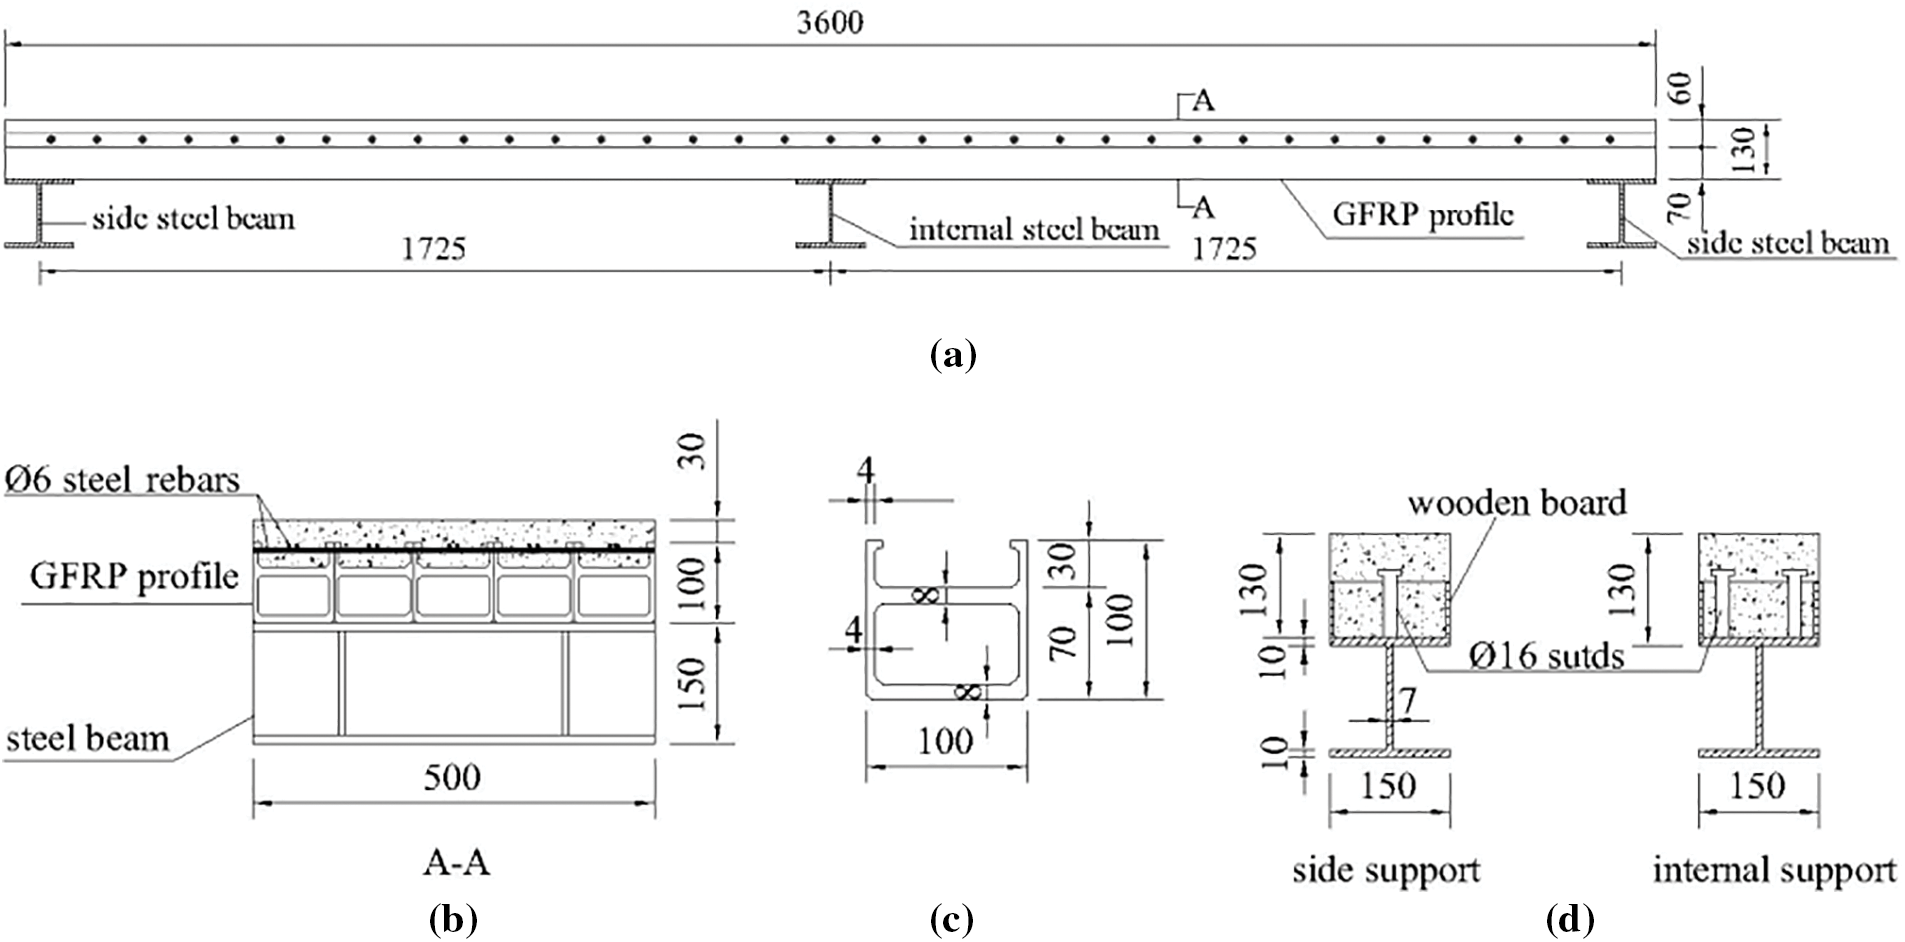
Figure 2: Design of the two-span continuous composite slab (unit in mm). (a) Construction of specimens. (b) Section A-A. (c) GFRP profile. (d) Stud connection
As depicted in Fig. 2b, the composite slabs consist of a concrete layer on the top and GFRP profiles on the bottom. The GFRP profiles have empty box sections with T-shaped ribs measuring 30 mm in height on the upper part. Along the length of the steel beams, the adjacent GFRP profiles are bonded together using epoxy resin, creating a template for pouring concrete. Each GFRP profile has a width of 100 mm and a height, including the T-ribs, of 100 mm, as shown in Fig. 2c. Within the 500 mm width range, it is possible to place five GFRP profiles side by side. The empty box sections of the GFRP profiles are designed to reduce the weight of the composite slabs, while the T-ribs serve as shear connectors to enhance the interaction between the GFRP profiles and the concrete layer. The wall thickness and upper T-rib thickness of the box sections are both 4 mm, while the top and bottom flanges of the GFRP profiles have a thickness of 8 mm (Fig. 2c). The steel beam utilized in the experiment has an I-section with a height of 150 mm, a width of 150 mm, and a length of 500 mm, which is equal to the width of the composite slab. The upper and lower flanges of the steel beam are 10 mm thick, while the web thickness is 7 mm (Fig. 2d). Wooden boards are installed on both sides of the GFRP profile box near the studs to act as baffles. During the concrete pouring process, the studs can be embedded within the surrounding concrete (Fig. 2d).
In the case of specimen GC-1, the composite slab is directly connected to the steel beams of the internal and side supports using a resin layer, as shown in Fig. 3a. To ensure an even distribution of the epoxy resin bonding layer between the steel beam and the composite slab, horizontal square steel bars with dimensions of 6 mm × 6 mm and a spacing of 100 mm were placed on the top surface of the steel beam, creating a series of compartments, as depicted in Fig. 3b. Each compartment allows for the epoxy resin to be applied and leveled easily. Subsequently, the pre-polished GFRP profiles on the bottom surface were positioned in contact with the steel beams and bonded together. The epoxy resin was allowed to cure for 7 days.

Figure 3: Details construction of the composite slab (unit in mm). (a) Resin bonding. (b) Compartments for forming the resin layer. (c) Mechanical connections
For the GC-2 specimen, holes were created in the bottom plate of the GFRP profiles to connect them to the steel beams of the internal and side supports. These holes aligned with the supports, allowing 16 mm diameter studs on the upper part of the steel beams to secure the GFRP profiles (Fig. 3c). Additionally, 6.5 mm diameter holes were opened in the T-ribs of the GFRP profiles to accommodate transverse steel bars. These bars formed composite shear connectors with the concrete, enhancing the connection (Fig. 3c).
HRB335 ribbed steel bars with a 6 mm diameter were used as longitudinal reinforcement in the concrete layer, spaced at 100 mm intervals. In the negative bending moment zone, two side-by-side longitudinal bars were placed along the specimen’s length for additional tensile reinforcement. Transverse bars passed through holes in the T-ribs of the GFRP profiles, forming composite shear connectors at the GFRP-concrete interface (see Fig. 4). Once the GFRP profiles were securely connected to the lower steel beams at the supports, the concrete layer was poured onto the top flange of the GFRP profile. The specimens were then subjected to a curing period of 28 days, as shown in Fig. 5, following the specifications outlined in Reference [21].
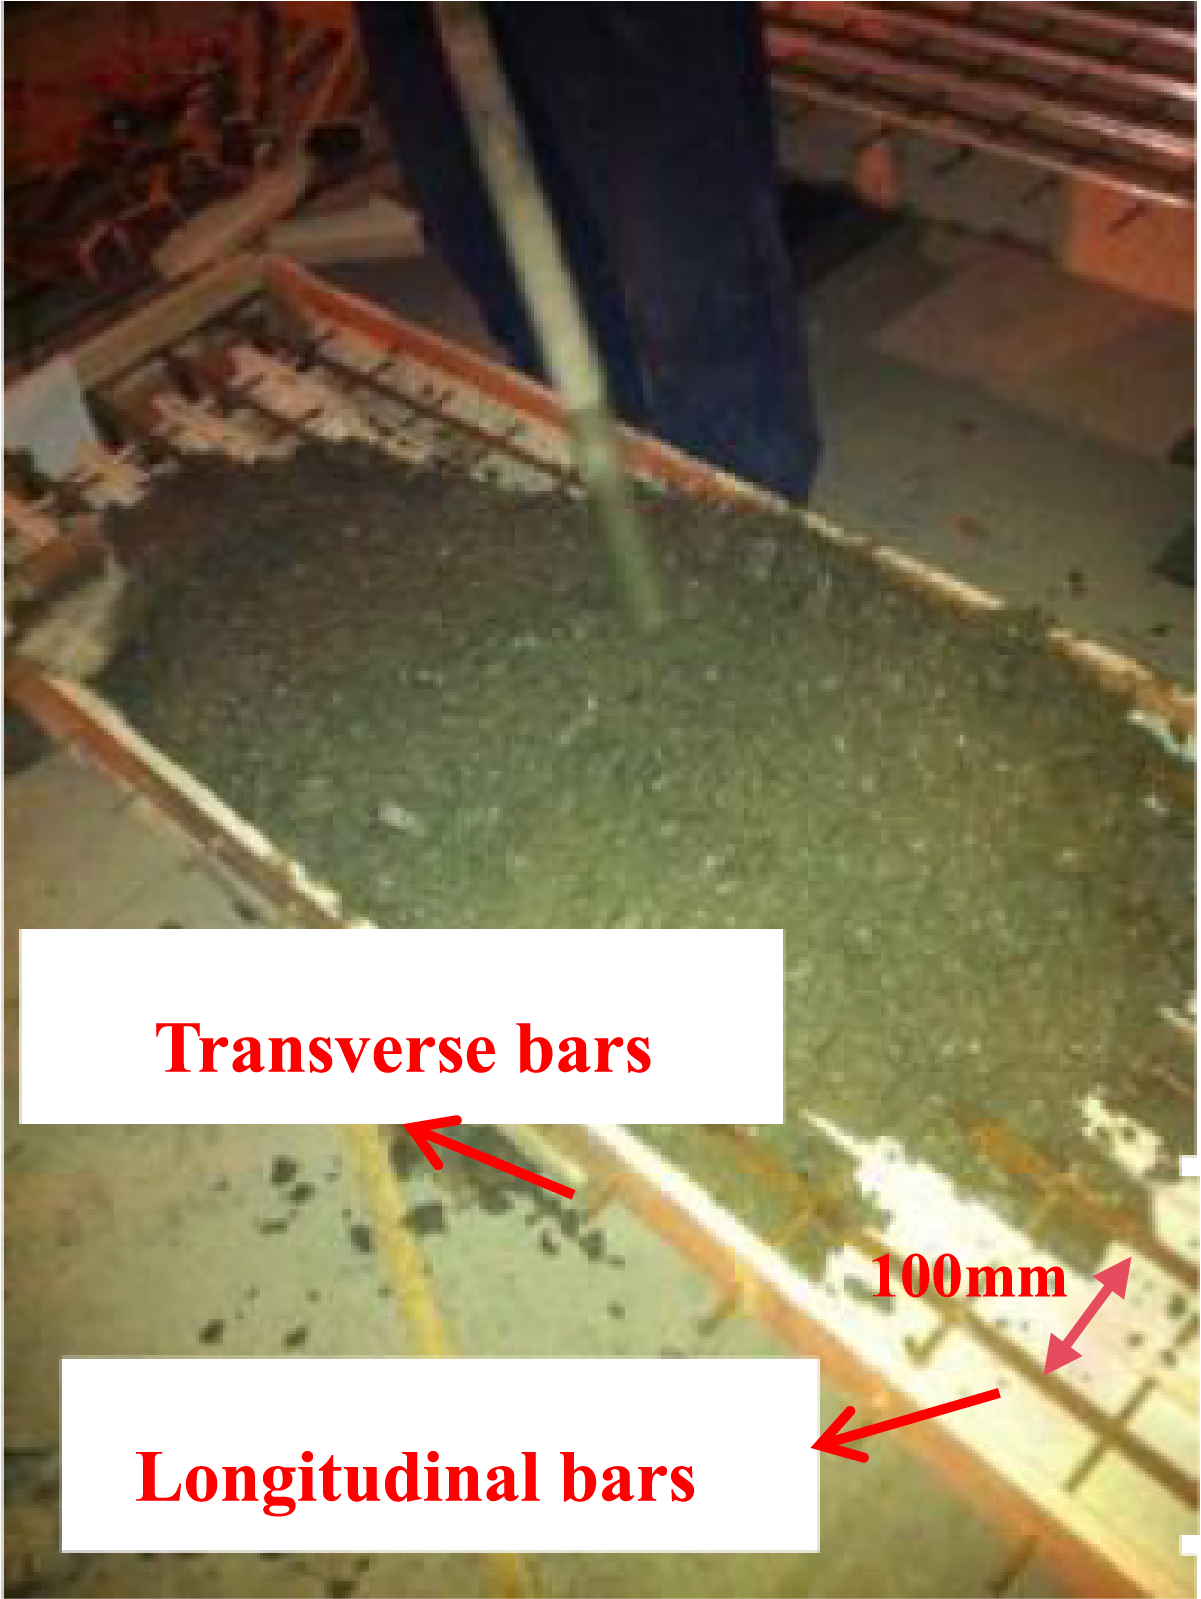
Figure 4: Longitudinal and Transverse bars
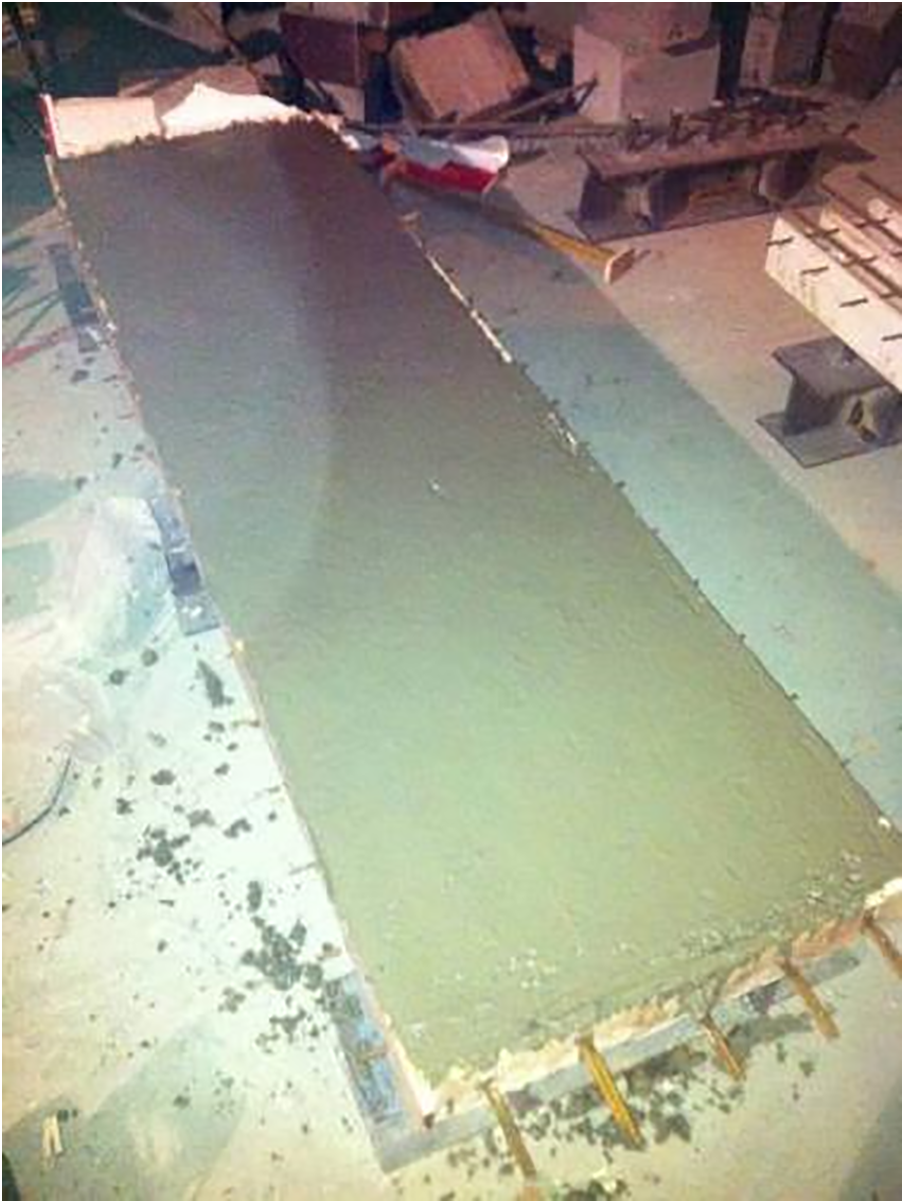
Figure 5: Test specimen manufacture
2.2 Loading Device and Measuring Point Arrangement
The two-span continuous composite slabs were subjected to two-point symmetric loads using distributed beams at the loading points. The load was applied at the mid-span section of the test specimens, with a distance of 1725 mm from the center line of the loading beams (as shown in Fig. 6). Before the formal loading, a preliminary load of 20 kN was applied to the specimen for 15 min. This was done to ensure the proper functioning of all instruments and to eliminate any gaps between the supports and connections. After the pre-loading phase, the test specimens were incrementally loaded at a rate of 10 kN/min until the bearing capacity dropped to 85% of the ultimate bearing capacity [22]. During the test, the deflections and strain values of the designated measurement points were recorded as the applied loads reached predetermined values and remained constant. Concurrently, the development of concrete cracks was observed.
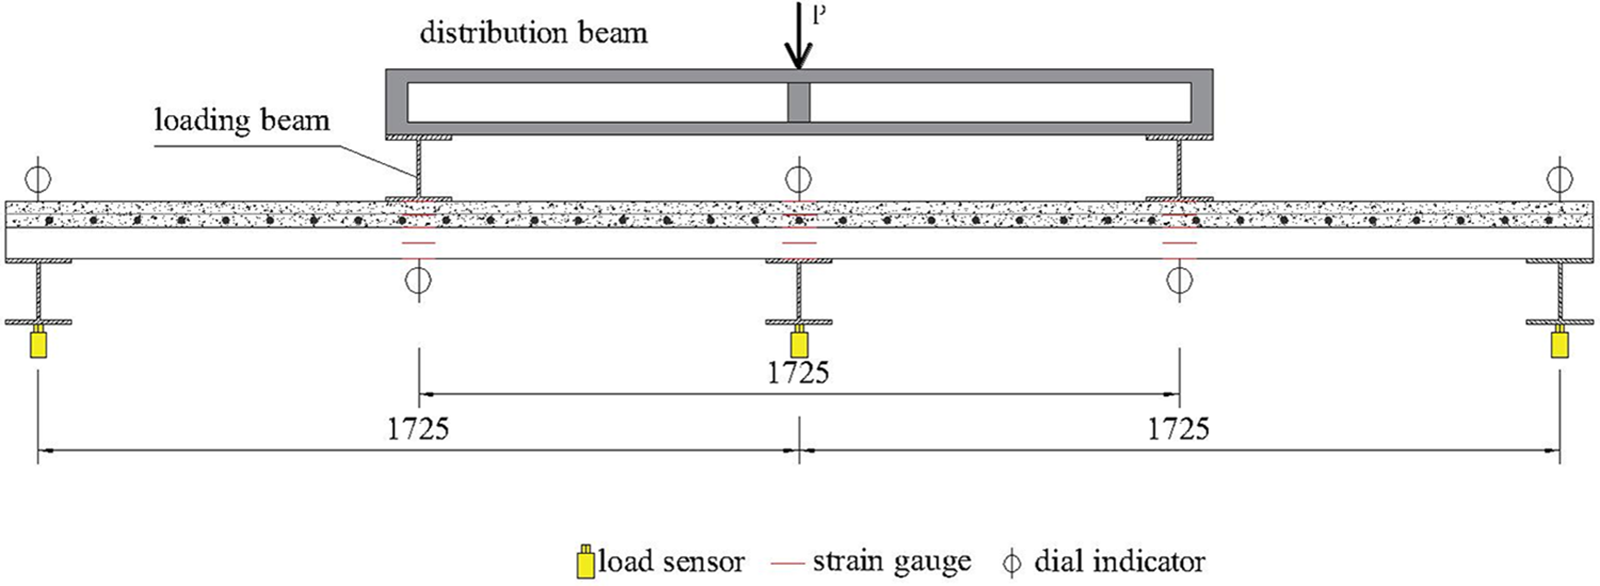
Figure 6: Test setups and loading method (unit in mm)
Fig. 6 shows the arrangement of measurements for the specimens. Five dial indicators were placed at the mid-span, side support, and internal support sections to measure displacements. Three loading sensors were positioned below each steel beam to observe support reaction distribution. Additionally, five strain gauges were installed along the composite slab thickness direction at the mid-span and internal support positions to monitor strain distributions.
The final failure mode of specimens GC-1 and GC-2 is depicted in Fig. 7. Both specimens experienced compression failure in the concrete layer above the mid-span section of the respective spans.
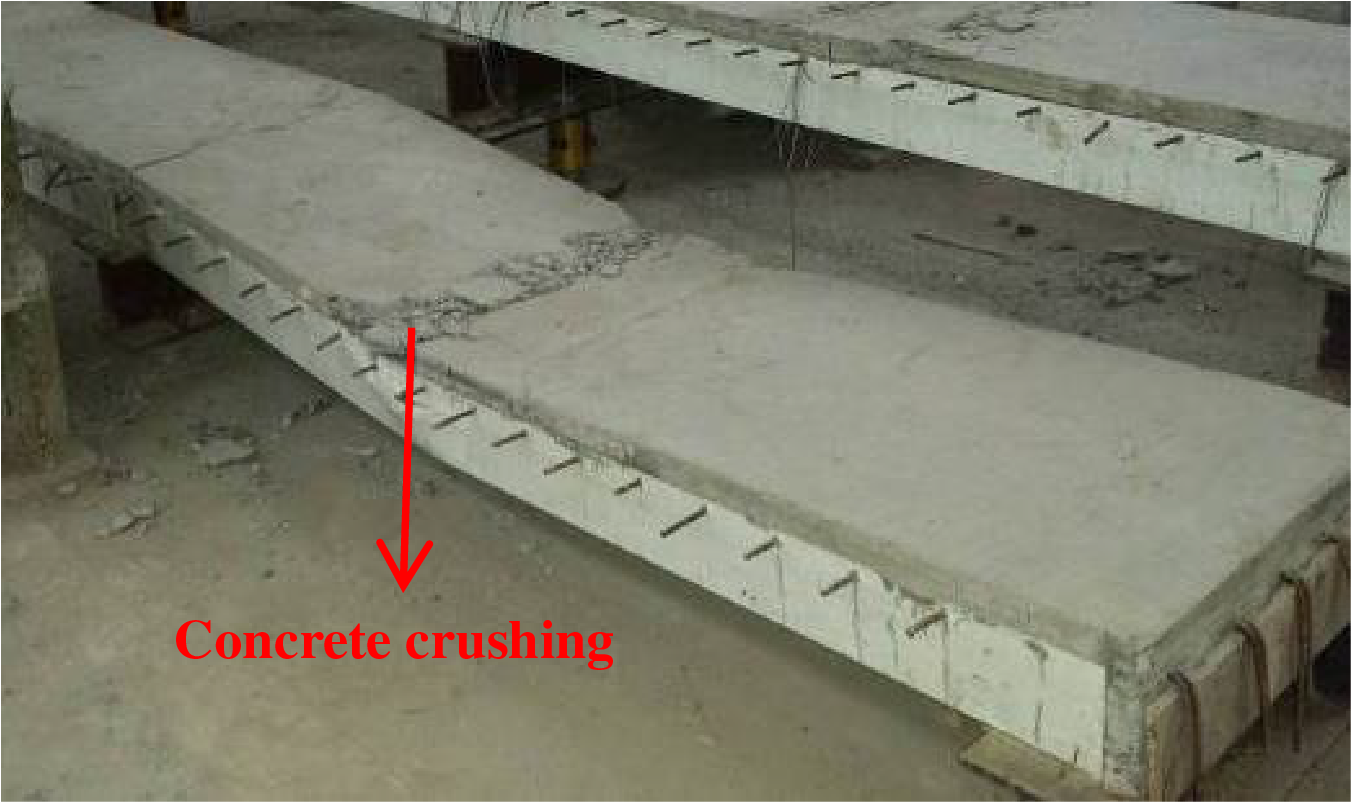
Figure 7: Final failure mode of the specimen GC-1
At a load of 40 kN, specimen GC-1 exhibited concrete cracking in the negative moment region at the internal support. These cracks were a result of tensile stress effects, as depicted in Fig. 8. As the load increased to 110 kN, a slight splitting sound emerged at the connection between the composite plate and steel beam. Over time, this sound intensified. Notably, resin layer debonding was observed at the side support, leading to the separation of the composite slab from the lower steel support (Fig. 9a). The steel bars within the concrete layer yielded when the load reached 130 kN. Upon reaching 190 kN, a new transverse crack, approximately 0.5 mm wide, formed above the internal support. As the load reached 300 kN, the GFRP profile box’s side web under the loading point bulged outward, accompanied by vertical and transverse cracks on the concrete surface nearby. At 310 kN, the concrete cracks expanded and widened, resulting in the collapse of the concrete layer at the loading point. Subsequently, longitudinal tearing cracks appeared in the web of the GFRP profile box (Fig. 9b).
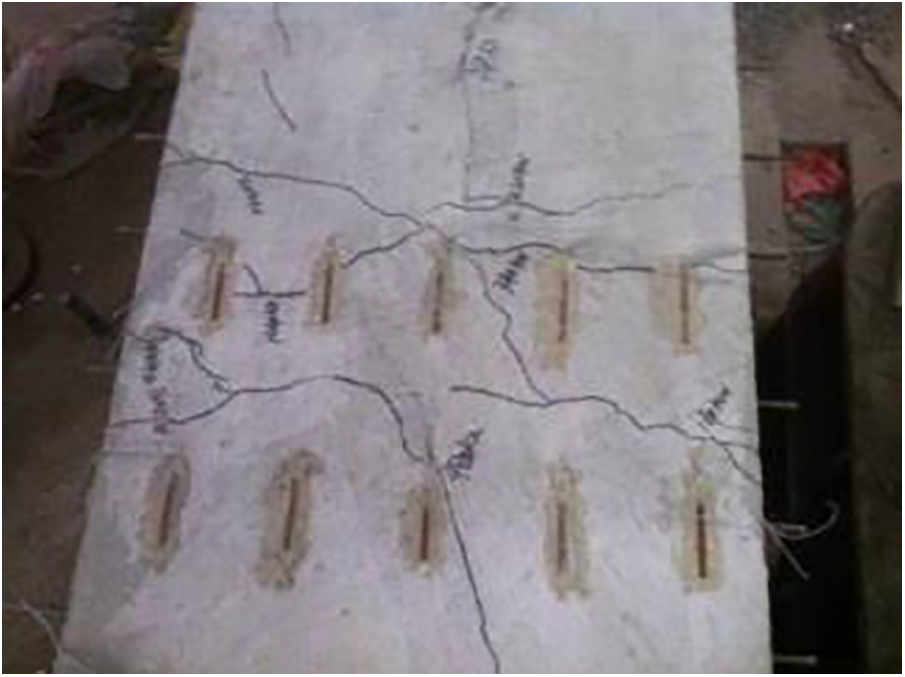
Figure 8: Transverse cracks in the negative moment
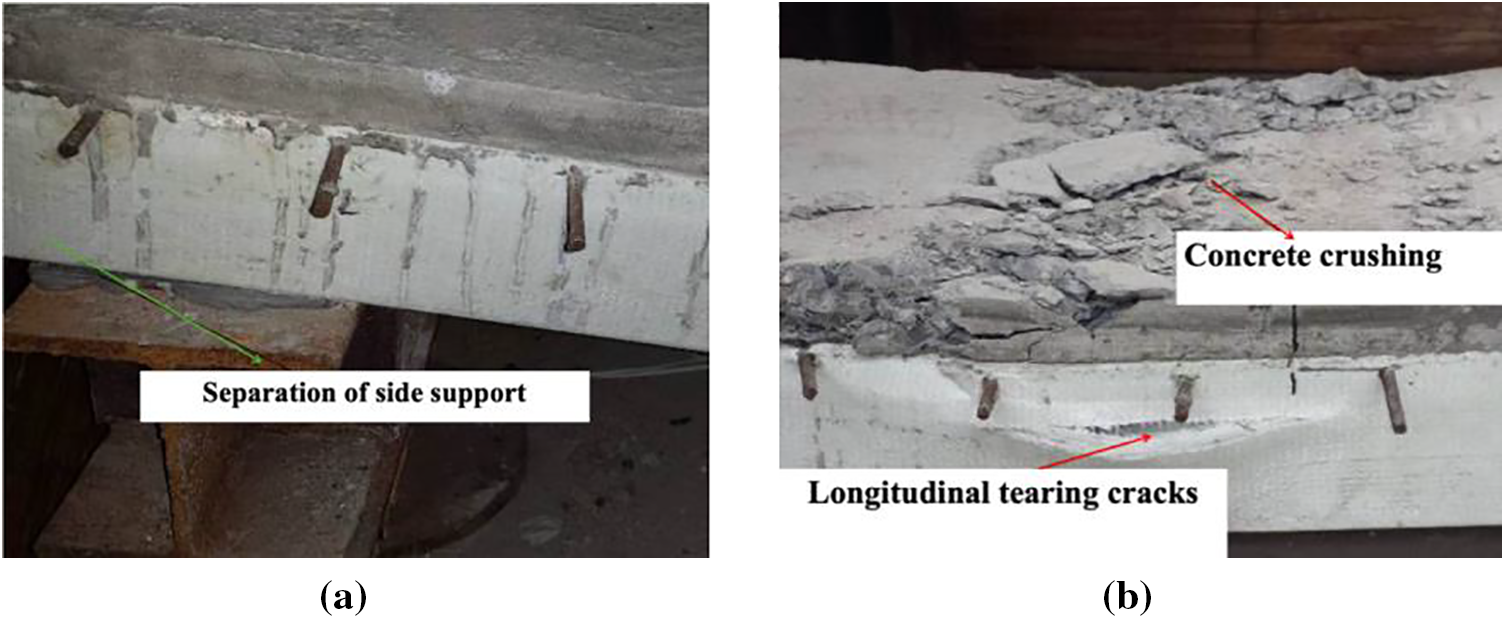
Figure 9: Local failure of specimen GC-1. (a) Resin layer debonding at the side support. (b) Longitudinal tearing of GFRP profile web
Specimen GC-2 underwent a loading process similar to that of specimen GC-1, and the details will not be repeated here. It is important to highlight that the connection between the composite slab of specimen GC-2 and the lower steel beam did not exhibit any peeling damage at the side support connection. This indicates that the utilization of stud connections effectively restricted the displacement of the support end. Table 1 presents the test results for both specimens, including the applied loads, moments, and reaction forces at the side and internal supports during the cracking, yielding, and ultimate states. The test values of the bending moment of the internal support and the bending moment of the mid-span section in Table 1 can be calculated as (shown in Fig. 10):
where,

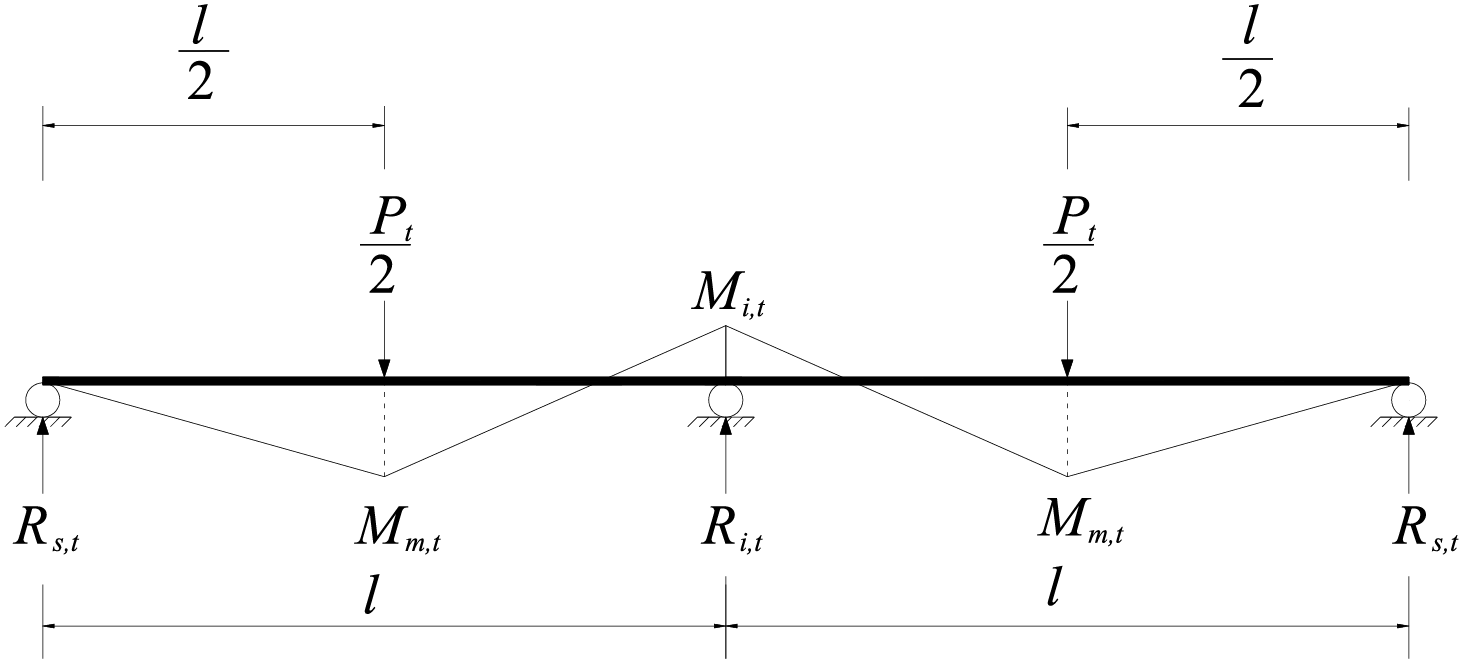
Figure 10: Calculation of test values of bending moments for internal support and mid-span section
It should be noted that the load, bending moment and reaction force values in Eqs. (1a) and (1b) represent the test values of each different stage in the specimens. For example, when calculating the cracking moment value of the internal support, we can make
Fig. 11 illustrates the load-deflection behavior of the mid-span section for specimens GC-1 and GC-2. The curves exhibit a bi-linear pattern, with similar responses before reaching yield loads of 100 and 120 kN, respectively. However, as the load continues to increase, specimen GC-1 demonstrates a significantly faster deflection growth rate compared to specimen GC-2. At failure, the mid-span deflection reaches 17.7 mm for GC-1 and 11.4 mm for GC-2. The disparity in deformation at failure can be attributed to the smaller constraint of the side supports on GC-1.
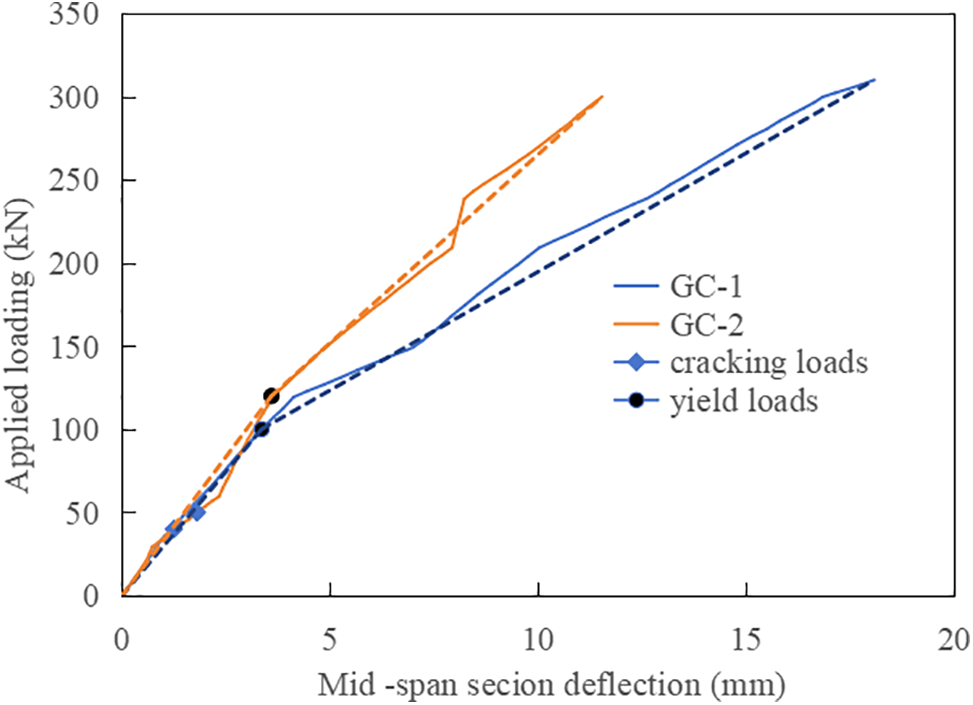
Figure 11: Load-deflection curves of the mid-span section
When the steel bars in the negative moment section of the internal support yield, occur at 100 kN for GC-1 and 120 kN for GC-2, the load-deflection curves exhibit inflection points. Additionally, the debonding of the side supports in GC-1 further weakens the support constraint, leading to a rapid increase in mid-span deflection. Both specimens demonstrate limited ductility during the failure process, primarily due to the mechanical characteristics of the GFRP profiles and concrete materials.
Fig. 12 depicts the variations in measured support reaction for both specimens, along with the support reaction calculated using elastic theory, as the external load increases. The figure also includes the “elastic line,” representing the relationship between the support reaction and external load as per elastic theory. From Fig. 12, it is evident that the measured support reaction of specimen GC-1 closely aligns with the support reaction calculated using elastic theory up to 40 kN (prior to concrete cracking in the internal support section). However, as the load increases, the measured support reaction gradually deviates from the theoretical values, particularly after reaching 100 kN (yielding of steel bars in the internal support section), which signifies the first-moment redistribution. Beyond 100 kN, the bending moment of the internal support section decreases further, while the bending moment of the mid-span section continues to increase, indicating a second-moment redistribution. Throughout the entire testing process, the average measured side support reaction exceeds the theoretical elastic value, while the measured internal support reaction is smaller than the theoretical calculation due to the redistribution of the bending moment.
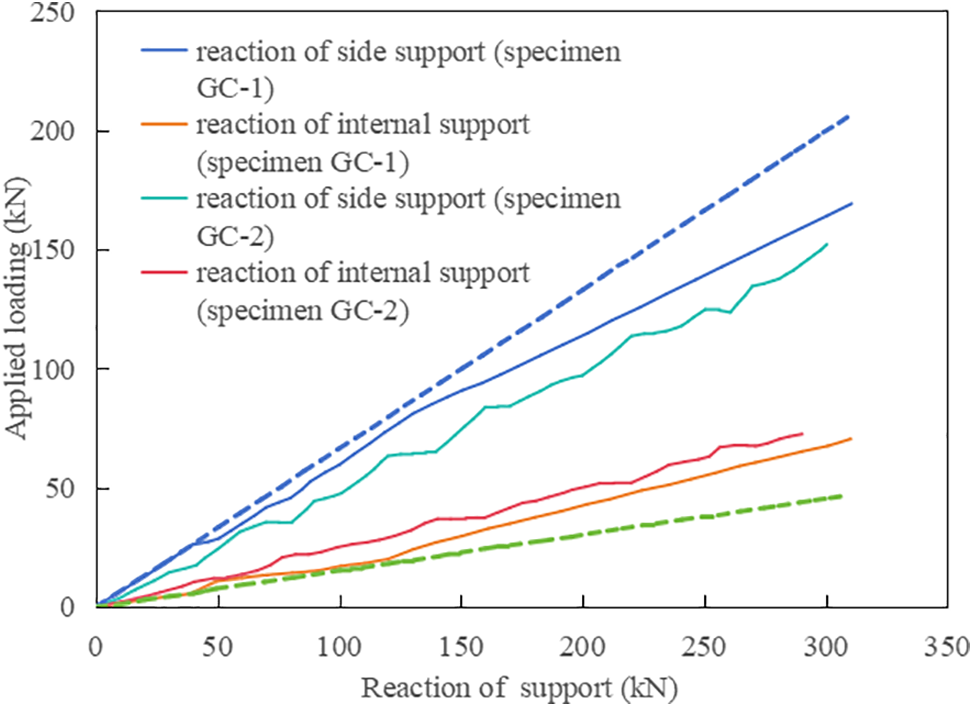
Figure 12: Load-support reaction curves
In the entire loading process, the measured and theoretical values of the average side support reaction and internal support reaction for specimen GC-2 closely match, maintaining a consistent proportional relationship of approximately 0.25 (Fig. 12). This indicates that only one-moment redistribution phenomenon occurred in specimen GC-2, which benefits from its strong boundary constraints. The test results highlight that specimen GC-1 experiences a noticeable redistribution of internal forces between the side supports and the internal support. This redistribution is attributed to factors such as the reduced rotational capacity of the side supports, concrete cracking in the negative moment section, and yielding of the tensile steel bars. In contrast, specimen GC-2, despite also experiencing concrete cracking and steel bar yielding, does not exhibit significant redistribution of support reaction due to the effective fixation provided by the stud connections on the side supports.
Taking specimen GC-1 as an example, the distributions of strains at the mid-span section and the internal section along the composite slab height are shown in Fig. 13a,b, respectively. It can be seen from Fig. 13a that at the initial stage of loading, the strain distribution of the section basically conforms to the linear law. In the whole test process, the strain values of each measuring point increase gradually with the increase of loads, the position of the neutral axis of the section moves down continuously, and the concrete area of the compression zone increases gradually. Generally, the strain distribution along the height is linear, which explains that the strain distribution on the cross-section is consistent with the assumption of a plane cross-section.
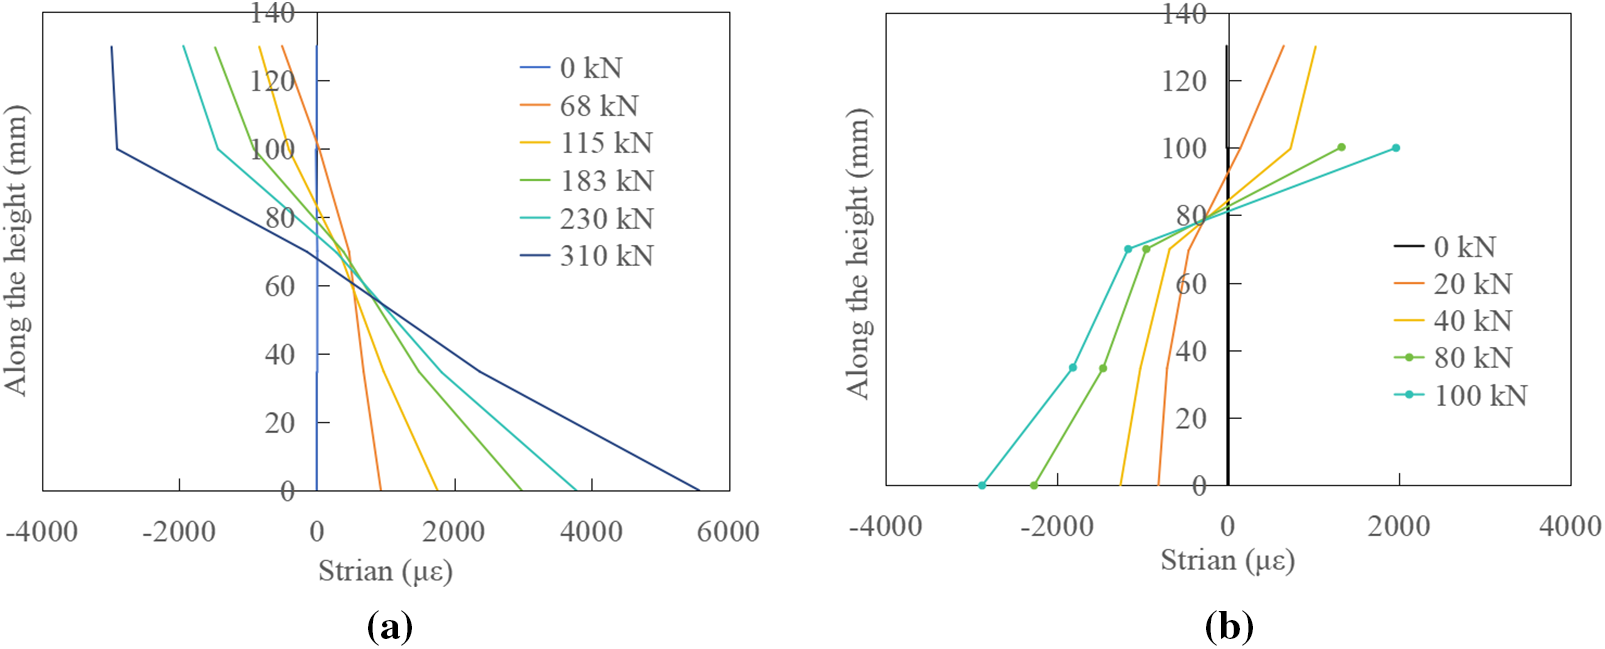
Figure 13: Strain distributions of vertical section. (a) Mid-span section. (b) Internal section
Fig. 13b depicts the strain distribution along the height of the internal support section. The figure demonstrates that the strain distribution within the cross-section largely adheres to the assumption of a plane cross-section. After concrete cracking, the strain in the concrete at the edges of the tensile zone becomes zero. The neutral axis, which corresponds to a region with minimal strain, passes through the T-rib of the GFRP profile. Within this section, most of the GFRP profile experiences compression, while a small portion undergoes tension. The maximum compressive strain in the GFRP profile measures 3043 με, while the maximum tensile strain reaches 5343 με.
4 Analysis of Moment Redistribution of Continuous Composite Slab
4.1 Analytical Model Establishment
As shown in Fig. 14, a two-span continuous composite slab with a left span and right span is subjected to the external loads, and the section bending moments of the composite slab change due to the cracking of the concrete in the negative moment zone and the yielding of the tensile steel bars at the internal support. So, the moment redistribution of the continuous composite slab needs to be considered. In this figure,
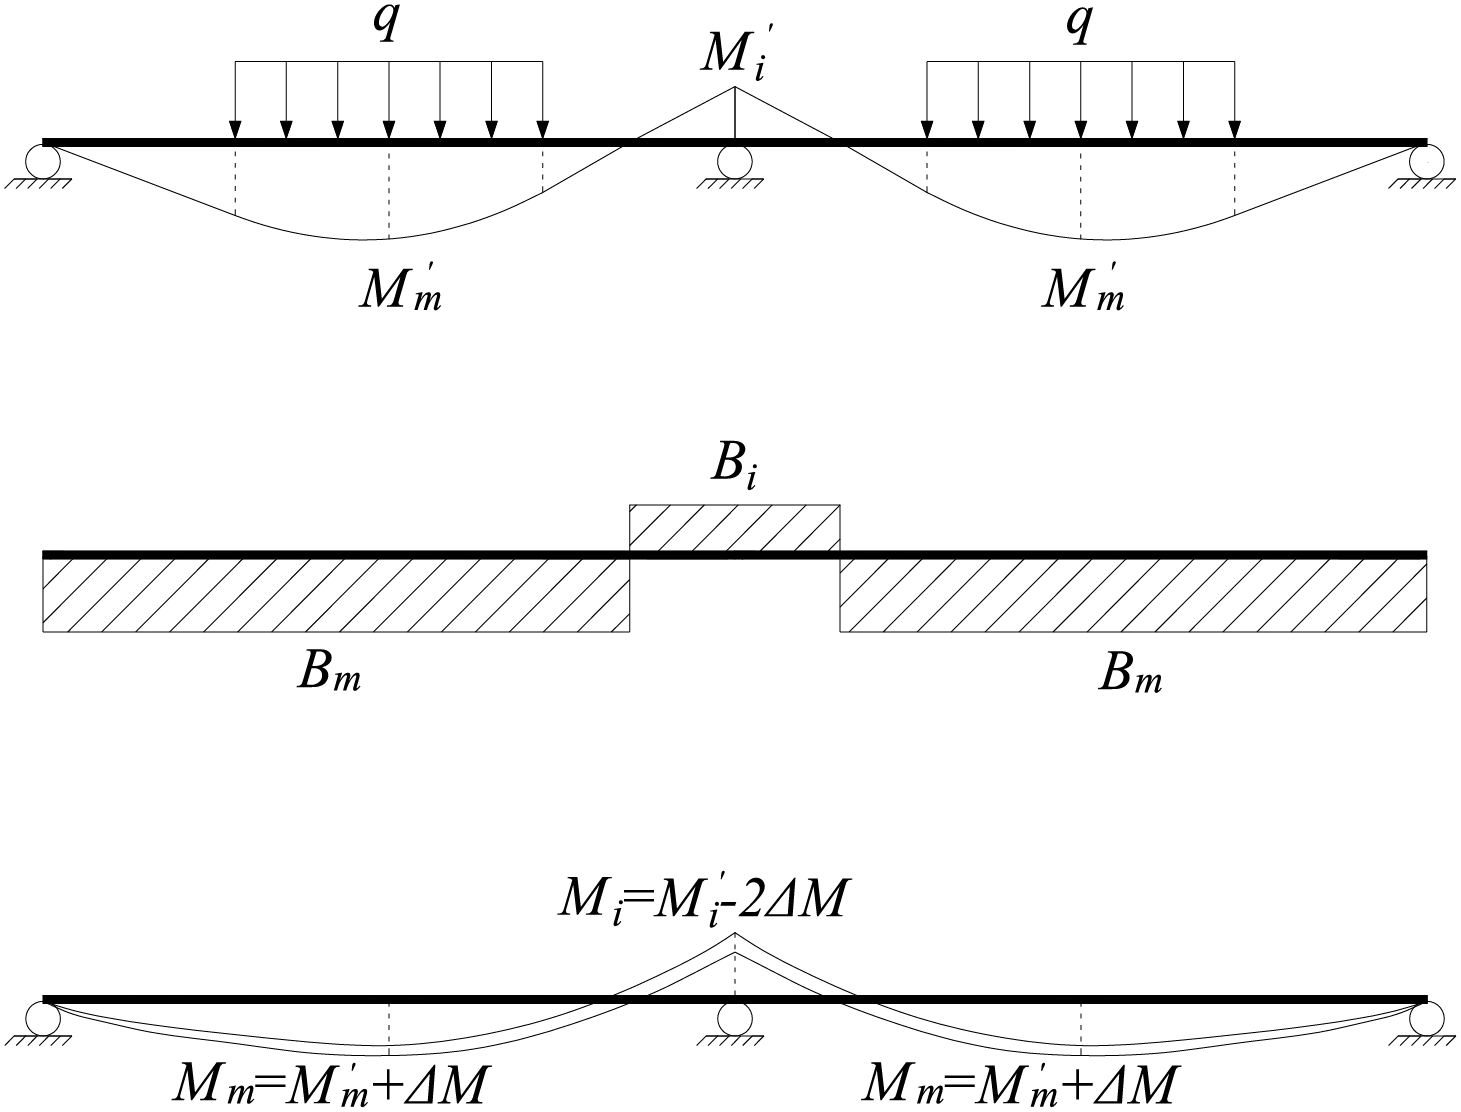
Figure 14: Analysis model of bending moment redistribution
The analysis of the bending moment is based on the conjugate beam method [17], as shown in Fig. 15. For the convenience of application, the composite slab can be considered as a beam type component for analysis. In this method, the corresponding conjugate beam model is constructed according to the different constraints of the supports. Recording the bending moment expression of the actual beam as
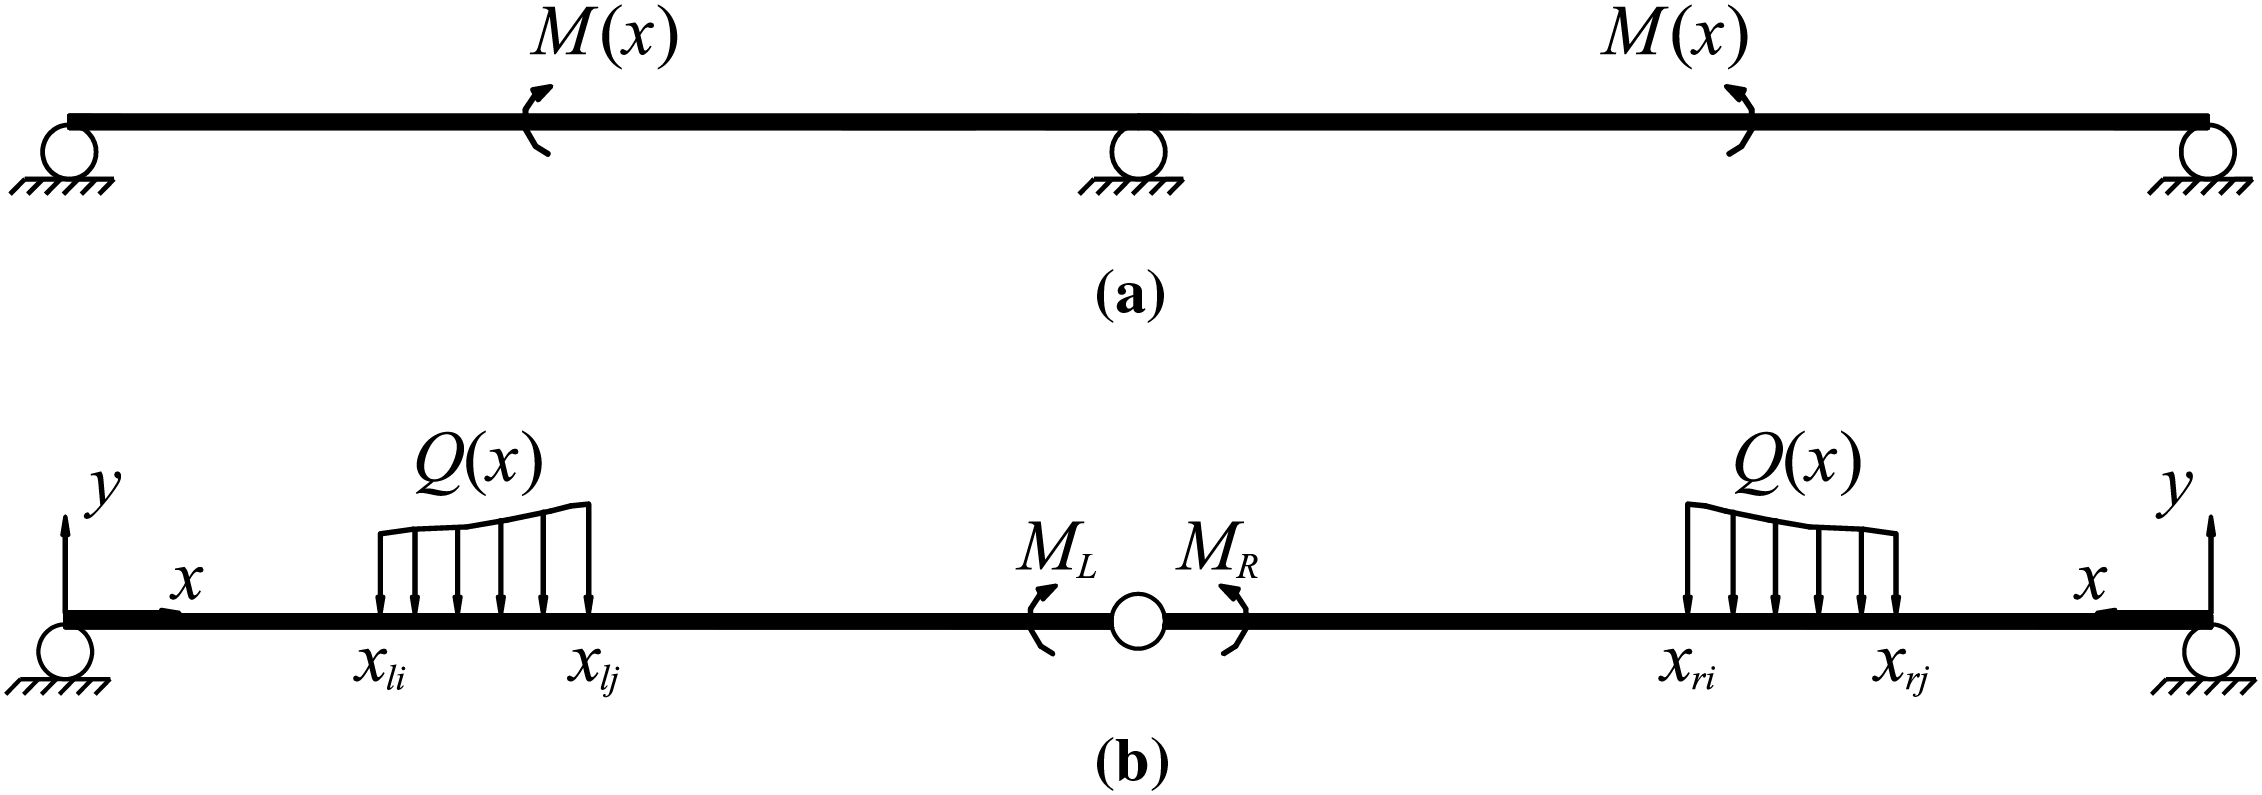
Figure 15: Model diagram of the conjugate beam method. (a) Actual beam. (b) Corresponding conjugate beam
For current test specimens simply supported on the steel beams analyzed in this paper, the side supports of the conjugate beam correspond to the hinge support boundary, and the middle support is regarded as a hinge (Fig. 15b). Assuming the load action situation of the conjugate beam is consistent with the actual beam. That is,
The establishment of the force analysis formula of the conjugate beam is determined based on the rotational balance condition of the middle hinge at the internal support, namely:
where,
The bending moment
where,
Namely:
Eq. (4) can be expressed as a function of the load q of the actual beam, the bending stiffness Bm of the positive bending moment zone, the bending stiffness Bi of the negative bending moment zone, the bending moment Mm at the mid-span section of the left span or the right span and the negative bending moment Mi at the internal support section, as follows:
According to the balance condition of the force, the sum of the average value of the mid-span section bending moment and the bending moment of the two side supports section is equal to the mid-span bending moment
where, MB is the bending moment at the side support;
For a two-span continuous beam whose side supports are hinged supports,
Then, Eq. (5) can be simplified to:
Eq. (8) is solved by the iterative method. First, the applied load
In the actual calculation process, the applied load
4.2 Section Stiffness of Composite Slab
Obviously, according to mechanical knowledge, the bending moment of a section is affected by the bending stiffness of that section. Therefore, determining the section stiffness of the composite slab is very important. Given the non-uniformity distribution of the section stiffness along the slab’s longitudinal direction, it is suggested that the internal force can be analyzed according to the average minimum stiffness of the section in the same bending moment zone (i.e., the positive and negative bending moment zones) [14,17].
To determine the flexural stiffness of the section, the section analysis method introduced in literature [14] was used to draw the moment-curvature (M −1/ρ) relationship curves of the cross-section of the mid-span and the internal support section, and the slope of each stage of the curve represented the section stiffness.
Fig. 16 shows the typical section and the distributions of the section stress and strain for the internal support and the mid-span section. The meanings of each symbol in Fig. 16a are as follows:

Figure 16: Calculation diagram of the section bending stiffness. (a) Calculated cross-section. (b) Positive moment section. (c) Negative moment section
As shown in Fig. 16b, for the mid-span section in the positive bending moment zone,
As shown in Fig. 16c, for the internal section in negative bending moment zone, since the concrete and the longitudinal steel bars are in the tensile zone, their stress and strain at the same position as the tension zone are tensile stress
In the process of stiffness calculation, it should be assumed that the composite beam meets the assumption of plane section, and the material constitutive relation of the concrete and steel bars can be determined according to the concrete structure design code or specification, respectively, and the constitutive relation of FRP is consider as a linear relationship. During the entire process of bending moment redistribution, the bending moment in the positive bending moment zone puts the concrete layer and steel bars in a compressed state, while the FRP profile is in a tensile state, without concrete cracking or steel bars yielding in tension. Therefore, the mid-span section bending stiffness Bm,e can be considered as the bending stiffness provided by the entire section of the composite section. When under the negative bending moment, concrete cracking and steel bars yielding in tension occurred successively. Therefore, the bending stiffness of the composite section at the internal support section can be divided into the bending stiffness Bi,e of the composite section before concrete cracking, the bending stiffness Bi,cr of the composite section after concrete cracking and before the yielding of the steel bars, and the bending stiffness Bi,y of the composite section after the yielding of the steel bars.
4.3 Common Working Condition Expression
1) Full uniform load
As shown in Fig. 17a, the external load is denoted as

Figure 17: Fully distributed uniform load condition. (a) Load diagram. (b) Bending moment diagram. (c) Stiffness diagram. (d) Conjugate beam load
It can be seen that each figure is axisymmetric with internal support. Taking the left span as the calculation object, and letting the left side support as the coordinate origin, the bending moment formula of the left span is as follows:
where, X and Y are the coordinate axis; l is the span of the left span or right span.
Assuming the coefficient
where,
The support form and load graph
Eq. 11(a) represents the load expression corresponding to the positive bending moment zone of the conjugate beam, and Eq. 11(b) represents the load expression corresponding to the negative bending moment zone of the conjugate beam.
Obtained from the condition of rotation balance of the middle hinge of the conjugate beam, the following equation can be given as:
2) Symmetrical concentrated load in the span
As shown in Fig. 18a, the concentrated load is recorded as

Figure 18: Concentrated load condition. (a) Load diagram. (b) Bending moment diagram. (c) Stiffness diagram. (d) Conjugate beam load
Note the coefficient
Correspondingly, the support form of the conjugate beam and the load graph
Calculated by the rotational equilibrium condition of the middle hinge of the conjugate beam, it can be obtained as:
As indicated in Table 2, the calculation process for analyzing the redistribution of internal forces is as follows: 1) calculating the bending stiffness Bi,e before concrete cracking, the bending stiffness Bi,cr after concrete cracking and before the yielding of the steel bars, and the bending stiffness Bi,y after the yielding of the steel bars for the internal support section. The calculated results for above stiffness values are listed in items (1) to (3) of Table 2; 2) calculating the mid-span section bending stiffness Bm,e and the calculated value is given in item (4) of Table 2; 3) Assuming an applied load, such as the cracking load Pcr,t = 40 kN (item (5) in Table 2) of the internal support corresponding to specimen GC-1 and providing an initial value of the bending moment Mi at the mid-span section, as shown in item (6) of Table 2; 4) calculating the parameter

To verify the validity of the proposed analysis method presented herein, the calculated values are compared with the test results, as shown in Table 3. Table 3 lists the measured bending moment values and theoretical bending moment values of the internal support section for the cracking, yielding and ultimate states. It can be seen that the ratio between the measured values and the theoretical ones of the cracking moment and yielding moment at the internal support is 0.90 and 1.17, respectively, for specimen GC-1 and 0.87 and 1.03, respectively, for specimen GC-2. In like manner, the ratio between the measured values and the theoretical ones of the ultimate moment at the mid-span section is 1.05 and 1.16, respectively, for specimen GC-1 and specimen GC-2. It can be seen that the calculation method suggested in this paper can effectively predict the moment redistribution of the continuous composite slab.

1. The connection method in composite slabs with steel beams has a significant impact on the constraint stiffness of the side supports. Epoxy resin connections result in relatively low constraint stiffness, while shear stud connections provide a higher level of constraint stiffness. Consequently, weak connections exhibit two instances of moment redistribution, whereas strong connections experience only one instance. Shear stud connections, in particular, greatly enhance the rigidity of composite slabs compared to epoxy resin connections.
2. In both connection methods, the specimens exhibited identical failure modes where the concrete at the mid-span section underwent compression failure. However, a notable difference was observed in the behavior of the GFRP profile’s web at the mid-span section. As the web was situated within the compression zone, it experienced local instability and suffered tear damage.
3. A calculation method was developed using the conjugate beam method to assess the redistribution of bending moments in composite slabs. The comparison between test values and calculated values revealed average ratios of 0.89 for the cracking moment, 1.10 for the yielding moment at the internal support, and 1.12 for the ultimate moment at the mid-span section. These findings demonstrate that the proposed method is capable of predicting the bending moment redistribution in composite slabs with a reasonable level of accuracy.
Acknowledgement: None.
Funding Statement: This study was financially supported by National Natural Science Foundation of China (Project No. 51878156, received by Wen-Wei Wang and EPC Innovation Consulting Project for Longkou Nanshan LNG Phase I Receiving Terminal (Z2000LGENT0399, received by Wen-Wei Wang and Zhao-Jun Zhang).
Author Contributions: The authors confirm contribution to the paper as follows: study conception and design: Zhao-Jun Zhang, Wen-Wei Wang; data collection: Jing-Shui Zhen, Hui Huang; analysis and interpretation of results: Bo-Cheng Li, De-Cheng Cai, Yang-Yang Du; draft manuscript preparation: Zhao-Jun Zhang, Wen-Wei Wang. All authors reviewed the results and approved the final version of the manuscript.
Availability of Data and Materials: The data and materials in the current study are available from the corresponding author on a reasonable request.
Ethics Approval: Not applicable.
Conflicts of Interest: The authors declare that they have no conflicts of interest to report regarding the present study.
References
1. Zou Y, Yu K, Heng J, Zhang Z, Peng H, Wu C, et al. Feasibility study of new GFRP grid web–Concrete composite beam. Compos Struct. 2023;305:116527. [Google Scholar]
2. Zou X, Feng P, Wang J, Wu Y, Feng Y. FRP stay-in-place form and shear key connection for FRP-concrete hybrid beams/decks. Compos Struct. 2018;192:489–99. [Google Scholar]
3. Khodadadi N, Roghani H, Harati E, Mirdarsoltany M, De Caso F, Nanni A. Fiber-reinforced polymer (FRP) in concrete: a comprehensive survey. Constr Build Mater. 2024;432:136634. [Google Scholar]
4. Huang Z, Wei Y, Zhao K, Chen D, Lin Y. CFRP-steel composite beams with seawater sea sand concrete cores subjected to bending. Constr Build Mater. 2024;422:135807. [Google Scholar]
5. Zhang P, Hu R, Zou X, Liu Y, Li Q, Wu G. Experimental study of a novel continuous FRP-UHPC hybrid beam. Compos Struct. 2021;261(3):113329. doi:10.1016/j.compstruct.2020.113329. [Google Scholar] [CrossRef]
6. Triantafillou T, Meier U. Innovative design of FRP combined with concrete. In: Advanced composite materials in bridges and structures: 1st International Conference, 1992; Quebec, QC, Canada. [Google Scholar]
7. Saiidi M, Gordaninejad F, Wehbe N. Behavior of graphite/epoxy concrete composite beams. J Struct Eng. 1994;120(10):2958–76. doi:10.1061/(ASCE)0733-9445(1994)120:10(2958). [Google Scholar] [CrossRef]
8. Koaik A, Bel S, Jurkiewiez B. Experimental tests and analytical model of concrete-GFRP hybrid beams under flexure. Compos Struct. 2017;180:192–210. doi:10.1016/j.compstruct.2017.07.059. [Google Scholar] [CrossRef]
9. Neagoe CA, Gil L, Perez MA. Experimental study of GFRP-concrete hybrid beams with low degree of shear connection. Constr Build Mater. 2015;101:141–51. doi:10.1016/j.conbuildmat.2015.10.024. [Google Scholar] [CrossRef]
10. Fam A, Honickman H. Built-up hybrid composite box girders fabricated and tested in flexure. Eng Struct. 2010;32(4):1028–37. [Google Scholar]
11. Kim YJ, Fam A. Numerical analysis of pultruded GFRP box girders supporting adhesively-bonded concrete deck in flexure. Eng Struct. 2011;33(12):3527–36. doi:10.1016/j.engstruct.2011.07.016. [Google Scholar] [CrossRef]
12. Hai N, Hiroshi M, Wael Z. Flexural behavior of hybrid composite beams. Transport Res Rec. 2013;2332(1):53–63. doi:10.3141/2332-06. [Google Scholar] [CrossRef]
13. Zou X, Feng P, Wang J. Bolted shear connection of FRP-concrete hybrid beams. J Compos Constr. 2018;22(304018012-1–11. doi:10.1061/(ASCE)CC.1943-5614.0000845. [Google Scholar] [CrossRef]
14. Wang W, Dai J. Self-stressed steel fiber reinforced concrete as negative moment connection for strengthening of multi-span simply-supported girder bridges. J Adv Struct Eng. 2013;16(6):1113–27. doi:10.1260/1369-4332.16.6.1113. [Google Scholar] [CrossRef]
15. Ma Z, Huo X, Tadros MK, Baishya M. Restraint moments in precast/prestressed concrete continuous bridges. PCI J. 1998;43(6):40–56. doi:10.15554/pcij.11011998.40.57. [Google Scholar] [CrossRef]
16. Makarand H, Amir M, Richard M, Ronak S, Reid C. State of practice for positive moment connections in prestressed concrete girders made continuous. J Bridge Eng. 2023;8(5):267–72. [Google Scholar]
17. Zhang P, Qi Y, Zou X, Feng Y, Sheikh S. Flexural performance of prefabricated FRP-concrete hybrid beam with in-situ-cast UHPC pockets. Thin-Walled Struct. 2023;185(6):110616. doi:10.1016/j.tws.2023.110616. [Google Scholar] [CrossRef]
18. Zeng D, Cao L, Liu Y, Li Z, Li H. Flexural response of GFRP-UHPC composite slabs under a hogging moment. J Bridge Eng. 2023;28(11):04023082. doi:10.1061/JBENF2.BEENG-6383. [Google Scholar] [CrossRef]
19. Zhang Z, Fan X, Yang F, Meng Q. Experimental research on section design and internal force redistribution of inverted U-shaped high-strength encased steel and high-strength concrete continuous composite beam. Build Struct. 2019;49(6):55–60 (In Chinese). [Google Scholar]
20. Han C, Zhang J, Zhou D, Shuang C. Analytical method for computing creep secondary internal forces of continuous composite beams influenced by support constraints. Trans Beijing Institute Technol. 2020;40(1):40–7 (In Chinese). [Google Scholar]
21. Ministry of Transportation of the People’s Republic of China. Code for design of highway reinforced concrete and prestressed concrete bridges and culverts. Beijing, China; 2024 (In Chinese). [Google Scholar]
22. Ministry of Housing and Urban Rural Development of the People’s Republic of China. Standard for testing method of concrete structures. Beijing, China; 2012 (In Chinese). [Google Scholar]
Cite This Article
 Copyright © 2025 The Author(s). Published by Tech Science Press.
This work is licensed under a Creative Commons Attribution 4.0 International License , which permits unrestricted use, distribution, and reproduction in any medium, provided the original work is properly cited.


 Submit a Paper
 Propose a Special lssue
 View Full Text
 Download PDF
 Downloads
 Citation Tools