
 Submit a Paper
 Propose a Special lssue
 Open Access
ARTICLE

Intelligent Diagnosis of Highway Bridge Technical Condition Based on Defect Information
1 Faculty of Maritime and Transportation, Ningbo University, Ningbo, 315211, China
2 School of Civil & Environmental Engineering and Geography Science, Ningbo University, Ningbo, 315211, China
* Corresponding Author: Xiaoling Liu. Email:
Structural Durability & Health Monitoring 2024, 18(6), 871-889. https://doi.org/10.32604/sdhm.2024.052683
Received 11 April 2024; Accepted 04 July 2024; Issue published 20 September 2024
 View Full Text
 Download PDF
Abstract
In the bridge technical condition assessment standards, the evaluation of bridge conditions primarily relies on the defects identified through manual inspections, which are determined using the comprehensive hierarchical analysis method. However, the relationship between the defects and the technical condition of the bridges warrants further exploration. To address this situation, this paper proposes a machine learning-based intelligent diagnosis model for the technical condition of highway bridges. Firstly, collect the inspection records of highway bridges in a certain region of China, then standardize the severity of diverse defects in accordance with relevant specifications. Secondly, in order to enhance the independence between the defects, the key defect indicators were screened using Principal Component Analysis (PCA) in combination with the weights of the building blocks. Based on this, an enhanced Naive Bayesian Classification (NBC) algorithm is established for the intelligent diagnosis of technical conditions of highway bridges, juxtaposed with four other algorithms for comparison. Finally, key defect variables that affect changes in bridge grades are discussed. The results showed that the technical condition level of the superstructure had the highest correlation with cracks; the PCA-NBC algorithm achieved an accuracy of 93.50% of the predicted values, which was the highest improvement of 19.43% over other methods. The purpose of this paper is to provide inspectors with a convenient and predictive information-rich method to intelligently diagnose the technical condition of bridges based on bridge defects. The results of this research can help bridge inspectors and even non-specialists to better understand the condition of bridge defects.Keywords
Bridges are subject to environmental corrosion and vehicle loads during operation, which can lead to defects such as concrete cracks and steel corrosion, thereby affecting the safety and durability of the bridge. Therefore, bridges inspection is very important. At present, bridge inspection mainly relies on on-site personnel investigation results, and then evaluates bridge levels according to regulations. However, the bridge defects investigated are often disconnected from the technical condition. Therefore, it is necessary to accurately grasp the relationship between bridge defects and technical conditions. This provides useful guidance for bridge inspectors to understand the technical conditions of bridges from a macro perspective. At the same time, it also provides reference for maintenance management decision-making.
Determining the technical condition level of a bridge based on its defect data is essentially an effective categorization of its data. Data classification is an important form of data analysis in the field of data mining [1], machine learning, and pattern recognition. The current mainstream classifiers include support vector machine (SVM), decision tree (DT), Naive Bayesian Classification (NBC), artificial neural network, and classification based on association rules [2–4]. In the application of bridge engineering, Yang et al. [5] proposed an effective hybrid classification model to evaluate the health status of bridges, which solves the learning problem of the classification model on large-scale uncertain labels data. Bektas et al. [6] proposed a method to judge the bridge condition by using classification and regression trees. Chung et al. [7] proposed an estimation model for the safety level of highway bridges by comprehensively considering the basic specifications, year of completion, traffic, and safety rating of bridges. Martinez et al. [8] used a variety of classification models to predict the bridge condition index to determine the rehabilitation priority for the bridge. Feng et al. [9] used a combination of finite element simulation and support vector machine to classify the data, so as to achieve the purpose of providing a safety level for bridge scour warning. Mokalled et al. [10] proposed a strategy for multilevel damage classification of bridges using the Bayesian estimation technique based on drive-by health monitoring. Mangalathu et al. [11] used various machine learning methods of quadratic discriminant analysis to predict the failure modes of bridge components with an accuracy of 91%. Jootoo et al. [12] used Decision Trees (DT), Bayesian Networks, and Support Vector Machines (SVM) to predict bridge design types. Hu et al. [13] proposed a corrosion-damaged bridge abutment damage mode discrimination method considering probability based on Fisher’s discriminant grouping, combined with Bayes’ formula and related theories. Zhang et al. [14] established a multi-indicator and multi-level bridge deck system reliability evaluation model in order to reasonably evaluate the reliability of the concrete bridge deck system, and gave the categorization criteria of the basic evaluation indexes. This shows that classification discrimination is an important tool widely used in the field of bridge engineering. Accurate categorization of bridge structures, materials, and defects can help engineers better understand the nature of the problem and develop appropriate solutions, both during the design phase and during construction and maintenance.
Such methods are also more widely used in other fields. For example, in medicine, many scholars use relevant classification algorithms, such as SVM, artificial neural networks, logistic regression, and other algorithms to predict and diagnose diseases in order to help clinicians [15–18]. Zeng et al. [19] trained and fitted health data based on random forest and other related machine learning algorithms, improving the progress of health data classification. In addition, there are corresponding studies in the classification of fruits and vegetables, combining neural networks, SVM, and other related algorithms to classify the attributes of fruits and vegetables is a common and convenient method [20–22]. And Gupta et al. [23] reviewed recent advances in the identification and classification of fruit and vegetable disease by combining cutting-edge techniques such as machine learning and deep learning.
This study mainly uses the Naive Bayesian classification algorithm. This algorithm is based on the Bayesian theorem and is a simple and effective statistical classification method. It can effectively handle small datasets, has low sensitivity to missing data, and can maintain stable classification efficiency in multiple tasks. However, in real life, the assumption of independence of sample attributes generally does not hold [24,25]. To effectively address the limitations of this algorithm, Wang et al. [26] established a semi-supervised adaptive discriminative discretization framework for Bayes through pseudo-labeling techniques and adaptive discriminative discretization scheme. This significantly reduces the information loss in the discretization process and greatly improves the discriminative ability of the classifier. Wu et al. [27] proposed to introduce the cultural algorithm into the weighted naive bayesian classification algorithm, which can effectively solve the problem that the algorithm lacks conditional independence assumptions and label class selection strategies. Zhang et al. [28], in order to further mitigate the conditional independence assumption, proposed a new improved model called attribute and instance weighted Naive Bayes, which combines attribute weighting with instance weighting into one uniform framework. Similarly, Wang et al. [29] used a combination of PCA and Naive Bayes to classify motor faults.
The number of variables of highway bridge defects is large and the correlation between variables is high. Therefore, this paper proposes to combine the principal component analysis method with the Naive Bayesian classification algorithm. It not only reduces the dimensionality of the variables but also ensures the precondition that the feature variables are independent of each other in the Naive Bayesian classification algorithm. In summary, this paper utilizes examples of highway bridge defects to predict and classify the technical condition level of highway bridges. The extraction of important characteristic variables is simplified by performing Pearson correlation analysis between defects and bridge levels and defects. The intelligent diagnosis model of highway bridge technical conditions based on defect information using the PCA-NBC algorithm is established and compared with other algorithms. In-depth study of key defect variables affect the change of bridge grade, linking the correlation findings in order to assist bridge inspectors in predicting other disease conditions as well as the overall bridge technical condition.
At present, the standard for evaluating highway bridges in China is the ‘Standards for Technical Condition Evaluation of Highway Bridges’ [30] (hereinafter referred to as TCEB). Table 1 demonstrates the categorization of the technical condition levels of highway bridges, which are categorized into five levels according to the highway bridge assessment criteria, with Level 1 being the best and Level 5 being the worst. In this paper, the characteristic condition of 137 highway bridges with all the data of defects in Ningbo is collected and organized, and the characteristic condition of the bridges is obtained as Fig. 1. There are 23 bridges of Level 1 (16.79%), 92 bridges of Level 2 (67.15%), and 22 bridges of Level 3 (16.06%). The selected highway bridges are all beam bridges, including 133 plate girder bridges (97.08%) and 4 box girder bridges (2.92%). According to the classification of bridge scale by span length, there are 71 middle bridges (single span between 20 and 40 meters) (51.82%) and 66 small bridges (single span less than 20 meters) (48.18%).
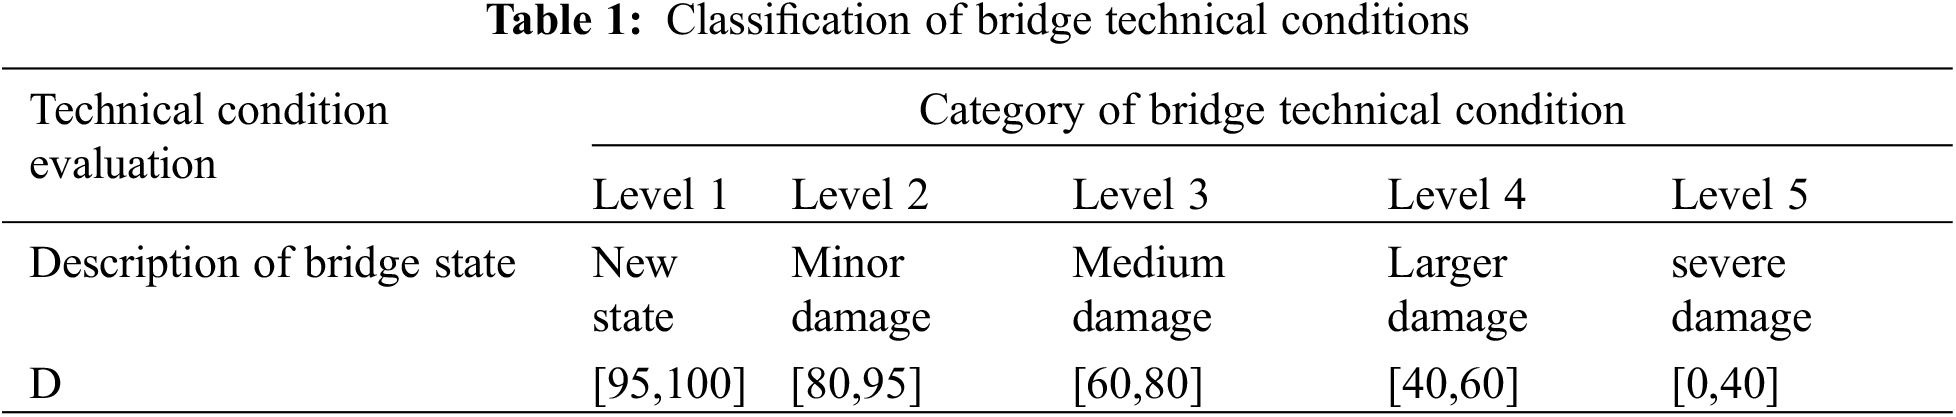
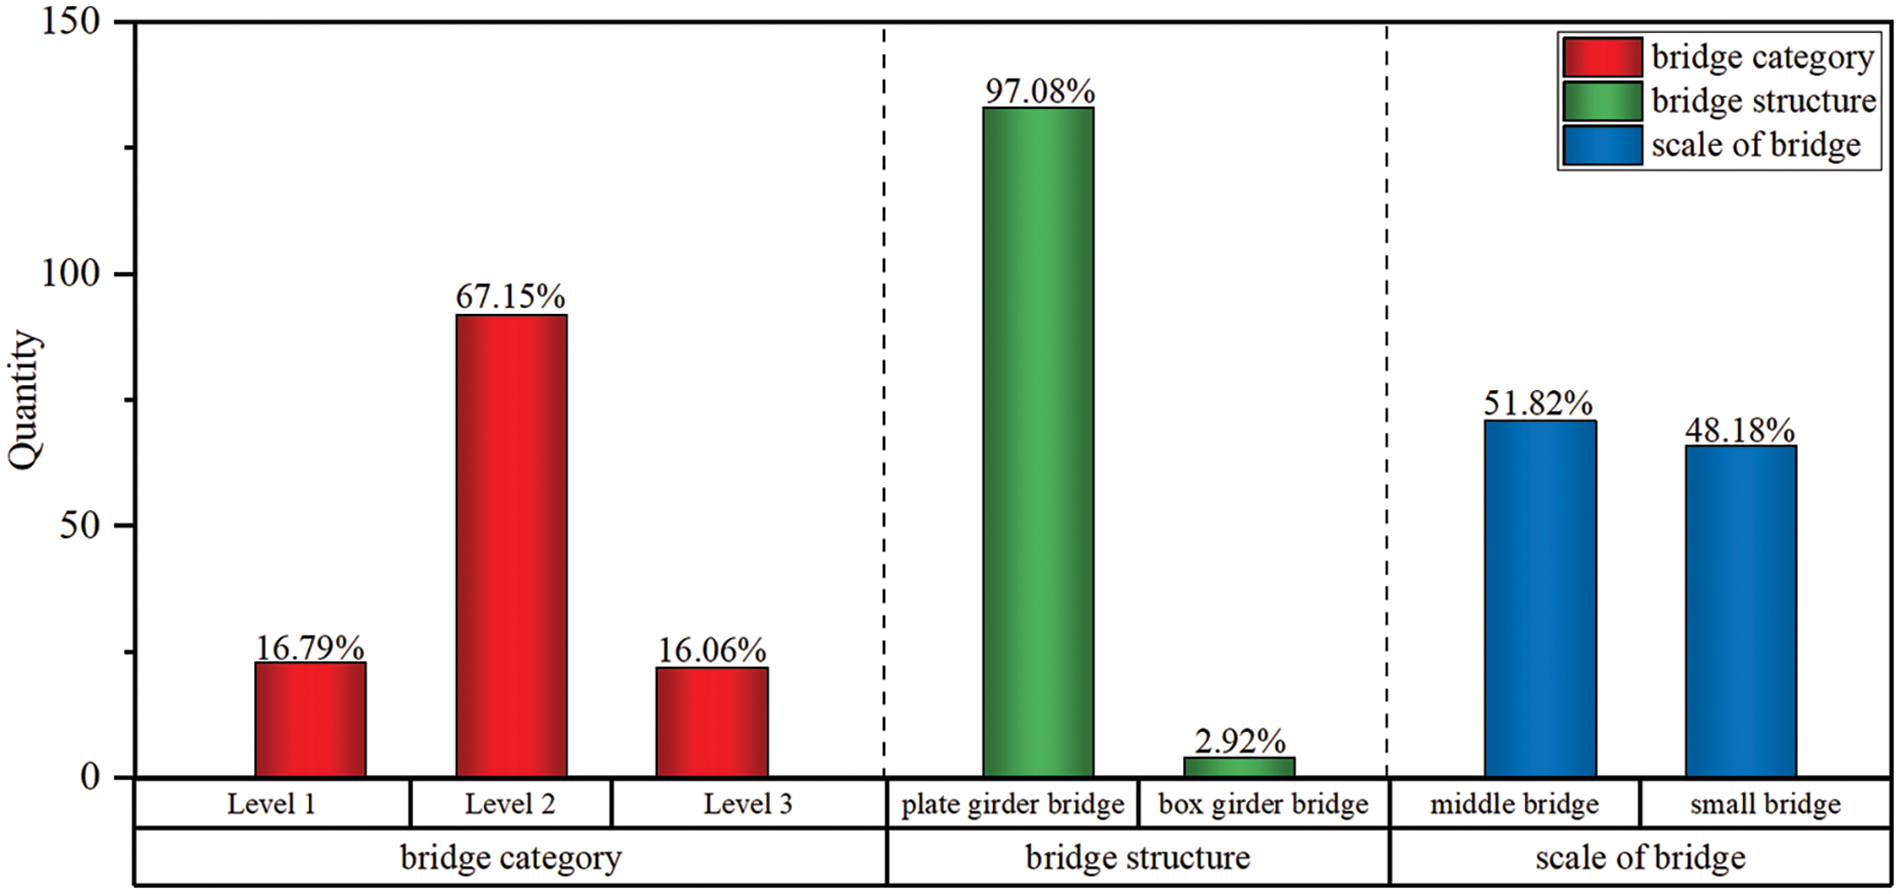
Figure 1: Characteristics of 137 bridges
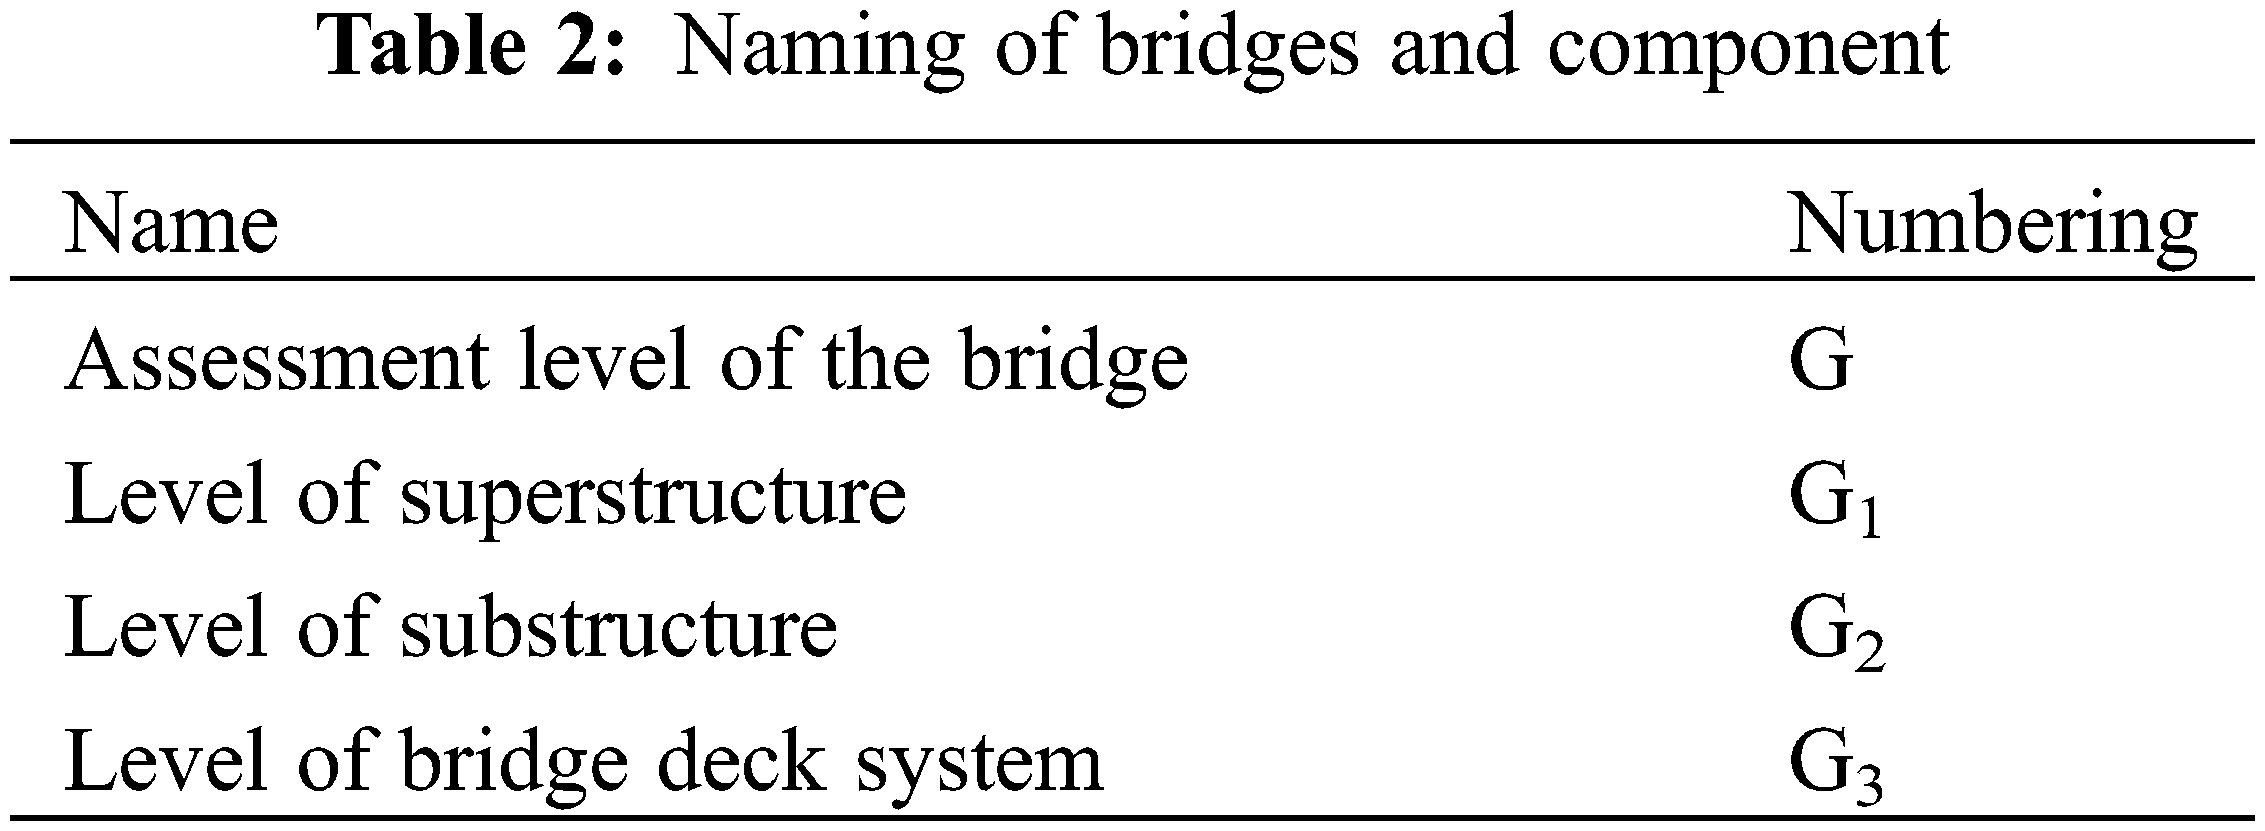
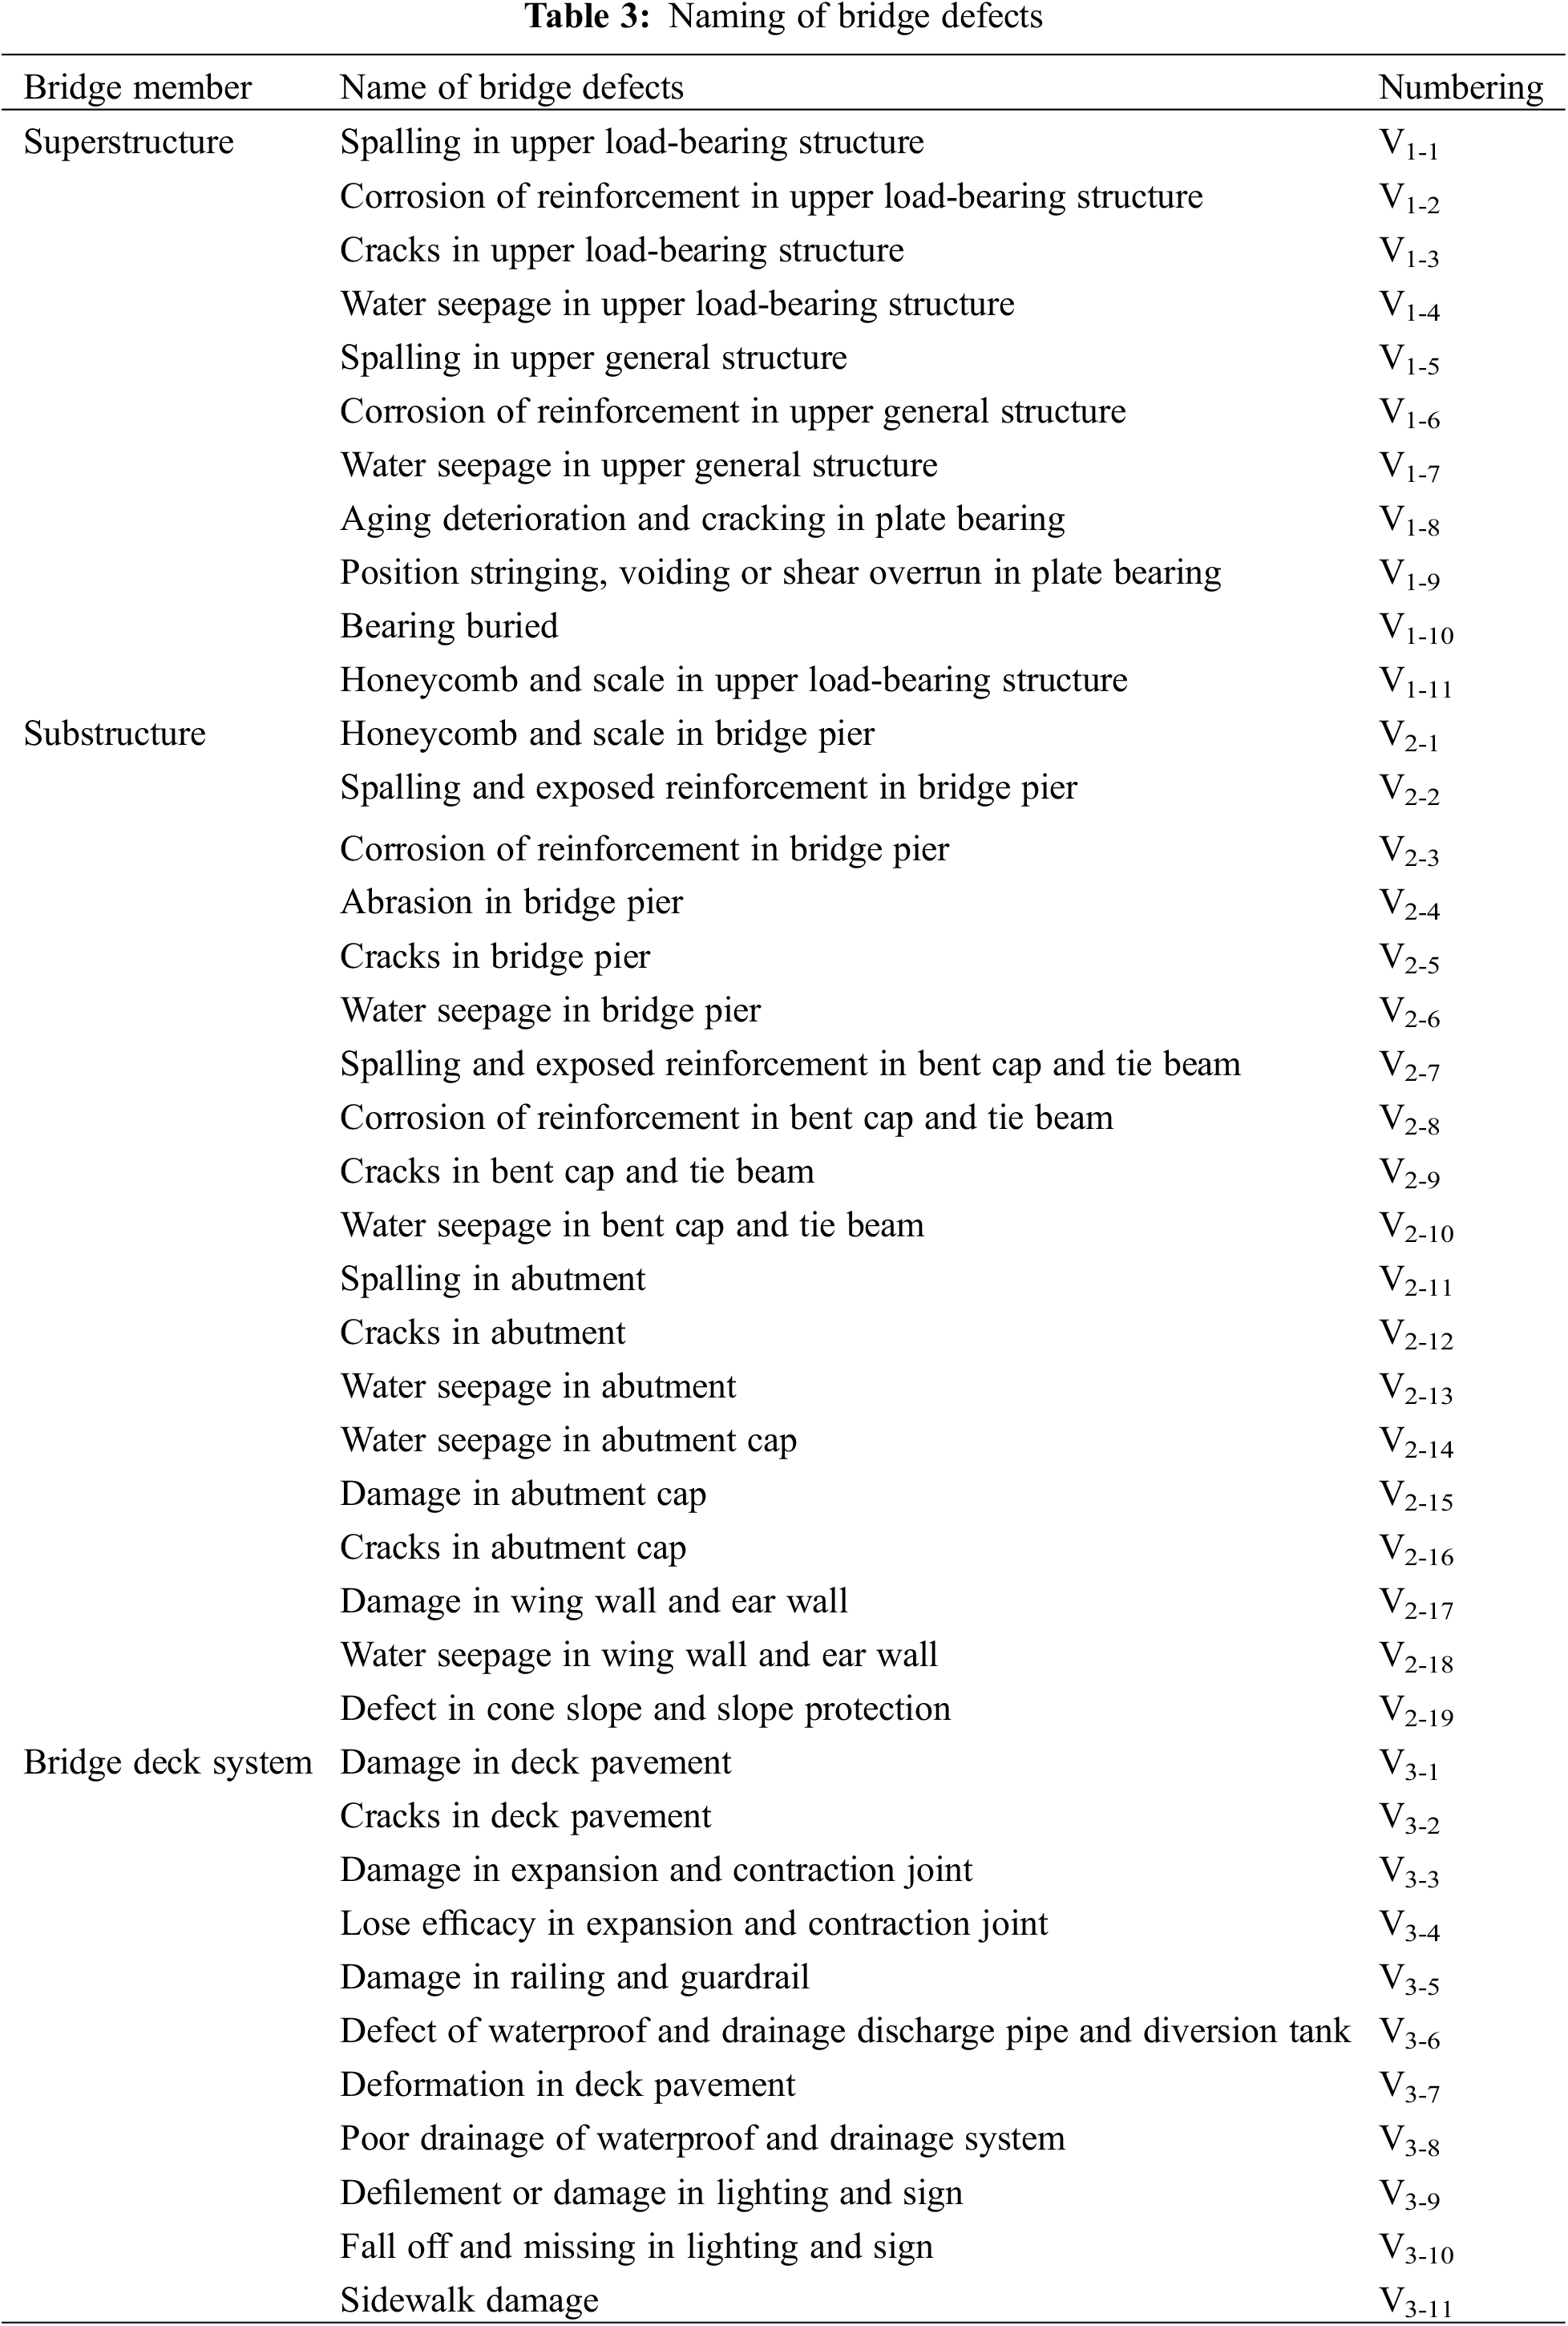
Prior to the correlation analysis of bridge defects, it was necessary to code for the bridge level as well as the percentage of all the defect variables present in the bridges in this study, as shown in Tables 2 and 3. A total of 41 defects were present in all the bridges in this study.
Next, the defect needs to be unified. From the TCEB, depending on the highest level that can be achieved by the test indicator, points need to be deducted accordingly for the different indicator categories of the component, as shown in Table 4. A defect index level is 1, indicating that the component has no such defects. The index level is 2, indicating that the defect has little effect on the bridge and has no effect on the use function of the bridge. The index level is 3, indicating that the component has a moderate defect, and the bridge can still maintain normal function.
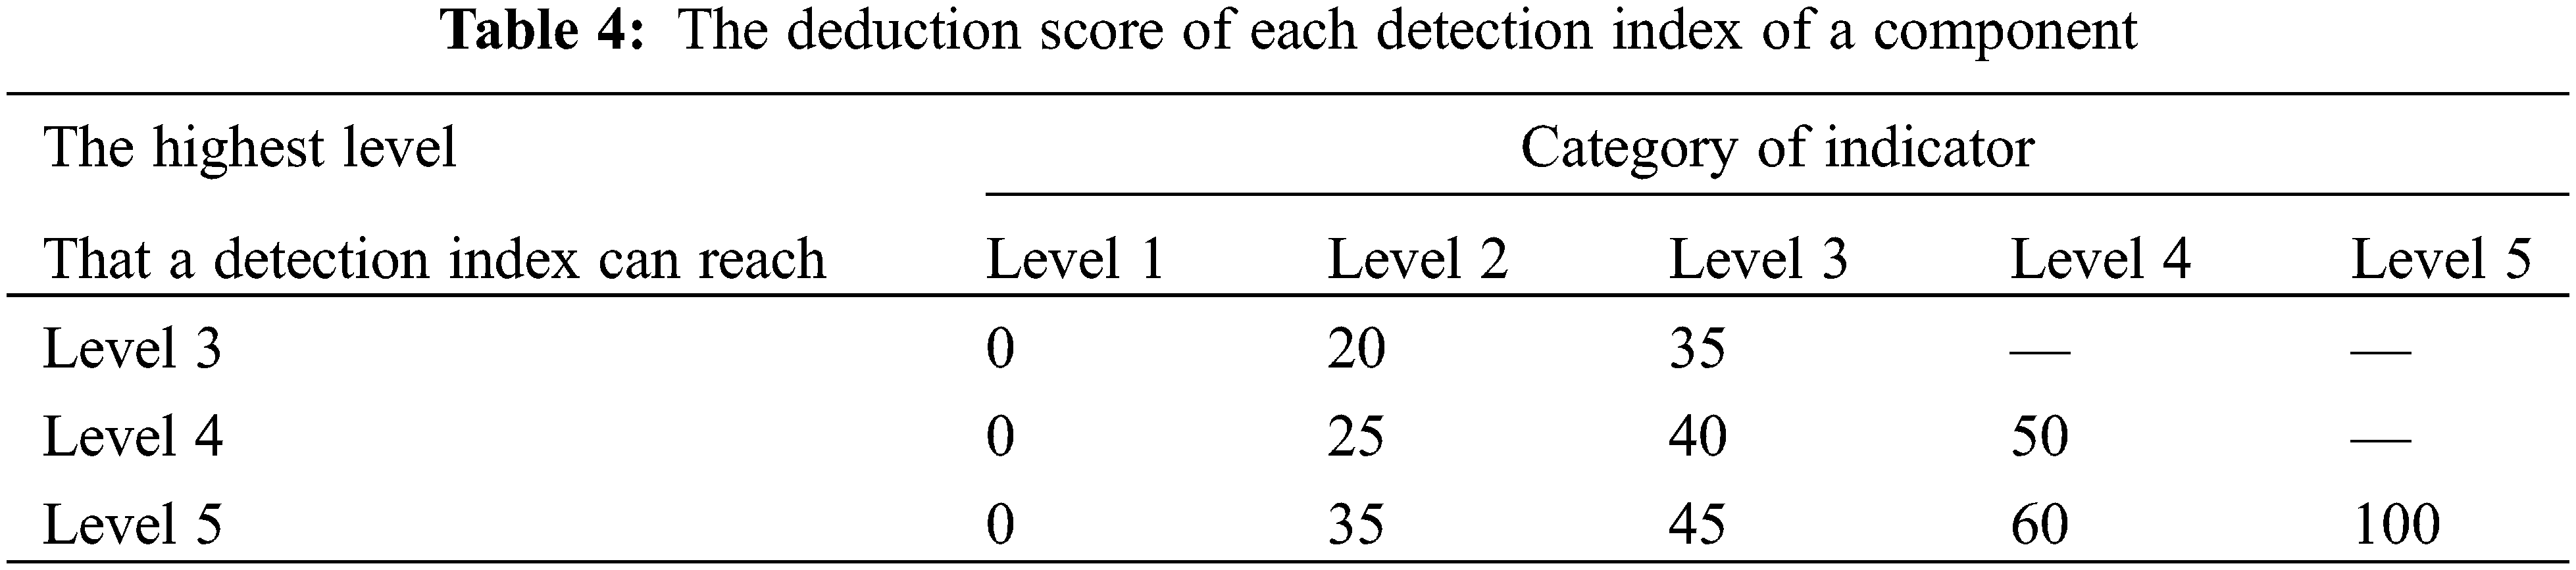
In the highway bridges in service, the defect levels existing in the components are mainly Level 2. Therefore, to facilitate the determination of the effect of bridge defects on bridge level. Based on the deduction score of each detection index in the TCEB, for all defects, grades other than Level 2 were converted to Level 2 with a deduction as a percentage of the grade. For example, assuming that the highest level achievable for a defect is Level 5. let the number of Level 1s for that indicator be n1, the number of Level 2s be n2, and so on. Then the number of Level 2 converted by the defect is then:
In addition, the obtained data need to be normalized. If the number of a particular defect on a bridge component is n, the number of total members of that bridge component is N, and the percentage of bridge defects is P, then:
This section examines the correlation between the presence of defects and defects in each structure, and the correlation between the defects and the technical condition of the bridge components, in order to provide a basis for the prediction of the technical condition of highway bridges. The results of the Pearson correlation calculation based on the above data are shown below:
The following conclusions can be drawn from the above correlation results:
1. From Fig. 2a, the level of superstructure (G1) has the highest correlation with cracks (V1-3) with a Pearson value of 0.7.
2. Due to the large number of components and defects in the substructure, the defects are more dispersed. Therefore, in Fig. 2b, the level of substructure (G2) is less relevant to its defects.
3. In Fig. 2c, the level of bridge deck system (G3) is positively correlated with cracks in deck pavement (V3-2) with a Pearson value of 0.5. This is due to the fact that the bridge deck system carries the largest weight, so its defects have a high correlation with the level of the bridge deck system.
4. The Pearson value between corrosion of reinforcement and cracks in superstructures is 0.5, which is marked with a blue circle in Fig. 2a. When the bridge is in an open or wet environment, the corrosion of reinforcement at the cracks will be more serious. The corrosion of reinforcement will further lead to the enlargement of cracks, which ultimately affects the bearing capacity and durability of the bridge.
5. The Pearson value between spalling and corrosion of reinforcement in the superstructure is 0.6, which is marked with a green circle in Fig. 2a. This is due to the compactness of the concrete is not enough and the thickness of the protective layer is insufficient or damaged, such as honeycomb, damage, spalling, cracks, etc. These defects make the steel bar directly exposed to external conditions, resulting in corrosion. Especially under the conditions of open air, humid environment, and dry-wet alternation, the corrosion rate of unprotected steel bars will be faster.
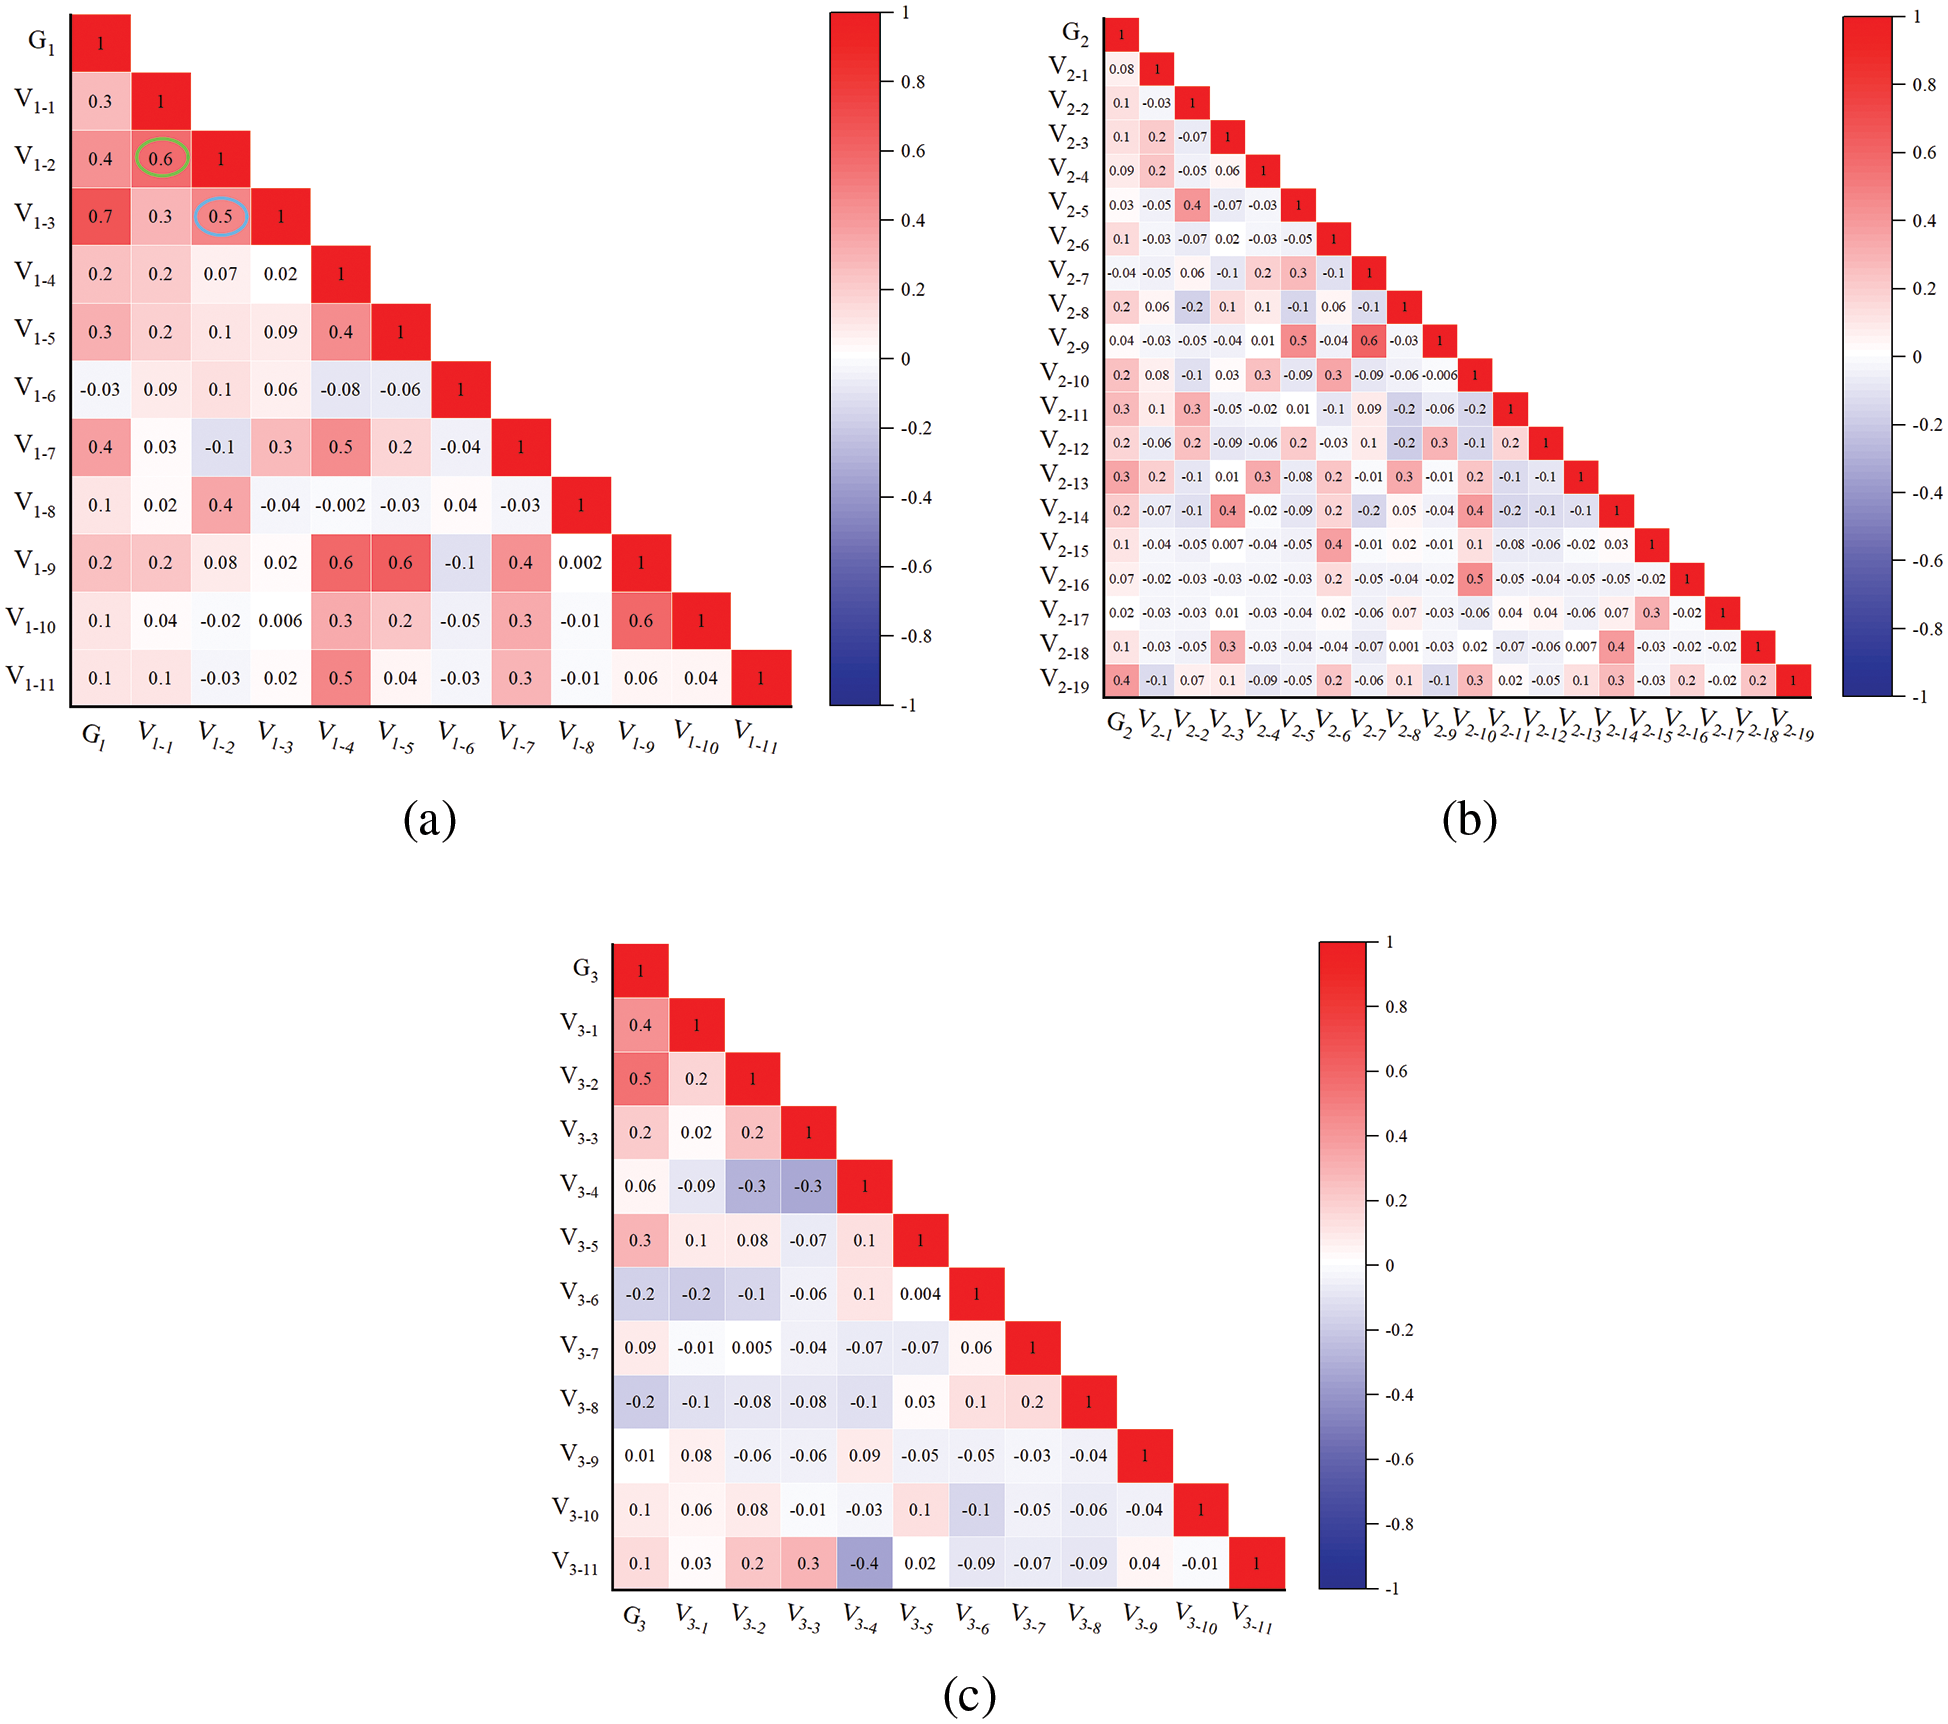
Figure 2: Correlation analysis. (a) The correlation between the level of the superstructure and its existing defect variables. (b) The correlation between the level of substructure and its existing defect variables. (c) The correlation between the level of the bridge deck system and its existing defect variables
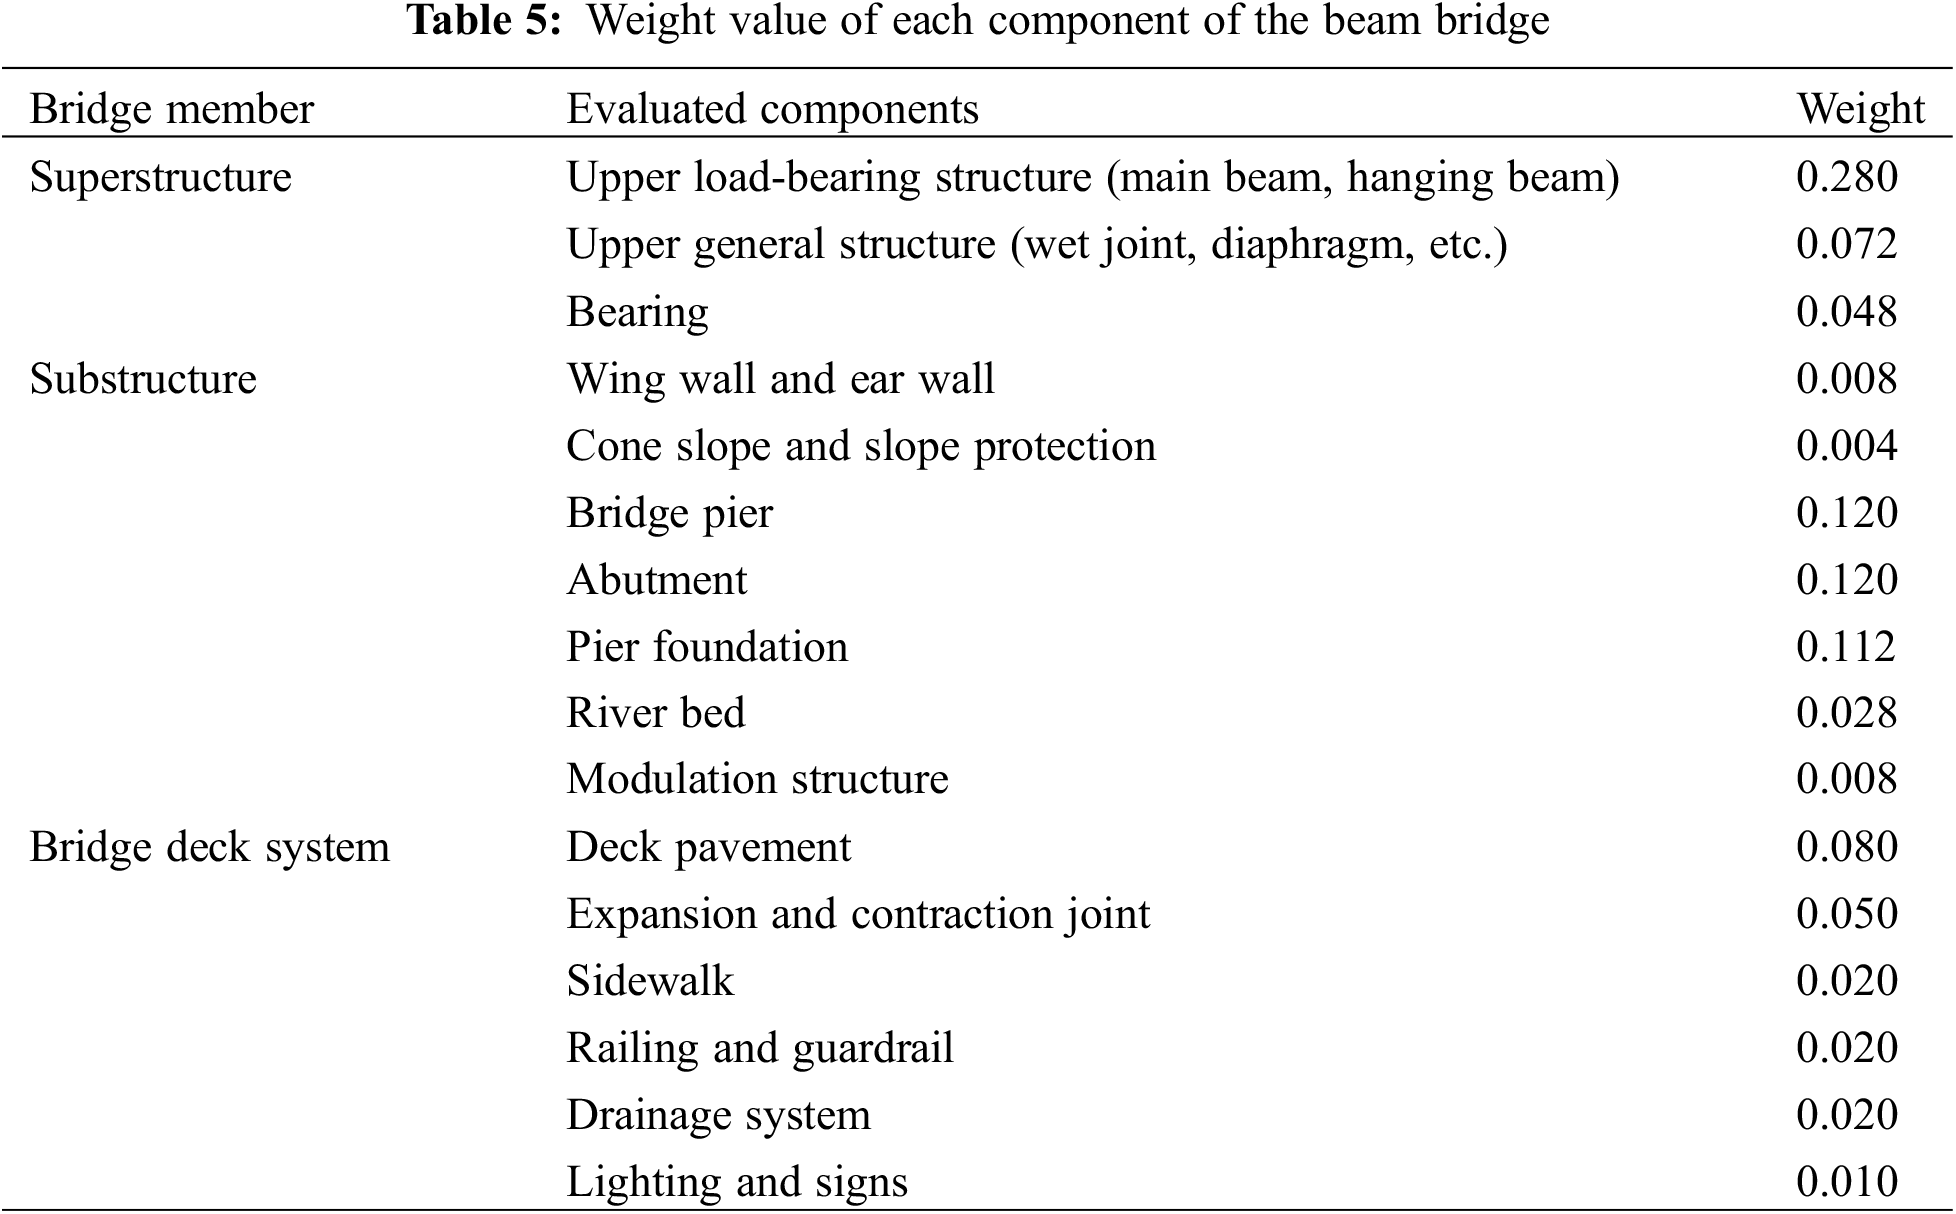
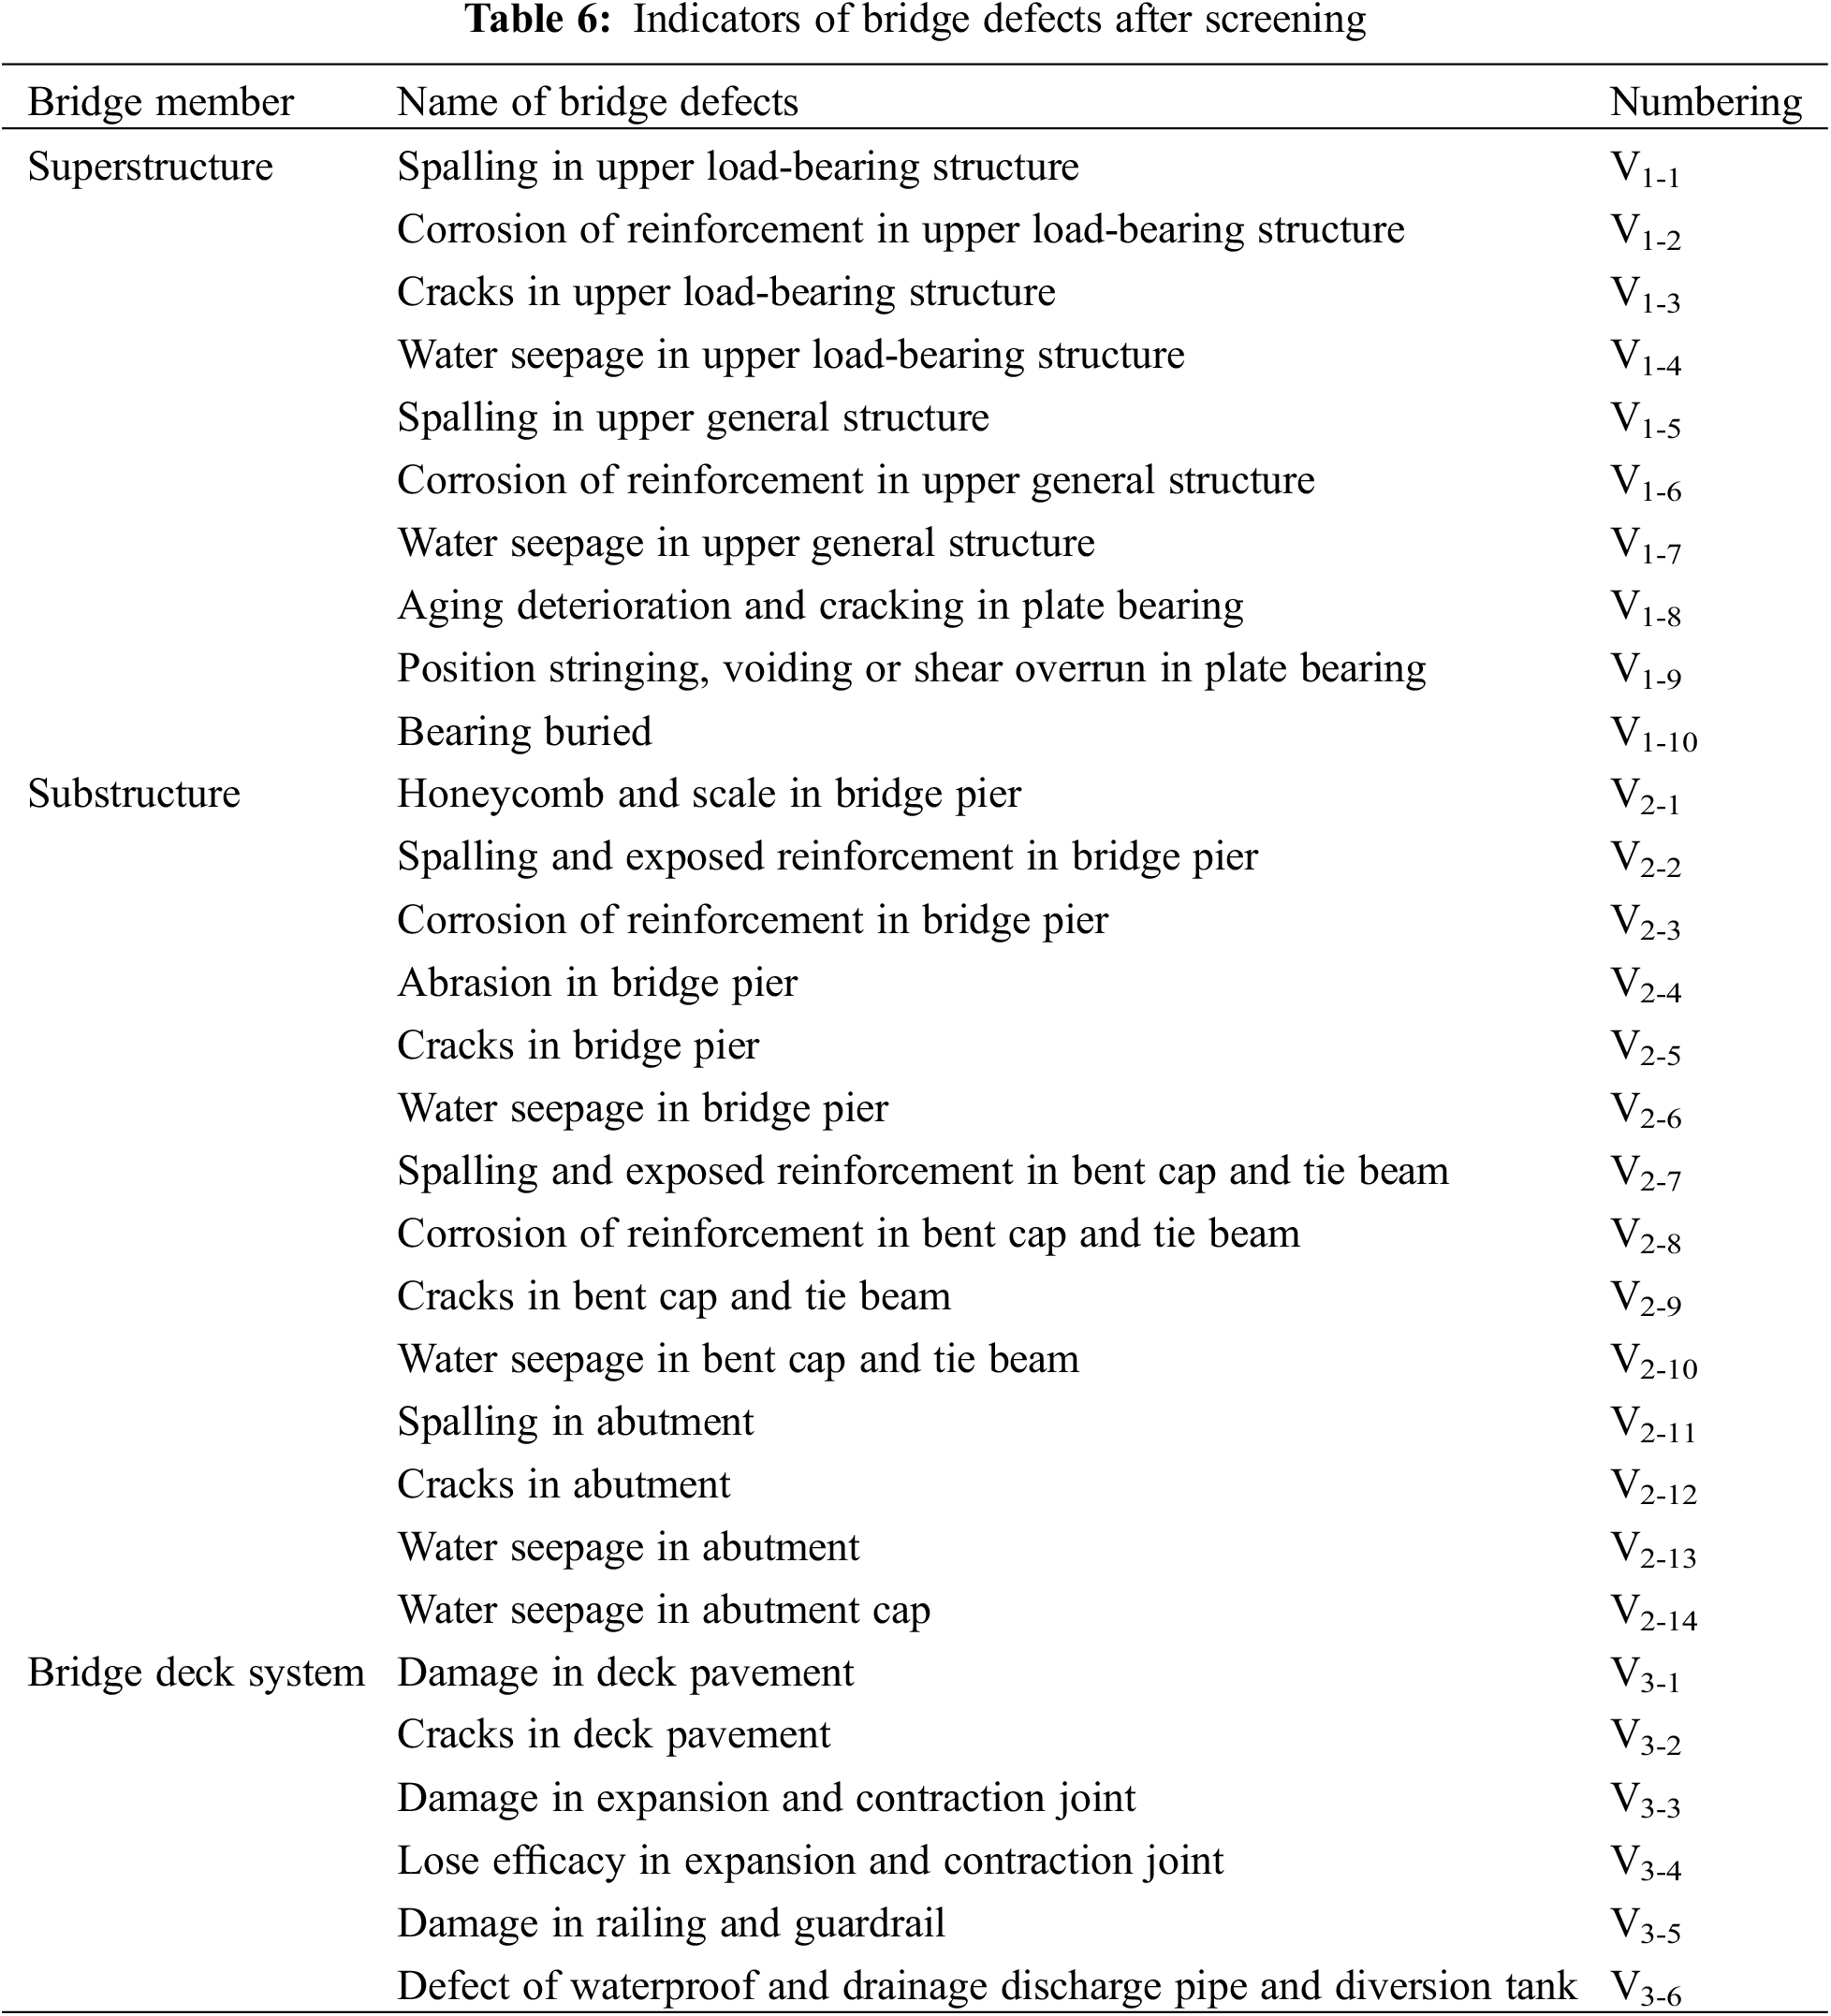
In summary, bridge defects often do not occur independently, but rather interact to affect the overall condition of the bridge. The bridge defect variables were screened based on the above correlation studies and the Weight value of each component of the beam bridge (Table 5) in the TCEB. Remove components with low weight values: wing wall and ear wall, cone slope and slope protection, sidewalk, lighting, and signs. In the selected samples, there are no defects in the pier foundation, river bed, or modulation structure. Finally, a total of 30 variables are obtained, as shown in Table 6.
3 Intelligent Diagnosis of Technical Condition of Highway Bridges
In order to realize intelligent diagnosis of the technical condition of highway bridges based on bridge defects, it is necessary to have a clear understanding of the mapping relationship between the screened defect data and the level of bridge technical condition. On this basis, this paper proposes to combine Principal Component Analysis with Naive Bayesian Classification. This method not only improves the efficiency and accuracy of discrimination but also eliminates the influence of correlation between bridge defect indicators by using principal component analysis, which makes the data conform to the law of normal distribution. At the same time, it is able to compress and reduce the dimensionality of the raw data information to extract the main factors of bridge defect indicators. Thus, an intelligent diagnostic model for the technical condition of highway bridges based on defect information using the PCA-NBC algorithm is established.
3.1 Naive Bayesian Classification
Naive Bayesian Classification (NBC) is a classification method based on the assumption of independence between Bayes theorem and feature conditions. Compared with the original method, the calculation difficulty is simpler, and the classification process is simple and efficient. For a given training dataset, first, the joint probability distribution from input to output is learned based on the assumption of conditional independence of features. Then, based on the learned model, the input x is input, and the output y with the largest posterior probability is found using Bayes’ theorem.
Set the sample data set
Then the class with the largest posterior probability is recorded as the prediction class, that is,
Naive Bayes is based on the independence between features. In the case of a given category y, the above equation can be further expressed as the following:
From the above two formulas, the posterior probability can be calculated as:
Since the size of P(X) is fixed, it is only necessary to compare the molecular part of the above formula when comparing the posterior probability. Therefore, we can get a Naive Bayesian calculation formula that the sample data belongs to the category yi:
Thus, the naive Bayesian classifier can be expressed as:
In practice, the appropriate model can be selected according to whether the data characteristics are continuous or not. When the features are continuous variables, the Gaussian model is used. When the features are discrete variables, a polynomial model is used; if the features are discrete, they are of Boolean type, i.e., true and false, and a Bernoulli model can be used. Since the data in this paper are continuous variables, a Gaussian model is used.
Because the hypothesis of the independence of the feature attributes of the NBC algorithm is often difficult to establish, it often results in suboptimal classification outcomes. Therefore, this paper combines the PCA with the NBC algorithm. PCA is one of the most widely used data dimensionality reduction algorithms. This method reduces the dimension of the original features, retains some of the most important features, and reduces the correlation between the feature variables while ensuring the minimum loss of information. By incorporating PCA, it becomes possible to satisfy the independence assumption of NBC and thereby enhance classification accuracy. On this basis, an intelligent diagnostic model for the technical condition of highway bridges is established. The steps are as follows, and the flowchart of the PCA-NBC algorithm is shown in Fig. 3.
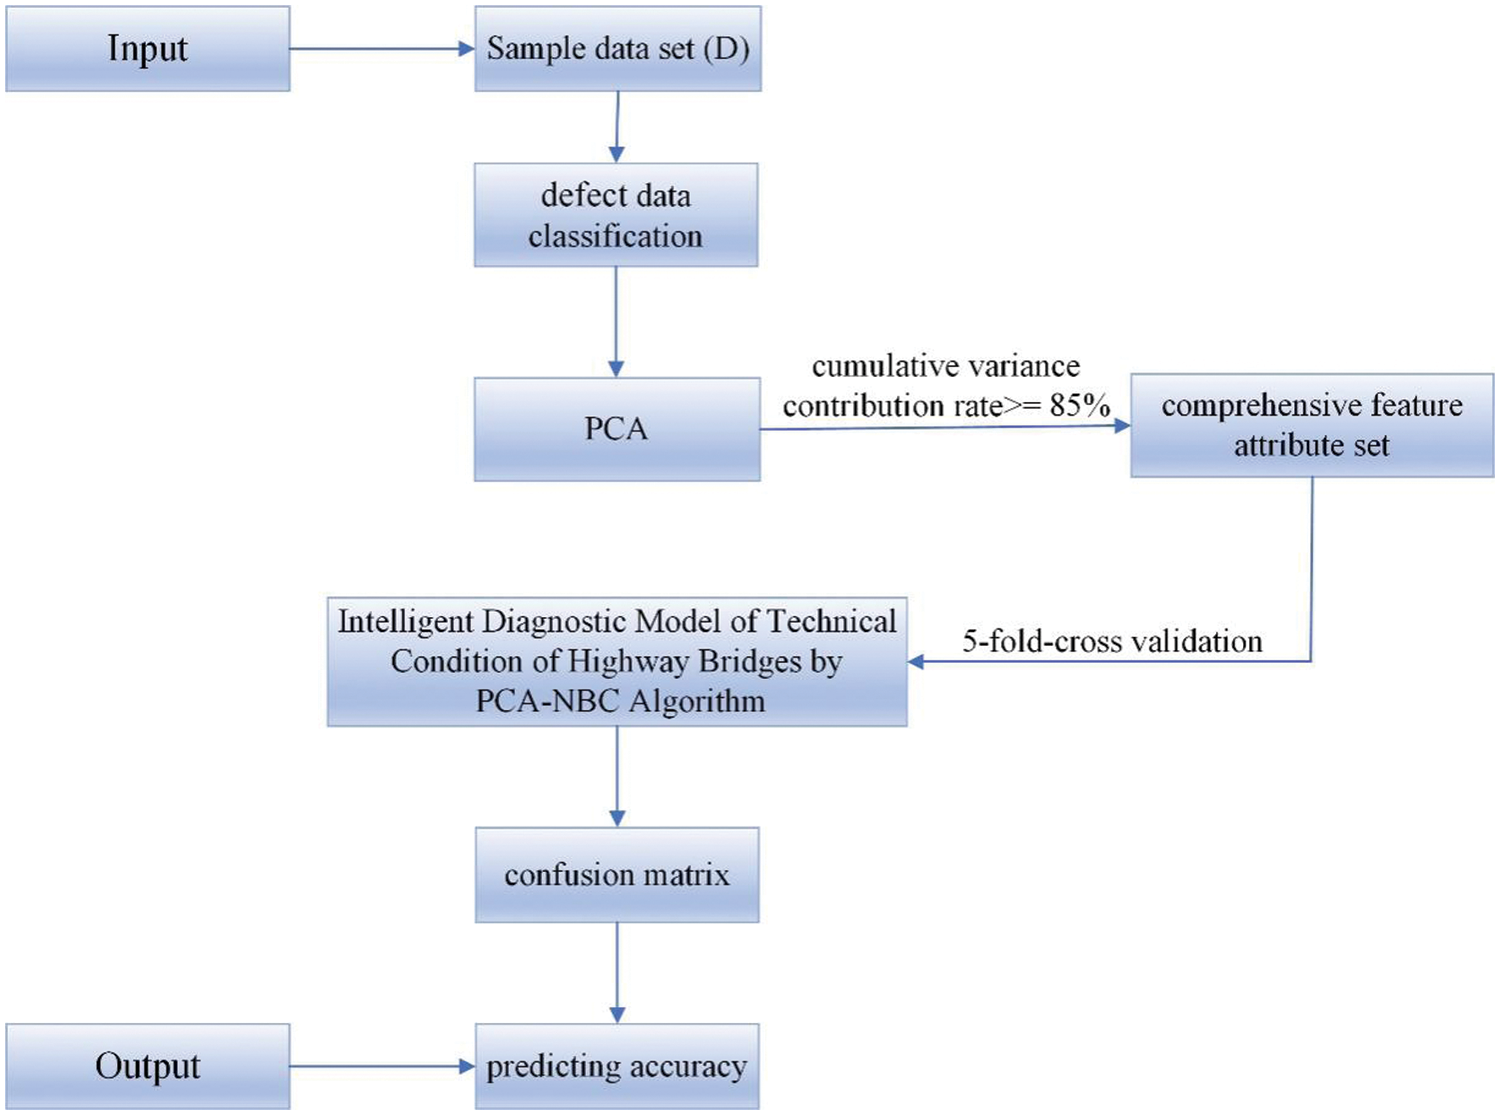
Figure 3: PCA-NBC algorithm flow
Input: sample data set D, including feature attribute set X and class variable Y.
Step 1: According to the basic structure of the bridge, the data of defect variables were analyzed.
Step 2: According to the basic principle of PCA, appropriate feature variables are selected to form a new comprehensive feature attribute set.
Step 3: Validation of the dataset using 5-fold-cross validation.
Step 4: Establish the intelligent diagnosis model of highway bridge technical condition based on defect information using the PCA-NBC algorithm.
Step 5: The level of the sample to be tested is taken as the one with the largest a posteriori probability.
Step 6: Calculate the accuracy of model discrimination (ACC) according to the confusion matrix obtained.
Output: The ACC of the training set and the samples to be tested.
In addition to that, in order to verify the performance of the proposed model, ACC and F1 Score are selected as the evaluation metrics in this paper. Since this paper is solving a three-category problem, Macro-F1 is used in this paper, i.e., TP, FP, FN, and TN of each category are counted, and their respective Precision and Recall are calculated to get their respective F1 Scores, and then the average is taken to get Macro-F1. According to the confusion matrix (Fig. 4), the calculation formula can be obtained as shown below:
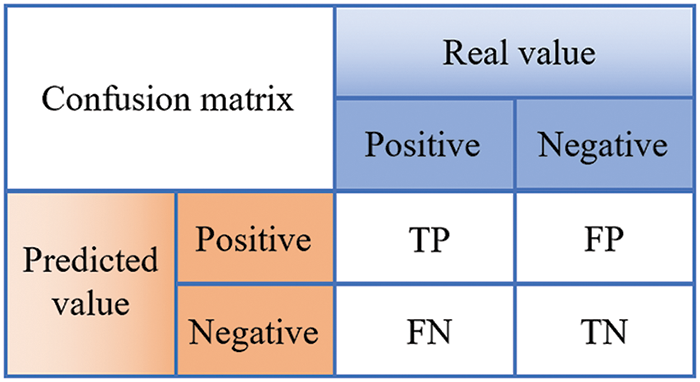
Figure 4: Confusion matrix
4.1 Verification and Comparison
According to the established intelligent diagnostic model for the technical condition of highway bridges, the filtered variable data are input. According to steps 2 of Section 3.2, a set of comprehensive feature attribute sets can be obtained. The number of characteristic variables is reduced to 21, which is named as x1, x2, x3,…, x21. In turn, the degree of correlation of the comprehensive feature attribute set and whether the data are normally distributed are determined. From Figs. 5 and 6, the Pearson values between the characteristic attributes and after calculating the absolute values for them, the average value was found to be 0.15. And, the data conforms to a normal distribution, then the model can be solved using a Gaussian model.
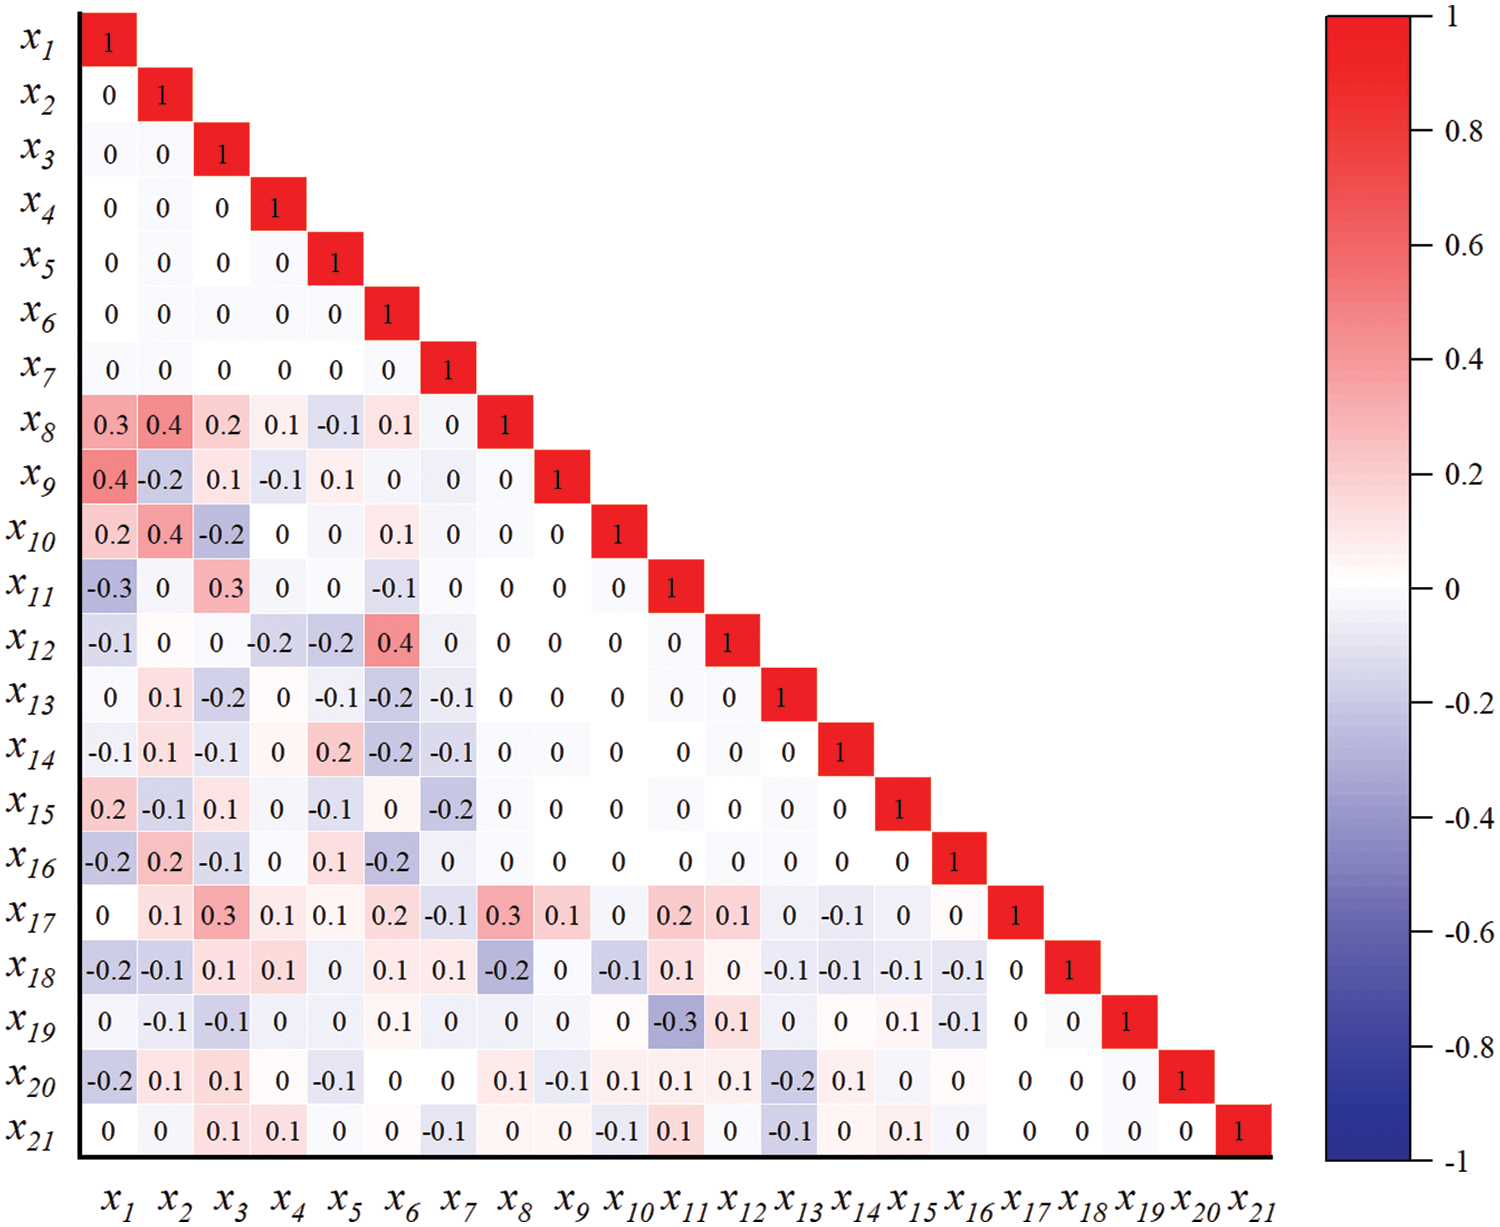
Figure 5: Correlation graph of the variables
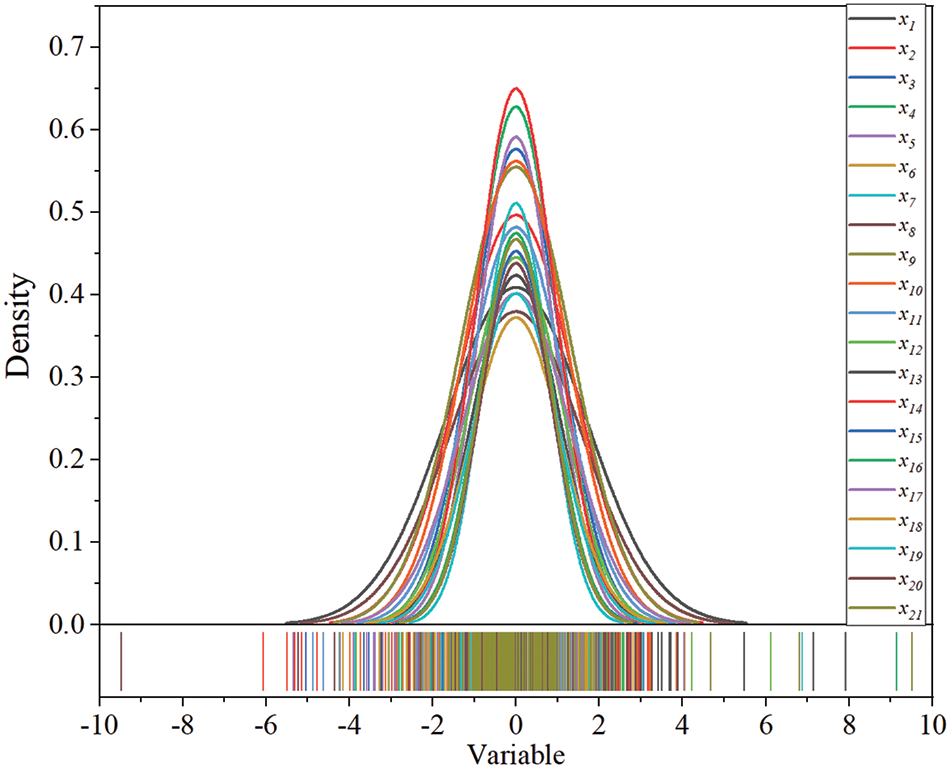
Figure 6: Normal distribution diagram of 21 variables
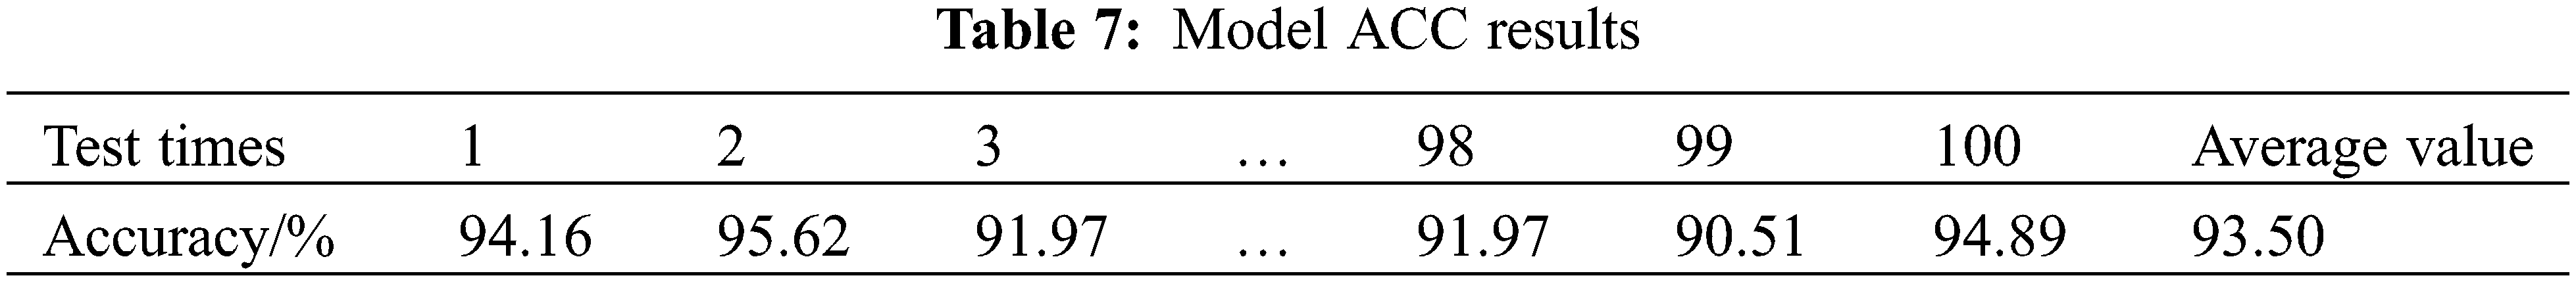
Establish the intelligent diagnostic model of the technical condition of highway bridges according to Section 3.2, and determine the level of the technical condition of the samples to be tested. Since the model uses cross-validation for data categorization and randomly draws training samples, the ACC obtained from each test is slightly different. Therefore, 100 tests were conducted on the same set of data and averaged to get the final classification accuracy as shown in Table 7. The highest value of ACC for bridge level discrimination was 95.62% and the lowest value was 90.51%, resulting in a final classification accuracy average of 93.50%.
To explore whether the NBC algorithm is optimal, the decision tree algorithm, SVM algorithm, Fisher algorithm, and BP algorithm were also tested for their ability to intelligently diagnose the technical condition of bridges. All were tested 100 times and the results are shown in Table 8 and Fig. 7. The average classification ACC of DT algorithm, SVM algorithm, Fisher algorithm, and BP algorithm are 92.39%, 88.52%, 81.80%, and 74.07%. In addition, Table 8 shows the F1 Score of these algorithms. The F1 Score of the model in this paper presents a better performance. In comparison, the PCA-NBC algorithm classifies better.
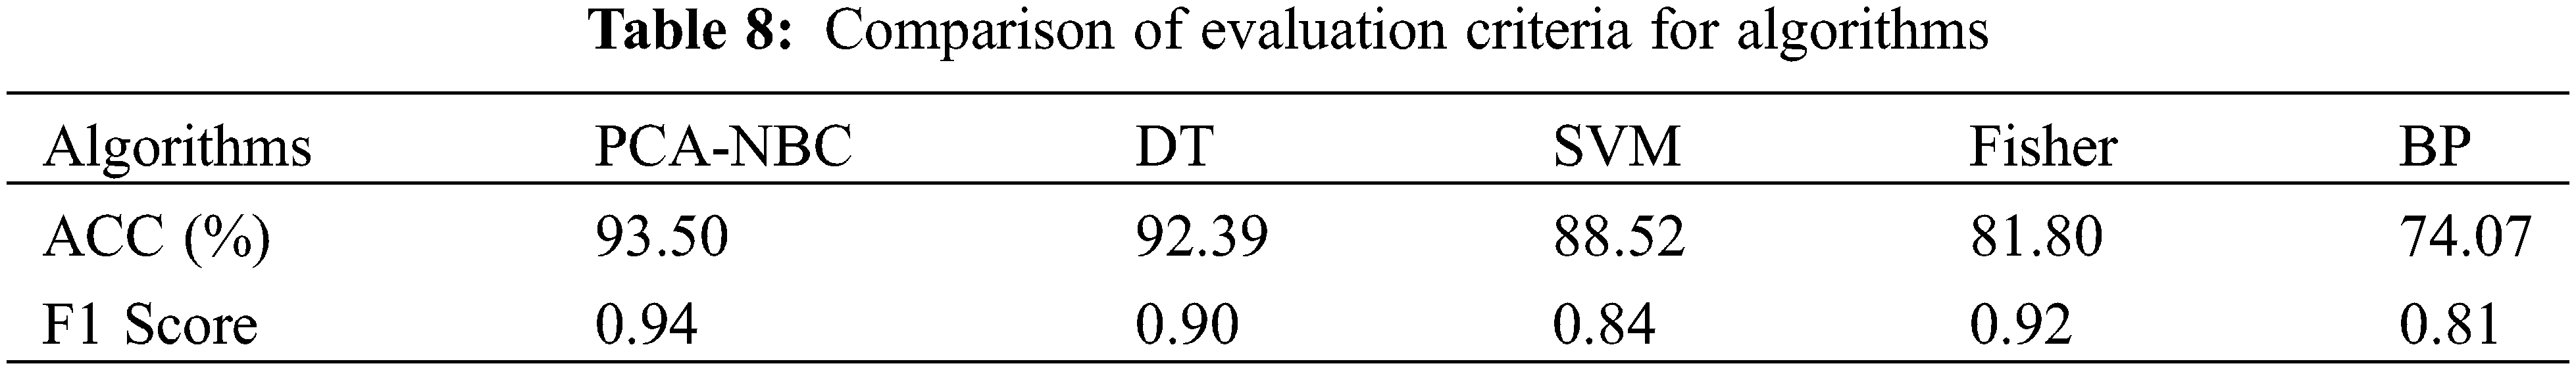
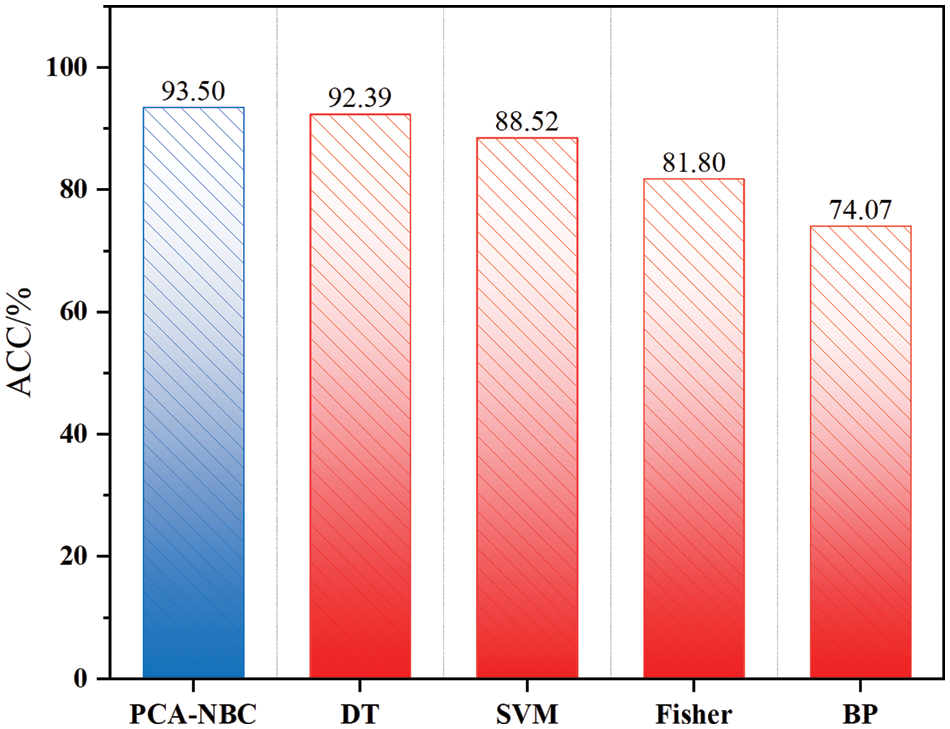
Figure 7: ACC comparison chart
The test results show that this method possesses high accuracy and is more applicable to the practical situation of this paper. Due to the limitations of the bridge data selected in this paper in terms of geography, sample size, and bridge type. The generalization ability of this method can be improved by appropriately adapting this method to other bridge data.
In order to further explore the relationship between bridge defects and the level of bridge technical condition, this paper plotted the variation of the percentage P of the defect variables for the three levels of bridges for the 30 defect variables after screening (Fig. 8). The similarities and differences among different classes of bridges in multiple defect variables can be clearly found through the images. In comparing these three levels of bridges, the changes in defects present in the superstructure and substructure were most pronounced, while the changes in defects in the bridge deck system showed similarity. This finding is consistent with the performance of the weights of the components of the TCEB, i.e., both the superstructure and substructure accounted for weight values greater than the weight values of the bridge deck system. Also, since this is an analysis of overall bridges and defects, the degree of influence of changes in individual variables differs somewhat from the correlation analysis above. For example, the V1-5 variable in the correlation analysis Person is 0.3. and in this figure, it can be seen that this variable has a greater variation in the category 2 bridge data than in the category 1 and 3 bridge data. There is some inconsistency between the two.
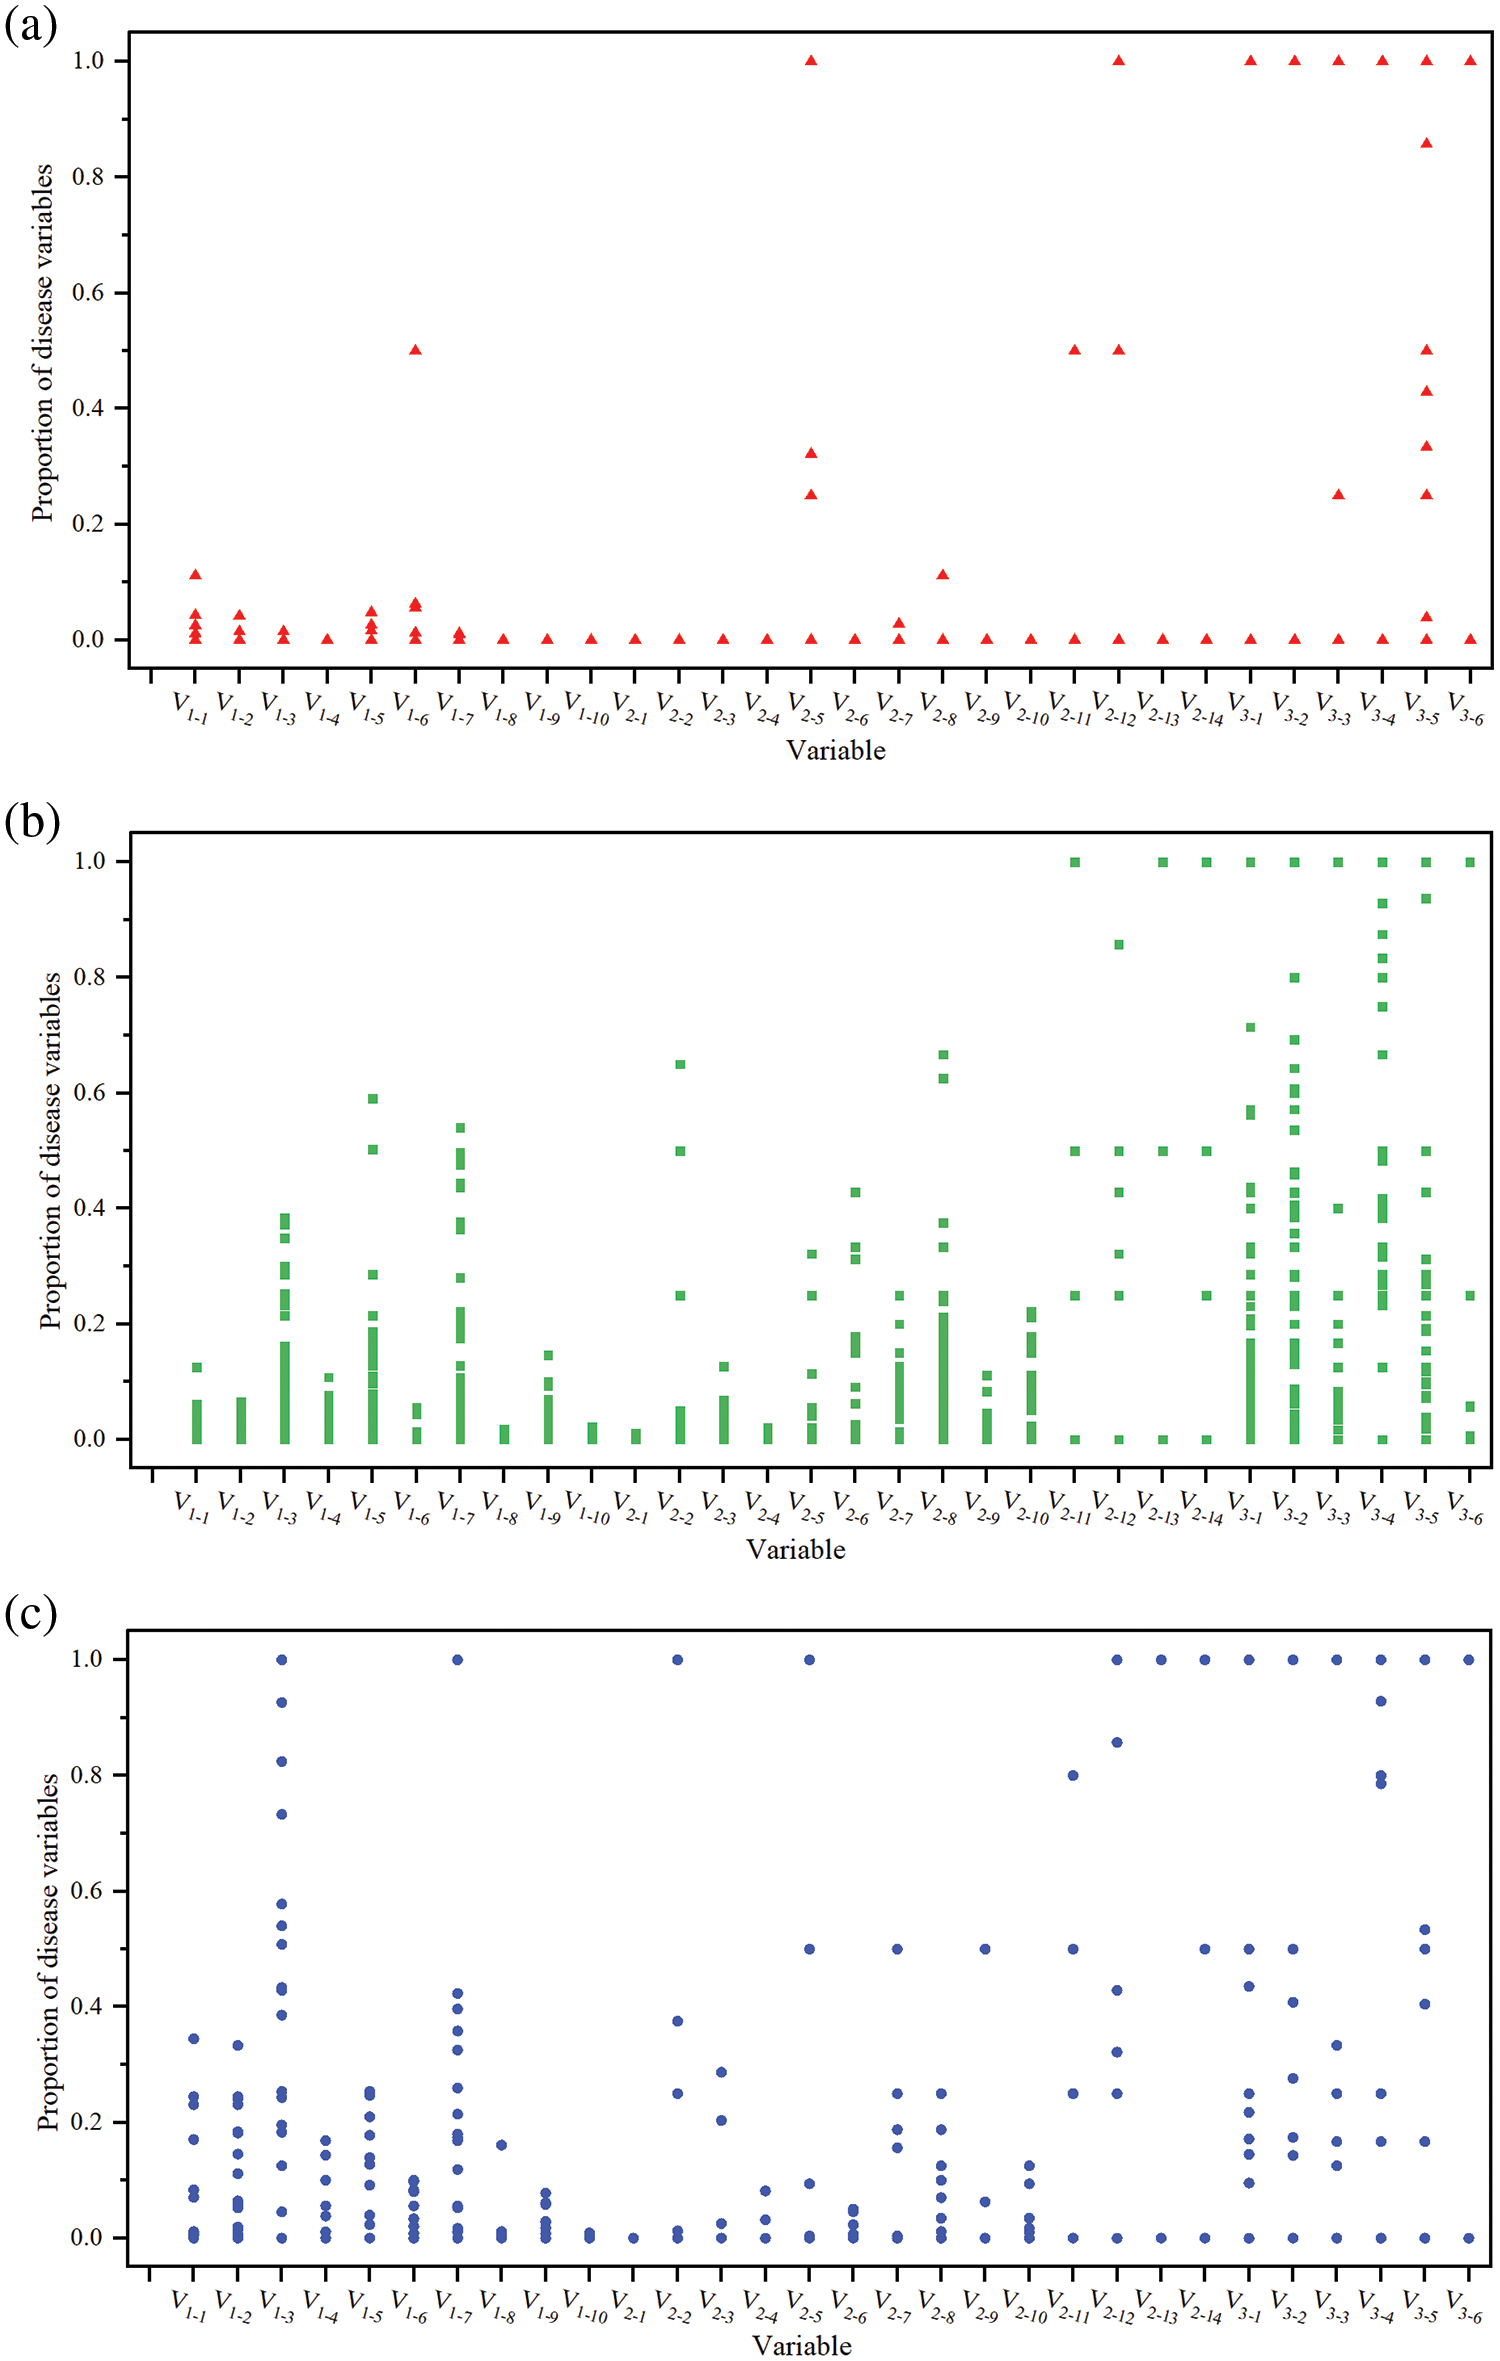
Figure 8: Plot of changes in defect variables for three levels of bridges. (a) Variation diagram of defect variables of Level 1 bridges. (b) Variation diagram of defect variables of Level 2 bridges. (c) Variation diagram of defect variables of Level 3 bridges
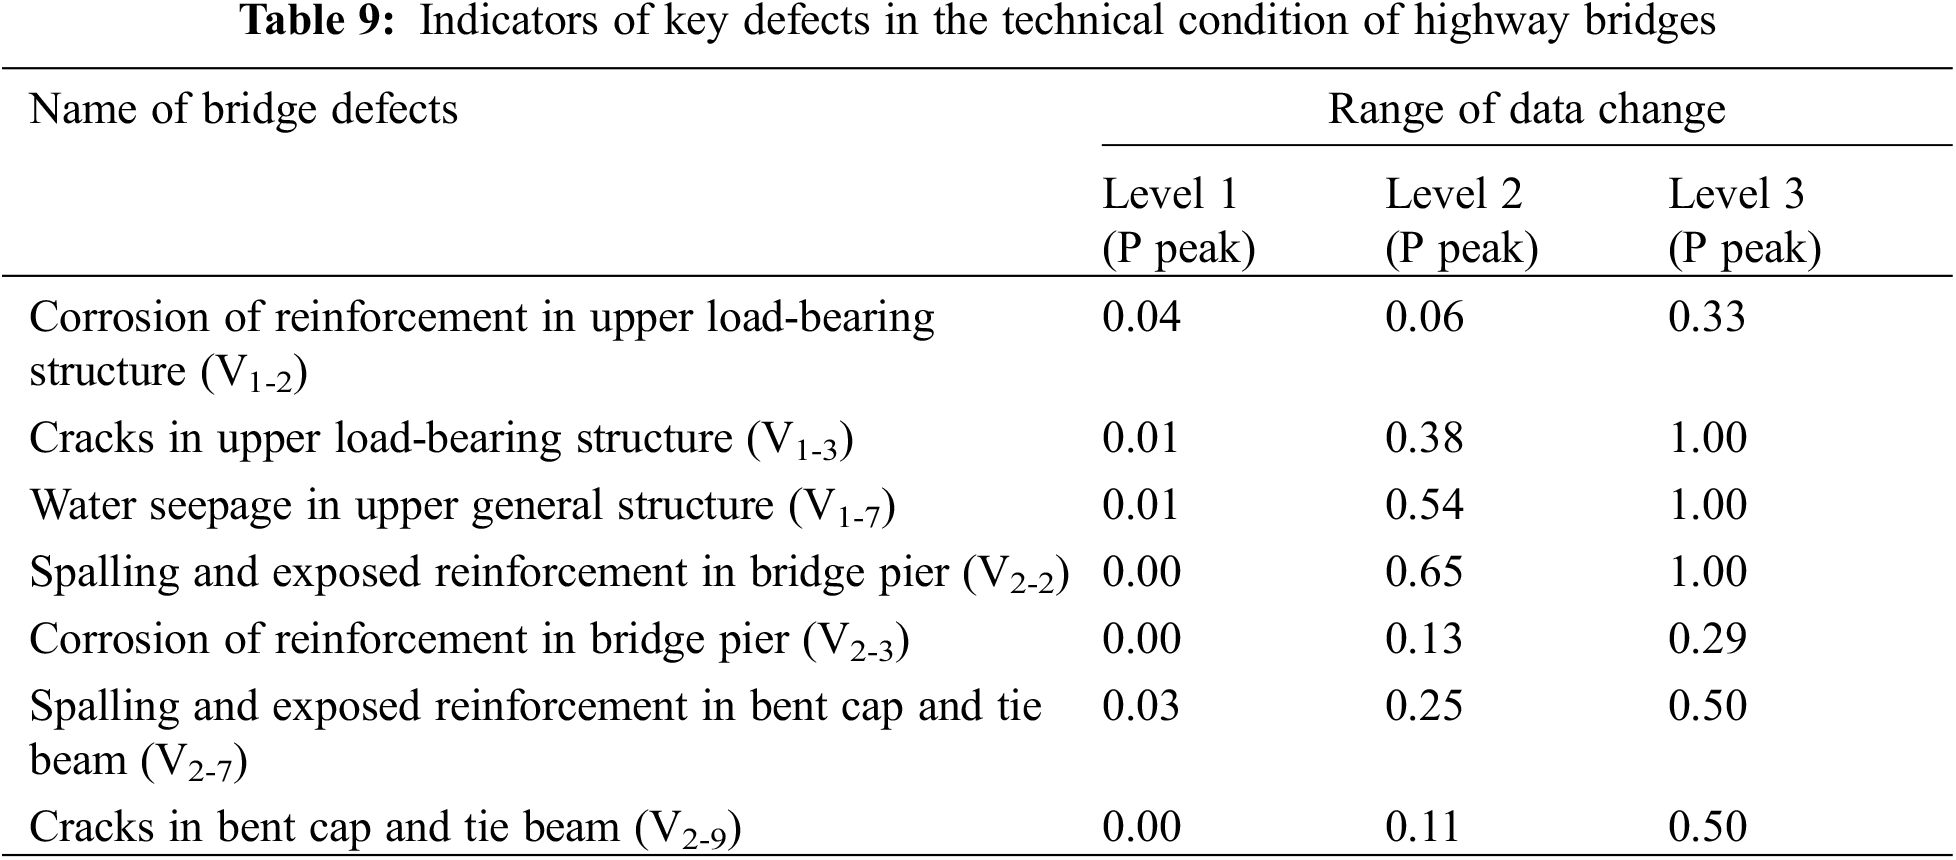
In summary, the defect variable V1-1, V1-2, V1-3, V1-4, V1-7, V1-8, V2-2, V2-3, V2-4, V2-7, and V2-9 have undergone significant changes, as shown in Fig. 8. Calculate the difference between the three levels based on the p-value of the variable in Fig. 9, and then take the average value. The priority bridge defect types with mean values greater than 0.19 were selected as V1-2, V1-3, V1-7, V2-2, V2-3, V2-7, and V2-9. Table 9 documents the variation in peak P values for these key defect variables across three levels. Clearly, high-risk defects are concentrated in the upper load-bearing structure, upper general structure, and bridge pier. Attention should be focused on issues such as cracks, water seepage, spalling, exposed reinforcement, and corrosion of reinforcement in these components. Furthermore, by utilizing the correlation between defects, it is possible to predict other potential issues and evaluate the overall technical condition of the bridge. In addition, in TCEB, water seepage defects are not included in the standard. However, water seepage defects have a greater impact on bridges in actual inspections, and further adjustments to the specifications are needed.
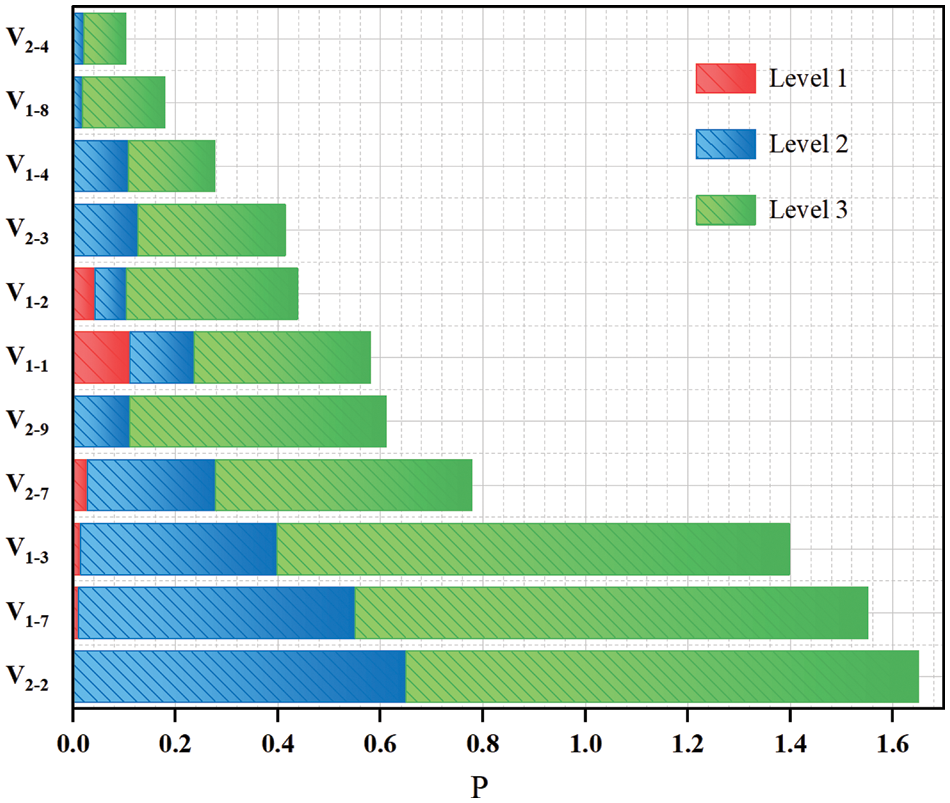
Figure 9: Comparison of extracted bridge defect variables
This study conducted a disease correlation analysis based on disease detection information and the technical condition level of more than 100 bridges. Subsequently, an intelligent diagnostic model for the technical condition of highway bridges, employing defect information, was established. The following conclusions were predominantly reached:
(1) Analysis of the correlation between defects and component levels reveals that the superstructure level exhibits the highest correlation with cracks. The number of components and defects in the substructure is high, and the degree of correlation between the existing defects is low. The level of the bridge deck system is highly correlated with cracks in the deck pavement. At the same time, it was found that the three types of defects in bridges, spalling, corrosion of reinforcement, and cracks, interact with each other, which is consistent with the actual causes and developmental patterns of bridge defects.
(2) Considering the large number and complex composition of bridge defect data, an intelligent diagnostic model for the technical condition of highway bridges using the PCA-NBC algorithm is proposed. Through the research and testing of the model, it is obtained that the accuracy of bridge category discrimination is 93.50% on average. And compared with DT, SVM, Fisher, and BP multiple algorithms, the highest improvement is 19.43%. And the F1 Score reaches 0.94. The model is more robust and works best for the actual situation of this paper. The method can assist bridge inspectors and even non-professionals to have a better understanding of bridge defect conditions.
(3) By plotting the variation of the defect variables for the three levels of bridges, the key defect variables affecting the change in the level of the bridges were obtained. Namely, cracks and corrosion of reinforcement in the upper load-bearing structure; water seepage in the upper general structure; spalling, exposed reinforcement and corrosion of reinforcement in the bridge pier; spalling, exposed reinforcement, and cracks in bent cap and tie beam. This needs to be focused on by bridge inspectors and also helps in the initial determination of the technical condition level of the bridge.
(4) The bridge technical condition level discrimination model proposed in this paper has some limitations in terms of sample size, geographical area, bridge type, and bridge category. When other bridge data are substituted, the results may have a slight bias. Therefore, adjustments need to be made to the model to address the research errors stemming from data variability.
Acknowledgement: None.
Funding Statement: This research was financially supported by the National Natural Science Foundation of China (No. 51808301), the Scientific Research Fund of Zhejiang Provincial Education Department (No. Y202248860), and the National “111” Centre on Safety and Intelligent Operation of Sea Bridge (D21013).
Author Contributions: Study conception and design: Yanxue Ma, Xiaoling Liu; data collection: Bing Wang; analysis and interpretation of results: Ying Liu, Yanxue Ma, Xiaoling Liu; draft manuscript preparation: Xiaoling Liu, Yanxue Ma. All authors reviewed the results and approved the final version of the manuscript.
Availability of Data and Materials: Most data and models generated and used during the study appear in the published article. However, some information is proprietary or confidential in nature and may only be provided with restrictions (e.g., bridge defect data).
Ethics Approval: Not applicable.
Conflicts of Interest: The authors declare that they have no conflicts of interest to report regarding the present study.
References
1. Ge Z, Song Z, Ding SX, Huang B. Data mining and analytics in the process industry: the role of machine learning. IEEE Access. 2017;5:20590–616. [Google Scholar]
2. Alqahtani A, Ullah Khan H, Alsubai S, Sha M, Almadhor A, Iqbal T, et al. An efficient approach for textual data classification using deep learning. Front Comput Neurosci. 2022;16:992296. [Google Scholar] [PubMed]
3. Koseler K, Stephan M. Machine learning applications in baseball: a systematic literature review. Appl Artif Intell. 2017;31(9–10):745–63. [Google Scholar]
4. Nguyen TTS, Do PMT. Classification optimization for training a large dataset with Naïve Bayes. J Comb Optim. 2020;40(1):141–69. [Google Scholar]
5. Yang Y, Nan F, Yang P. Effective multilayer hybrid classification approach for automatic bridge health assessment on large-scale uncertain data. J Ind Inf Integr. 2021;24:100234. [Google Scholar]
6. Bektas BA, Carriquiry A, Smadi O. Using classification trees for predicting national bridge inventory condition ratings. J Infrastruct Syst. 2013;19(4):425–33. doi:10.1061/(ASCE)IS.1943-555X.0000143. [Google Scholar] [CrossRef]
7. Chung S, Lim S, Chi S. Developing an estimation model for safety rating of road bridges using rule-based classification method. J KIBIM. 2016;6(2):29–38. doi:10.13161/kibim.2016.6.2.029. [Google Scholar] [CrossRef]
8. Martinez P, Mohamed E, Mohsen O, Mohamed Y. Comparative study of data mining models for prediction of bridge future conditions. J Perform Constr Facil. 2020;34(1):04019108. doi:10.1061/(ASCE)CF.1943-5509.0001395. [Google Scholar] [CrossRef]
9. Feng CW, Huang HY. Hybridization of finite-element method and support vector machine to determine scour bridge safety level. J Perform Constr Facil. 2015;29(3):04014079. doi:10.1061/(ASCE)CF.1943-5509.0000505. [Google Scholar] [CrossRef]
10. Mokalled S, Locke W, Abuodeh O, Redmond L, McMahan C. Drive-by health monitoring of highway bridges using Bayesian estimation technique for damage classification. Struct Control Health Monit. 2022;29(6):e2944. doi:10.1002/stc.2944. [Google Scholar] [CrossRef]
11. Mangalathu S, Jeon JS. Machine learning-based failure mode recognition of circular reinforced concrete bridge columns: comparative study. J Struct Eng. 2019;145(10):04019104. [Google Scholar]
12. Jootoo A, Lattanzi D. Bridge type classification: supervised learning on a modified NBI data set. J Comput Civ Eng. 2017;31(6):04017063. [Google Scholar]
13. Hu S, Shao K, Liu X, Ma Z, Chen B. Predictions and evolution characteristics of failure modes of degenerate RC piers. Buildings. 2023;13(1):113. [Google Scholar]
14. Zhang Y, Liu X, Liu C, Li Y, Zheng Y. Reliability assessment of the existing concrete bridge deck system based on the multi-index multilevel extension assessment. J Highway Transport Res Dev. 2016;10(3):26–33. [Google Scholar]
15. Li GZ, He Z, Shao FF, Ou AH, Lin XZ. Patient classification of hypertension in traditional Chinese medicine using multi-label learning techniques. BMC Med Genomics. 2015;8(3):1–6. [Google Scholar]
16. Chen F, Zhang NL, Chen BX, Chen ZR, Jin XL, Guo RJ, et al. Identification and classification of traditional Chinese medicine syndrome types among senior patients with vascular mild cognitive impairment using latent tree analysis. J Integr Med. 2017;15(3):186–200. doi:10.1016/S2095-4964(17)60335-2. [Google Scholar] [PubMed] [CrossRef]
17. Dong Y, Li Z, Chen Z, Xu Y, Zhang Y. Breast cancer classification application based on QGA-SVM. J Intell Fuzzy Syst. 2023;44(4):5559–71. [Google Scholar]
18. Donghia R, Guerra V, Misciagna G, Loiacono C, Brunetti A, Bevilacqua V. Prediction of gastrointestinal cancers in the ONCONUT cohort study: comparison between logistic regression and artificial neural network. Front Oncol. 2023;13:1110999. doi:10.3389/fonc.2023.1110999. [Google Scholar] [PubMed] [CrossRef]
19. Zeng Y, Cheng F. Medical and health data classification method based on machine learning. J Healthc Eng. 2021;(12):2722854. doi:10.1155/2021/2722854. [Google Scholar] [PubMed] [CrossRef]
20. Hameed K, Chai D, Rassau A. A comprehensive review of fruit and vegetable classification techniques. Image Vis Comput. 2018;80(1):24–44. doi:10.1016/j.imavis.2018.09.016. [Google Scholar] [CrossRef]
21. Gupta O, Das AJ, Hellerstein J, Raskar R. Machine learning approaches for large scale classification of produce. Sci Rep. 2018;8(1):5226. [Google Scholar] [PubMed]
22. Yasmeen U, Khan MA, Tariq U, Khan JA, Yar MAE, Hanif CA, et al. Citrus diseases recognition using deep improved genetic algorithm. Comput Mater Contin. 2021;71:3667–84. doi:10.32604/cmc.2022.022264. [Google Scholar] [CrossRef]
23. Gupta S, Tripathi AK. Fruit and vegetable disease detection and classification: recent trends, challenges, and future opportunities. Eng Appl Artif Intell. 2024;133:108260. [Google Scholar]
24. Chen S, Webb GI, Liu L, Ma X. A novel selective naïve Bayes algorithm. Knowl-Based Syst. 2020;192:105361. [Google Scholar]
25. Wang S, Ren J, Bai R. A regularized attribute weighting framework for naive Bayes. IEEE Access. 2020;8:225639–49. [Google Scholar]
26. Wang S, Ren J, Bai R. A semi-supervised adaptive discriminative discretization method improving discrimination power of regularized naive Bayes. Expert Syst Appl. 2023;225(1):120094. doi:10.1016/j.eswa.2023.120094. [Google Scholar] [CrossRef]
27. Wu Q, Wu B, Hu C, Yan X. Evolutionary multilabel classification algorithm based on cultural algorithm. Symmetry. 2021;13(2):322. doi:10.3390/sym13020322. [Google Scholar] [CrossRef]
28. Zhang H, Jiang L, Yu L. Attribute and instance weighted naive Bayes. Pattern Recognit. 2021;111(2–3):107674. doi:10.1016/j.patcog.2020.107674. [Google Scholar] [CrossRef]
29. Wang Y, Huang Y, Yang K, Chen Z, Luo C. Generator fault classification method based on multi-source information fusion Naive Bayes classification algorithm. Energies. 2022;15(24):9635. doi:10.3390/en15249635. [Google Scholar] [CrossRef]
30. JTG/T H21-2011. Standards for technical condition evaluation of highway bridges. Beijing, China: China Communication Press; 2011. [Google Scholar]
Cite This Article
 Copyright © 2024 The Author(s). Published by Tech Science Press.
This work is licensed under a Creative Commons Attribution 4.0 International License , which permits unrestricted use, distribution, and reproduction in any medium, provided the original work is properly cited.
 Downloads
 Citation Tools