
 Submit a Paper
 Propose a Special lssue
 Open Access
ARTICLE

Numerical Simulation-Based Analysis of the Impact of Overloading on Segmentally Assembled Bridges
1 Shanghai Urban Construction and Maintenance Management Co., Ltd., Shanghai, 200023, China
2 School of Water Conservancy and Transportation, Zhengzhou University, Zhengzhou, 450001, China
* Corresponding Authors: Yingchun Cai. Email: ; Pan Guo. Email:
(This article belongs to the Special Issue: Health Monitoring and Rapid Evaluation of Infrastructures)
Structural Durability & Health Monitoring 2024, 18(5), 663-681. https://doi.org/10.32604/sdhm.2024.052677
Received 11 January 2024; Accepted 16 April 2024; Issue published 19 July 2024
 View Full Text
 Download PDF
Abstract
Segmentally assembled bridges are increasingly finding engineering applications in recent years due to their unique advantages, especially as urban viaducts. Vehicle loads are one of the most important variable loads acting on bridge structures. Accordingly, the influence of overloaded vehicles on existing assembled bridge structures is an urgent concern at present. This paper establishes the finite element model of the segmentally assembled bridge based on ABAQUS software and analyzes the influence of vehicle overload on an assembled girder bridge structure. First, a finite element model corresponding to the target bridge is established based on ABAQUS software, and the load is controlled to simulate vehicle movement in each area of the traveling zone at different times. Second, the key cross-sections of segmental girder bridges are monitored in real time based on the force characteristics of continuous girder bridges, and they are compared with the simulation results. Finally, a material damage ontology model is introduced, and the structural damage caused by different overloading rates is compared and analyzed. Results show that the finite element modeling method is accurate by comparing with on-site measured data, and it is suitable for the numerical simulation of segmental girder bridges; Dynamic sensors installed at 1/4L, 1/2L, and 3/4L of the segmental girder main beams could be used to identify the dynamic response of segmental girder bridges; The bottom plate of the segmental girder bridge is mostly damaged at the position where the length of the precast beam section changes and the midspan position. With the increase in load, damage in the direction of the bridge develops faster than that in the direction of the transverse bridge. The findings of this study can guide maintenance departments in the management and maintenance of bridges and vehicles.Keywords
The transport industry has boomed with the rapid development of China’s economy. Bridges are an important part of the transport lifeline, and the volume of traffic in urban bridges is increasing. Naturally, such bridge structures suffer damage [1] and have defects [2]. With the increase in service life, the bridge structure gradually deteriorates and the bearing capacity decreases, which may eventually lead to major collapse and other accidents [3]. According to data reports, China has built millions of bridges to date, more than one-tenth of which are at risk due to many large and medium-sized trucks choosing to overload to reduce the cost of transport. This imposes excessive loads on the bridge, which results in steel reinforcement corrosion and concrete cracking, among other problems. This increases the repair and maintenance costs as well as the costs of later projects [4,5].
A segmental prefabricated assembled girder bridge divides the main girder into several segmental components along the longitudinal direction. It is prefabricated and matched in the factory then assembled and installed at the site. Finally, the bridge structure is completed by tensioning the prestressing tendons. This method has emerged as one of the important forms of industrialized bridge construction due to its high construction efficiency, controllable quality, wide span adaptability, and economy and environment-friendliness [6,7]. With the continuous development of segmental prefabricated assembled girder bridges in recent years, different countries have successively issued corresponding technical standards and specification provisions, including the United States, Germany, Spain, Japan, and China. Due to the discontinuity of the joints of segmental assembled bridges and the nonbonding characteristics of external prestressing beams, their mechanical properties are more complicated than those of integral girder bridges [8,9].
Comparing the changes in the structural parameters of a bridge during vehicle movement reveals the impact of overloaded vehicles on bridge structures, which include modal parameters [10,11], strain [12,13], deflection [14], and stiffness [15]. Li et al. [16] used the strain data from a structural health monitoring system installed on a bridge and the wavelet transform to identify the abnormal signals caused by overloaded vehicles crossing the bridge. Cury et al. [17], through long-term monitoring of modal frequencies of bridge vibration and temperature, developed a neural network-based model to quantify the relationship between temperature and modal parameters and used it to monitor and evaluate the effects of overloaded vehicles on the stiffness changes of box girder bridges before and after reinforcement. Li et al. [18] developed a method for evaluating the fatigue of a reinforced concrete girder bridge connection structure based on the linear cumulative damage criterion and considered the differences in the effects of overload models on the fatigue life of bridge members by calculating the fatigue damage. Nguyen et al. [19] repeated static load tests using a portion of a real girder, followed by the application of gradual artificial damage. Load–deflection curves were then obtained using numerous displacement transducers to effectively evaluate the actual response of overloaded vehicles on bridges. Liu et al. [20] used the rigid beam method to calculate the axle weight distribution of statistical vehicles, derive the relationship between the vehicle overload rate and fatigue damage of simply supported girder bridges, and propose a method for calculating the fatigue damage of simply supported girder bridges under the action of overloaded vehicles. Aloisio et al. [21] proposed the use of an instrument vehicle with a swinging pendulum and a laser sensor to evaluate the actual response of a concrete bridge under overload. This involved analyzing the correlation function between the displacement response of a single pendulum and a numerical simulation through the excitation effect between road roughness and a moving load. Zhao [22] established a model of the hypothetical interaction between a girder bridge and a vehicle by considering the influence of a moving overloaded vehicle on the vibration response of simply supported girder bridges. They then identified the coefficient response relationship under different truck overload conditions through a dynamic response analysis of the deflection between spans.
In summary, while the current research has focused on the simple supported beam bridge and continuous beam bridge, a systematic analysis of the overload in segment-beam bridge is still lacking. Likewise, the conventional methods of bridge overload evaluation are costly in terms of material resources and manpower, and defects that cannot be quickly detected and evaluated persist.
To solve these problems, a segmental viaduct project is selected to study the effect of vehicle overload on the structure of segmentally assembled bridges through ABAQUS software. First, a typical segmental girder bridge is selected to establish the corresponding finite element model, and the traveling zones on the bridge model are divided according to the actual parameters of the vehicle. Second, the key sections of the target bridge are monitored in real time, and the dynamic strain response values under vehicle loading are analyzed and compared with the simulation results. Finally, the material damage principal model is introduced. The structural damage effects of overloaded vehicles at different overloading rates on the bridge are discussed based on the finite element model to derive the load limit indexes that minimize the damage to the bridge and the damage extension law of the bridge base plate.
2 Introduction to the Case Model
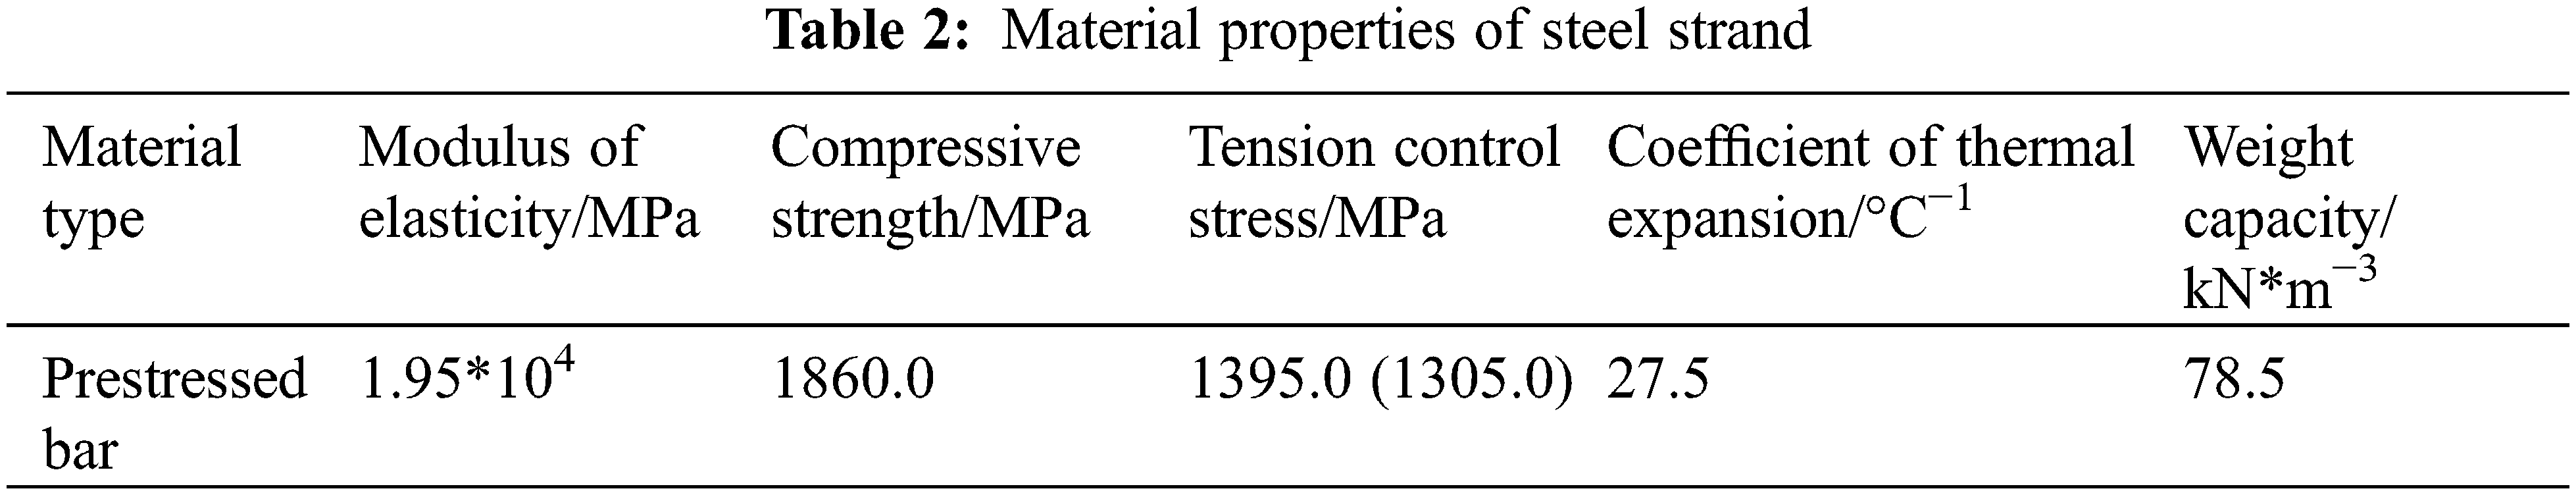
A typical one-link segmental assembled bridge was selected as the target bridge, as shown in Fig. 1. The bridge is a three-span continuous girder, and both the side and middle spans are 43 m long. The bridge has a design load rating of City-A, and the link is made of prestressed concrete with a uniform cross-section. The bridge is a single-box single-compartment segmental assembled girder bridge, and the layout is shown in Fig. 2. The section of the main girder middle pier and side pier top 0 block is cast-in-place, and the middle span and side span are composed of 14 precast blocks made of C60 concrete precast. Moreover, the length of the suspended prefabricated assembled section is 2.9 and 2.4 m, for the middle and side spans, respectively. Notably, 15 cm wet joints are set between the top of the pier No. 0 block and the prefabricated section, and the same grade of concrete is used for cast-in-place in the midspan closing section. The main girder adopts a single box and single chamber prestressed concrete box girder with an inclined web positioned at the same beam height. The top slab has a 2% unidirectional slope, the width of the single box girder is 16.5 m, width of the bottom slab is 2.8 m, length of the overhanging hip is 4.0 m, and height of the box girder is 2.2 m. Meanwhile, the box girder adopts a longitudinal and transversal bi-directional prestressing system, and the design in the longitudinal direction is based on full prestressing. Similarly, the transversal direction design was based on class B prestressing. Finally, the joints are made of epoxy resin and close-coated key teeth.
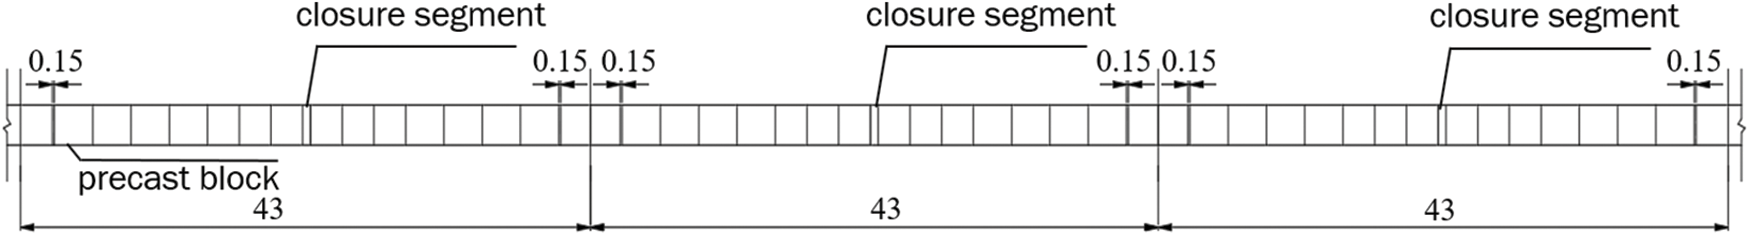
Figure 1: General layout (unit: m)
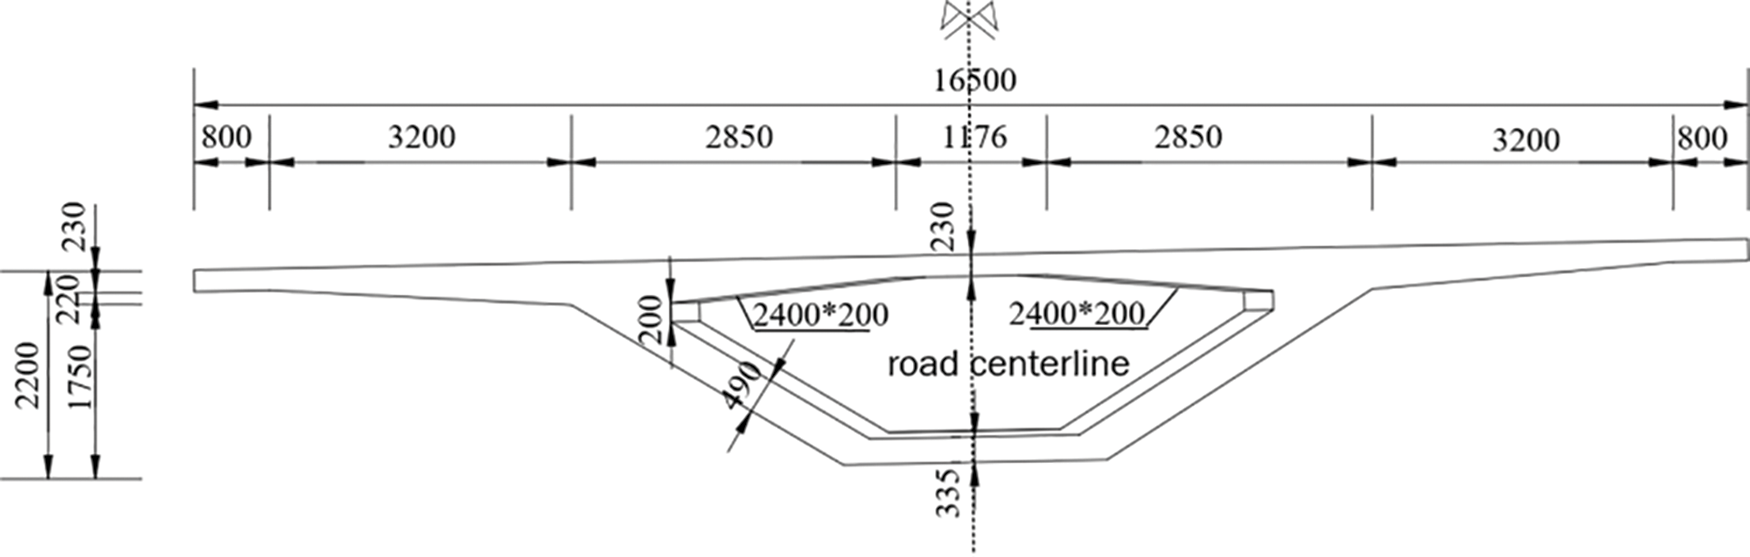
Figure 2: 1/2 span cross-sectional arrangement (unit: mm)
2.2 Simulation of Key Components and Materials
The finite element model of the whole segmental assembled girder bridge for the target bridge in Section 2.1 was established using ABAQUS software. The main girder and prestressed tendon were modeled using C3D8R and T3D2 elements, respectively [23]. Structured meshing was adopted for the mesh type, but the complexity of the finite element model prevents it from being directly meshed. Therefore, some irregular areas of the model were divided using a partition tool, and grid division was performed to obtain a better grid. Ultimately, a total of 301820 nodes were set up in the whole bridge, and 204635 units were divided. The finite element mesh model of the local box girder is shown in Fig. 3.
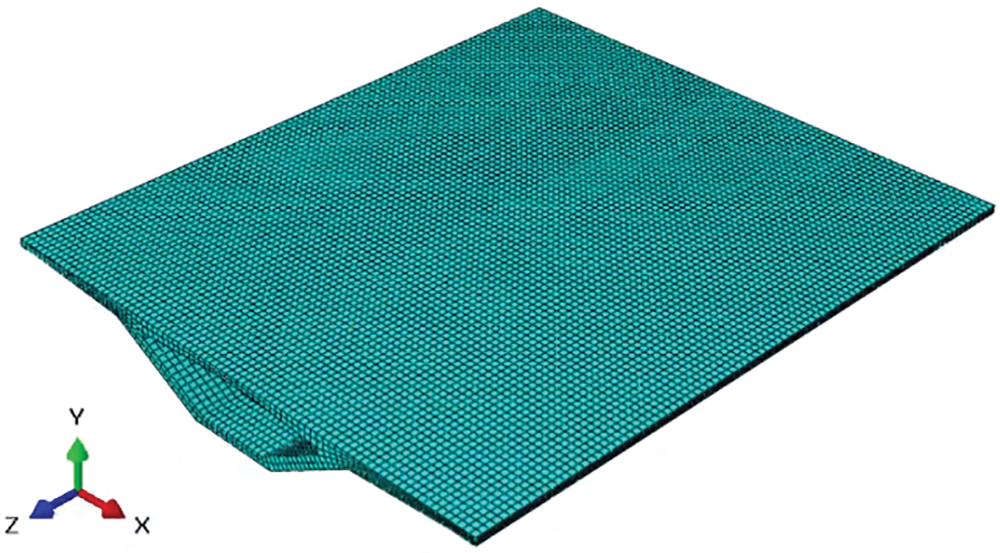
Figure 3: Local box girder finite element mesh model
The prestressing force was applied via the cooling method; specifically, the relevant temperature field changes in the model were applied to the prestressing tendons such that they contract to form temperature stresses when cooled [24], as shown in Eq. (1).
where,
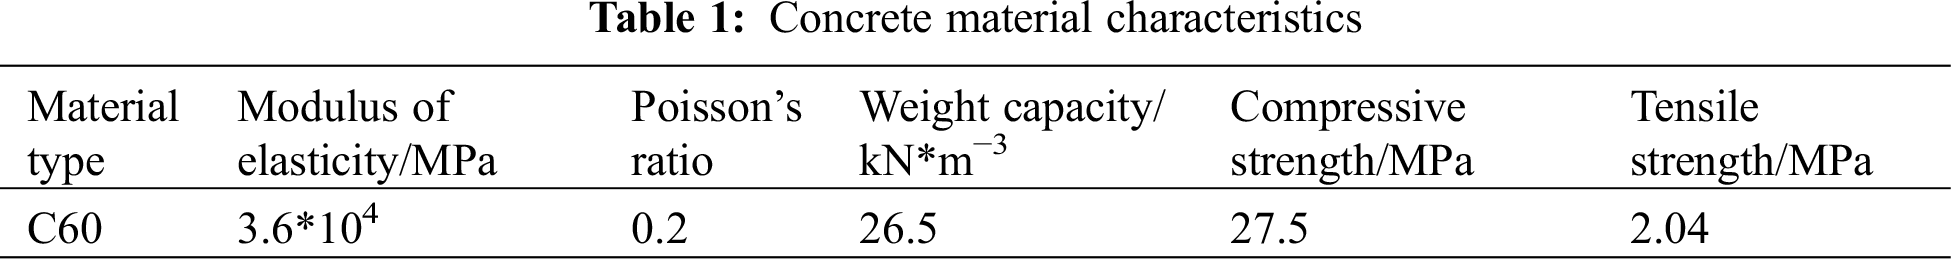
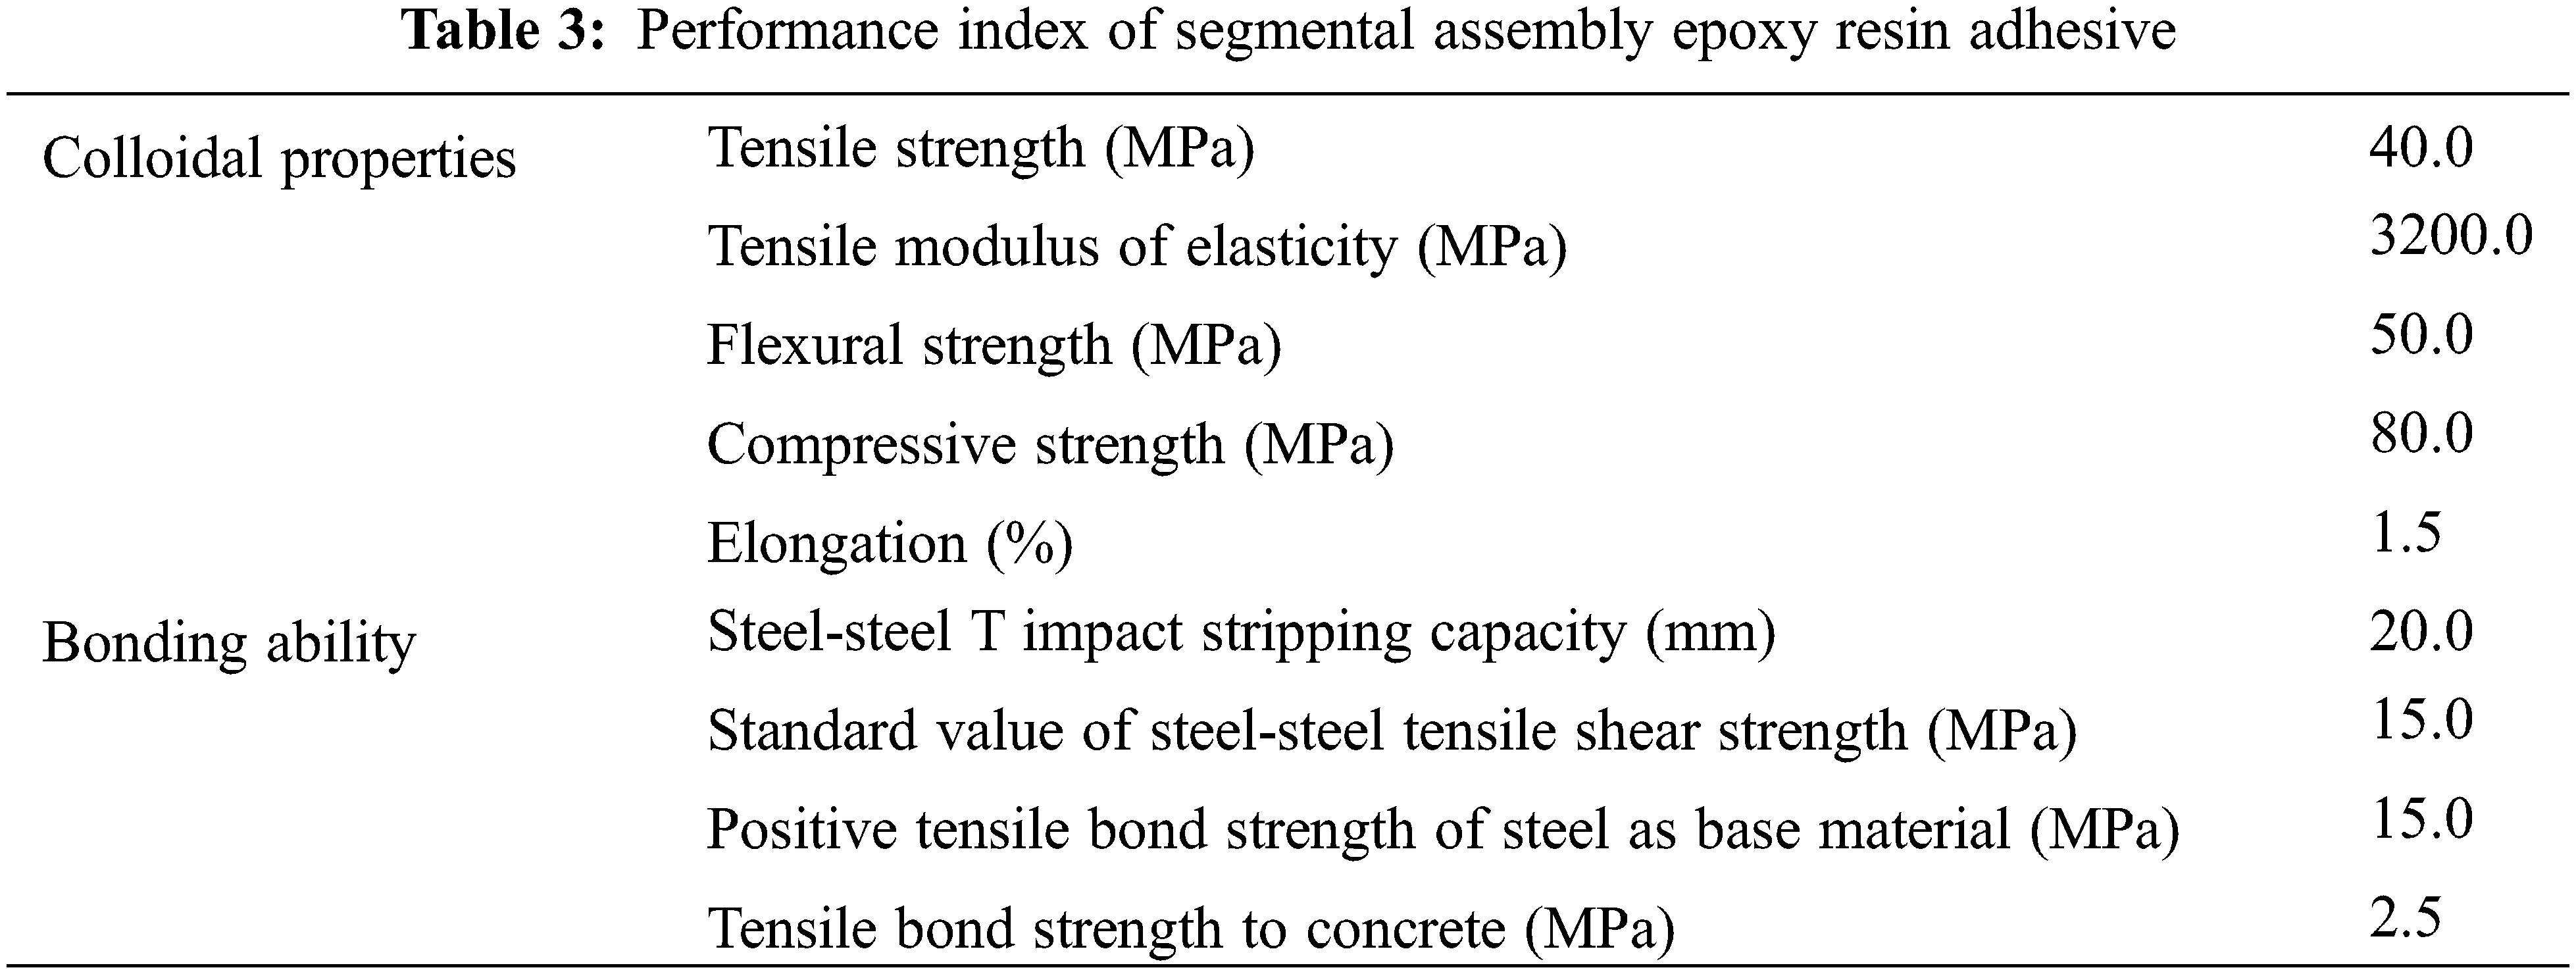
The location of the glued joints was modeled by applying a locally cohesive finite element method with finite interface thickness [25]. To simulate the gluing behavior between beam segments, the cohesive unit was individually placed on the connecting surfaces of each prefabricated segment for a minute length, considering the corresponding epoxy resin material properties. The thickness of the cohesive unit in this paper was selected as 1 mm based on the relevant target bridge design data, and the remaining material parameters are listed in Tables 1–3.
2.3 Interaction of Prestressing Tendons with Concrete
Considering the convergence of the calculation and the calculation efficiency, the embedded unit technique in the interaction module of ABAQUS was used to simulate the interaction between prestressing tendons and concrete, as shown in Fig. 4 [26]. This study used the embedded unit technique to simulate the interaction between prestressing tendons and concrete. The prestressing tendon truss units of the whole system were combined into one set, namely the embedded region, with the concrete units of the girder serving as the main region. When embedded interaction is adopted, the program automatically searches for the geometrical relationship between the steel truss unit and the concrete unit. Additionally, the steel truss unit, as a built-in embedded unit, is constrained by its advective degree of freedom to become an embedded node. The translational degrees of freedom of the steel joist unit as a built-in embedded unit were constrained and became an embedded node. The translational degrees of freedom of the steel joist unit were obtained by interpolating the degrees of freedom of the corresponding body unit in the body region.
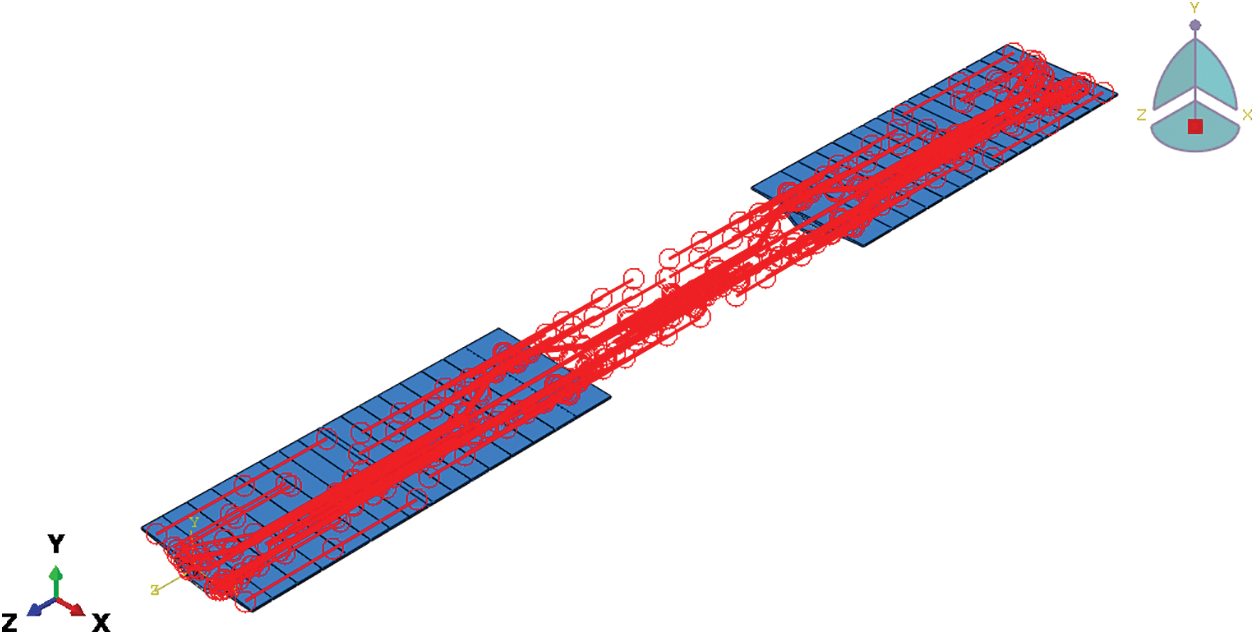
Figure 4: Schematic diagram of prestressed reinforcement built into concrete
The segmental assembled beam section in this study belongs to the structure of three spans and one link, so the part of the bottom surface of the No. 0 cast-in-place block in the middle span in contact with the pier was consolidated. Accordingly, the full constraint was executed; that is, the degrees of freedom in each direction of the region were constrained to simulate the actual situation. The remaining supports were configured as one-way movable supports, which constrain the displacement in the x and y direction and the rotation in the x and z direction [27]. Fig. 5 shows the three-dimensional model of the whole bridge.
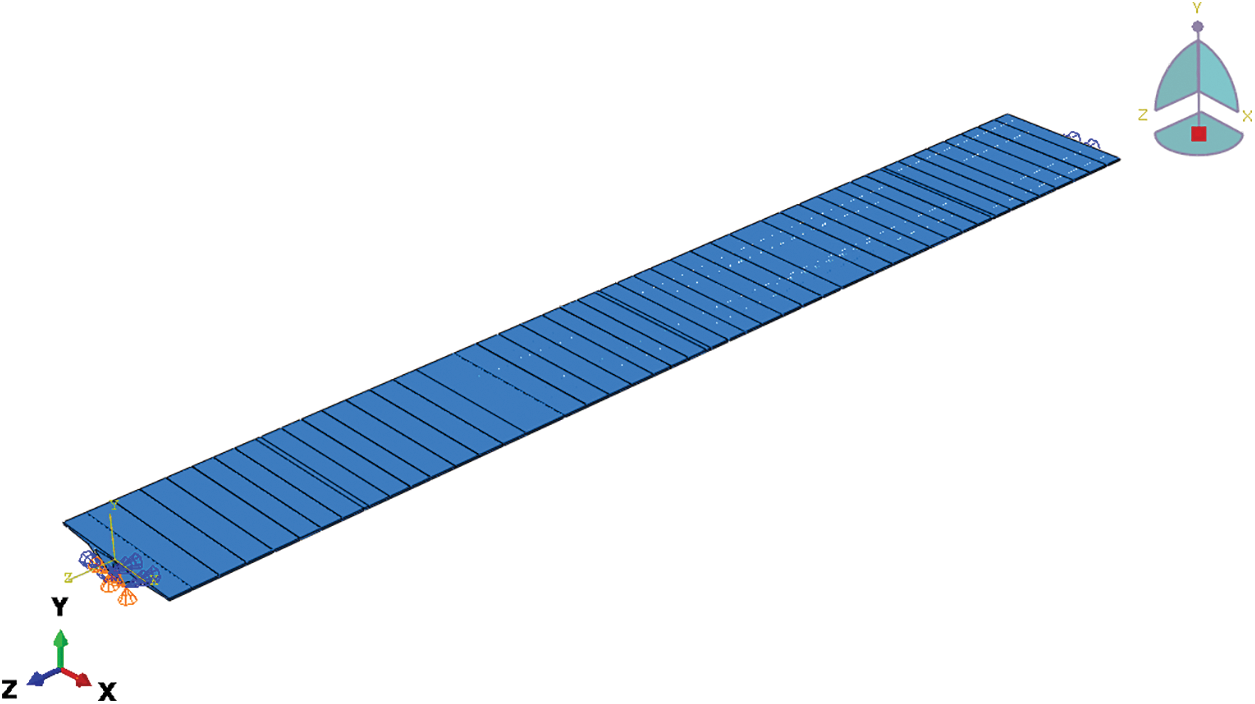
Figure 5: Finite element model of segment-assembled bridge
First, based on the specification of highway bridges, a four-lane driving band was established on the bridge model along the direction of vehicle driving as the driving path of the vehicle. Additionally, the driving band was equally divided into numerous small rectangles according to the longitudinal tire sizes, with each rectangle being equal to the tire sizes, as shown in Fig. 6. Second, each tire of the heavy vehicle, as a circular load, was equivalent to a rectangular load distributed on the driving band. Considering the driving effect of the vehicle, the vehicle load was treated as moving a rectangular unit distance in the driving direction after each incremental step in time length.
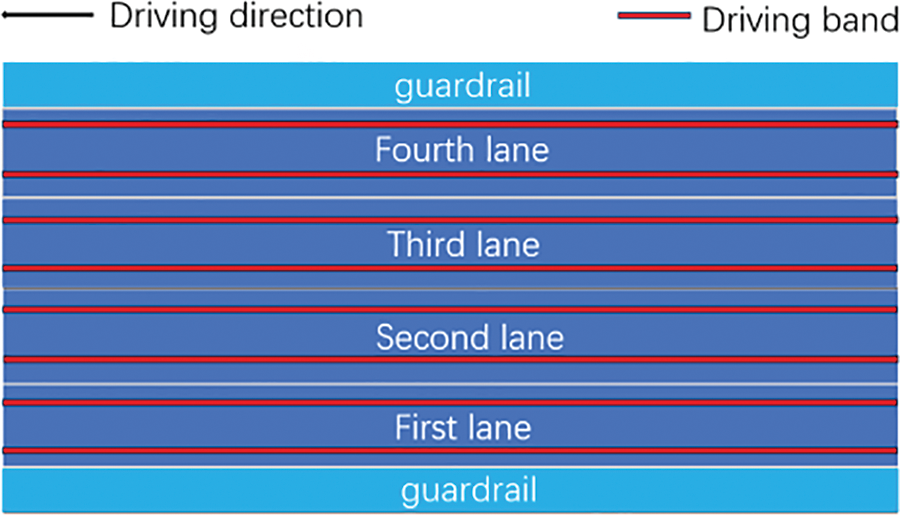
Figure 6: Four-lane driving band diagram
Taking a heavy truck weighing 300 kN as an example, the load of each tire of the heavy truck was first distributed in a rectangular area. At the end of each incremental step, these loads move forward by a rectangular distance, simulating the driving effect of the vehicle, as shown in Fig. 7. In this example, the total length of the bridge was 129 m, and the tire dimensions were 0.3 m × 0.2 m. The initial speed of the vehicle was 15 m/s. According to the longitudinal tire size of the vehicle, the driving band was divided into 645 rectangular areas, and the time required for the wheels to pass through each rectangular area was related to the speed of the vehicle, which is 0.013 s. That is, the analytical step length of each load moving one unit along the direction of travel was 0.013 m. Therefore, the total analysis step time after passing through the whole bridge was 8.6 s.
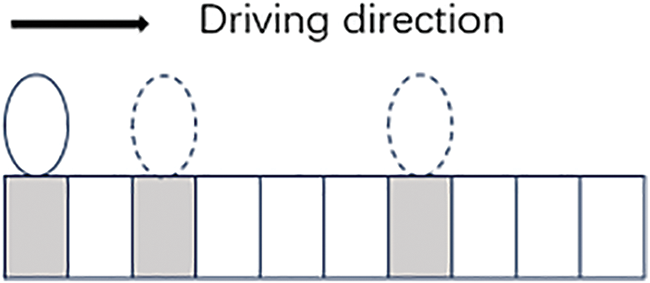
Figure 7: Load movement diagram
Generally, the moving load of a car can be reduced to a uniformly moving concentrated load [27]. In this paper, the movement of the vehicle on the model was realized through the DLOAD interface using ABAQUS. Simultaneously, according to the specific vehicle parameters, the subroutine’s internal function time, traveling speed V, and vehicle load F were written and adjusted using the Fortran language to realize the various forms of the vehicle’s load action [28].
The reasonableness of the model in this paper was verified by monitoring the target bridge under on-site vehicle loads. The target bridge in this study had 12 glued joints per span and 36 joints in the whole bridge. As studying each joint would be tedious, only the critical cross-section was considered. According to the stress characteristics of continuous girder bridges, the maximum positive moment and maximum vertical displacement are generated midspan in this bridge section, and the maximum negative moment and shear stress are generated near the pivot of the main pier. Therefore, considering the site environment and other factors, a total of five sections in the 1/2 gider section, 1/4 girder section, and 1/8 girder section adjacent to the joints were selected as monitoring and control sections.
Because the traveling direction of the target bridge is from south to north, the strain gauges at the south and north sections of the bridge were designated as the head and tail end, respectively. The five control sections along the direction of the vehicle were labeled A–E in turn, and six strain measurement points ere arranged in each section. Fig. 8 depicts the layout of the strain measurement point of the midspan section, and the strain measurement points and naming methods of the other cross-sections are consistent with the layout form of the midspan cross-section.

Figure 8: 1/2 span section (C-section) strain measuring point layout diagram
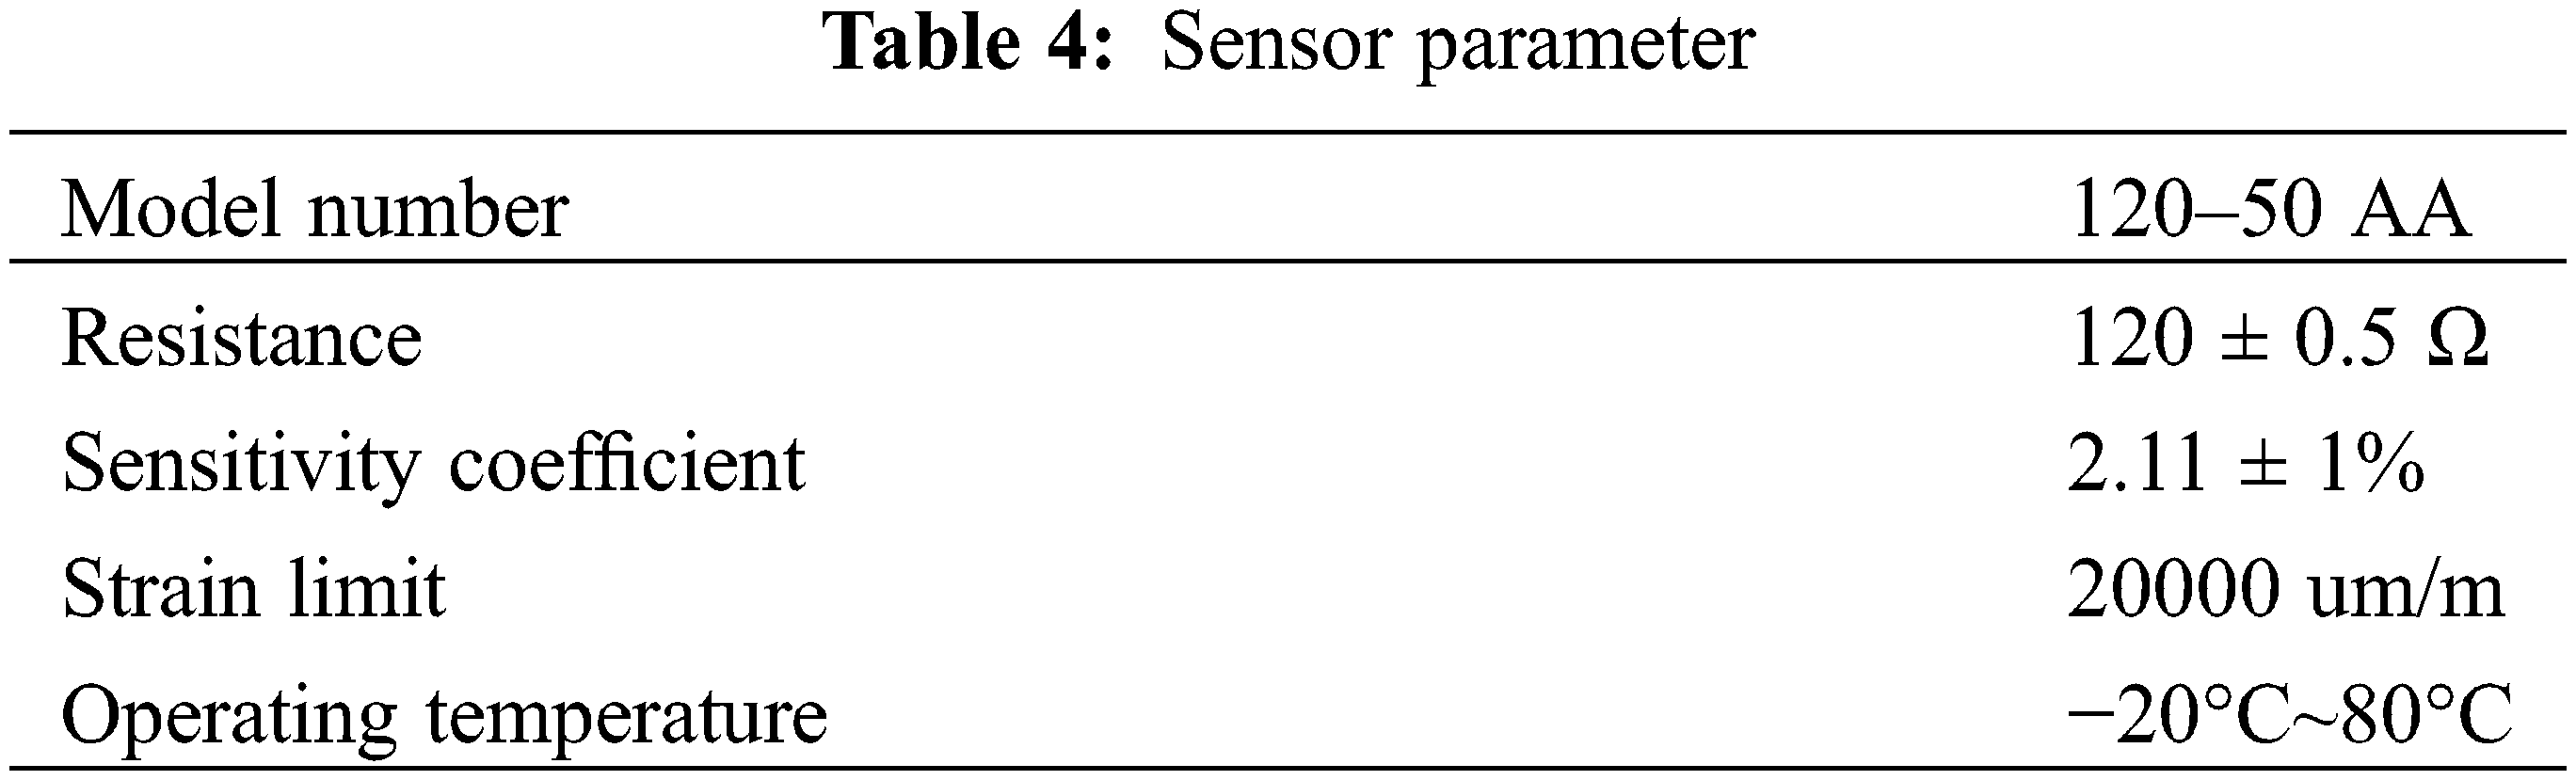
Strain monitoring was conducted for the control section of the selected bridge, and the strain monitoring was measured using a resistance strain gauge sensor. The relevant parameters of the sensor are listed in Table 4.
Because the on-site monitoring data did not correspond to the actual operation in real time, an outdoor camera was installed at a suitable location on the viaduct of the expressway at the site (Fig. 9). Table 5 lists the related camera parameters. Considering the direction of traffic on the bridge, the outdoor camera was placed on the street light pole at the north end of the viaduct facing south for a better monitoring effect (Fig. 10). Using the monitoring results, statistical analyses were performed to compare the actual vehicle operation at the site, thus improving the accuracy of the analysis.

Figure 9: Outdoor camera
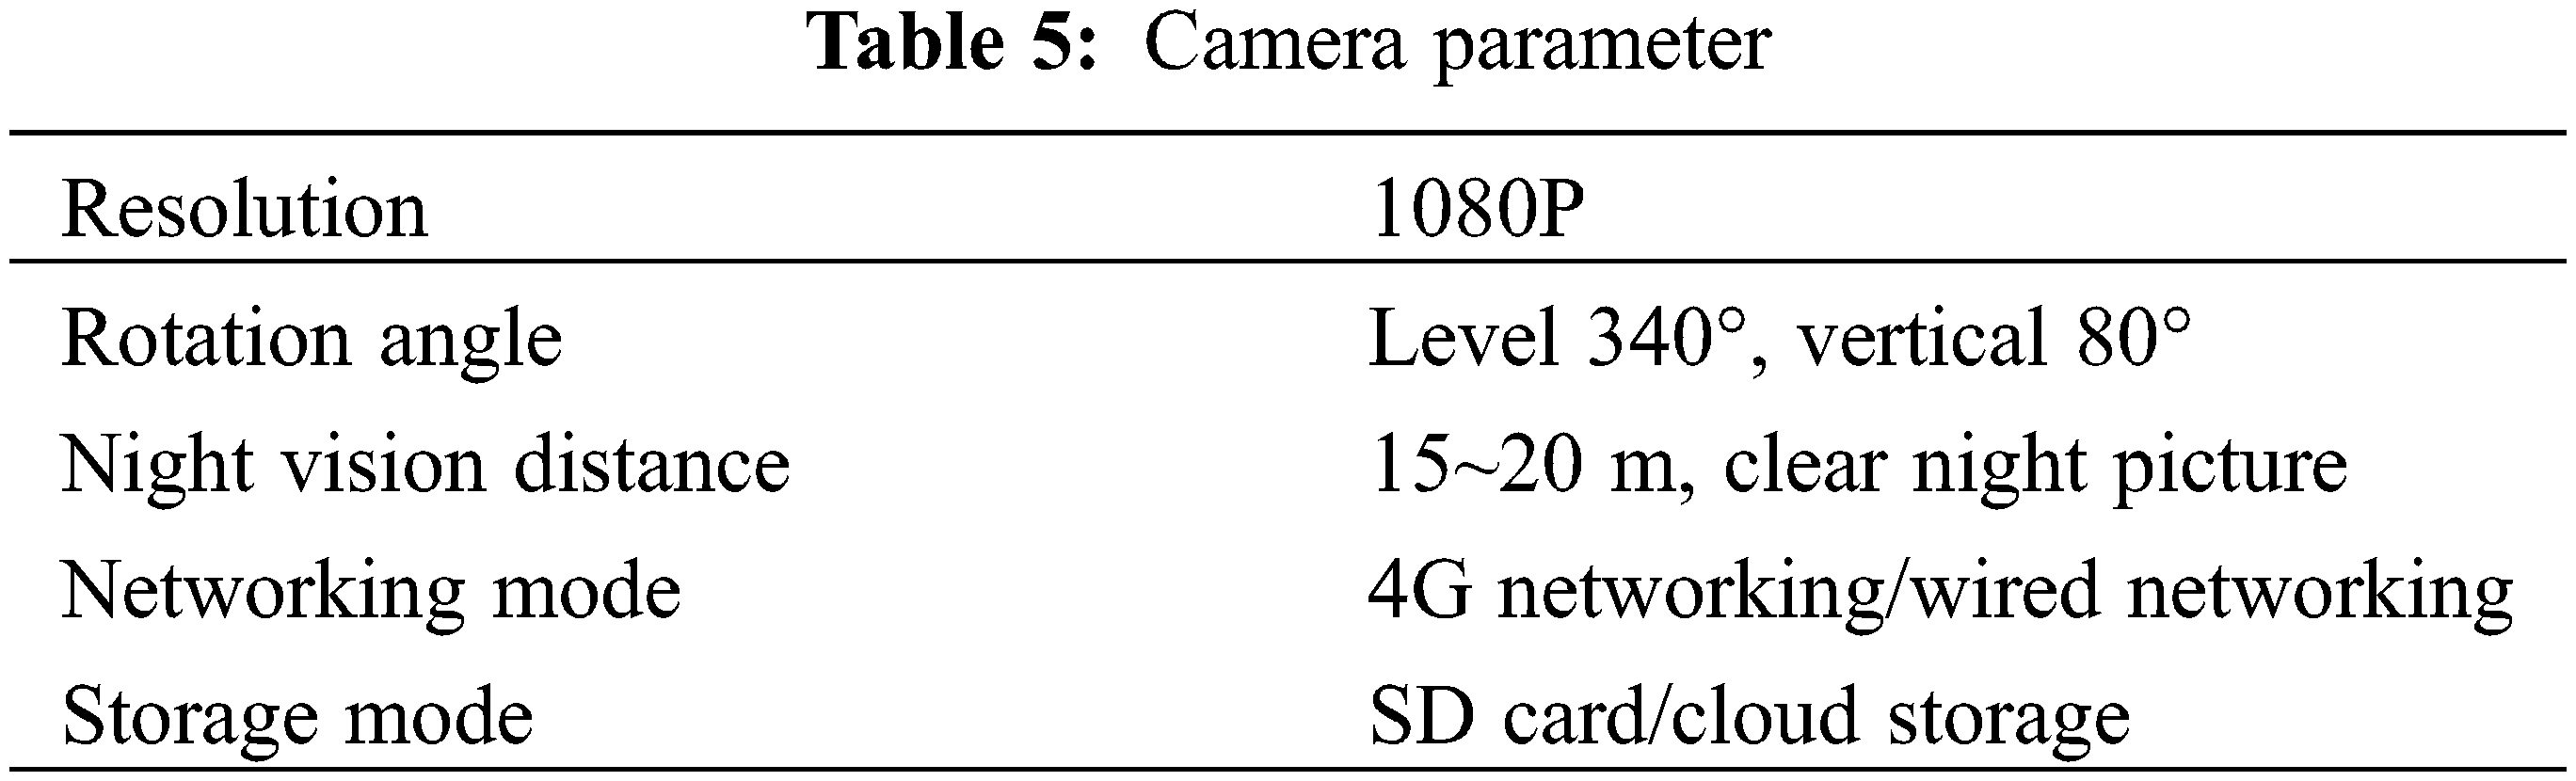

Figure 10: Surveillance screen
3.2 Selection of Field Monitoring Data
To process the strain data from the field test in a targeted manner, a statistical analysis of the traffic volume during the field test is first required. The total traffic volume for one month was selected for statistical analysis, and the statistics of the monthly average daily traffic volume are shown in Fig. 11.
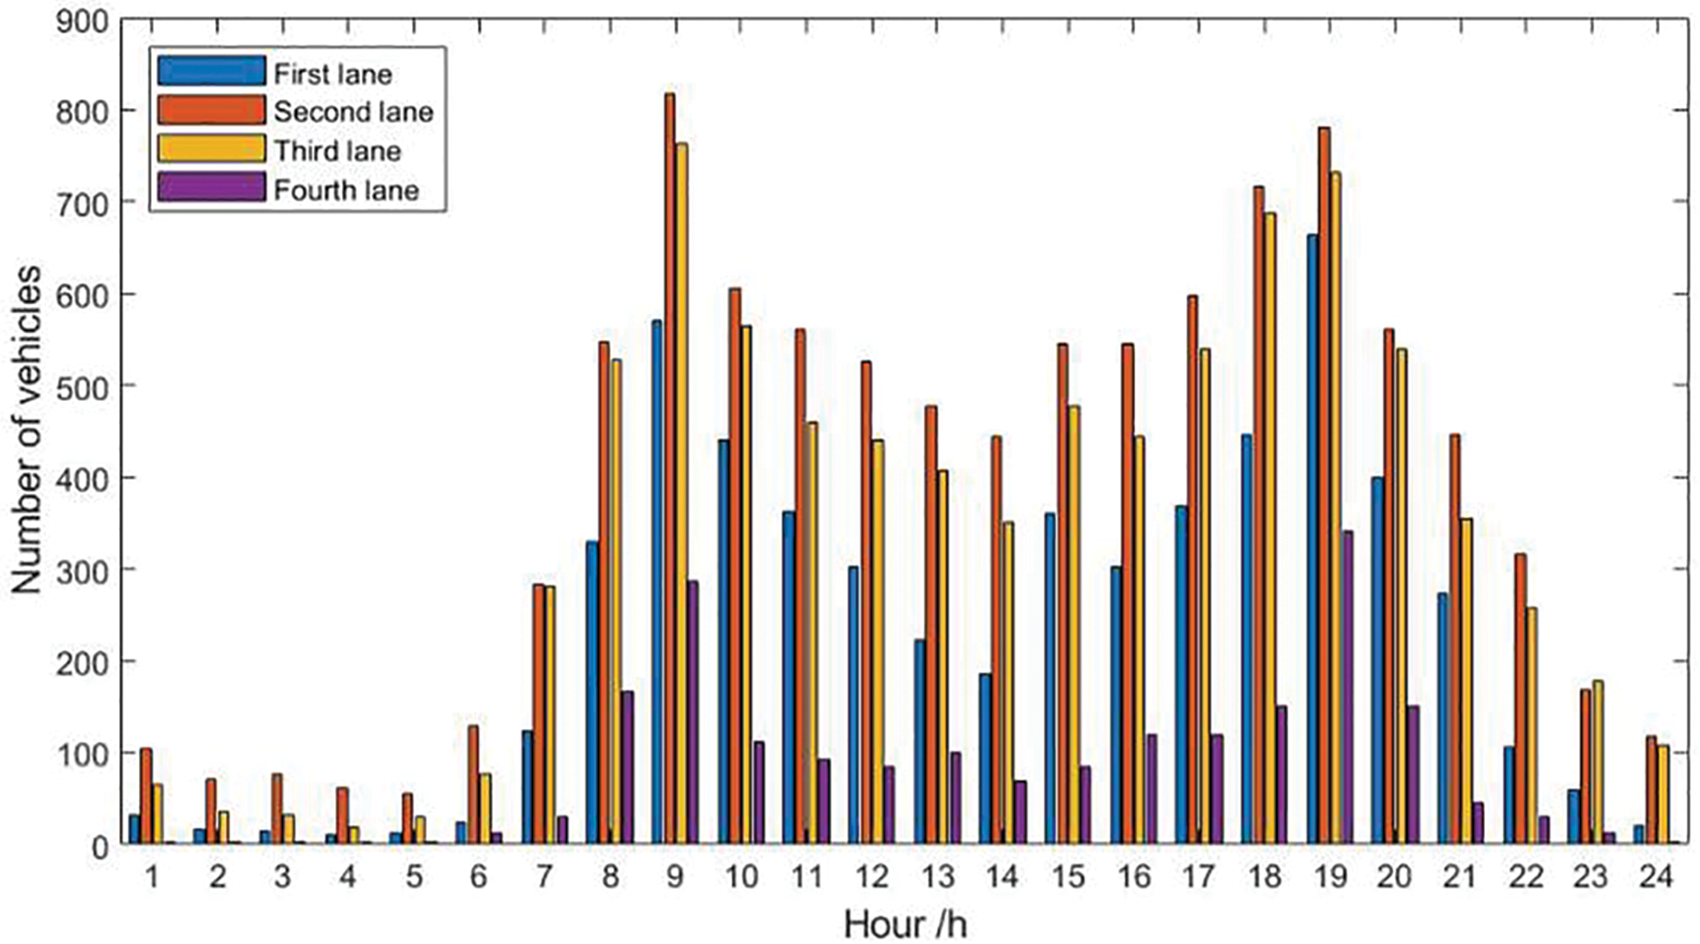
Figure 11: Monthly average daily hourly traffic volume
The daily maximum hourly traffic volumes were largely recorded in the morning and evening peaks, whereas the traffic volume in the evening was smaller. However, the monitoring records revealed that (Fig. 10) the heavy vehicles generally predominated in the evening. Therefore, the night vehicle load and speed information were screened. The results revealed that vehicular loads of 300 kN accounted for 42% of the total number of vehicles. Moreover, the vehicle speed distribution peak was observed between 40 and 80 km/h. However, because of fewer vehicles at night, the speed is expected to be relatively high. Therefore, the interval of the driving parameter values was selected to verify the results of the analysis of the vehicle conditions.
3.3 Selection of Field Monitoring Data
This section combines the statistical analysis of the actual operation of the bridge in Section 3.2 based on the application method of vehicle load and sets up one group of working conditions, namely 300 kN for a heavy vehicle traveling at 15 m/s under unobstructed and uniform travel. After the moving load application, the strain values at the bottom of the middle span were extracted from the cross-section measurement points along the same bridge length direction of 1/8 span (section A), 1/4 span (section B), 1/2 span (section C), 3/4 span (section D), and 7/8 span (section E). Finally, the measured strain of the lower edge of the bottom plate of each section beam close to the corresponding driving belt was obtained, as was the fitting curve from ABAQUS, as shown in Fig. 12 and Table 6.
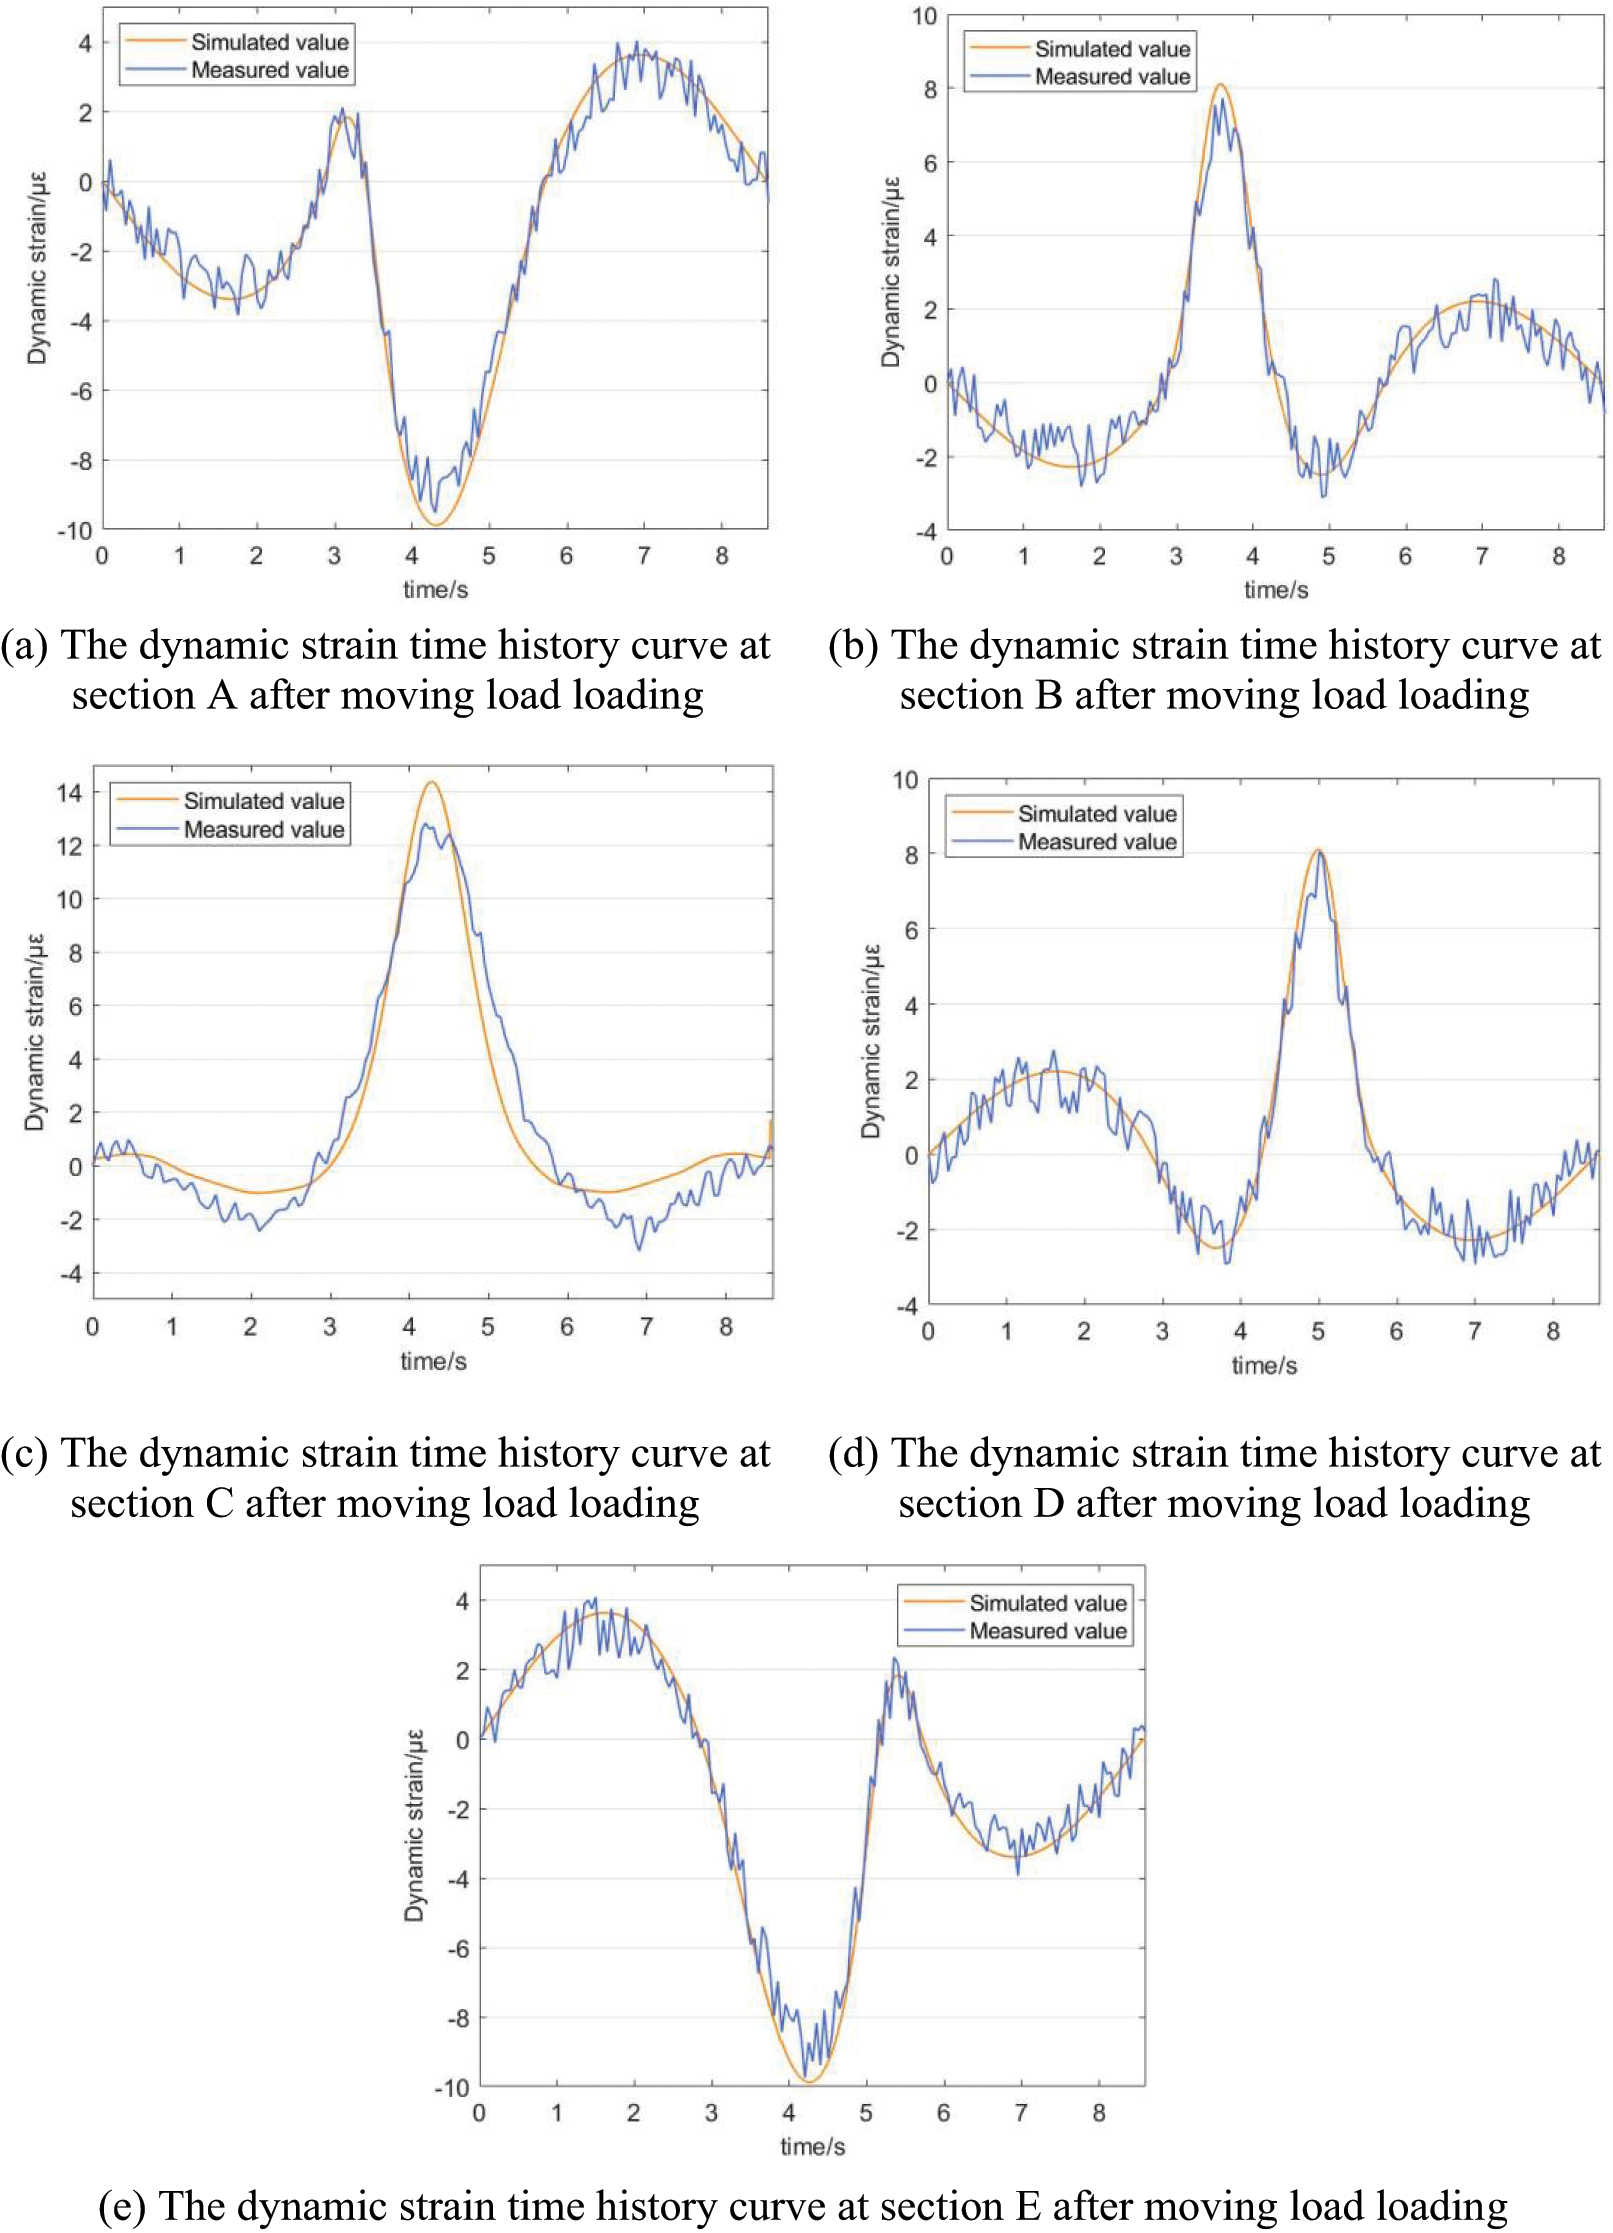
Figure 12: Dynamic strain time history curve at the bottom of each monitoring section after moving load loading
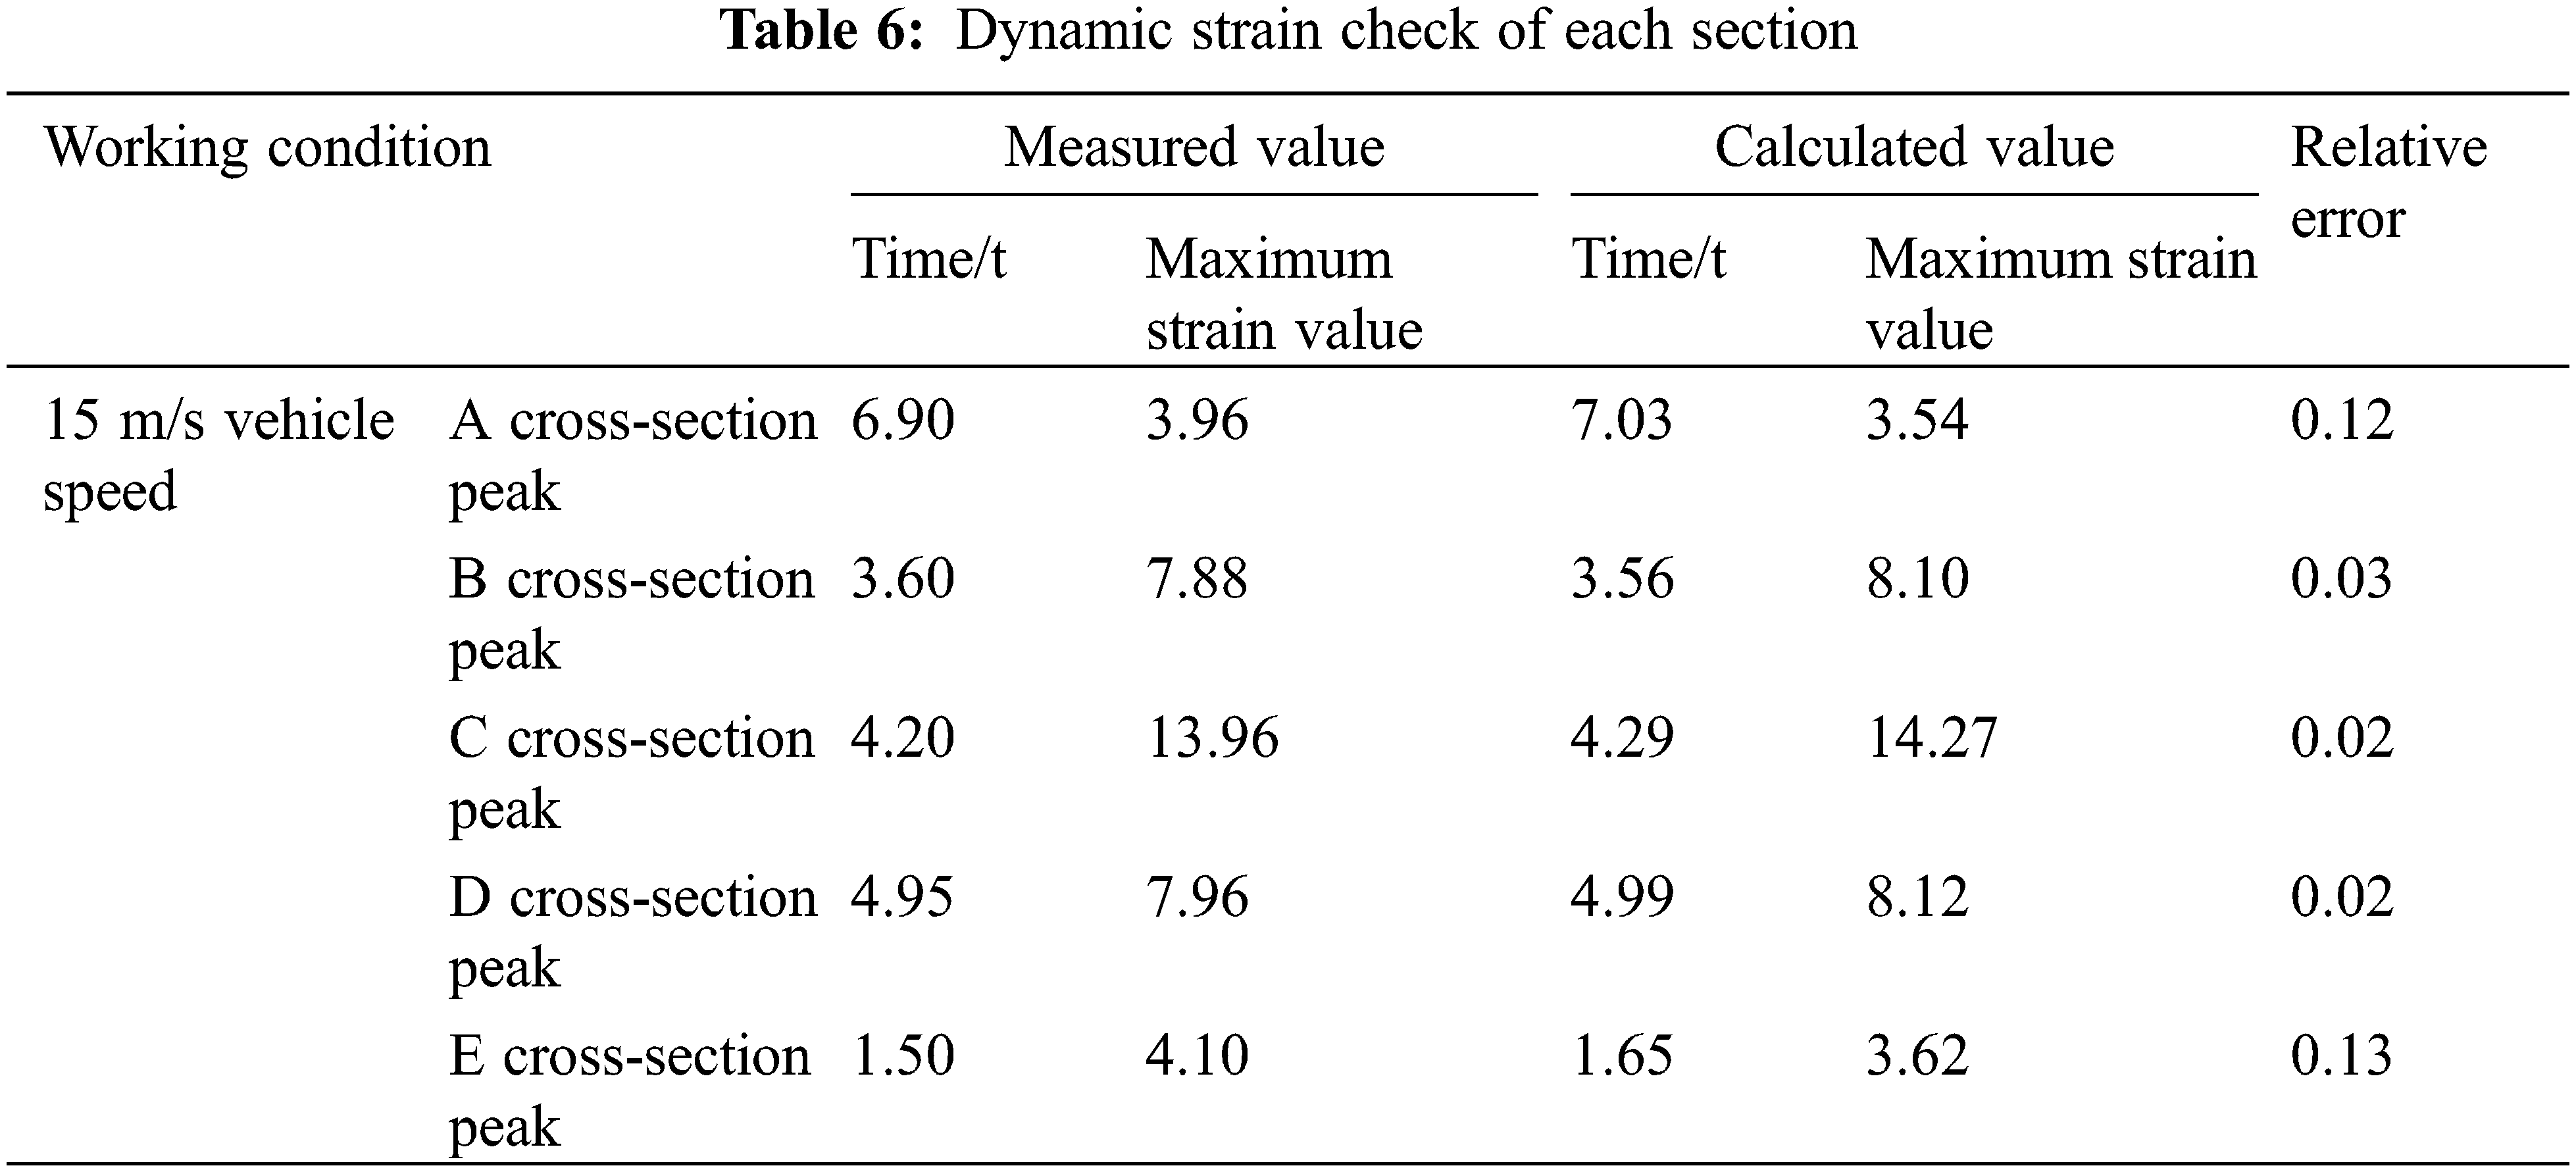
Comparing the measured and calculated dynamic strain curves at each point of the same cross-section revealed that the laws of the two are very similar, and the maximum relative error of strain at 1/4L cross-section, 1/2L cross-section, and 3/4L cross-section were all <10%, which verifies the accuracy of the finite element model. In addition, the measured maximum strain value was overall smaller than the calculated theoretical value, which indicates that the overall stress performance of this segmental assembled girder bridge corresponds to the theoretical prediction, and the health condition of the bridge is good.
Meanwhile, the dynamic strain curves at each cross-section exhibited some regularity when the vehicle moving load traveling over the bridge at a uniform speed. Comparing the dynamic strain curves at different cross-sections under the same speed revealed that the regular trend of the dynamic strain time history curve of the segmental assembled beam bridge in the middle span A section (1/8L) and E section (7/8L) was not as strong as that of other sections, and the dynamic strain time history curves of the B section (1/4L) and D section (3/4L) and the dynamic strain time history curves of the C section (at 1/2L) were quite similar. Therefore, considering the economic cost of similar future engineering applications, dynamic strain sensors can be installed at 1/4L, 1/2L, and 3/4L to effectively identify the vehicle load.
4 Study on the Response of Segmental Assembled Beams under Overload
In recent years, vehicle overloading has become increasingly serious, emerging as the main factor behind the deterioration of highway and bridge health. Moreover, long-term overloading leads to numerous bridge problems, which significantly shortens the bridge service life. Therefore, to further study the impact of overloaded vehicles on the structure of the segmental bridge, this section takes the design load as the benchmark, and the findings can provide a theoretical reference for the maintenance department. Determining the influence of different vehicle overload rates on a segmental assembled bridge can ensure it is managed more effectively.
4.1.1 Damage Constitutive Model
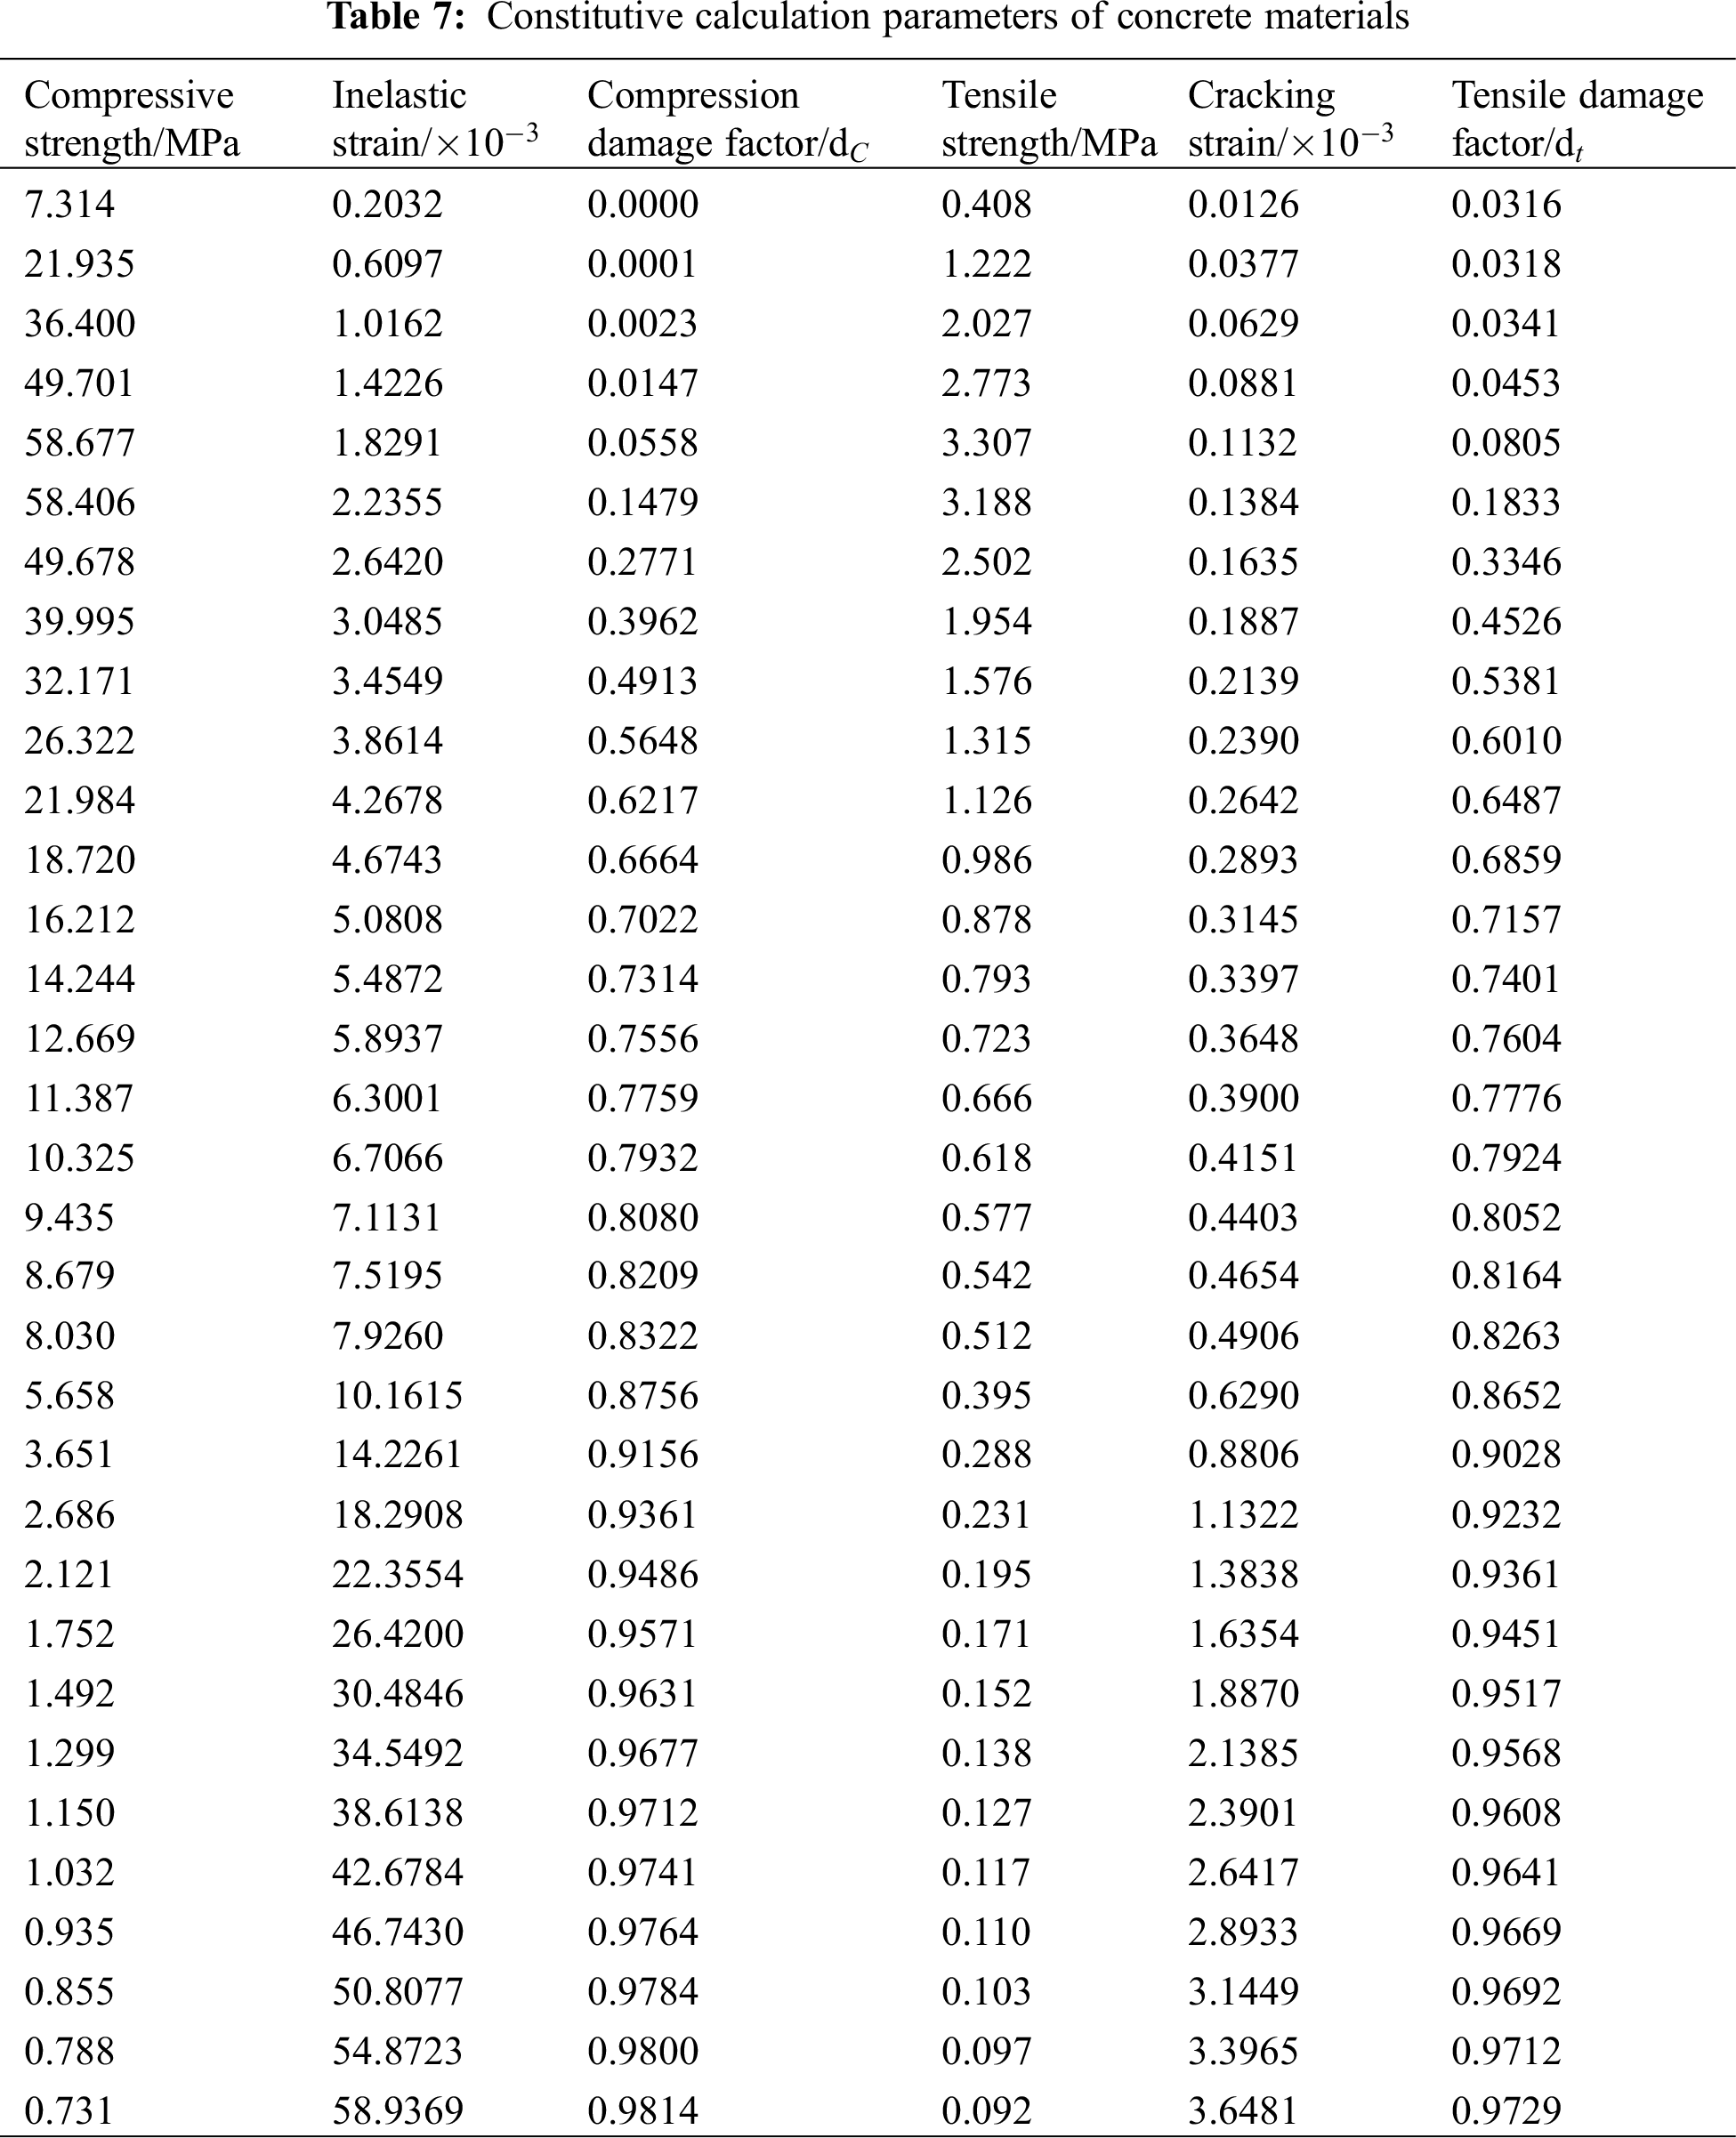
To elucidate the impact of vehicle overload on the segmental girder bridge structure, a damage constitutive model was introduced based on the finite element model. Considering the actual engineering context and the force behavior of concrete in this paper, the more comprehensive concrete damaged plasticity (CDP) model was chosen to simulate the constitutive model of precast segmental girder concrete [29].
The stiffness degradation of concrete due to damage mainly manifests as softening of the material due to tensile yielding and hardening followed by softening due to compressive yielding. Therefore, the stress–strain relationship of concrete in tension and compression can be, respectively, expressed by Eqs. (2) and (3) [30].
where,
Therefore, based on the actual application of material parameters, calculation method of the CDP model parameters above, and recommended specification values, the calculation parameters of the constitutive model of concrete were obtained, as listed in Table 7.
4.1.2 Determination of Vehicle Loads
Based on the design information of the target project bridge, the background project bridge can be categorized as an urban expressway, and the vehicle load level is City-A class. According to the “urban bridge design load standard” specifications [31], this paper selected the lane load applicable to the overall bridge structure, resulting in a design standard bridge load of 605 kN.
When the transport vehicle is traveling on the highway, the loading weight of the vehicle exceeds the rated loading weight, and it is considered overloaded. Due to the complexity of the actual vehicle working conditions on the road, this paper considered the calculation of vehicle overload for different overload rates using the following indicators: vehicle full load (based on design load), 10% vehicle overload, 25% vehicle overload, and 50% vehicle overload on the bridge for the simulation calculations. Table 8 lists the vehicle weight calculation results under different overload rates.

4.2 Effect of Different Overloading Rates on the Deformation of Main Beams
The calculation in this section was performed to simulate four vehicles driving with different overload rates on the bridge, as listed in Table 8. The four vehicles were of the same type and same vehicle load equivalent as the design vehicle load under each working condition. Moreover, different overload rates were applied. Similarly, the deflection response at the center of the lower edge of the bottom plate of the midspan cross-section beam for the background engineering bridge under different overload rates was obtained, as shown in Fig. 13.

Figure 13: When the vehicle speed is 20 m/s, the deflection time history curve of the lower edge of the center of the main girder bottom plate of the assembled bridge under different overload rates
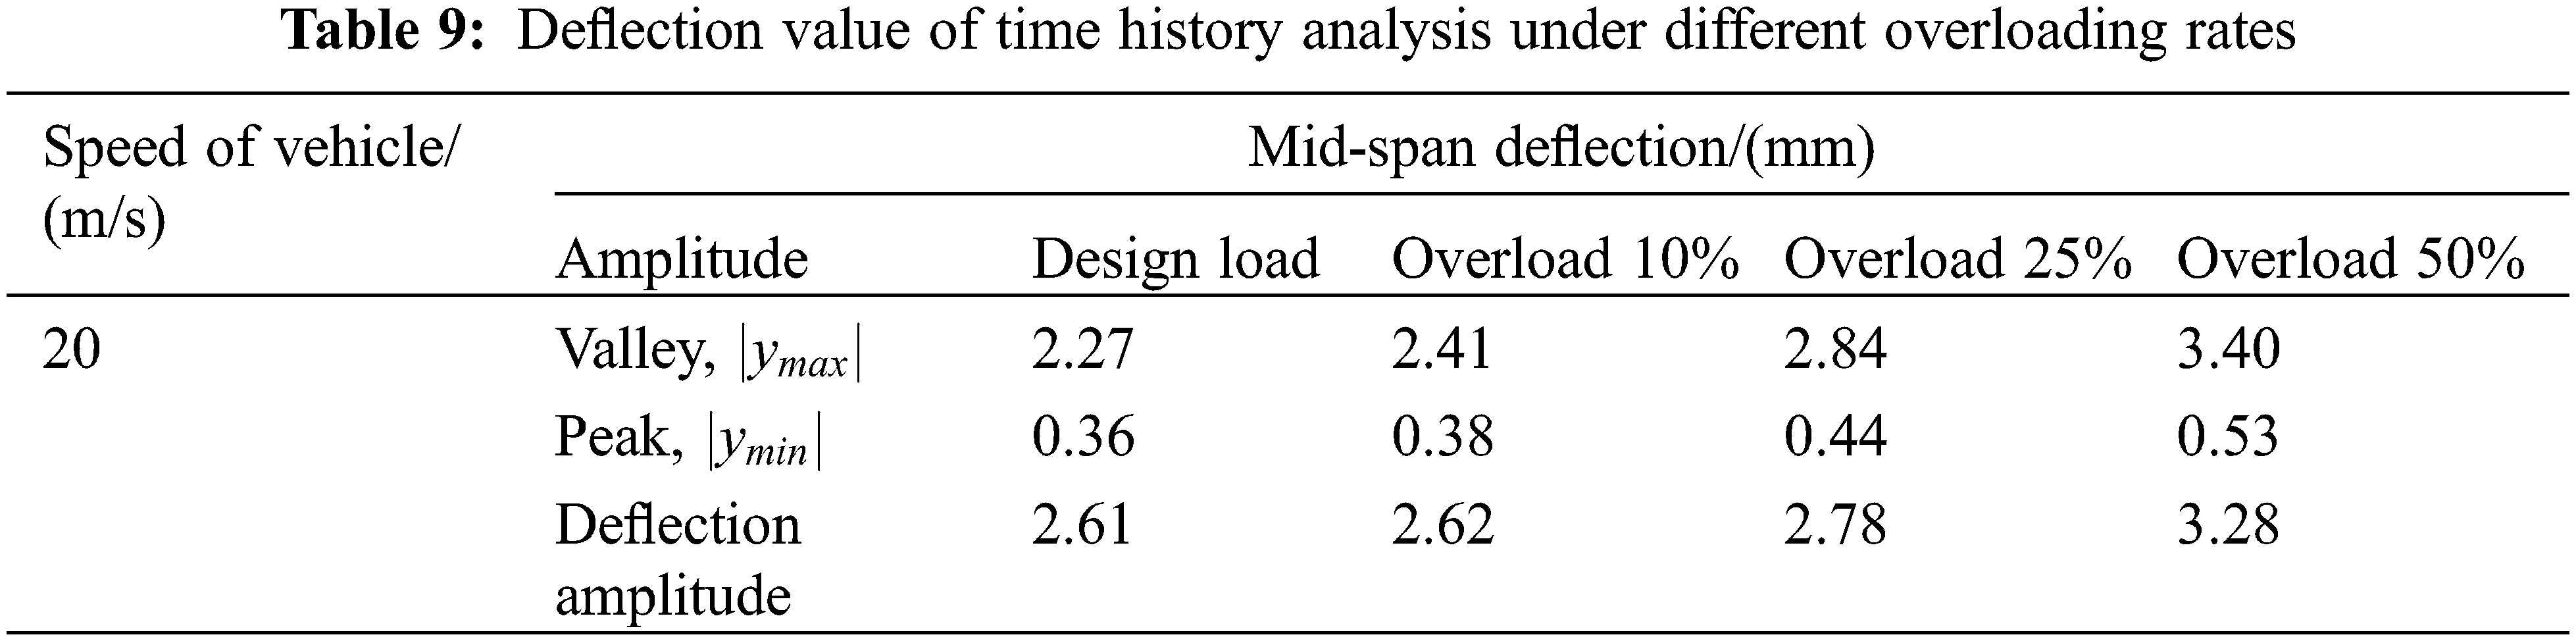
Fig. 13 and Table 9 reveal that when the heavy vehicle only travels on the bridge deck, the main span produces upward deflection, and the deflection gradually increases. When the heavy vehicle reaches the midspan position close to the first span bridge, the midspan upward deflection of the main span peaks at this moment. When the heavy vehicle travels toward the main span, it produces down torsion, and when it travels toward the midspan position of the second span bridge, the midspan deflection of the main span peaks under all moving conditions. The dynamic deflection curve of the main span when the heavy vehicle leaves the third span is similar to that when passing through the first span, which is a realistic response, indicating that the calculation results are reliable. Moreover, with the increase in overload rate, the deflection amplitude increases markedly, and the deflection amplitude reaches 3.28 mm when the overload across the bridge is 50%. Therefore, with the increase in bridge operation time, an increase in overloaded vehicles on the road will result in a gradual downward deflection of the main span, resulting in an increase in beam cracks and a decrease in the overall bearing capacity of the bridge.
4.3 Impact of Overloaded Vehicles on the Structure of Precast Collocated Bridge Base Plates
Because the sections of the bridges of the background project are connected by glued joints, when the vehicle passes, the beam body will vibrate considerably, which in the long run will cause damage to accumulate in certain areas. Therefore, a dynamic analysis of the weak area is required to elucidate the influence of overloaded vehicles on the segmental precast assembled girders.
Fig. 14 shows that when the vehicle is moving at a constant speed of 20 m/s on the bridge, the stress will concentrate at the load position of the moving vehicle on the bridge deck, and the influence range along the length direction is approximately 25 m. Further, the stress value gradually decreases along the longitudinal and transverse directions of the segmental precast assembled girder, in keeping with Saint-Venant’s theory [32].
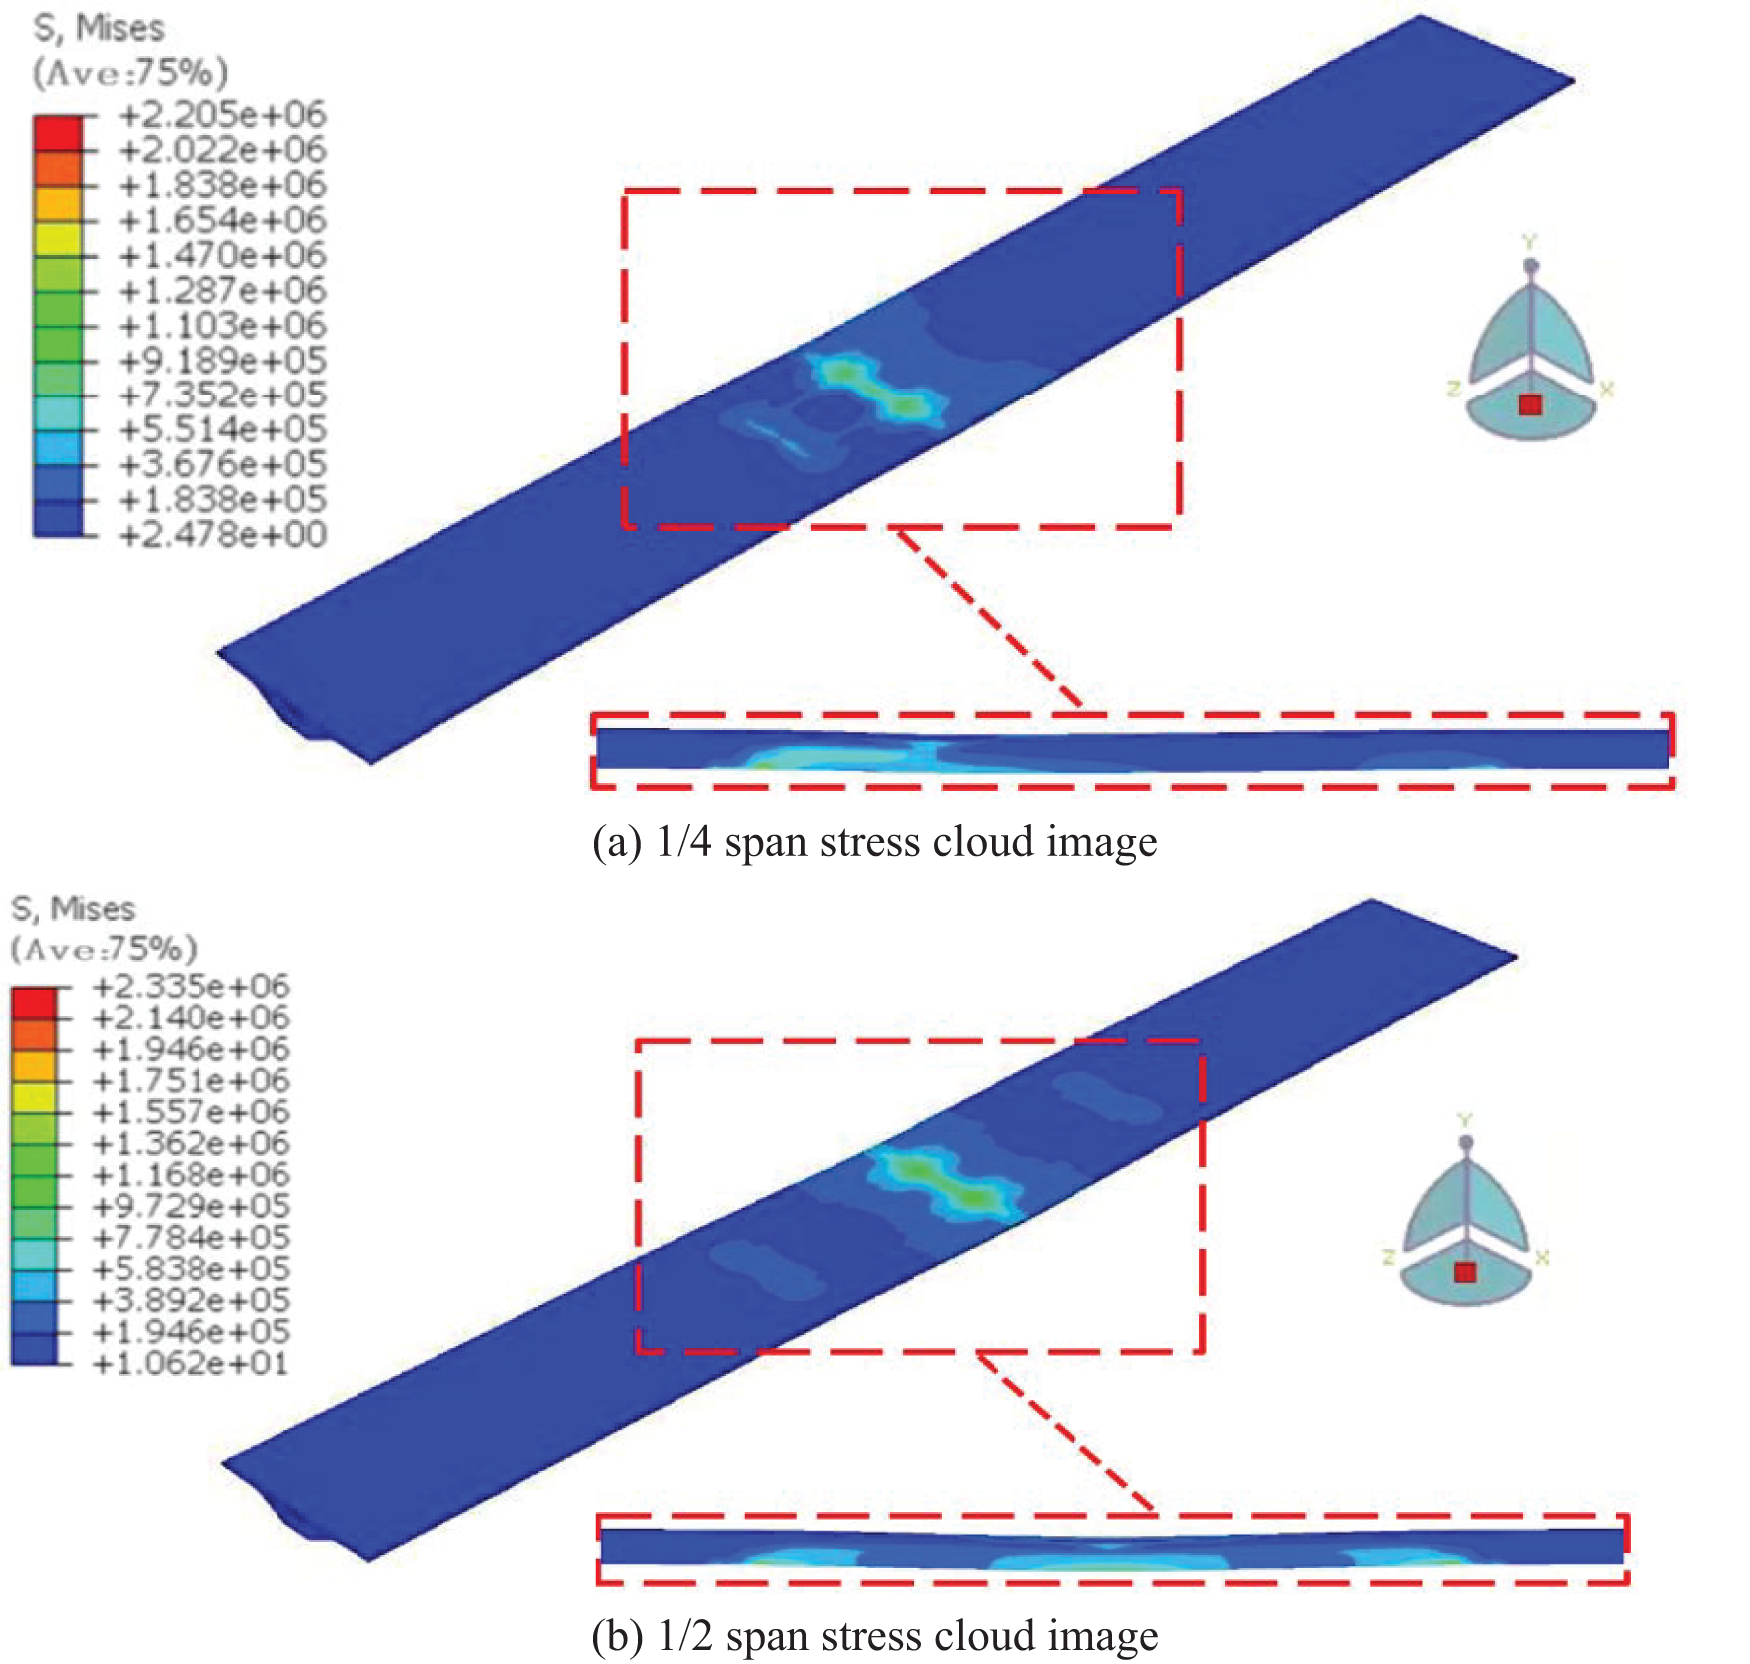
Figure 14: Stress cloud image of typical section of sectional bridge (unit: Pa)
Due to the discontinuity of the joints and the existence of prestressed tendons, the segmental assembled beam was affected by shear hysteresis, and the stress was greater at the web close to the bottom plate. In addition, a large stress concentration was present in block 0 of the segmental precast assembled girder.
Fig. 15 shows the structural damage to the bottom of the beam under different overload rates. Under traffic overload, concrete damage first appeared near the bottom of the joint of the bottom plate of the web on both sides of the middle span. With the increase in load, the development of damage along the bridge was faster than that in the transverse direction of the bridge. This is attributable to the absence of a structural steel bar on the segmental connecting surface, and only the prestressed steel bar and the key tooth splicing are present in this section. Therefore, the bending bearing capacity of the splice surface was weak, and when the concrete of the segmental assembled beam bottom plate was damaged, it was not conspicuous in the glue unit during this period. This is consistent with the commonly held notion that the bond strength of the contact surface of the colloid and concrete is higher than the tensile strength of concrete, the failure form of the specimen is the cohesive failure of concrete, and the joint bond is not cracked [33].
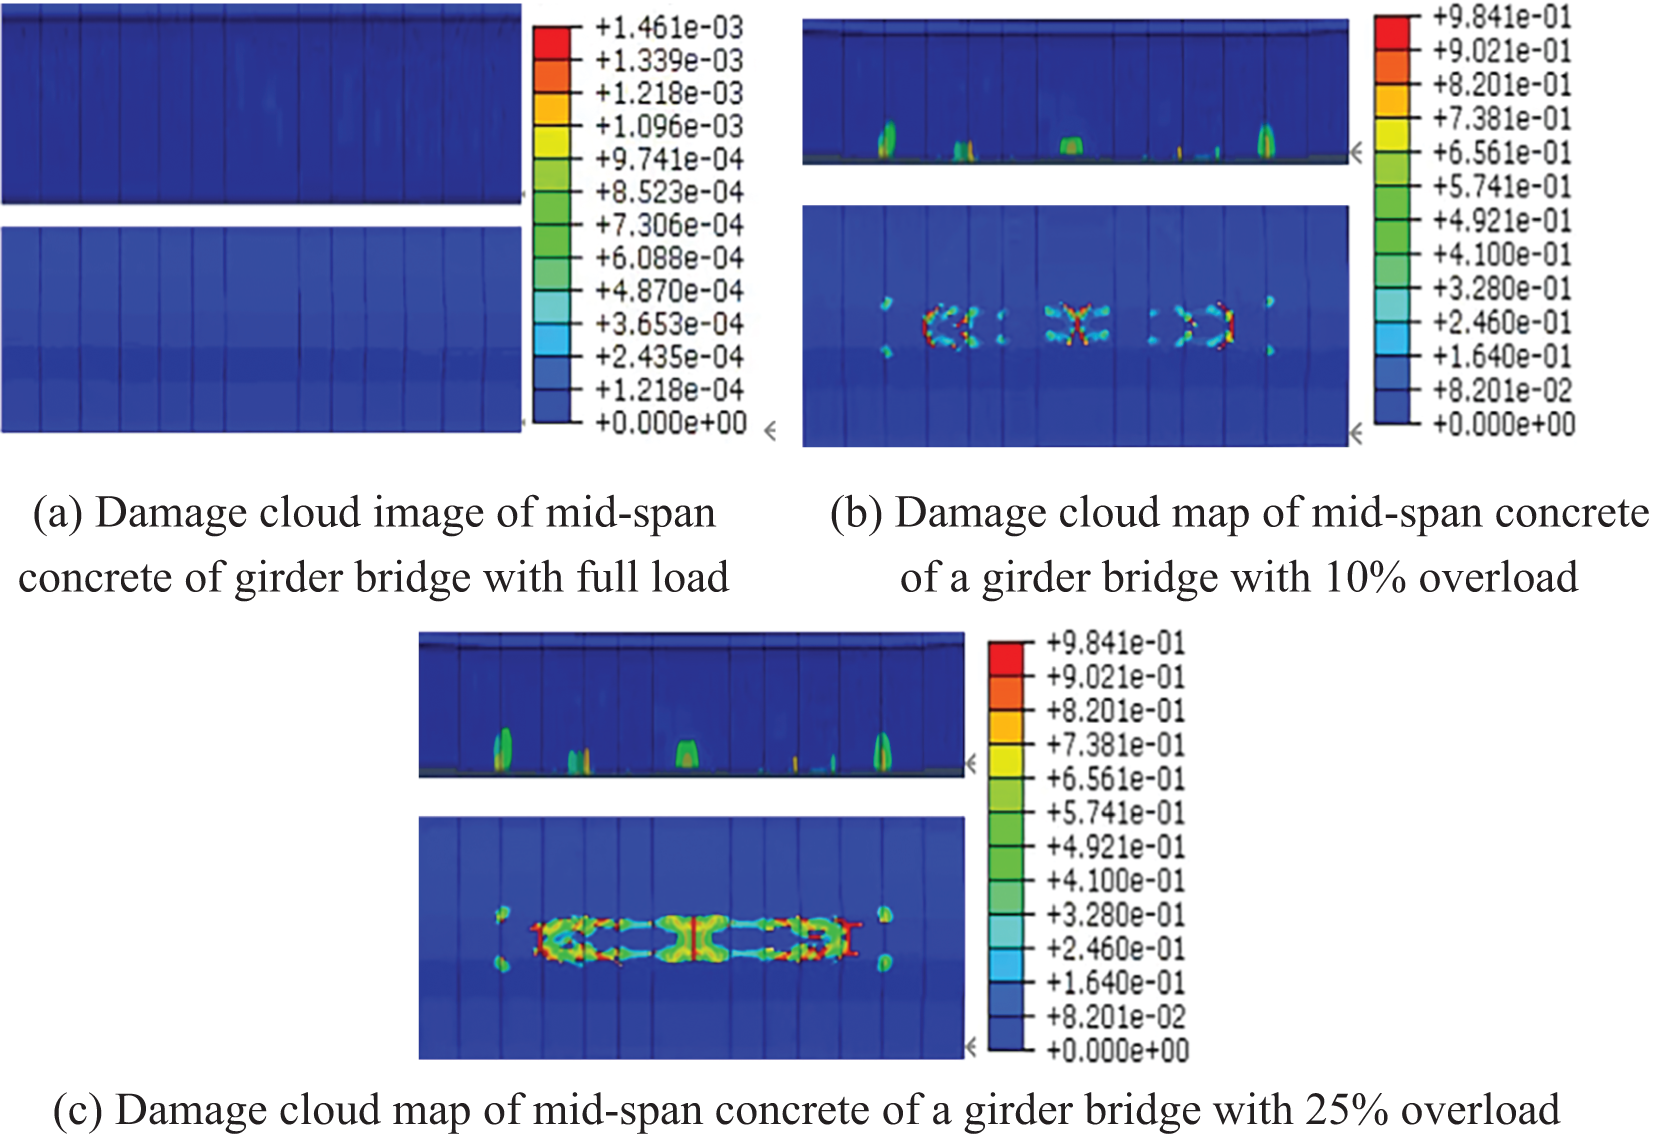
Figure 15: Damage cloud image of mid-span concrete under different overload rates
To quantify the concrete damage, the average of the damage factors of all concrete elements on the cross-section of the beam floor was taken as the cross-section damage factor
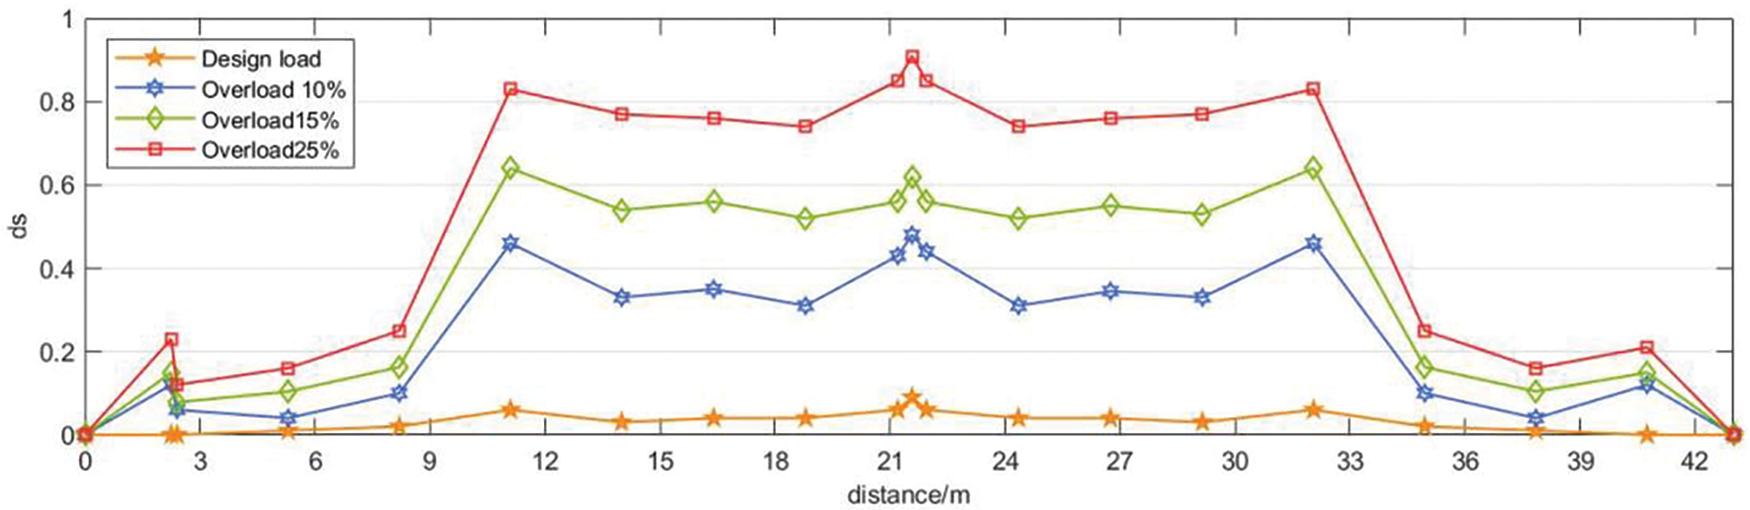
Figure 16: Damage factor distribution of mid-span floor
where, n is the number of concrete units on the bottom slab of the section. On the definition of the degree of damage of the cross-section:
Fig. 16 shows that with the increase in the vehicle overload multiplier, the cross-section damage also rapidly increased. When the vehicle was driven within the design load, no prominent damage to the middle span of the bridge occurred, indicating that the bridge design meets the requirements. When the vehicle load exceeded 10% of the design load, the damage at the key cross-section position of the bridge midspan was mild, and the overload rate continued to increase until 25%. At this time, the concrete at the bottom of the midspan cross-section beam completely fails, and the bridge ceases to be serviceable.
In addition, the maximum damage position of the beam bottom plate is often at the position where the length of the precast beam section changes and the midspan position, as these sections are in the bending of the prestressed tendon and the most unfavorable position of stress. Therefore, the concrete damage at these positions should be strengthened in the subsequent operation and maintenance stage.
In this paper, the influence of vehicle overload on segmental assembled girder bridges is investigated using ABAQUS software by considering a rapid viaduct project. The main conclusions are as follows:
1) The finite element modeling method is accurate by comparing with on-site measured data, and it is suitable for the numerical simulation of segmental girder bridges. The vehicle load was simplified as a moving pressure load and applied to the bridge contact surface as an equivalent rectangular load, and the internal function time and traveling speed as well as vehicle load were used to quickly represent various vehicles over the bridge simulation.
2) Dynamic sensors installed at 1/4L, 1/2L, and 3/4L of the segmental girder main beams could be used to identify the dynamic response of segmental girder bridges. When a heavy vehicle is driven to the middle position of the main span, the middle deflection of the main span is the maximum dynamic deflection under all moving conditions, and with the increase in the overload rate, the deflection increases markedly. Additionally, the downward deflection of the main span increases cracks in the beam body and decreases the overall bearing capacity of the bridge.
3) The bottom plate of the segmental girder bridge is mostly damaged at the position where the length of the precast beam section changes and the midspan position. With the increase in load, damage in the direction of the bridge develops faster than that in the direction of the transverse bridge. When the overload rate reaches 10% of the design load, concrete damage begins to occur first near the bottom of the joints of the bottom plate at the web on both sides of the midspan. When the overload rate reaches 25% of the design load, the concrete at the bottom of the midspan section beam completely fails.
Although this paper discusses the impact of overloaded vehicles under different overloading rates on the structural damage to the bridge based on the finite element model, further research is required to analyze the operational status of the segmental assembled bridge based on long-term health monitoring data to provide more reasonable recommendations to bridge management and maintenance departments.
Acknowledgement: The authors are grateful for the financial support from the Key Research Projects of Higher Education Institutions in Henan Province and the Henan Postdoctoral Foundation.
Funding Statement: This work is supported in part by the Key Research Projects of Higher Education Institutions in Henan Province (Grant No. 24A560021), in part by the Henan Postdoctoral Foundation(Grant No. 202102015).
Author Contributions: Donghui Ma: Methodology, Conceptualization. Wenqi Wu: Writing-review & editing. Yuan Li: Data curation, Writing original draft. Lun Zhao: Validation, Formal analysis. Yingchun Cai: Resources, Data curation. Pan Guo: Investigation, Writing–review & editing. Shaolin Yang: Investigation.
Availability of Data and Materials: The data that support the findings of this study are available from the corresponding author upon reasonable request.
Conflicts of Interest: The authors declare that they have no conflicts of interest to report regarding the present study.
References
1. Zhu J, Chen X. Damage detection method of suspension bridge based on index of strain impact factor. J Vib, Meas Diagn. 2023;43(3):450–8 (In Chinese). [Google Scholar]
2. Moufti SA, Zayed T, Abu Dabous S. Fuzzy defect based condition assessment of concrete bridges. In: 2013 Joint IFSA World Congress and NAFIPS Annual Meeting (IFSA/NAFIPS); 2013; Edmonton, Canada. [Google Scholar]
3. Xu FY, Zhang MJ, Wang L, Zhang JR. Recent highway bridge collapses in China: review and discussion. J Perform Constr Facil. 2016;30(5):4016030. doi:10.1061/(ASCE)CF.1943-5509.0000884 [Google Scholar] [CrossRef]
4. An YH, Chatzi E, Sim SH, Laflamme S, Blachowski B, Ou JP. Recent progress and future trends on damage identification methods for bridge structures. Struct Control Health Monit. 2019;26(10):1–30. [Google Scholar]
5. Ji X, Yang Z, Huang XD, Tan LS. Problems in bridge health monitoring and application of intelligent monitoring technology. In: 3rd International Workshop on Renewable Energy and Development (IWRED); 2019; Guangzhou, China. [Google Scholar]
6. Ahmed GH, Aziz OQ. Shear strength of joints in precast posttensioned segmental bridges during 1959–2019, review and analysis. Structures. 2019;20:527–42. doi:10.1016/j.istruc.2019.06.007. [Google Scholar] [CrossRef]
7. Shi XF, Liu ZQ, Zhou ZJ. Full-scale model test of prestressed segmental precast continuous girder bridge. In: Fib Symposium on High Tech Concrete—Where Technology and Engineering Meet; 2018; Maastricht, Netherlands (In Chinese). [Google Scholar]
8. Liu TX, Wang Z, Guo J, Wang JQ. Shear strength of dry joints in precast UHPC segmental bridges: experimental and theoretical research. J Bridge Eng. 2019;24(1):4018100. doi:10.1061/(ASCE)BE.1943-5592.0001323 [Google Scholar] [CrossRef]
9. Yuan AM, Yang C, Wang JW, Chen LK, Lu RW. Shear behavior of epoxy resin joints in precast concrete segmental bridges. J Bridge Eng. 2019;24(4):4019009. doi:10.1061/(ASCE)BE.1943-5592.0001362 [Google Scholar] [CrossRef]
10. Sukamta, Billahi BA, Widyanto SA, Lie HA. Method assessment of bridge conditions using vibration mode patterns. In: Proceedings of the 5th International Conference on Sustainable Civil Engineering Structures and Construction Materials; 2022; Singapore. p. 787–801. [Google Scholar]
11. Yang XM, Yi TH, Qu CX, Li HN. Modal identification of bridges using asynchronous responses through an enhanced natural excitation technique. J Eng Mech. 2021;147(12):1–10. [Google Scholar]
12. Skelton SB, Richardson JA. A transducer for measuring tensile strains in concrete bridge girders. Exp Mech. 2006;46(3):325–32. doi:10.1007/s11340-006-7106-0. [Google Scholar] [CrossRef]
13. Lu HX, Gao ZC, Wu BT, Zhou ZW. Dynamic and quasi-static signal separation method for bridges under moving loads based on long-gauge FBG strain monitoring. J Low Freq Noise Vib Active Control. 2019;38(2):388–402. doi:10.1177/1461348418822375. [Google Scholar] [CrossRef]
14. He XL, She TL, Zhao LZ. A new system for dynamic deflection measurement of highway bridge. In: International Conference on Vibration, Structural Engineering and Measurement (ICVSEM2012); 2012; Shanghai, China. [Google Scholar]
15. Mei DP. Structural health monitoring-based dynamic behavior evaluation of a long-span high-speed railway bridge. Smart Struct Syst. 2017;20(2):197–205. [Google Scholar]
16. Li YH, Tang LQ, Liu ZJ, Liu YP. Statistics and probability analysis of vehicle overloads on a rigid frame bridge from long-term monitored strains. Smart Struct Syst. 2012;9(3):287–301. doi:10.12989/sss.2012.9.3.287. [Google Scholar] [CrossRef]
17. Cury A, Cremona C, Dumoulin J. Long-term monitoring of a PSC box girder bridge: operational modal analysis, data normalization and structural modification assessment. Mech Syst Signal Process. 2012;33:13–37. doi:10.1016/j.ymssp.2012.07.005. [Google Scholar] [CrossRef]
18. Li Y, Lin X, Shang H. Effect of vehicle overload on the fatigue damage of transverse connection for assembled girder bridges. J Shenzhen Univ Sci Eng. 2020;37(2):158–164 (In Chinese). [Google Scholar]
19. Nguyen VH, Schommer S, Maas S, Zürbes A. Static load testing with temperature compensation for structural health monitoring of bridges. Eng Struct. 2016;127:700–18. doi:10.1016/j.engstruct.2016.09.018. [Google Scholar] [CrossRef]
20. Liu Y, Zhang HP, Deng Y, Li M. Fatigue damage analysis on simple supported bridge under overloading. J Zhejiang Univ Eng Sci. 2015;49(11):2172–8 (In Chinese). [Google Scholar]
21. Aloisio A, Alaggio R, Fragiacomo M. Bending stiffness identification of simply supported girders using an instrumented vehicle: full scale tests, sensitivity analysis, and discussion. J Bridge Eng. 2021;26(1):1–9. [Google Scholar]
22. Zhao Q. Analysis of simply supposed girder bridge vibration responses influenced by truck overload driving. J Hebei Univ Technol. 2009;38(5):114–8 (In Chinese). [Google Scholar]
23. Zivaljic N, Nikolic Z, Smoljanovic H, Munjiza A. Numerical simulation of reinforced concrete structures under impact loading. Materialwissenschaft Und Werkstofftechnik. 2019;50(5):599–610. doi:10.1002/mawe.v50.5. [Google Scholar] [CrossRef]
24. Do TV, Pham TM, Hao H. Numerical investigation of the behavior of precast concrete segmental columns subjected to vehicle collision. Eng Struct. 2018;156:375–93. doi:10.1016/j.engstruct.2017.11.033. [Google Scholar] [CrossRef]
25. Sheng Z, Wang Y, Zhang Z. Local cohesive finite element method with finite interface thickness. Chinese J Comput Mech. 2021;38(6):802–9 (In Chinese). [Google Scholar]
26. Li F, Zhang W, Ni J. Study on seismic performance of reinforced concrete frame structure with embeded steel plates. Building Struct. 2020;50(13):106–13 (In Chinese). [Google Scholar]
27. Han Y, Zhou Z, Zhang Y, Liu X, Wang J, Zhou W. Dynamic deflection simulation of bridge in driving process based on ABAQUS software. Technol Earthquake Dis Prevent. 2023;18(1):118–26 (In Chinese). [Google Scholar]
28. Dong Z, Liu M, Zheng H, Gong X. Dynamic mechanical analysis of asphalt pavement based on cross-isotropic properties. China J Highway Transport. 2012;25(5):18–23 (In Chinese). [Google Scholar]
29. Zhang J, Wang Q, Hu S, Wang C. Parameters verification of concrete damaged plastic model of ABAQUS. Building Struct. 2008;38(8):127–30 (In Chinese). [Google Scholar]
30. Lee JH, Fenves GL. Plastic-damage model for cyclic loading of concrete structures. J Eng Mech-Asce. 1998;124(8):892–900. doi:10.1061/(ASCE)0733-9399(1998)124:8(892). [Google Scholar] [CrossRef]
31. Ministry of Housing and Urban-Rural Development of the People’s Republic of China. Code for design of the municipal bridge. 2011 (In Chinese). [Google Scholar]
32. Li Y, Ren WD, Feng ZQ, Chen ZQ. Stress analysis and model test of crucial parts of large-span continuous rigid frame arch bridge. J Rail Way Sci Eng. 2007;4(4):23–7 (In Chinese). [Google Scholar]
33. Yuan AM, Dai H, Sun DS, Cai JJ. Behaviors of segmental concrete box beams with internal tendons and external tendons under bending. Eng Struct. 2013;48:623–34. doi:10.1016/j.engstruct.2012.09.005. [Google Scholar] [CrossRef]
34. Shi YC, Hao H, Li ZX. Numerical derivation of pressure-impulse diagrams for prediction of RC column damage to blast loads. Int J Impact Eng. 2008;35(11):1213–27. doi:10.1016/j.ijimpeng.2007.09.001. [Google Scholar] [CrossRef]
Cite This Article
 Copyright © 2024 The Author(s). Published by Tech Science Press.
This work is licensed under a Creative Commons Attribution 4.0 International License , which permits unrestricted use, distribution, and reproduction in any medium, provided the original work is properly cited.
 Downloads
 Citation Tools