
 Submit a Paper
 Propose a Special lssue
 Open Access
ARTICLE

Track Defects Recognition Based on Axle-Box Vibration Acceleration and Deep-Learning Techniques
1 School of Transportation Engineering, Shandong Jianzhu University, Jinan, 250101, China
2 China Construction Eighth Bureau (Shandong) Design Consulting Co., Ltd., Jinan, 250100, China
3 State Key Laboratory of Rail Traffic Control and Safety, Beijing Jiaotong University, Beijing, 100044, China
* Corresponding Author: Xiukun Wei. Email:
Structural Durability & Health Monitoring 2024, 18(5), 623-640. https://doi.org/10.32604/sdhm.2024.050195
Received 30 January 2024; Accepted 28 April 2024; Issue published 19 July 2024
 View Full Text
 Download PDF
Abstract
As an important component of load transfer, various fatigue damages occur in the track as the rail service life and train traffic increase gradually, such as rail corrugation, rail joint damage, uneven thermite welds, rail squats fastener defects, etc. Real-time recognition of track defects plays a vital role in ensuring the safe and stable operation of rail transit. In this paper, an intelligent and innovative method is proposed to detect the track defects by using axle-box vibration acceleration and deep learning network, and the coexistence of the above-mentioned typical track defects in the track system is considered. Firstly, the dynamic relationship between the track defects (using the example of the fastening defects) and the axle-box vibration acceleration (ABVA) is investigated using the dynamic vehicle-track model. Then, a simulation model for the coupled dynamics of the vehicle and track with different track defects is established, and the wavelet power spectrum (WPS) analysis is performed for the vibration acceleration signals of the axle box to extract the characteristic response. Lastly, using wavelet spectrum photos as input, an automatic detection technique based on the deep convolution neural network (DCNN) is suggested to realize the real-time intelligent detection and identification of various track problems. The findings demonstrate that the suggested approach achieves a 96.72% classification accuracy.Keywords
The track is an important component of load transfer in the rail transit system. Intelligent detection and identification of its health condition is of great significance to ensure the safe and stable operation of rail transit. Various fatigue damages occur in the track as the rail service life and train traffic increase gradually, such as rail corrugation, rail joint damage, uneven thermite welds, rail squats, and fastener defects can be divided into two forms: one is invisible defects, including bolt loosening and other problems; The other is a visible defect, for instance, the worn or completely missing fasteners, etc. Slight track defects cause vibration and noise during train operation and affect passengers’ comfort experience. The continuous deterioration of track defects causes serious abnormal vibration between the wheel and the rail and even leads to major safety accidents. The conventional maintenance mode makes it difficult to predict these sudden safety accidents, and it can no longer meet the safety detection and early warning requirements of track infrastructure. Therefore, real-time intelligent diagnosis of the service status of fasteners is crucial to improving the safety of rail transit operations and has practical significance.
The detection technology for tracking defects is currently divided into three categories, namely, machine vision-based detection, laser scanning-based detection, and vibration signal-based defects detection. Machine vision-based detection technology has been widely used in various fields such as industry, communications, military, and so on [1,2]. Image-based machine vision technology is applied to the detection of track defects, mainly for the defection of rail surface defects, rail contour collection, and fastener deterioration failure detection [3]. For instance, automatic detection techniques for different types of fastener losses have been developed extensively within the last ten years [4–8]. In addition, deep convolutional neural networks (DCNN) have been used to automatically detect fastener damage [9–11]. However, the track defects detection method based on machine vision technology has high requirements for the quality of the initial images [12–14].
The detection technology based on laser scanning is divided into two types: the track detection technology based on laser camera [15] and the technology based on three-dimensional laser scanning [16]. The former method is similar to the technology based on machine vision, which can be regarded as an enhanced machine vision application technology [17,18]. The track detection technology by using three-dimensional laser scanning is based on the geometric point cloud data and image data of the target object for reconstruction processing to meet different application requirements [19]. However, this method needs the three-dimensional geometric data of the track structure for the subsequent analysis.
In contrast, the track defects detection technology based on vibration response signals is more suitable for real-time track defects detection on rail transit lines. The neural network is used to establish the mapping relationship between track irregularity and vehicle abnormal response [20]. The technology to detect track weld irregularities and rail surface squats with the aid of axle box vibration acceleration response is proposed [21–24]. The energy spectrum of the vehicle vibration response is used to reflect the service status of the track [25]. The track tread squats are detected with the help of the wavelet energy spectrum entropy index of the axle box vibration signal [26]. A method for rail corrugation detection is proposed using the wavelet packet energy entropy index of the detection signal [27]. The rail vibration response in connection with the fastener failure is analyzed [28,29]. In addition, the detection of rail or fastener defects by using the vibration acceleration of the axle box or the bogie frame is studied [21,30–32]. The convolutional neural network (CNN) is introduced to learn the mapping relationship between vibration signals and system failure [33–37].
However, there are some inherent limitations to the existing research. First, they often require human intervention to analyze small differences, which reduces the accuracy of detection. Second, image-based methods are usually only available for visible trajectory damage, such as missing fasteners or fatigue cracks in clips. Furthermore, these techniques are influenced by factors such as the shooting angle, the vibration of the train, and the lighting, leading to errors in sampling. Finally, the focus of these existing methods lies in the feature extraction of track single defects based on data processing, which does not form a perfect and effective intelligent detection method for multiple track defects, particularly when several different track defects overlap together.
With this consideration, this paper plans to combine ABVA and deep learning technology to propose an intelligent track defect detection method. First, a time-frequency analysis of the ABVA will be performed to explore whether track defects cause vibration to be transmitted to the wheelset system. Secondly, a vehicle-track coupled dynamics simulation model with different track defects is built, and the wavelet power spectrum (WPS) analysis is performed on ABVA to extract its characteristic response. Ultimately, a deep convolution neural network (DCNN)-based automatic detection technique is suggested to achieve the intelligent real-time detection of various track flaws.
The main contributions of this paper lie in the following aspects. First, analyzing the influence of different track defects on the dynamic response of the axle box provides a theoretical basis and a new idea for vibration-based track defect detection. Secondly, an intelligent track defect identification method using ABVA and deep learning technology is proposed.
This paper is organized as follows. In Section 2, the paper outlines the problems under study. Section 3 delves into the analysis of the vibration dynamics of the wheel-rail system through an illustrative example. Section 4 describes how to include track defects in a wheel-rail system model. In Section 5, the vibration response characteristics of the axle box considering various track defects are discussed in detail. Section 6 discusses the method of tracking defect identification based on DCNN. Finally, the research results are summarized in Section 7.
Various fatigue defects appear on the track surface under the repeated action of the vehicle axle load, such as rail corrugation, local squats, rail joints, welding irregularity, and fastener defects as shown in Fig. 1a. This section takes the DTVI2 fastener commonly used in subway lines as an example to illustrate the track defect detection scheme, as shown in Fig. 1b. The fixing system comprises clamps, screws, spacers, and insulating gauge blocks (see Fig. 1b(i)). The vibration shocks are transmitted from the rail to the insulating gauge block, which in turn acts on the clamp. The vibration of the clamp can cause some damage to the fastener, such as loosening of bolts, fatigue damage to the clamp, and breakage or loss of the fastener (see Fig. 1b(ii)). In the rail-car coupling power system (see Fig. 1b(iii)), damage to the fasteners directly weakens the force acting on the track, which leads to an increase in the vibration reaction of the track, and consequently increases the wheel-rail system’s vibrations. The vehicle system is subjected to waves of wheel and rail forces, which result in vibrations in the wheels, bogies, and even the body.
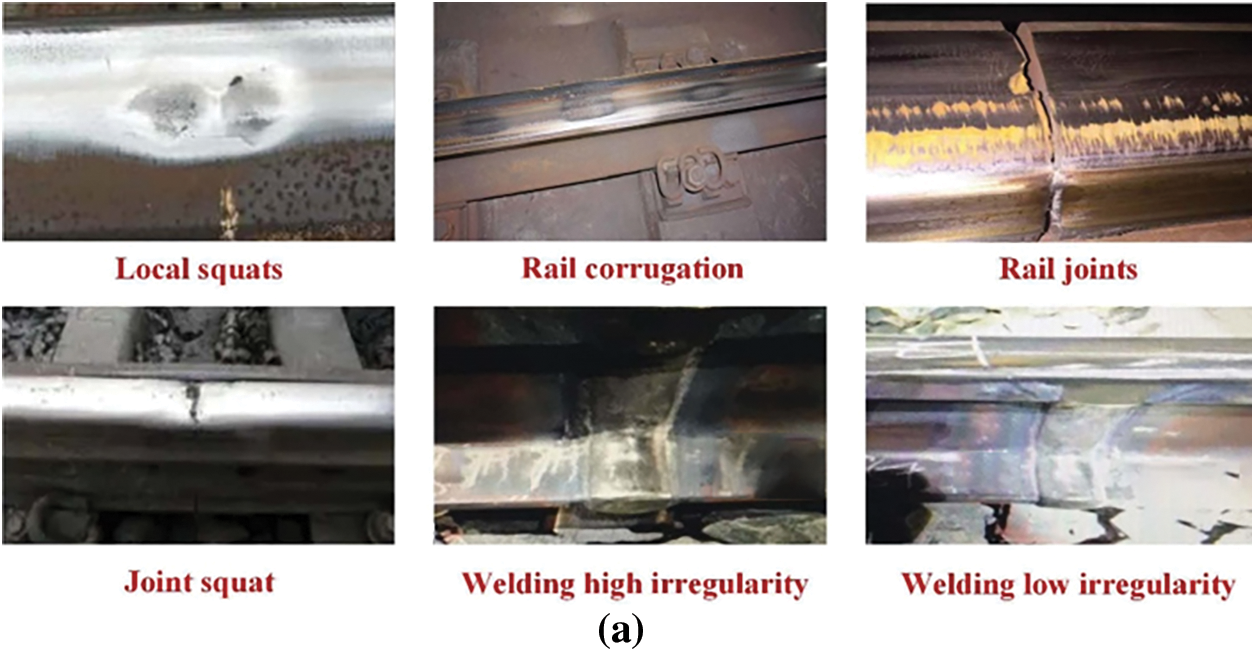

Figure 1: Track defects and the detection scheme. (a) Typical track defects, (b) Detection scheme, (i) The fastener construction of DTVI2 type, (ii) Fastener defects, (iii) The methodology for identifying fastener flaws
In this paper, real-time automatic identification of track defects based on ABVA is studied. Table 1 illustrates the division of the TSS (track service state) into ten distinct groups based on the various typical problems found in the track system.

This study has to overcome the following issues to implement the automatic detection of typical track flaws in real-time. Firstly, the vehicle-railroad connection system’s vibration dynamics are analyzed and it is examined if track flaws (fastening defects as an example) cause vibrations to be transferred to the wheelset system. Secondly, the ABVA including track defects information is obtained for the training of the detection algorithm. Finally, an automatic detection algorithm based on a deep learning network model is established to learn the mapping relationship between typical track defects and corresponding axle-box vibration response.
3 The Wheel-Rail System’s Vibration Dynamics under Track Defects
This part examines the wheelset dynamics with track flaws using a comprehensive dynamical model of the vehicle-track interaction. Simplify the track and the vehicle to a multi-rigid body system and a free-ended Euler Bernoulli beam, respectively. Here, the deteriorated fasteners are considered a typical track defect, and their stiffness and damping coefficients are adjusted within a certain range to characterize their deterioration in this model. In this paper, using the integrated track as an example, we thoroughly describe the pertinent T60 rail and DTVI2 fastener parameters and examine the impact of fastener faults on rail vibration. The research is carried out under the condition that the radius of the orbit curve is 300 m and the superelevation of the outer orbit is 0.1 m. With the help of MATLAB language, the analytical solution of the power transmission of the wheel-rail system can be achieved by analyzing the vibration response of the wheelset induced by typical track flaws; the specific calculation process and result analysis have been detailed in our prior results [38].
3.1 Dynamics of Tracks with Fastener Flaws
Rolling contact exists between the wheel and the rail. The displacement of vibration caused by the wheel-rail force at the wheel-rail contact point and a frequency domain representation of the rail as
The rail support’s flexibility matrix, denoted by
where
where
The equation that determines the vibrations caused by a moving unit load is as follows [40], where the wheel-rail contact forces in radial, vertical, and longitudinal directions are considered.
where
The details regarding this computing method are provided in our previous paper [39], from the above calculation, it is known that after determining the track parameters, the track flexibility matrix
3.2 Dynamics of Wheelsets with Fastener Flaws
For a single subway vehicle, the car body, two bogie frames, and four wheelsets, i.e., a total of 7 rigid-body parts are generally considered. The frequency domain vibration displacement induced by the wheel-rail force on the wheelset is given by the following equation:
where
Research reveals that the flexibility matrix depends only on the vehicle characteristics and that the wheel-rail force limits the wheelset
The wheel-rail force can be calculated using the following formula:
Extracting
In this context,
By using the comprehensive computation procedure outlined in our earlier publication [39], the wheelset’s frequency domain displacement can be obtained as
Eq. (12) shows that the performance of the fastener directly affects the track flexibility matrix
4 Dynamic Simulation of Vehicle-Track System with Track Defects
This section creates a detailed dynamic model of the vehicle-rail coupling and analyzes the axle box’s dynamic response to track problems. The axle box’s vibration response characteristics under various track faults are thoroughly explained in the fifth section. The modeling of these common track problems is the primary contribution.
4.1 Model of Vehicle-Track Dynamics Interaction
Using the multibody system dynamics modeling tool Universal Mechanism (UM) [41], we created the vehicle-rail coupling model. The track and the highway slab in this model, which is displayed in Fig. 2, are represented by finite element theory, with the vehicle connected to the track via the FASTSIM wheel-rail contact model [42]. This paper initially employed finite element software for the modeling of elastic rails. It considers a two-layer track structure consisting of steel rails and a unified track bed, concerning common track structures found in rail transit lines in China.

Figure 2: The vehicle-track dynamics coupling model
In this model, the track has a total length of 92.5 m and is divided into three parts. The track slab and the track built by finite element software are 12.5 m long. The rails on both sides of the track are extended by 40 m in the simulation environment as the rail model boundary. The track is a curved structure with a radius of 300 m, and the outer track is 100 mm super high. The typical track defects loaded in this model are set in the track finite element part. The detection signal is characterized as the vibration acceleration recorded at the inner axle box of the first wheel axle located within the first bogie. The bottom of the track plate and fasteners are divided and simulated using multiple rows of rigid damping force units. The variance in the rail is interpreted as a stochastic excitation of white noise with frequency components ranging from 2–2000 Hz. Regarding the accuracy of the UM simulation model, we compared the accuracy of the model based on the theoretical analysis results in our previous research results [38]. In this paper, the type of track disease was added on the basis of the previous research, so the model verification was not repeated.
4.2 Simulation Model of Track Defects
The vertical-longitudinal profile of rail local squats is very close to the sinusoidal waveform. Two profile parameters need to be set during simulation, namely, the maximum collapse length and the maximum depression depth. The typical profile of local squats can be fitted as follows [22,33]:
where
Adjusting the maximum length and depth of local squats to generate the vertical-longitudinal profile of rail local squats. The transverse coordinates of each wheel-rail contact point corresponding to different wear depths are obtained by the calculation of rail superimposed wear. The vertical-longitudinal profile of the rail squats is divided into a limited number of micro-segments along the longitudinal direction with sufficiently small intervals, and the horizontal coordinate of the wheel-rail contact point in the micro-segment is merged with its vertical-longitudinal profile. The three-dimensional distribution of the local squats on the rail surface can be obtained, and the modeling process of rail squats is shown in Fig. 3. The rail squats defects with a three-dimensional profile are set in the rail 3D model. After that, this rail model meshes with the help of ANSYS, which is imported into the dynamic simulation model illustrating the coupling between the vehicle and the track, as depicted in Fig. 2.

Figure 3: Modeling process of rail squats
The vertical-longitudinal profile of the typical corrugation can be modeled by Eq. (14) [21].
where
In order to calculate profiles, this paper introduces typical short-wave corrugation (wavelength of 30 mm and wave depth of 0.1 mm), medium-wave corrugation (wavelength of 100 mm and wave depth of 0.2 mm), and long-wave corrugation (wavelength of 200 mm and wave depth of 0.3 mm) [43]. The aforementioned modeling technique involves the three-dimensional modeling of rail corrugation in various grades, which are then progressively added to the three-dimensional rail model for the purpose of creating finite element meshes using ANASYS. Finally, the dynamic simulation model of the vehicle-track connection incorporates this rail model into the 40–50 m track section.
The above modeling principle is introduced to simulate the rail low joint defects, and the cosine function in Eq. (15) is used to simulate the typical rail low joint profile [44].
where
The maximum extension length of the low rail joint is about 0.4 m, and the maximum sinking depth is 3 mm. Considering that the vertical-longitudinal profile shape of the rail low joint is suitable for the transverse section of the entire rail, the vertical-longitudinal profile is extended horizontally. Then it is introduced into the rail 3D model for the finite element meshing operation as mentioned above.
The longitudinal length of the high joint weld is about 0.5 m, and the weld crest is about 1.5 mm higher than the top surface of the standard rail. On the other hand, the longitudinal area of the low weld irregularity is longer, which is about 0.5–0.7 m, and the weld is lower than the standard rail surface by up to 1.85 mm. The vertical-longitudinal profile of weld irregularity can be approximately described by cosine waveform and can be fitted with the aid of Eq. (16) [45]. In the simulation model of this paper, the length of the weld area is 400 and 600 mm, and the maximum depth of wave crest and trough is 1.5 mm. The specific modeling process is the same as above, and not repeated here.
where
5 Response Features of the Axle-Box Vibration with Track Defects
With the help of the above simulation model, the vibration acceleration signals of the axle box with the typical track defects are obtained. The characteristics of track defects are retained while the interference vibration caused by noise excitation is minimized by using the coherent averaging method [46]. The discrete wavelet transform (DWT) is performed on the ABVA to analyze the response characteristics of the detection signal in the time-frequency domain.
Based on the classification of track service states in Table 1, this paper only takes the characteristic responses of axle-box vibration of four typical track states such as track with local squats (TSS2), track with rail joints (TSS4), track with welding irregularity (TSS6) and track with joint squats as well as fastener defects (TSS10) as examples for illustration.
5.1 Response Features of the Axle-Box Vibration with Rail Squats
The maximum length of local rail squats is 15, 30, and 70 mm, and the maximum wear depth is 0.3 mm. The dynamic simulation models of track I, track II, and track III with squats are established, respectively. Fig. 4 shows the wavelet power spectrum of the axle-box acceleration in four different operating conditions.

Figure 4: Wavelet spectrum of axle-box vibration with different rail squats
It shows that rail squats cause a strong vibration response of the axle box. For example, the wavelet power spectrum amplitude of the axle-box vibration acceleration with the normal track is only 0.3–1.8
Furthermore, the wavelet spectrum efficiently displays the vibration signal’s frequency distribution. The axle-box vibration response for the standard track exhibits a considerable degree of unpredictability. On the other hand, a wide frequency band is stimulated by rail squats for the axle-box vibration response, and the high energy response frequency resulting from varying degrees of rail squats corresponds to various frequency bands within the 300–1200 Hz range.
5.2 Response Features of the Axle-Box Vibration with Rail Joint Defects
Fig. 5 illustrates how rail joint flaws exacerbate the vehicle’s vibration response. Axle-box vibration resulting from rail joint problems has a maximum response frequency of 500 to 1200 Hz. The vibration response of the axle box is superimposed with the vibration response of the rail squat when it happens in the position of the rail joint. The axle-box vibration response frequency gradually approaches 500–800 Hz as the squat size grows.
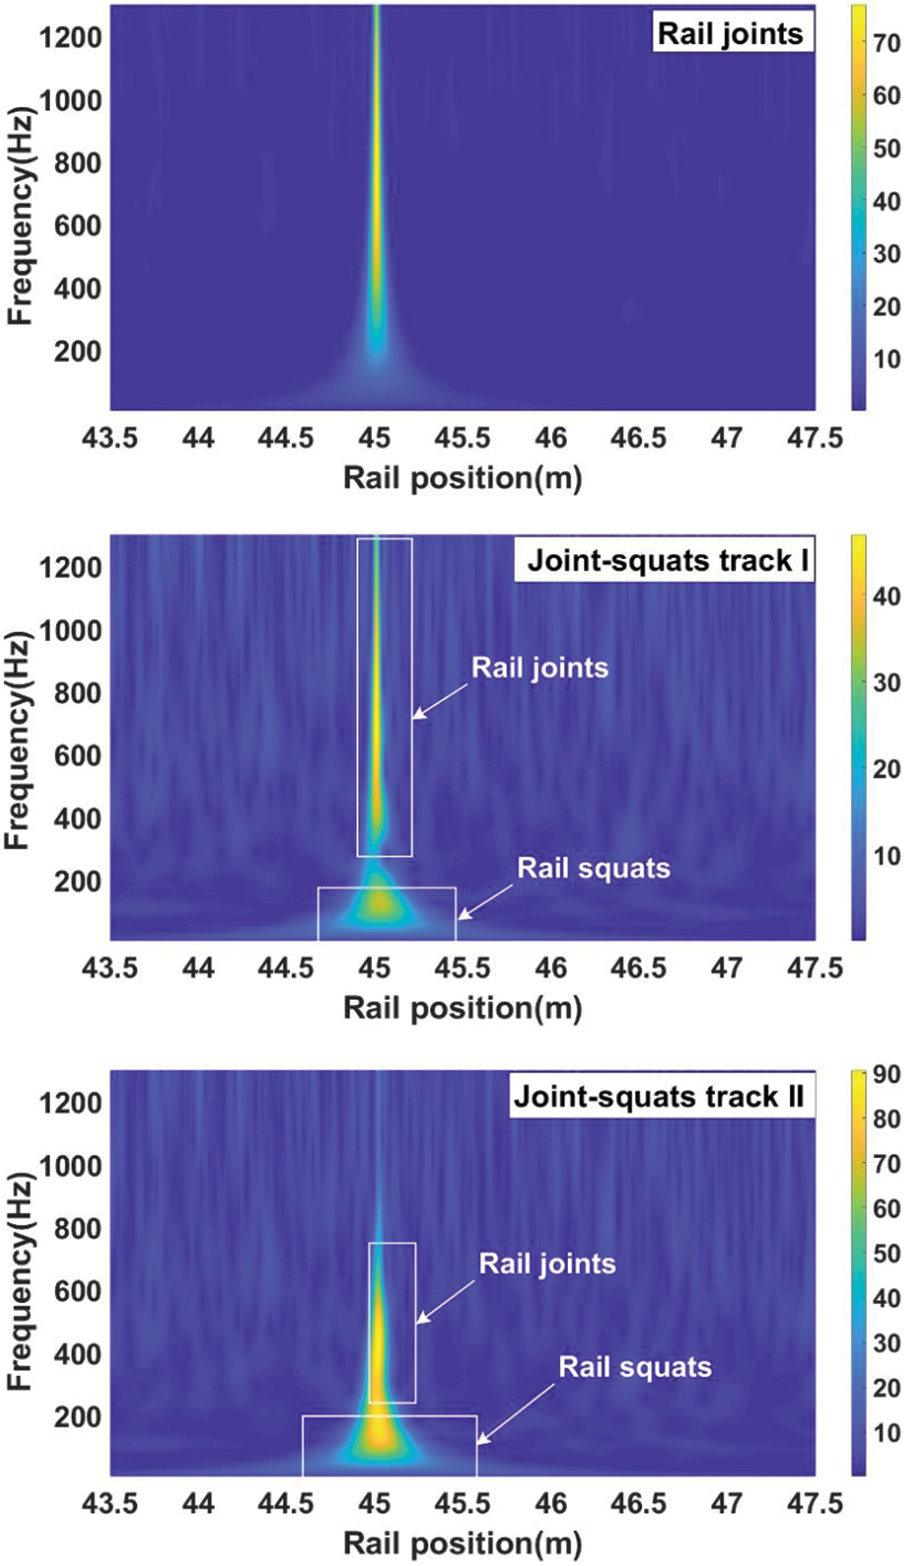
Figure 5: Wavelet spectrum of axle-box vibration with different joints defects
5.3 Axle-Box Vibration Response Characteristics When Rail Joint Problems Are Present
Fig. 6 shows the wavelet spectrum of the axle box acceleration when the vehicle is running through the high and low welding area of the track.

Figure 6: Wavelet spectrum of axle-box vibration with different thermite welds
It shows that the vibration response of the axle box caused by the rail’s high and low weld irregularity is mainly in the low-frequency band (30–60 Hz), in which the vibration of the axle box excited by the high weld irregularity is concentrated in the 40–60 Hz. However, the primary vibration response frequency associated with the rail’s low weld irregularity is comparatively lower, ranging from 30 to 50 Hz.
5.4 Response Characteristics of the Vibration Axle-Box with Rail and Fastener Flaws
Three typical track conditions are introduced, which refer to track I with rail corrugation and fastener defects, track II with joint defects and fastener defects, and track III with rail joint and squats as well as fastener defects, respectively. Fig. 7 illustrates how various track flaws lead to the axle box’s vibration response at a specific frequency. They are comparable to the high-low joint weld irregularity on the rail and the response to vibration of the axle box due to fastener failures. The low-frequency range of 40–60 Hz is where the vibration response is concentrated, and its continuous range is roughly 0.5–0.7 m. Furthermore, compared to the axle box directly aroused by rail joint flaws, the amplitude of vibration response resulting from fastener problems is substantially reduced.

Figure 7: Wavelet spectrum of axle-box vibration with different track defects
In summary, the wavelet power spectrum of the axle box vibration acceleration reflects the impact and time-frequency characteristics of different track defects, but only relying on it for track defects identification and detection has the following shortcomings: (1) It is impossible to effectively distinguish fastener defects from track weld irregularity; (2) It is difficult to detect and identify the track condition where the rail joints defects are superimposed with fastener defects; (3) It is impossible to effectively extract the subdivision frequency information related to different defects in complex detection signals, and realize effective denoising processing.
To address these issues, we introduce a deep convolution neural network to learn the mapping relation between the ABVA and the track defects, and to detect such weak differences between the dynamic responses of the axle-box caused by the damaged and the intact track system to classify the types of track defects.
6 Track Defects Recognition Based on CNN
Through simulations, 8250 sets of sample data are produced, with the axle box vibration signal’s spectrum image acting as the network’s input feature. Using a random sampling technique, the wavelet spectrum data of axle box acceleration with various track faults in the dataset were split into training and test sets in the proportions of 80% and 20%.
Commonly used neural networks include Feed forward neural networks (FF or FFNN) and perceptrons (P), Hopfield networks (HN), and Convolutional neural networks (CNN or DCNN). In a convolutional neural network, there are three components. The input layer is the initial component. Pooling layers and n-convolution layers make up the second section. A fully connected multi-layer perceptron classifier makes up the third section. This is a unique deep neural network model, and it is unique in two ways: first, some of the connections between neurons in the same layer share weights, and second, there are some incomplete connections between neurons. Its network structure, which minimizes the number of weights and network model complexity, is more akin to a biological brain network due to its imperfect connections and weight sharing. A deep convolutional neural network is an extension of the convolutional neural network, which has more convolutional layers and pooling layers, so it can extract image features better. Deeper networks are able to learn more complex features, which improves classification accuracy.
The deep learning network used in this work is based on the concept of connected convolutional kernels, and it is structurally very similar to the VGG16 network [47]. Table 2 displays the network architecture, with

The network architecture comprises 11 layers interconnected by concatenated convolution blocks and pooling layers, consisting of 3 fully connected layers and 4 convolutional layers. Interestingly, there are eight convolutional layers in the network structure, using a smaller convolutional kernel size of 3 × 3, and the step size is set to 1. In addition, the network contains three maximum pooling layers, all of which are 2 × 2 in size and set to 2 in step. In terms of fully connected layers, the dimensions of the first two are 256 × 256, and the dimensions of the third are 256 × 10. The network model has the advantage of being lower in size and provides efficient nonlinear feature extraction in addition to having a fully linked layer. To improve the generalization ability of the network and avoid overfitting, the dropout regularization [4,48] and
The network model is tested based on the test samples, and the confusion matrix shown in Table 3a is obtained. It shows that the recall and precision of 10 different categories of track service status are all higher than 92.1%, indicating that for all working conditions in which track defects occur, more than 93.3% of the defects can be detected accurately with the help of the deep learning network. Among them, the network model has the lowest recall rate for TSS7, which is 92.1%. The recall rates of the remaining nine types of service status are all higher than 95.34%. This is primarily because when a fastener defect occurs in the track system, the vibration response frequency of the axle box excited by the fastener is primarily focused in the 40–60 Hz range, and the vibration response time history is about the length of the sleeper spacing, which is very similar to the vibration response caused by the track welding irregularity. Therefore, misclassification can be caused when the wavelet spectrum of the axle box acceleration is used as the feature input of the network model. More importantly, limited by the number of samples used for network model training in this paper, the detection accuracy of TSS7 is lower.

The findings demonstrate that the network model put forward in this work has a positive impact on track service state detection. The network model’s prediction accuracy and overall prediction accuracy for various track circumstances are displayed in Table 3b. It demonstrates that the model created by the suggested deep learning network approach has a prediction accuracy of 95.98% on the test set, with the TSS7 track state having the lowest prediction accuracy at just 93.85%.
To sum up, with the help of a series convolution neural network, the accuracy of detecting track defects with axle box vibration response as detection signal is as high as 95.98%. Taking into account the number of samples used for network model training, the prediction accuracy presented by the network model in this paper is slightly lower. However, its recall rate and accuracy rate indicators both show that the model has a good predictive classification effect. If enough axle-box vibration data can be obtained for the training of the network model, the prediction accuracy of the network model will inevitably be improved. Therefore, the method proposed in this paper can be used for the detection of track defects in the future.
In this paper, an intelligent identification and detection method of track defects based on the wavelet spectrum of axle box acceleration and series convolution neural network model is proposed. Taking the rail squats, rail corrugation, rail joint defects, rail welding irregularity, and fastener defects as typical track defects, the service state of the track system is divided into 10 categories. By using deep learning technology, the operating conditions of 10 different types of track service status are classified and detected. The results show that the detection method proposed in this paper can realize effective detection of track defects, and its prediction accuracy rate is 95.98%. In this research, a vibration-based detection method is presented to overcome the limitations of the image-based detection method and provide real-time detection of invisible damage on the track system. As such, it can be applied in addition to the vision-based approach for track defect identification, thereby improving the level of comprehensive monitoring and maintenance of the track system. Section 5 of this paper lacks the use of real data to verify the correctness of features, which is also a shortcoming of our paper. We will continue to improve this part in the future.
Acknowledgement: Thanks to the State Key Laboratory of Rail Traffic Control and Safety, Beijing Jiaotong University, and the Natural Science Foundation of Shandong Province for their support.
Funding Statement: This work was supported by the Doctoral Fund Project (Grant No. X22003Z).
Author Contributions: The authors of this paper are as follows: Research conception and design: Xianxian Yin, Xiukun Wei; Data collection: Xianxian Yin, Yiming Bu; analysis and interpretation of results: Xianxian Yin; first draft preparation: Xianxian Yin, Shimin Yin. All authors reviewed the results and approved the final version of the manuscript.
Availability of Data and Materials: The authors will supply the relevant data in response to reasonable requests.
Conflicts of Interest: The authors declare that they have no conflicts of interest to report regarding the present study.
References
1. Zhao YF, Gao C, Wang JG. Research on machine vision based industrial product surface defect detection algorithm. Comput Appl Sw. 2012;29(2):158–4. [Google Scholar]
2. Jiang LZ, Lei W, Wang J, Yang XF. System for evaluating precision of radar angular measuring based on machine vision. Comput Meas Ctrl. 2014;22(9):2842–3. [Google Scholar]
3. Min YZ, Xiao BY, Dang JW, Yin C, Yue B. Machine vision rapid detection method of the track fasteners missing. J Shanghai Jiaotong Univ. 2017;51(10):1268–72 (In Chinese). [Google Scholar]
4. Xu P, Liu BL, Chen YX. Railway crack detection method based on differential flexible eddy current probe. China Mech Eng. 2023;34(20):2419–27 (In Chinese). [Google Scholar]
5. Wei XK, Yang ZM, Liu YX, Wei DH, Jia LM. Railway track fastener defect detection based on image processing and deep learning techniques: a comparative study. Eng Appl Artif Intel. 2020;80:66–81. [Google Scholar]
6. Cui H, Li J, Hu QW, Mao QZ. Real-time inspection system for ballast railway fasteners based on point cloud deep learning. IEEE Access. 2019;8:61604–14. doi:10.1109/ACCESS.2019.2961686. [Google Scholar] [CrossRef]
7. Han Q, Wang SC, Fang Y, Wang L, Du XY. A rail fastener tightness detection approach using multi-source visual sensor. Sensors. 2020;20(5):1367–89. doi:10.3390/s20051367. [Google Scholar] [PubMed] [CrossRef]
8. Zhan Y, Dai XX, Yang EH, Wang KCP. Convolutional neural network for detecting railway fastener defects using a developed 3D laser system. Int J Rail Transp. 2021;9(5):424–44. doi:10.1080/23248378.2020.1825128. [Google Scholar] [CrossRef]
9. Hsieh CC, Lin YW, Tsai LH, Huang WH, Hsieh SL. Offline deep-learning-based defective track fastener detection and inspection system. Sens Mater. 2020;32(10):3429–42. doi:10.18494/SAM.2020.2921. [Google Scholar] [CrossRef]
10. Yao DC, Sun Q, Yang JW, Liu HC, Zhang J. Railway fastener fault diagnosis based on generative adversarial network and residual network model. Shock Vib. 2020;2020:1–15. doi:10.1155/2020/8823050. [Google Scholar] [CrossRef]
11. Ma AQ, Lv ZM, Chen XJ, Li LM, Qiu YJ. Pandrol track fastener defect detection based on local convolutional neural networks. P I Mech Eng I-J Sys. 2021;235(10):1906–15. doi:10.1177/0959651820953679. [Google Scholar] [CrossRef]
12. Liu JD, Li L, Ma XC, Liu Y, Qi XM, Zhang SW. On-board automated track inspection device of urban rail transit vehicles. E Loc Mass Trans V. 2014;37(6):54–6 (In Chinese). [Google Scholar]
13. Hong XJ. Application of rational order differential in crack detection system for track slab. Railw Eng. 2017;6(520):140–4. [Google Scholar]
14. Min YZ, Cheng TD, Ma HF. Rail surface defect recognition method based on multi feature fusion and adaboost algorithm. J Railw Sci Eng. 2017;14(12):2554–62. [Google Scholar]
15. Alippi C, Ettore C, Fabio S, Vincenzo P. Composite real-time image processing for railways track profile measurement. IEEE T Instrum Meas. 2000;49(3):559–64. doi:10.1109/19.850395. [Google Scholar] [CrossRef]
16. Song SQ. Research on track disease identification based on vehicle response (Ph.D. Thesis). Southwest Jiaotong University: China; 2018. [Google Scholar]
17. Kang GQ, Li CM, Qin LJ. Rail corrugation detection method based on laser imaging technology. Urban Mass Trans. 2017:84–7 (In Chinese). [Google Scholar]
18. Zhan D, Yu L, Xiao J, Chen TL. Research on measurement method of rail wear cross-sectional area based on laser camera technology. J Rail. 2014;36(4):32–7. [Google Scholar]
19. Wang B, Hu ZS, Jin LX, Wei QC, Feng Z. Existing railway line survey using GPS. J Beijing Jiaotong Univ. 2006;30(1):44–6 (In Chinese). [Google Scholar]
20. Li D, Meddah A, Hass K, Kalay S. Relating track geometry to vehicle performance using neural network approach. P I Mech Eng F-J Rai. 2006;220(3):273–81. [Google Scholar]
21. Marija M, Li ZL, Rolf D. Axle box acceleration: measurement and simulation for detection of short track defects. Wear. 2010;271(12):349–56. [Google Scholar]
22. Li ZL, Zhao X, Coenraad E, Rolf, Marija M. An investigation into the causes of squats correlation analysis and numerical modeling. Wear. 2008;265(9–10):1349–55. doi:10.1016/j.wear.2008.02.037. [Google Scholar] [CrossRef]
23. Maria M, Li ZL, Alfredo N, Rolf D. Validation of a finite element model for axle box acceleration at squats in the high frequency range. Comput Struct. 2014;141(1):84–93. doi:10.1016/j.compstruc.2014.05.005. [Google Scholar] [CrossRef]
24. Oregui M, Li Z, Dollevoet R. Identification of characteristic frequencies of damaged railway tracks using field hammer test measurements. Mech Syst Signal Pr. 2015;54–55:224–42. doi:10.1016/j.ymssp.2014.08.024. [Google Scholar] [CrossRef]
25. George L, Chen SH, James HG, Jelena K, Hae YN, Jacobo B. Track monitoring from the dynamic response of an operational train. Mech Syst Signal Pr. 2017;87:1–16. doi:10.1016/j.ymssp.2016.06.041. [Google Scholar] [CrossRef]
26. Huang W, Gao XD, Wang FG, Xing ZY. Track surface sag detection based on wavelet energy spectrum. J Guangxi Uni (Nat Sci Ed). 2016;41(6):1890–8 (In Chinese). [Google Scholar]
27. Sun YQ, Dhanasekar M. A dynamic model for the vertical interaction of the rail track and wagon system. Int J Solids Struct. 2002;89(2):169–72. [Google Scholar]
28. Farrar CR, Doebling SW, Nix DA. Vibrationbased structural damage identification. Philo T R Soc B. 2001;359(1778):131–49. doi:10.1098/rsta.2000.0717. [Google Scholar] [CrossRef]
29. Lundqvist A, Dahlberg T. Load impact on railway track due to unsupported sleepers. P I Mech Eng F-J Rai. 2005;219(2):67–77. doi:10.1243/095440905X8790. [Google Scholar] [CrossRef]
30. Kaewunruen S, Remennikov MA. Investigation of free vibrations of voided concrete sleepers in railway track system. P I Mech Eng F-J Rai. 2007;221(4):495507. doi:10.1243/09544097JRRT141. [Google Scholar] [CrossRef]
31. Weston P, Roberts C, Yeo G, Stewart E. Perspectives on railway track geometry condition monitoring from in-service railway vehicles. Vehicle Sys Dyn. 2015;53(7):1063–91. doi:10.1080/00423114.2015.1034730. [Google Scholar] [CrossRef]
32. Oregui M, Li S, Nunez A, Li Z, Carroll R. Monitoring bolt tightness of rail joints using axle box acceleration measurements. Struct Control Hlth. 2017;24(2):e1848. doi:10.1002/stc.1848. [Google Scholar] [CrossRef]
33. Wei XK, Yin XX, Hu YD, He YF, Jia LM. Squats and corrugation detection of railway track based on time-frequency analysis by using bogie acceleration measurements. Vehicle Sys Dyn. 2020;58:1–22. doi:10.1080/00423114.2019.1610181. [Google Scholar] [CrossRef]
34. Osama A, Onur A, Serkan K, Moncef G, Daniel JI. Real-time vibration-based structural damage detection using one-dimensional convolutional neural networks. J Sound Vib. 2017;388:154–70. doi:10.1016/j.jsv.2016.10.043. [Google Scholar] [CrossRef]
35. Wu Y, Qin Y, Qian Y, Guo F, Wang ZP, Jia LM. Hybrid deep learning architecture for rail surface segmentation and surface defect detection. Comput-Aided Civ Inf. 2021;37(2):227–44. doi:10.1111/mice.12710. [Google Scholar] [CrossRef]
36. Guo F, Qian Y, Wu Y, Leng Z, Yu H. Automatic railroad track components inspection using real-time instance segmentation. Comput-Aided Civ Inf. 2020;36(3):362–77. doi:10.1111/mice.12625. [Google Scholar] [CrossRef]
37. Wu Y, Meng F, Qin Y, Qian Y, Xu F, Jia L. UAV imagery based potential safety hazard evaluation for high-speed railroad using real-time instance segmentation. Adv Eng Inform. 2023;55:101819. doi:10.1016/j.aei.2022.101819. [Google Scholar] [CrossRef]
38. Yin XX, Wei XK, Zheng HC. Railway track vibration analysis and intelligent recognition of fastener defects. Adv Theor Simul. 2022;5(10):2200027. doi:10.1002/adts.202200027. [Google Scholar] [CrossRef]
39. Du LL. Study on the theoretical model of coupled vehicle & track and the characteristics of vibration sources in a curved track (Ph.D. Thesis). Beijing Jiaotong University: China; 2018. [Google Scholar]
40. Du LL, Liu WN, Liu WF, Ma LX. A study on curved track dynamic response under a fixed harmonic load. J Vib Shock. 2017;36(20):233–9+247 (In Chinese). [Google Scholar]
41. Viačeslav P. Simulation of railway vehicle dynamics in universal mechanism software. Procedia Eng. 2016;134:23–9. doi:10.1016/j.proeng.2016.01.033. [Google Scholar] [CrossRef]
42. Kalker JJ. Simulation of the development of a railway wheel profile through wear. Wear. 1991;150:355–65. doi:10.1016/0043-1648(91)90329-S. [Google Scholar] [CrossRef]
43. Liu WF, Liu WN, Wu ZZ, Zhang HG. Test study on treating rail corrugation for egg fastener in Beijing metro. J Mech Eng. 2015;51(21):73–9. [Google Scholar]
44. Markine VL, De Man AP, Esveld C. Identification of dynamic properties of a railway track. In: IUTAM Symposium on Field Analyses for Determination of Material Parameters Experimental and Numerical Aspects; 2003 Jul 31–Aug 4; Kiruna, Sweden, Abisko National Park. [Google Scholar]
45. Li ZL, Maria M, Alfredo N, Rolf PBJD. Improvements in axle box acceleration measurements for the detection of light squats in railway infrastructure. IEEE T Ind Electron; 2015;62(7):4385–97. [Google Scholar]
46. Simonyan K, Zisserman A. Very deep convolutional networks for large-scale image recognition. In: The 3rd International Conference on Learning Representations; 2015 Apr 10; San Diego, CA, USA. [Google Scholar]
47. Geoffrey EH, Nitish S, Alex K, Ilya S, Ruslan S. Improving neural networks by preventing co-adaptation of feature detectors. Comput Sci. 2012;3(4):212–23. [Google Scholar]
48. Nitish S, Geoffrey EH, Alex K, Ilya S, Ruslan S. Dropout: a simple way to prevent neural networks from overfitting. J Mach Learn Res. 2014;15(1):1929–58. [Google Scholar]
Appendix A

Cite This Article
 Copyright © 2024 The Author(s). Published by Tech Science Press.
This work is licensed under a Creative Commons Attribution 4.0 International License , which permits unrestricted use, distribution, and reproduction in any medium, provided the original work is properly cited.
 Downloads
 Citation Tools