
 Submit a Paper
 Propose a Special lssue
 Open Access
ARTICLE

Investigation of the Effect of the Force Arm on the Bending Capability of Prestressed Glulam Beam
1 Department of Civil Engineering and Architecture, Wuyi University, Wuyishan, 354300, China
2 Experimental Forest Farm in Qingyuan County, Lishui, 323000, China
3 Fujian Zhuanghe Bamboo Industry Technology Co., Ltd., Nanping, 353000, China
4 Fujian Liuzheng New Materials Technology Co., Ltd., Nanping, 353000, China
* Corresponding Author: Yan Zhao. Email:
Structural Durability & Health Monitoring 2024, 18(5), 641-661. https://doi.org/10.32604/sdhm.2024.049601
Received 11 January 2024; Accepted 07 April 2024; Issue published 19 July 2024
 View Full Text
 Download PDF
Abstract
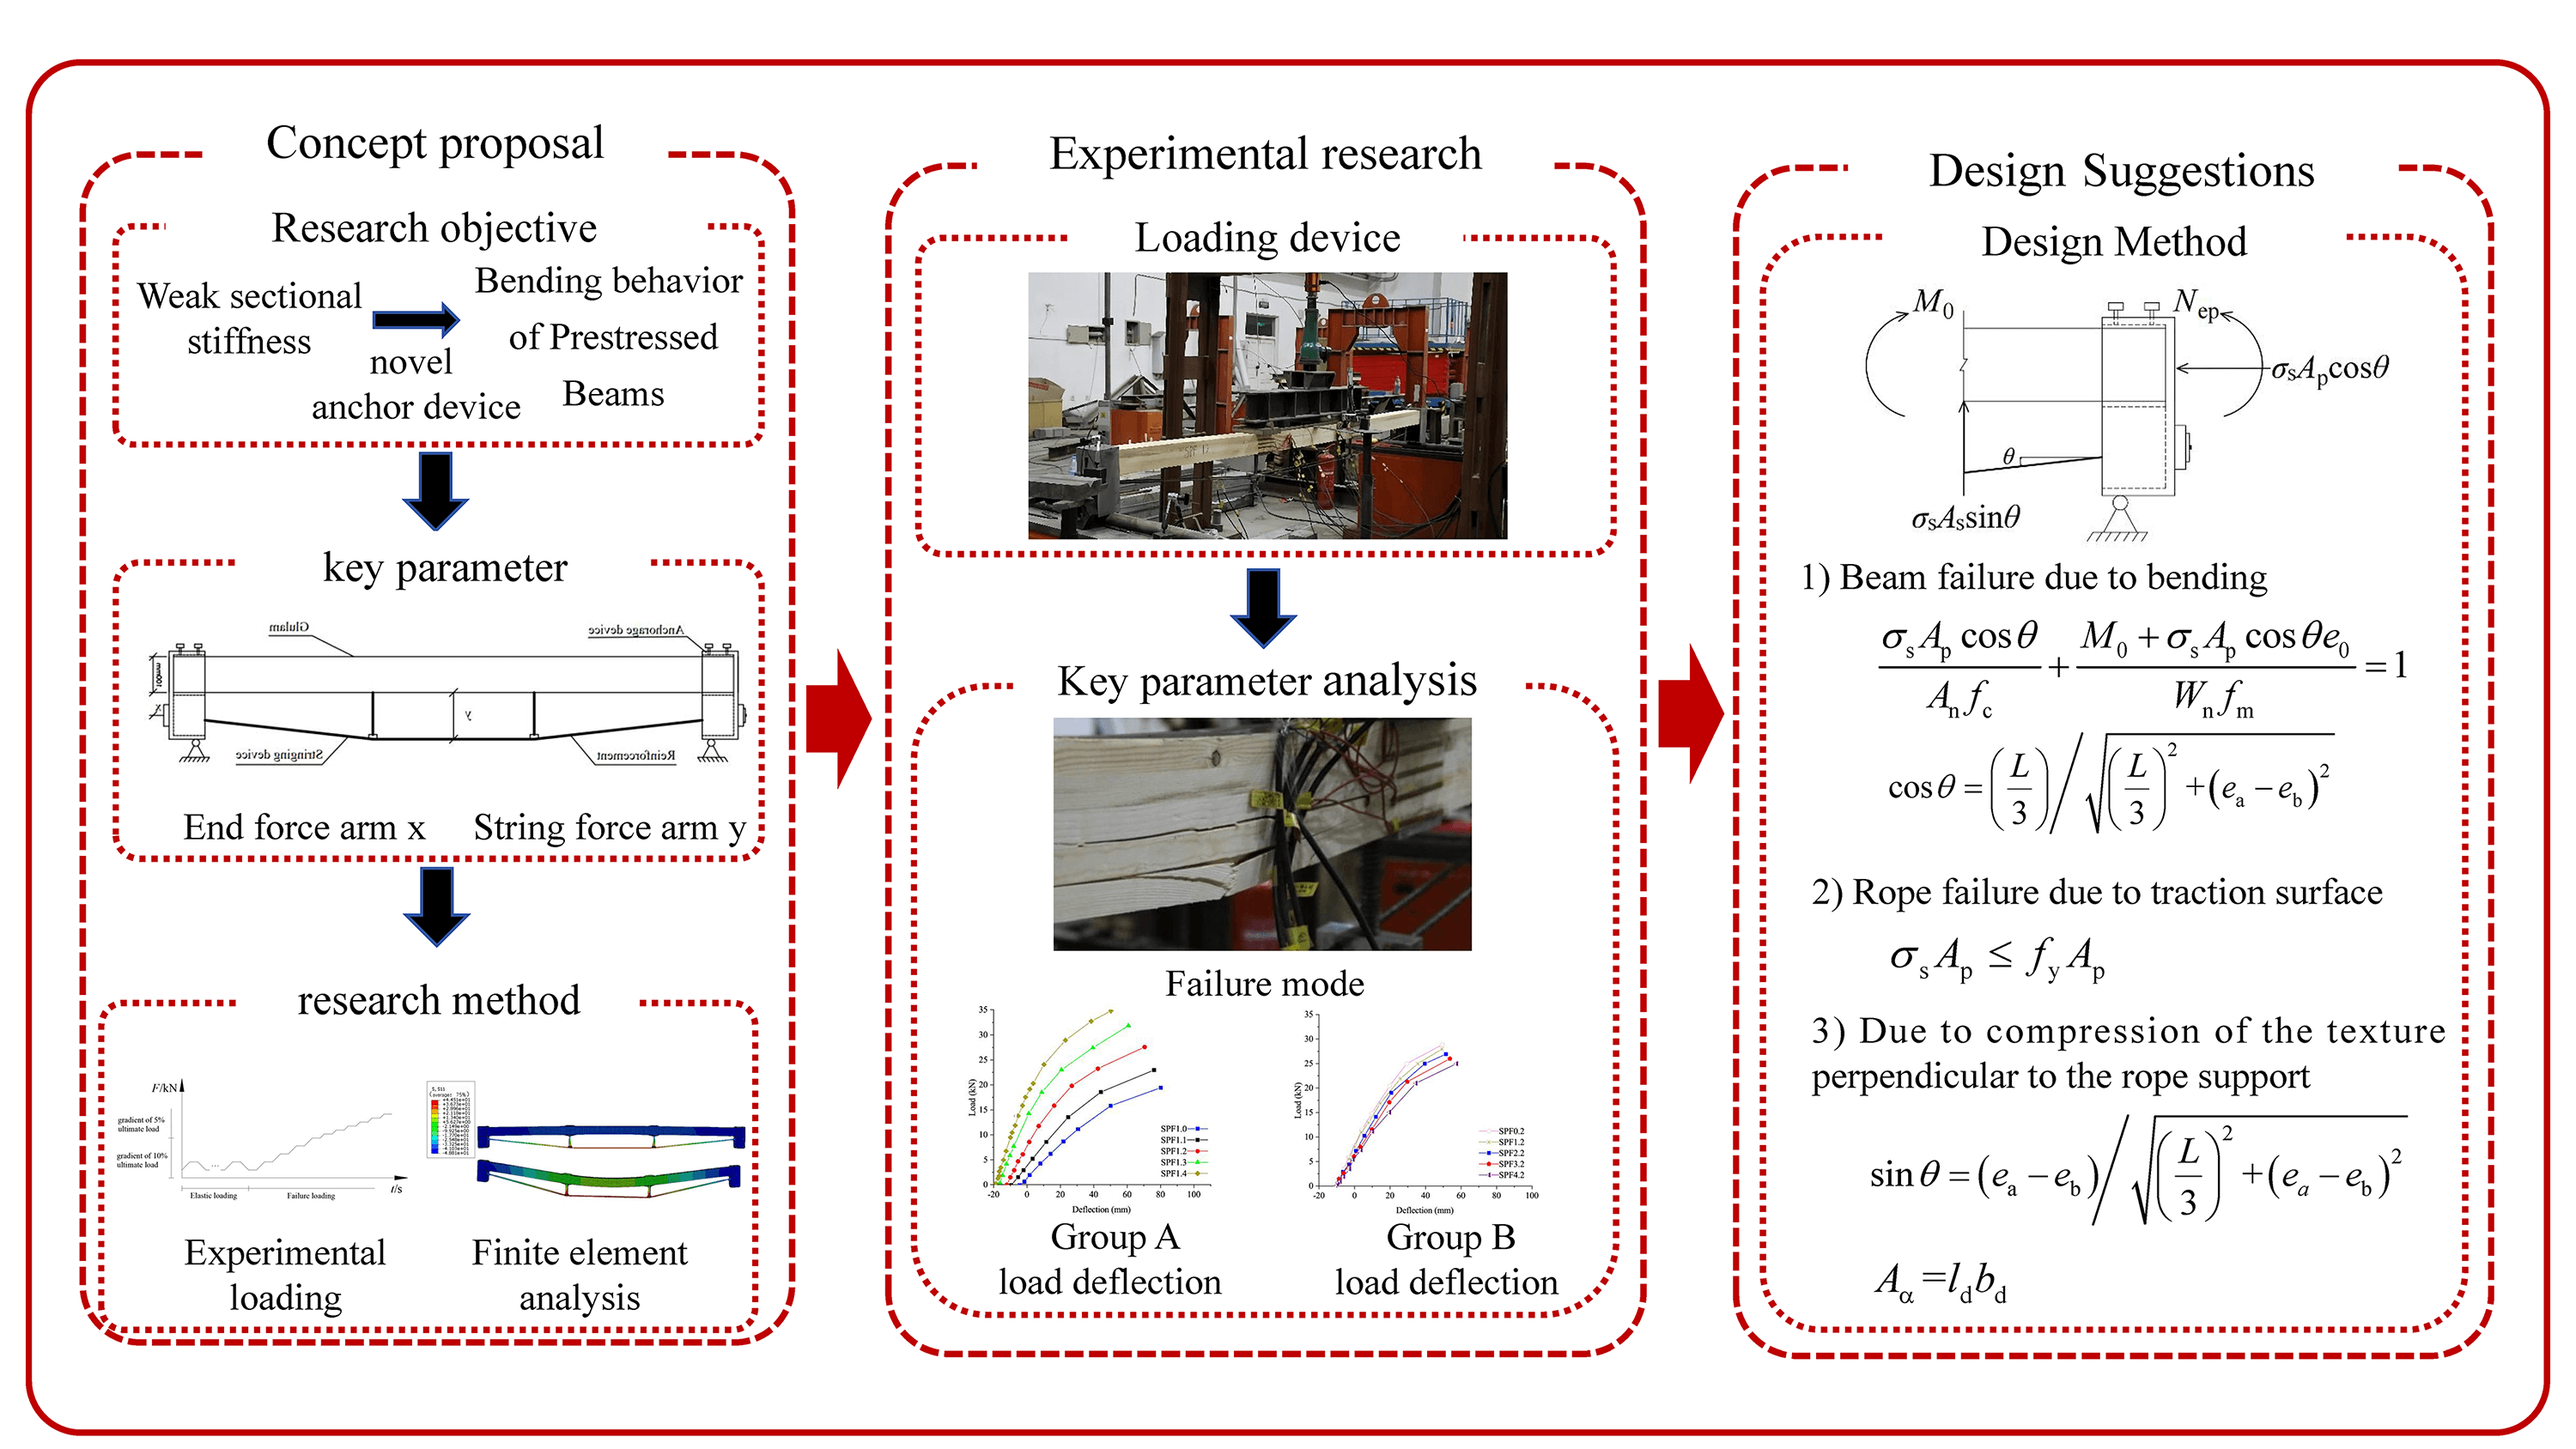
Prestress enables the Glulam beam could make full use of the compression strength, and then increase the span, but it still could not reduce all drawbacks, such as cross-section weakening and small force arm. To avoid slotting and ensure suitable tension and compression couple, one kind of novel anchor has been proposed, which could meet the bearing capacity requirement. And then the bending test of prestressed Glulam beams with a geometric scale ratio of 1: 2 was simulated, to investigate the effect of the force arm on bending capacities, failure modes, and deformation performance. Results show that increasing the force arm could improve the ultimate bending performance of the beam significantly, and the anchor arm length has a certain effect on the performance, but it is not obvious. Finally, based on Finite element method analysis, the practice design suggestions have been offered.Graphic Abstract
Keywords
Nomenclature
| Term1 | Interpretation 1 |
| Term 2 | Interpretation 2 |
| e.g. | |
| ⵁ | Porosity |
| s | Skin factor |
Traditional Glulam beams could not fully sue the material strength, so its failure modes tend to be a kind of brittle tensile failure, and its deformation is much more apparent [1–4]. However, the prestressed Glulam beam could fully utilize the material strength and extend the span, reducing the cost [5–7]. Based on previous investigations [8,9], the prestressing method that adjusting the bolt length to apply prestress has been proposed, results show that the method could improve the mechanical properties of the prestressed beam and then reduce the cost, but it still could not avoid weakening cross-section stiffness and small force arm. The prestressed Glulam beam obtains the prestress by adjusting the bolt length to a tensile steel bar [10]. Nowadays, the major research on the prestressed Glulam beam is about theoretical analysis and timber material selection, but the research on the force arm is few [11].
At present, domestic and foreign scholars have obtained the stress performance of glulam beams through experimental research, theoretical analysis, and finite element analysis [12,13]. However, due to the relatively low elastic modulus of Glulam, the stiffness of Glulam beams is small, and the span is limited. On the other hand, when Glulam beams are subjected to bending, brittle failure often occurs due to insufficient tensile strength of the bottom material, which affects the bearing capacity of the beam [14,15]. Therefore, domestic and foreign researchers have proposed using reinforcement materials to improve the bending performance of Glulam beams, including reinforcement, tension string reinforcement, fiber composite material reinforcement, etc. Reinforcement enhancement refers to slotting in glulam beams, placing steel bars or FRP bars, and then sealing them to form a whole [16,17]. In addition, reinforcement is added outside the glued timber beam to form glulam tension string beams [18,19]. Such studies mainly consider the influence of reinforcement form, reinforcement ratio, and prestressing on the bending performance of the beam. Fiber material reinforcement refers to the pasting of fiber cloth or fiberboard at the bottom of a beam, mainly studying the influence of fiber material layers, arrangement, and fiber types on the reinforcement effect [20–22].
The simplified constitutive model has been applied to the prestressed Glulam beam ABAQUS model. Until now, the main simplified model contains the anisotropic elastic constitutive model and the isotropic elastic-plastic constitutive model. Different research teams could select different models, for example, to investigate timber trans-verse striation stress and cracking performance, Zhu et al. applied the anisotropic elastic constitutive model. And he also applied it to study temperature and humidity stress in Glulam beams [23,24]. Besides, the model is also applied to investigate the timber elastic stage, as the timber is considered a transversely isotropic material during this stage [25]. The isotropic elastic-plastic constitutive model has also been utilized. The comparison results based on the prestressed Glulam beam with the two models and the anisotropic elastoplastic constitutive model show that the last model could better predict the real mechanical performance of the beam.
One kind of novel anchor device has been proposed, which could avoid cross-section stiffness weakness and then provide the maximal tension and compression couple to meet bearing requirements. Based on previous studies, a series of simulation models has been simulated to investigate the effect of the force arm on the bending performance, failure modes, and stiffness of the beam. The results show that increasing the length of the force arm could improve the bending performance noticeably, but adjusting the length of the anchor force arm has little positive effect. And then based on the experiments, some ABAQUS models were simulated, and design suggestions were also proposed.
The purpose of this part is to show detailed information on the proposed prestressed beam, including the material and its dimensions.
The dimension of the prestressed beam is 100 mm × 100 mm × 3150 mm, as shown in Fig. 1a, based on the GBT 26899-2011 and previous experiments. The clear span of the beam is 3000 mm, and the distance between the end of the beam and the support is 75 mm, as shown in Fig. 1b. The 1570 grade low relaxation prestressed steel wire with a diameter of 7 mm is selected. And the whole details of the beam are shown in Fig. 1.
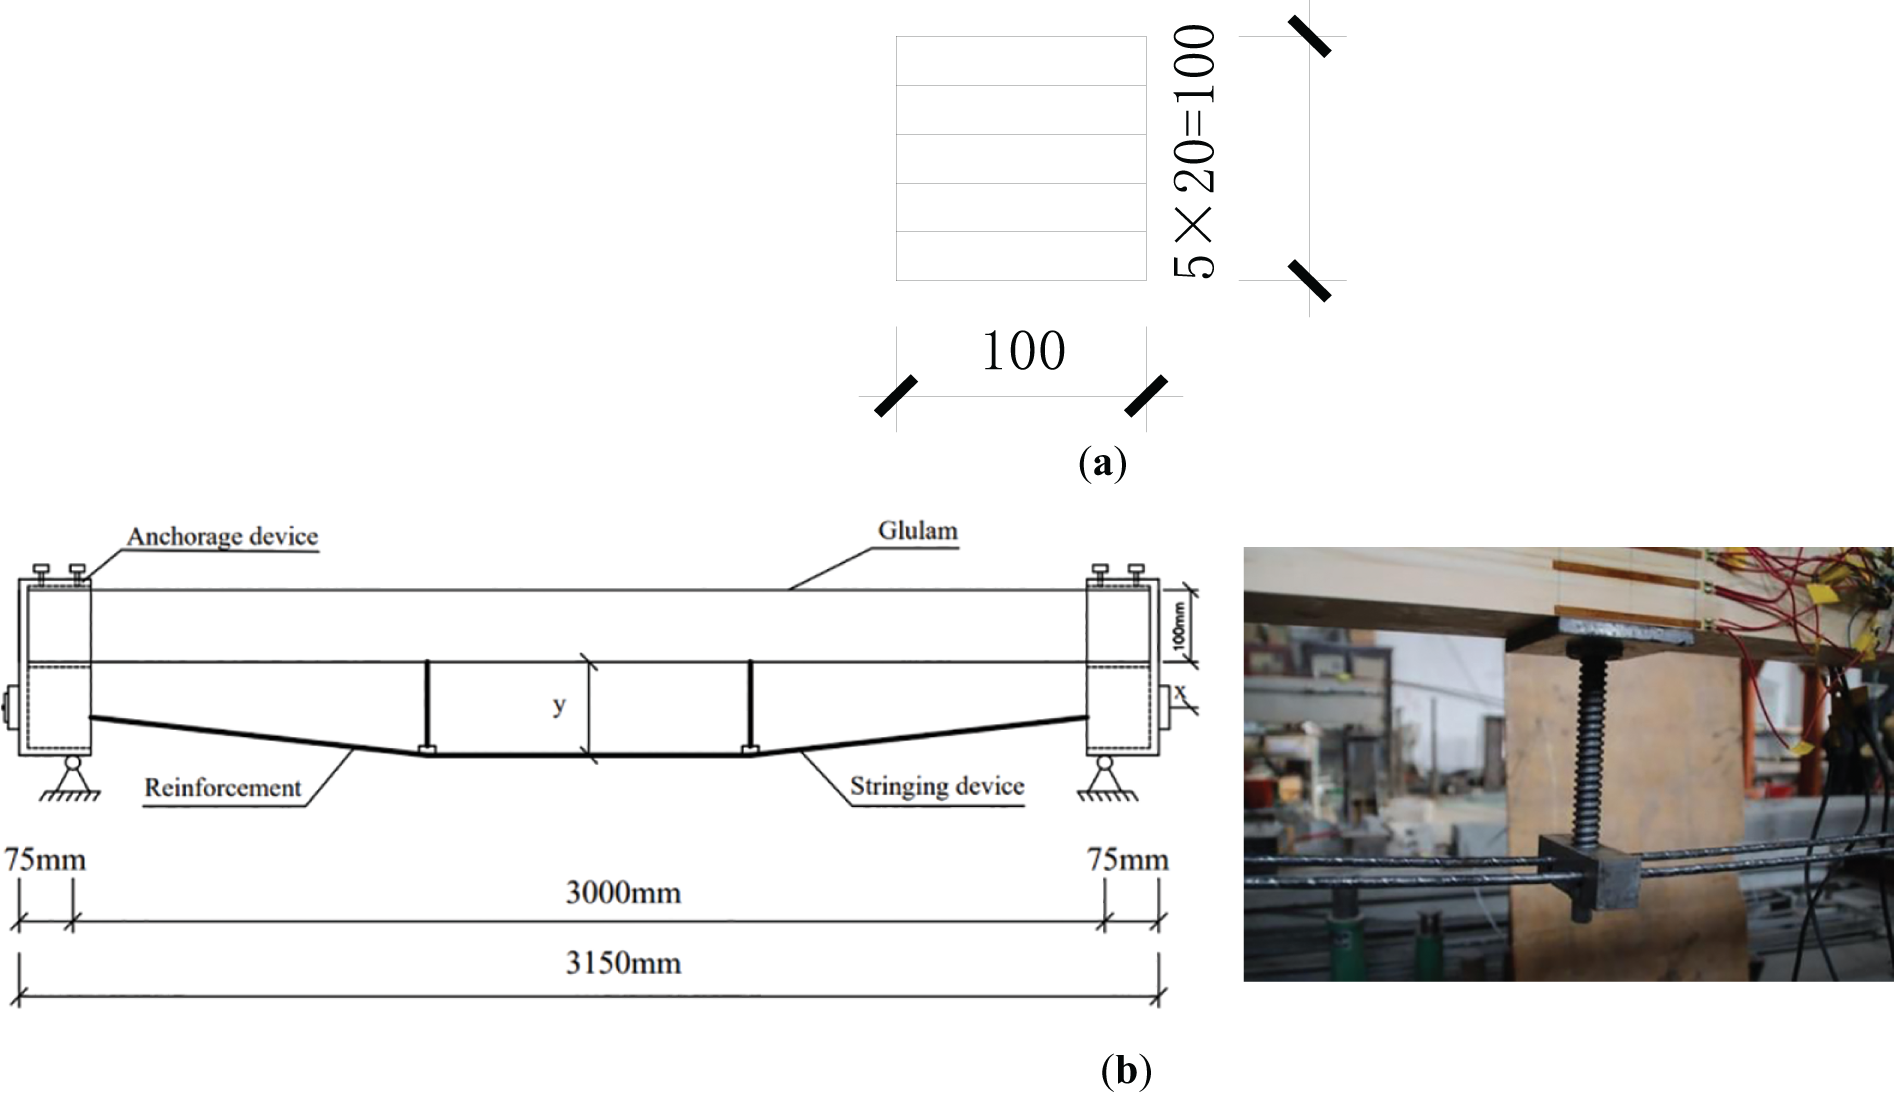
Figure 1: The diagram of the prestressed beam
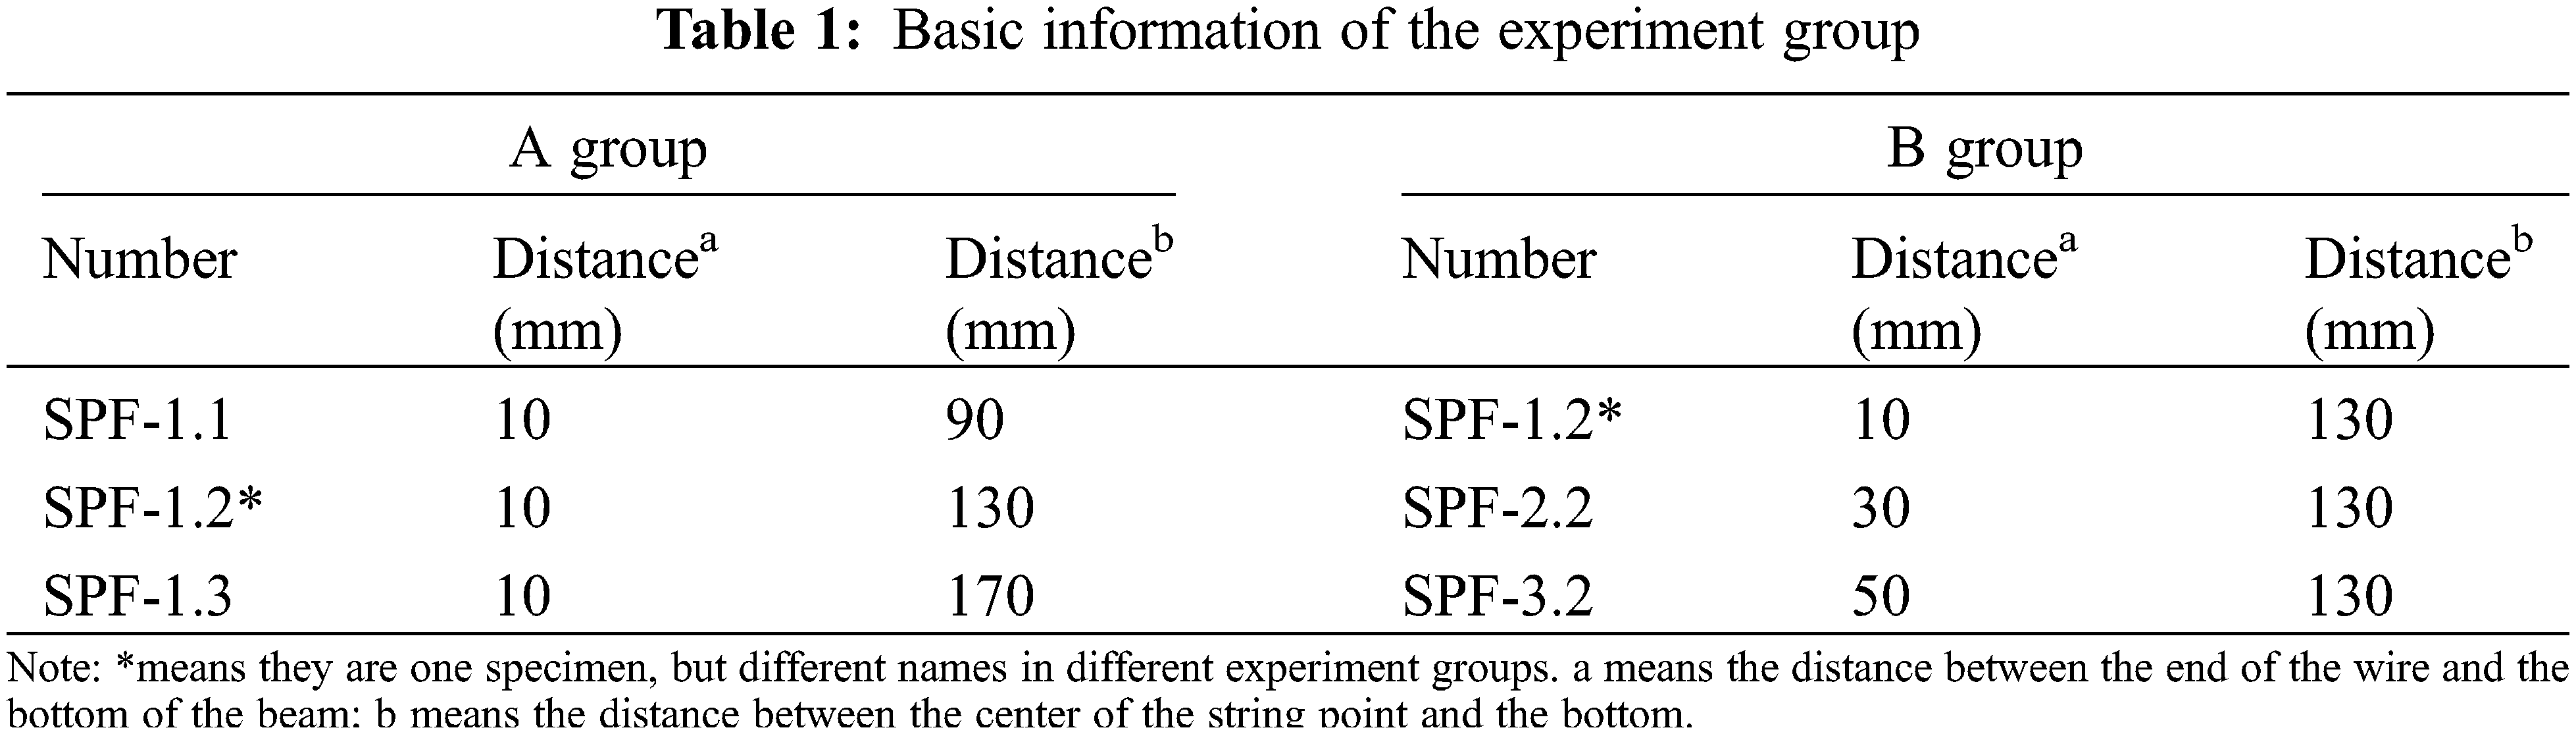
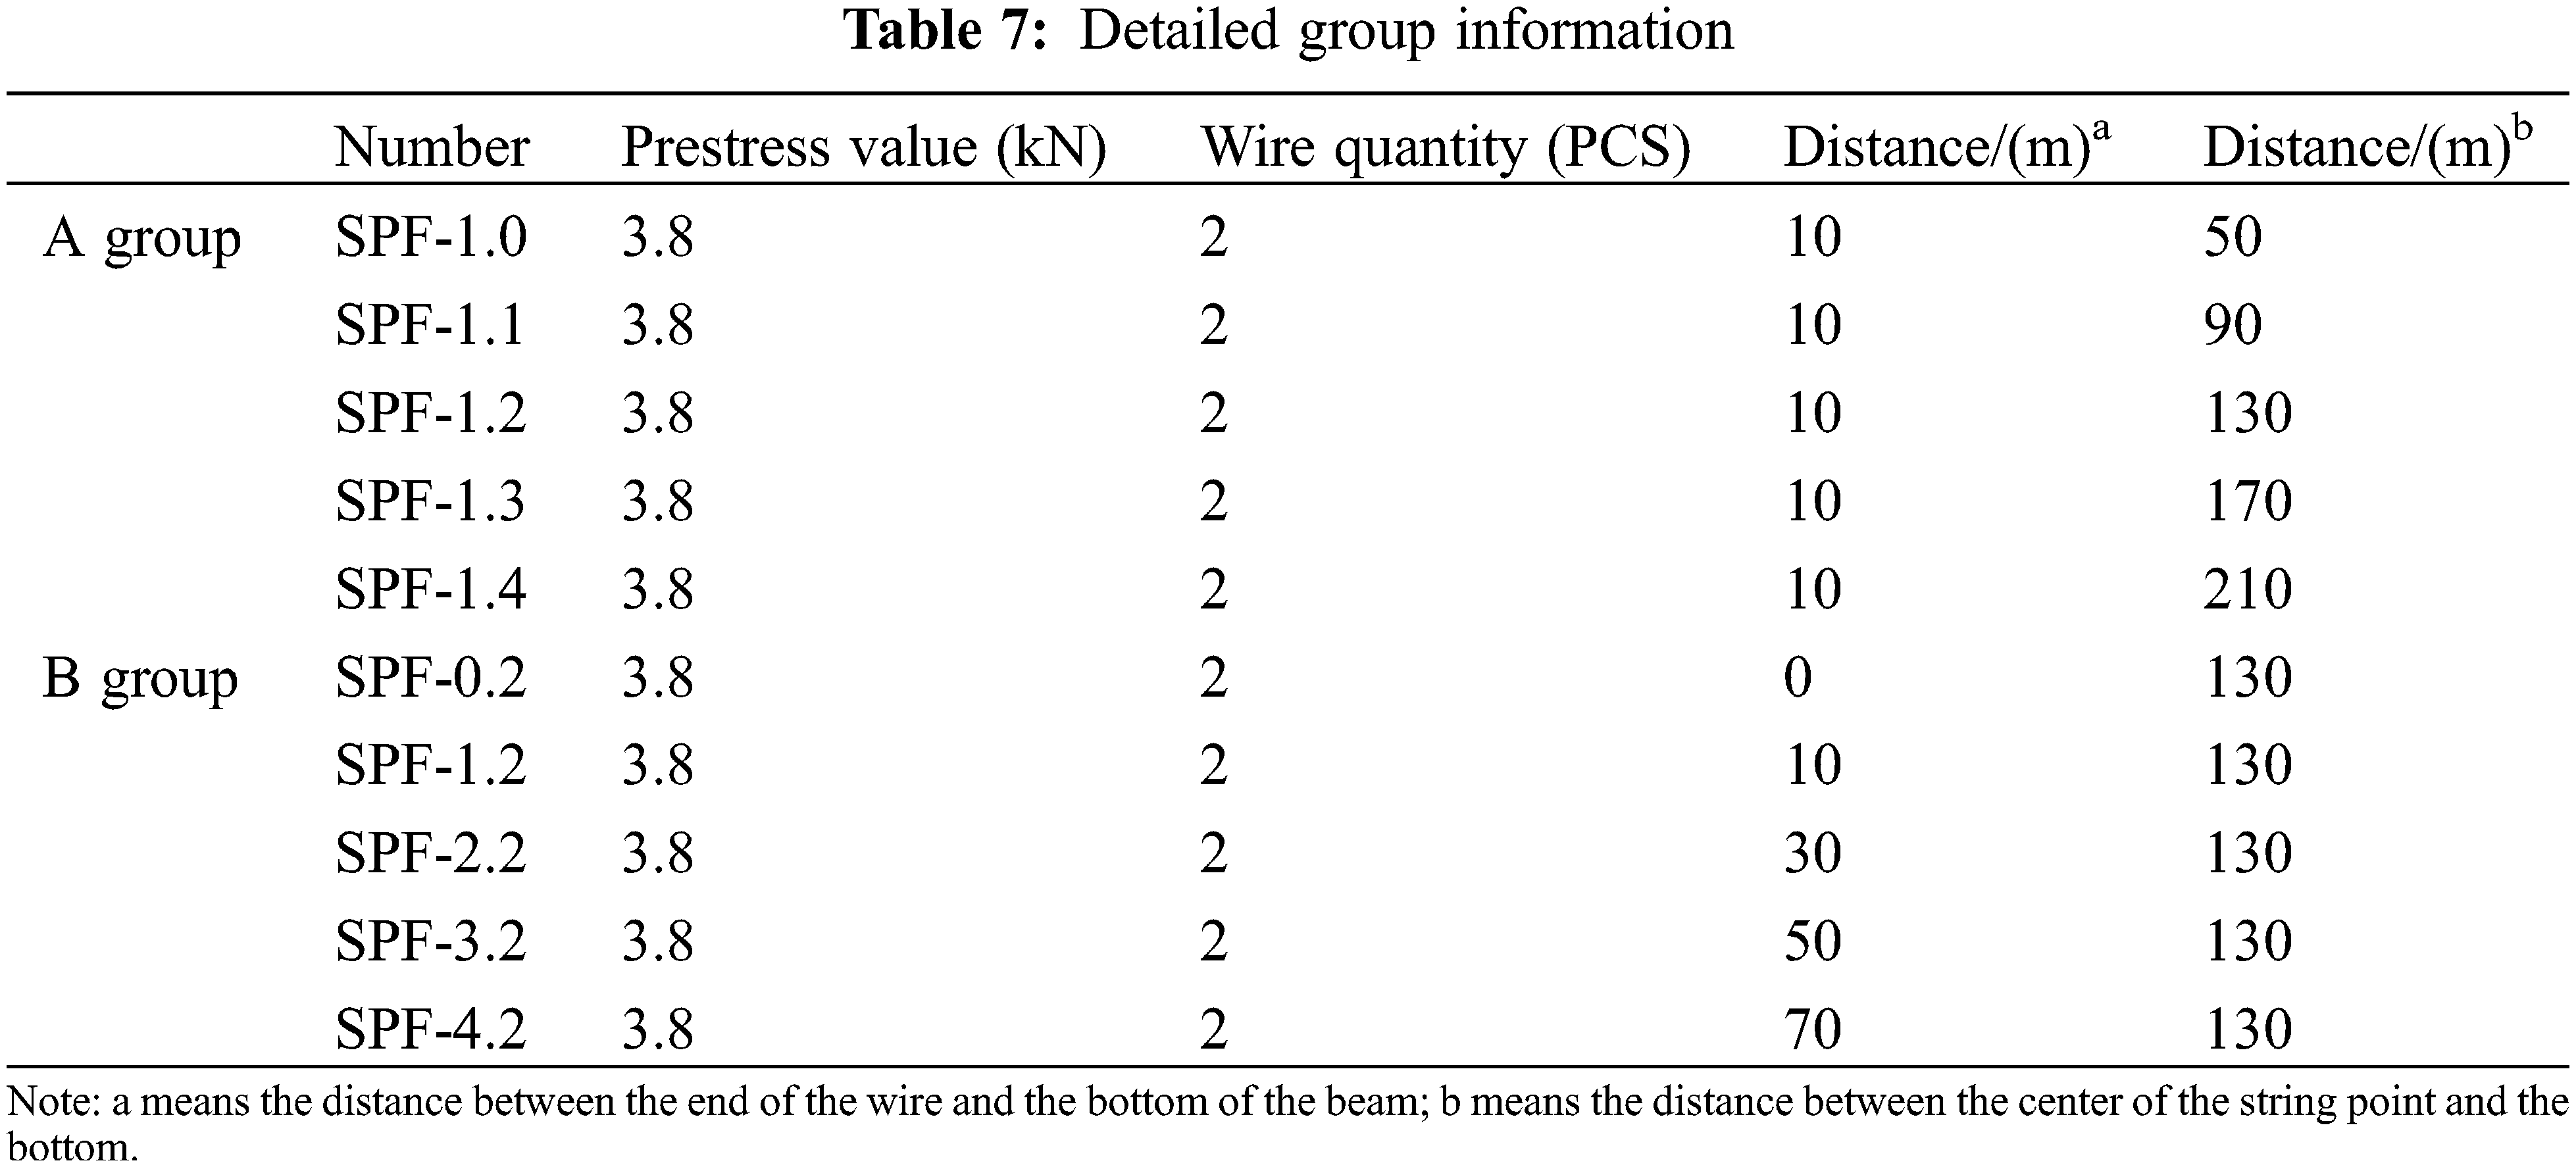
The lever arm refers to the distance between the tension point and the bottom of the glued wood, and the larger this distance, the stronger the bending resistance of the beam. The proposes of this experiment is to investigate the effect of the force arm on the bending performance of the beam. The force arm contains the end arm force and string force arm, and then the experiment was divided into two groups based on them. The specimens were named SPF-x,y, in which SPF represents one timber combination method, x means the distance between the end of the wire and the bottom of the beam, and y is the distance between the center of the string point and the bottom of the beam.
Therefore, based on different investigation proposes, the whole experiment specimens are divided into two groups, the detailed group information is listed in Table 1. For A group specimens, the various parameter is the string point, and their end anchor location is the same, the proposes of this group is to investigate the effect of the string force arm on the bending performance, failure modes, and stiffness. Conversely, in the B group, the string point is fixed, and the end anchor location is varied, to study the changes in the bending performance, failure modes, and stiffness resulting from the above various.
2.2 Measurement and Loading System
As shown in Fig. 2, the beam is loaded at two points by a distribution beam, so one pure bending section would be formed in the middle of the span. And to measure the strain of the beam and the prestressed wire, 100 mm × 3 mm strain gauges were pasted on the lateral, top, and bottom of the beam, and the specific location is shown in Fig. 2; and 5 mm × 2 mm strain gauges were pasted on the wires to measure the strain. Besides, one LVDT with a measuring range of 150 mm was placed in the middle of the beam, and the details are shown in Figs. 2 and 3.
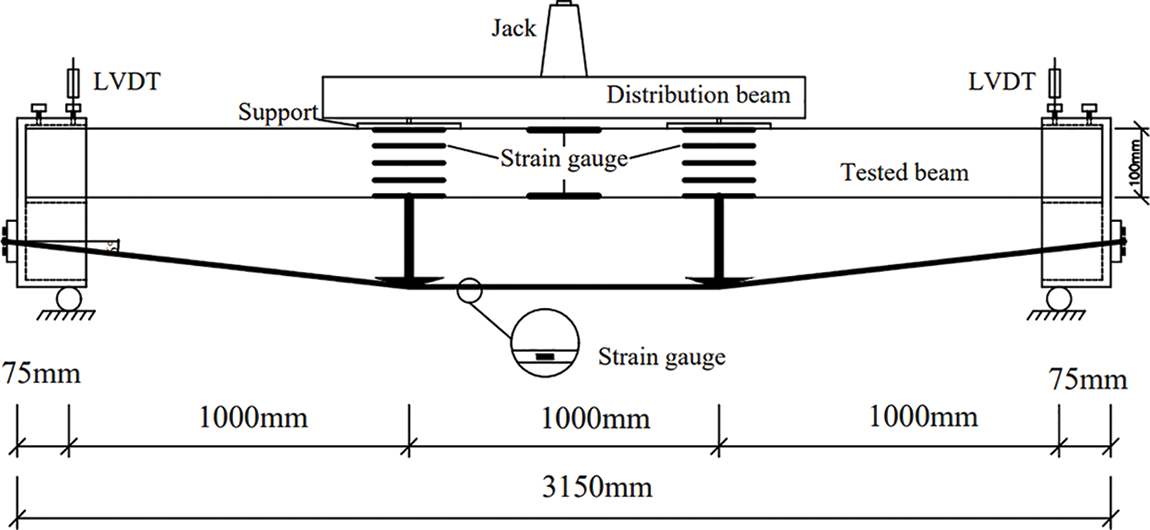
Figure 2: The diagram of the measurements layout
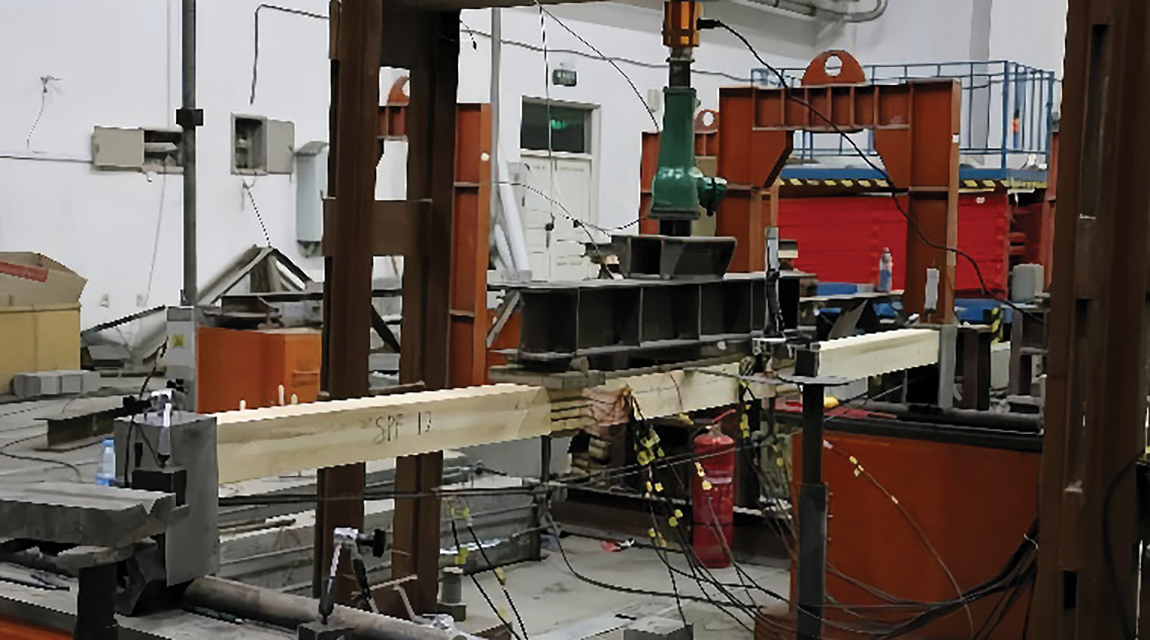
Figure 3: Experimental device
The whole loading system is divided into three parts including the prestressing stage, the elastic loading stage, and the damage loading stage. The extension of the screw enables the steel wire down, which applies prestress to the Glulam beam. Before prestressing, a series of experimental devices needed to be set, including supports, distribution beam, jack, and measurements, as shown in Fig. 2, and the weight of the jack and the distribution beam could be included in the total loading amount. During the initial loading stage, a load of 28 kN, 10%~20% of the estimated ultimate load, would be applied five times in cycles. The loading speed needed to be uniform, and once the load reached the set value, the load could be kept for 3 min. This movement is to ensure the measurement works well. And the failure loading stage was divided into two stages, named the load control stage and the displacement control stage according to the loading method. After the elastic loading stage, gradual loading was carried out with a gradient of 10% of the estimated ultimate load. After loading to 50% of the ultimate load, the gradient is reduced to 5% for graded loading, as shown in Fig. 4; this stage is the load control stage. When the deflection value of the wooden beam reached 1/35 of the span, loaded it with a gradient of 5 mm increase in deflection until the beam was damaged, which was the displacement control stage. During this stage, each loading phase needed to be kept for 3 min to observe the beam. The failure characteristics include (1) there are obvious cracks and splitting in the tensile area of the Glulam beam, and the crack width reaches 1.5 mm; (2) the compression zone of the Glulam shows obvious wrinkles, and the load-deflection curve decreases with loading increasing; (3) the prestressed steel wire breaks or the end anchoring device fails.
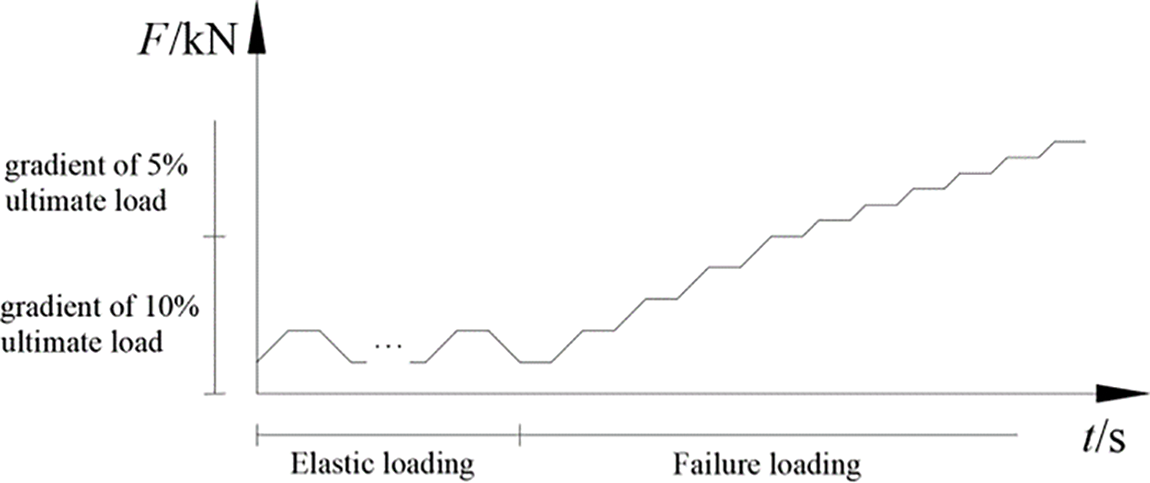
Figure 4: Loading system
Model parts are the essential section for the whole model, they consist of the whole model, so reasonable simplified parts could present the right experimental specimen and reduce the calculation mistakes resulting from meshes to simulate near real stress state. The five parts consist of the whole model, including the beam, wires, boot anchorage, steel plate, and turning block, as shown in Fig. 5.
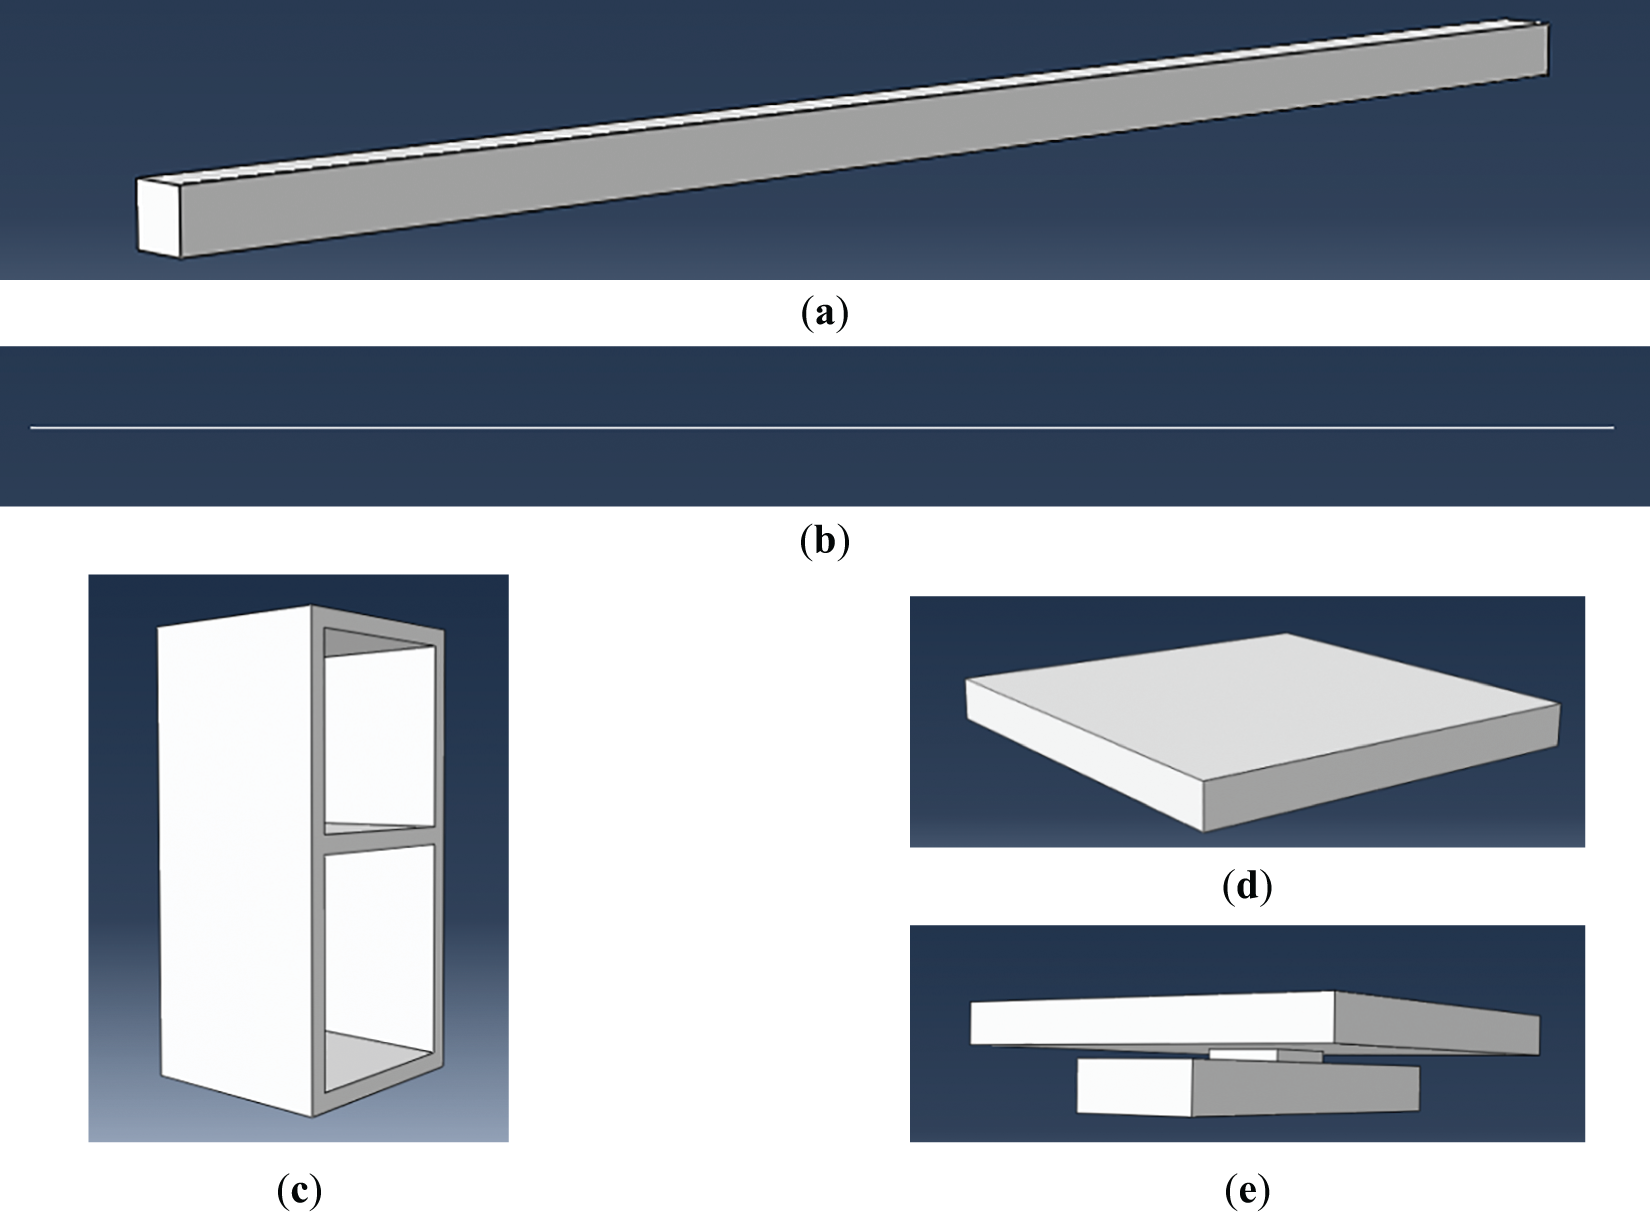
Figure 5: Diagram of the parts
During the experiment, there was no failure resulting from the glue failure, and it was ignored [26,27]. Therefore, the beam is set as a solid element, and the element type is C3D20R, and wires are set as beam instead of truss type to avoid in-convergent errors. It is taken into contact analysis and shear deformation, so it is set as the B31 element. Finally, the turning block, bolt, and steel plate are modeled as one part to simplify this model, and the element type is C3D8R.
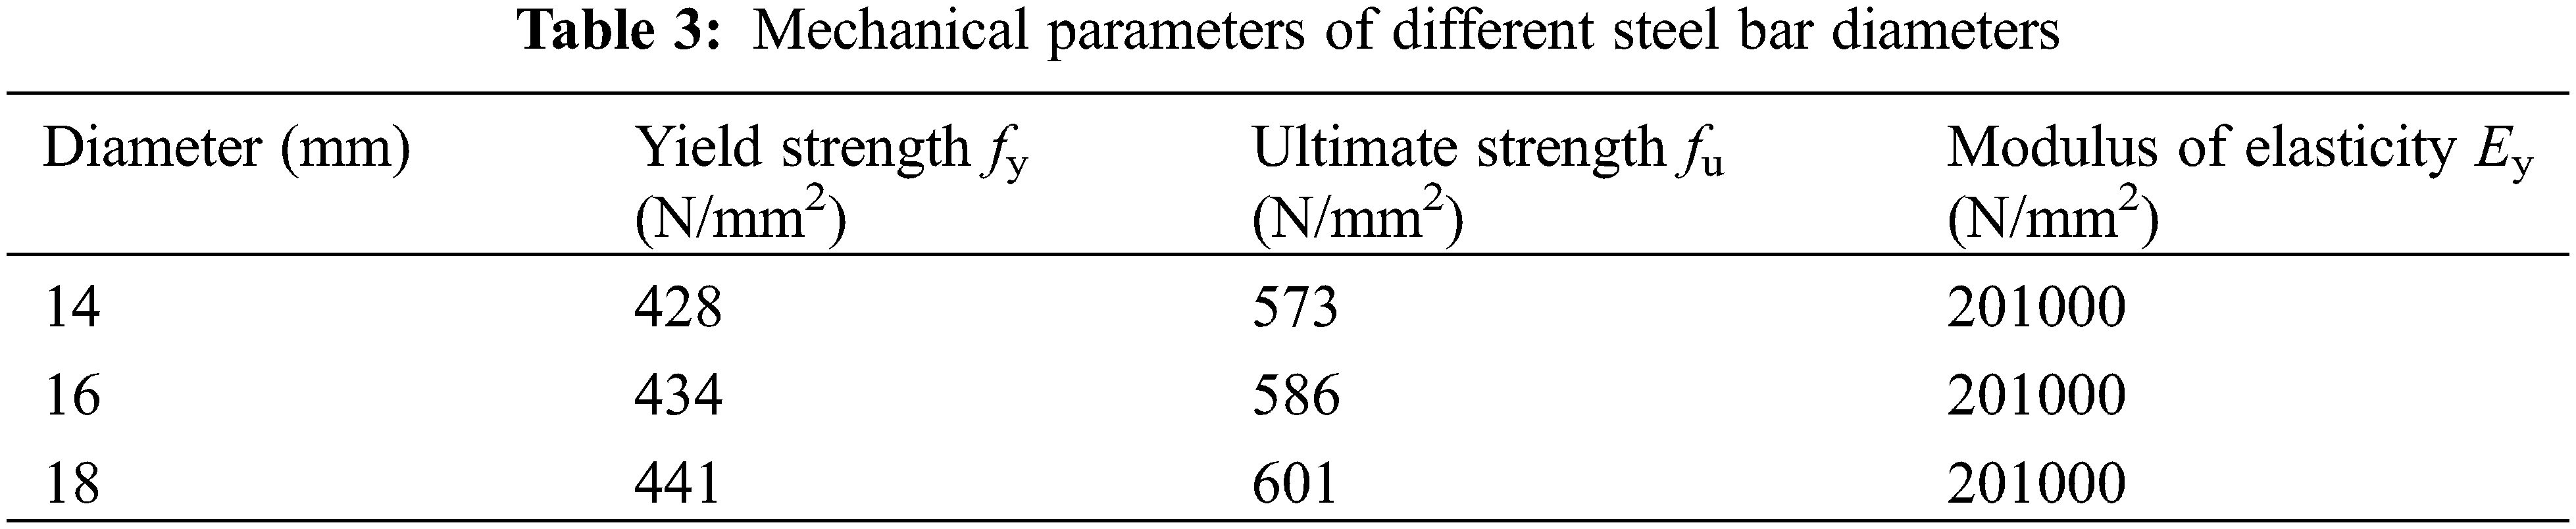
To obtain the mechanical parameters related to glued wood and steel bars and ensure the stability of the batch of materials, it is necessary to conduct relevant mechanical performance tests on Glulam beams and steel bars before conducting loading tests. Perform compression tests on prism specimens of 100 mm × 100 mm × 300 mm and tensile tests on these three types of steel bars to obtain their physical and mechanical properties, as shown in Tables 2 and 3, respectively.
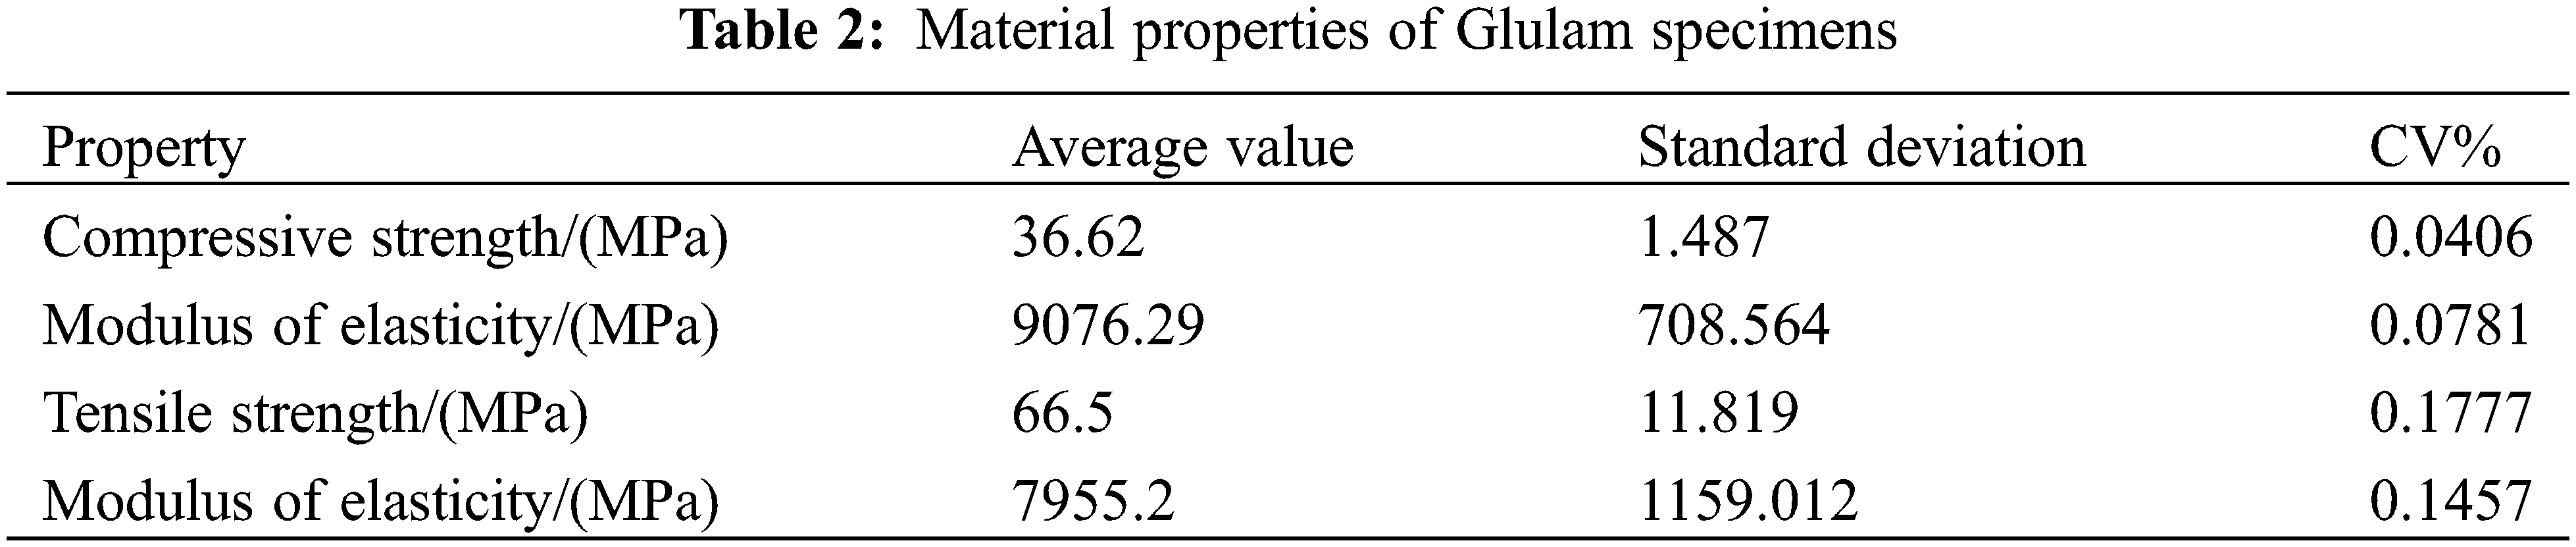
Glulam is an elastic-plastic material, its mechanical properties could be derived based on the Glulam prism compression test [28,29]. At its elastic stage, there are three mutually perpendicular planes of symmetry at every point, exhibiting orthogonality and anisotropy. It means that normal stress is only related to the corresponding normal strain, similarly, shear stress is only related to the corresponding shear strain, and there is no mutual relationship between the two when the coordinate axis is consistent with the elastic principal direction. Therefore, the mechanical matrix is one symmetric matrix, and then 12 elastic parameters just depend on the 9 elastic constants, including elastic modulus, shear modulus, and Poisson’s ratio. Hence, the mechanical properties matrix could be input as the following orthotropic Stiffness matrix.
In which D1111 = E1(1 − v23v32)r,
D2222 = E2(1 − v13v31)r,
D3333 = E3(1 − v12v21)r,
D1122 = E1(v21 + v31v23)r = E2(v12 + v32v13)r,
D1133 = E1(v31 + v21v32)r = E3(v13 + v12v23)r,
D2233 = E2(v32 + v12v31)r = E3(v23 + v21v13)r,
D1212 = G12,
D1313 = G13,
D2323 = G23.
The mechanical matrix has been obtained from the previous Glulam prism compression test, D1111 = 11935 × 106 N/m2, D1122 = 496 × 106 N/m2, D2222 = 1019 × 106 N/m2, D1133 = 431 × 106 N/m2, D2233 = 252 × 106 N/m2, D3333 = 563 × 106 N/m2, D1212 = 758 × 106 N/m2, D1313 = 690 × 106 N/m2, D2323 = 39 × 106 N/m2. But when Glulam research exists plastic stage, its mechanical properties would be close to the isotropic material, so its yield stress is set to 2 × 10⁷ N/m2. Afterward, the material properties must be assigned to the Glulam beam, and the material property orientation is consistent with the reference axis coordinate system. The stress-strain relationship of Glulam under compression is shown in Fig. 6.
Figure 6: The stress-strain relationship of Glulam under compression
Based on the previous study [30,31], the elastic modulus of the prestressed wire is 2.0 × 10¹¹ N/m2, and the yield stress is 1.1 × 10⁹ N/m2. And as without consideration of the axial deformation of the wire, but the shear deformation has been considered, the wire is set as a beam type, and its diameter is 0.0035 m. As for other parts, such as steel boot, steel plate, and turning block, their deformation has little effect on the mechanical properties of the beam, so they were set as rigid parts, which are completed by a much higher elastic module.
All parts were set as independent parts and then assembled according to the previous experiment. The assembled model is shown in Fig. 7. Afterward, the interaction between different parts would be set. The steel boots and the beam were connected by tied constrain, meaning they could not cause any relative displacement during the experiment process. Therefore, the frictional constraint is set between the beam and steel plates, as the frictional coefficient is 0.8. To avoid stress concentration, the load could not be applied to the beam directly, so two loading points are set at 30 mm from the top of the beam, and two steel plates are set to corresponding places Therefore, the concentration load could be transformed into a uniform load applied to the plates. The load points and the steel plates are connected by MPC couple, and the tied constraints are applied to the steel plate and the beam. Similarly, the tie connect also is applied to the turning block and the beam. The fraction coefficient between the wire and the turning block is 0.5, as the turning block has two notches to limit the location of the wire in the previous experiment. And the relationship between the wires and the steel boots is more complex. Because during prestressing, wire dis-placement could result in the turn of the steel boot, if it is just set as a tie connection, it could result in non-convergent results. Therefore, the connect is set as MPC couple, the reference point is set as the end of the wire, and it is coupled with the wires and steel boot, respectively. And U1 = U2 = U3 = UR1 = UR2 = 0, which means that they only could rotate around the Z-axis.
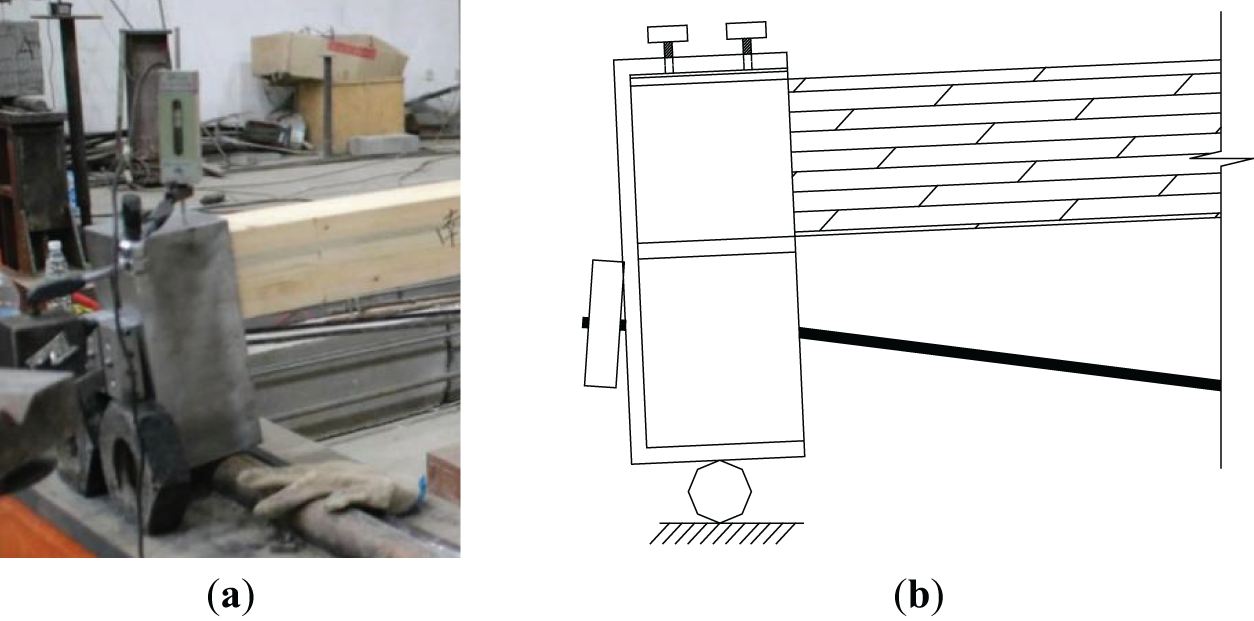
Figure 7: The deformation of the end anchor
2.3.4 Boundary Condition and Load
As shown in Fig. 7, the end of the beam is the hinge joint; the left part is limited X, Y, and Z direction displacement and X and Y direction rotation; and the right part is limited Y and Z direction displacement and X and Y direction rotation, all processes are done in Initial Step.
And the whole model contains the bolt load and concentration load. The former is unitized by adjusting the extension of the bolt, which enables the turning block downward and then applying prestress on the beam. And the external load is done through the reference points above the beam.
At the elastic loading stage, the deformation of the supports would be slighter, so the load did not have much effect on the beam. And during this loading process, some noise from the beams could be noticed, which resulted from the friction from the beam, the device, and the steel wires. And some of them are caused by the wood joint crack.
But during the damage stage, as some beams have some natural defects at the bottom surface, such as wood joints and twill, they would be found bottom cracks. Still, the strain gauge device shows that the strain value did not reach the limitation, so the rest wood layers of the beam still could have some bearing capacities, but as the reduction of the beam height, the beam could be damaged if the loading continues. Besides, some of the beams could make some noise as the bottom fiber was in a tension situation, and with loading increasing and deflection growth, the crack resulting from the fiber could be wider; once the fiber reaches its strain limitation, they would breakage and the beam could be damaged rapidly. Some of the beams would show obvious deflection, and fiber fold could be found at the top of the beam, the fiber at the bottom did not reach its tension limitation when they bore larger load. At the same time, the strain value could drop rapidly; the load could not be applied to the beam. The topical damage mode is shown in Fig. 8.
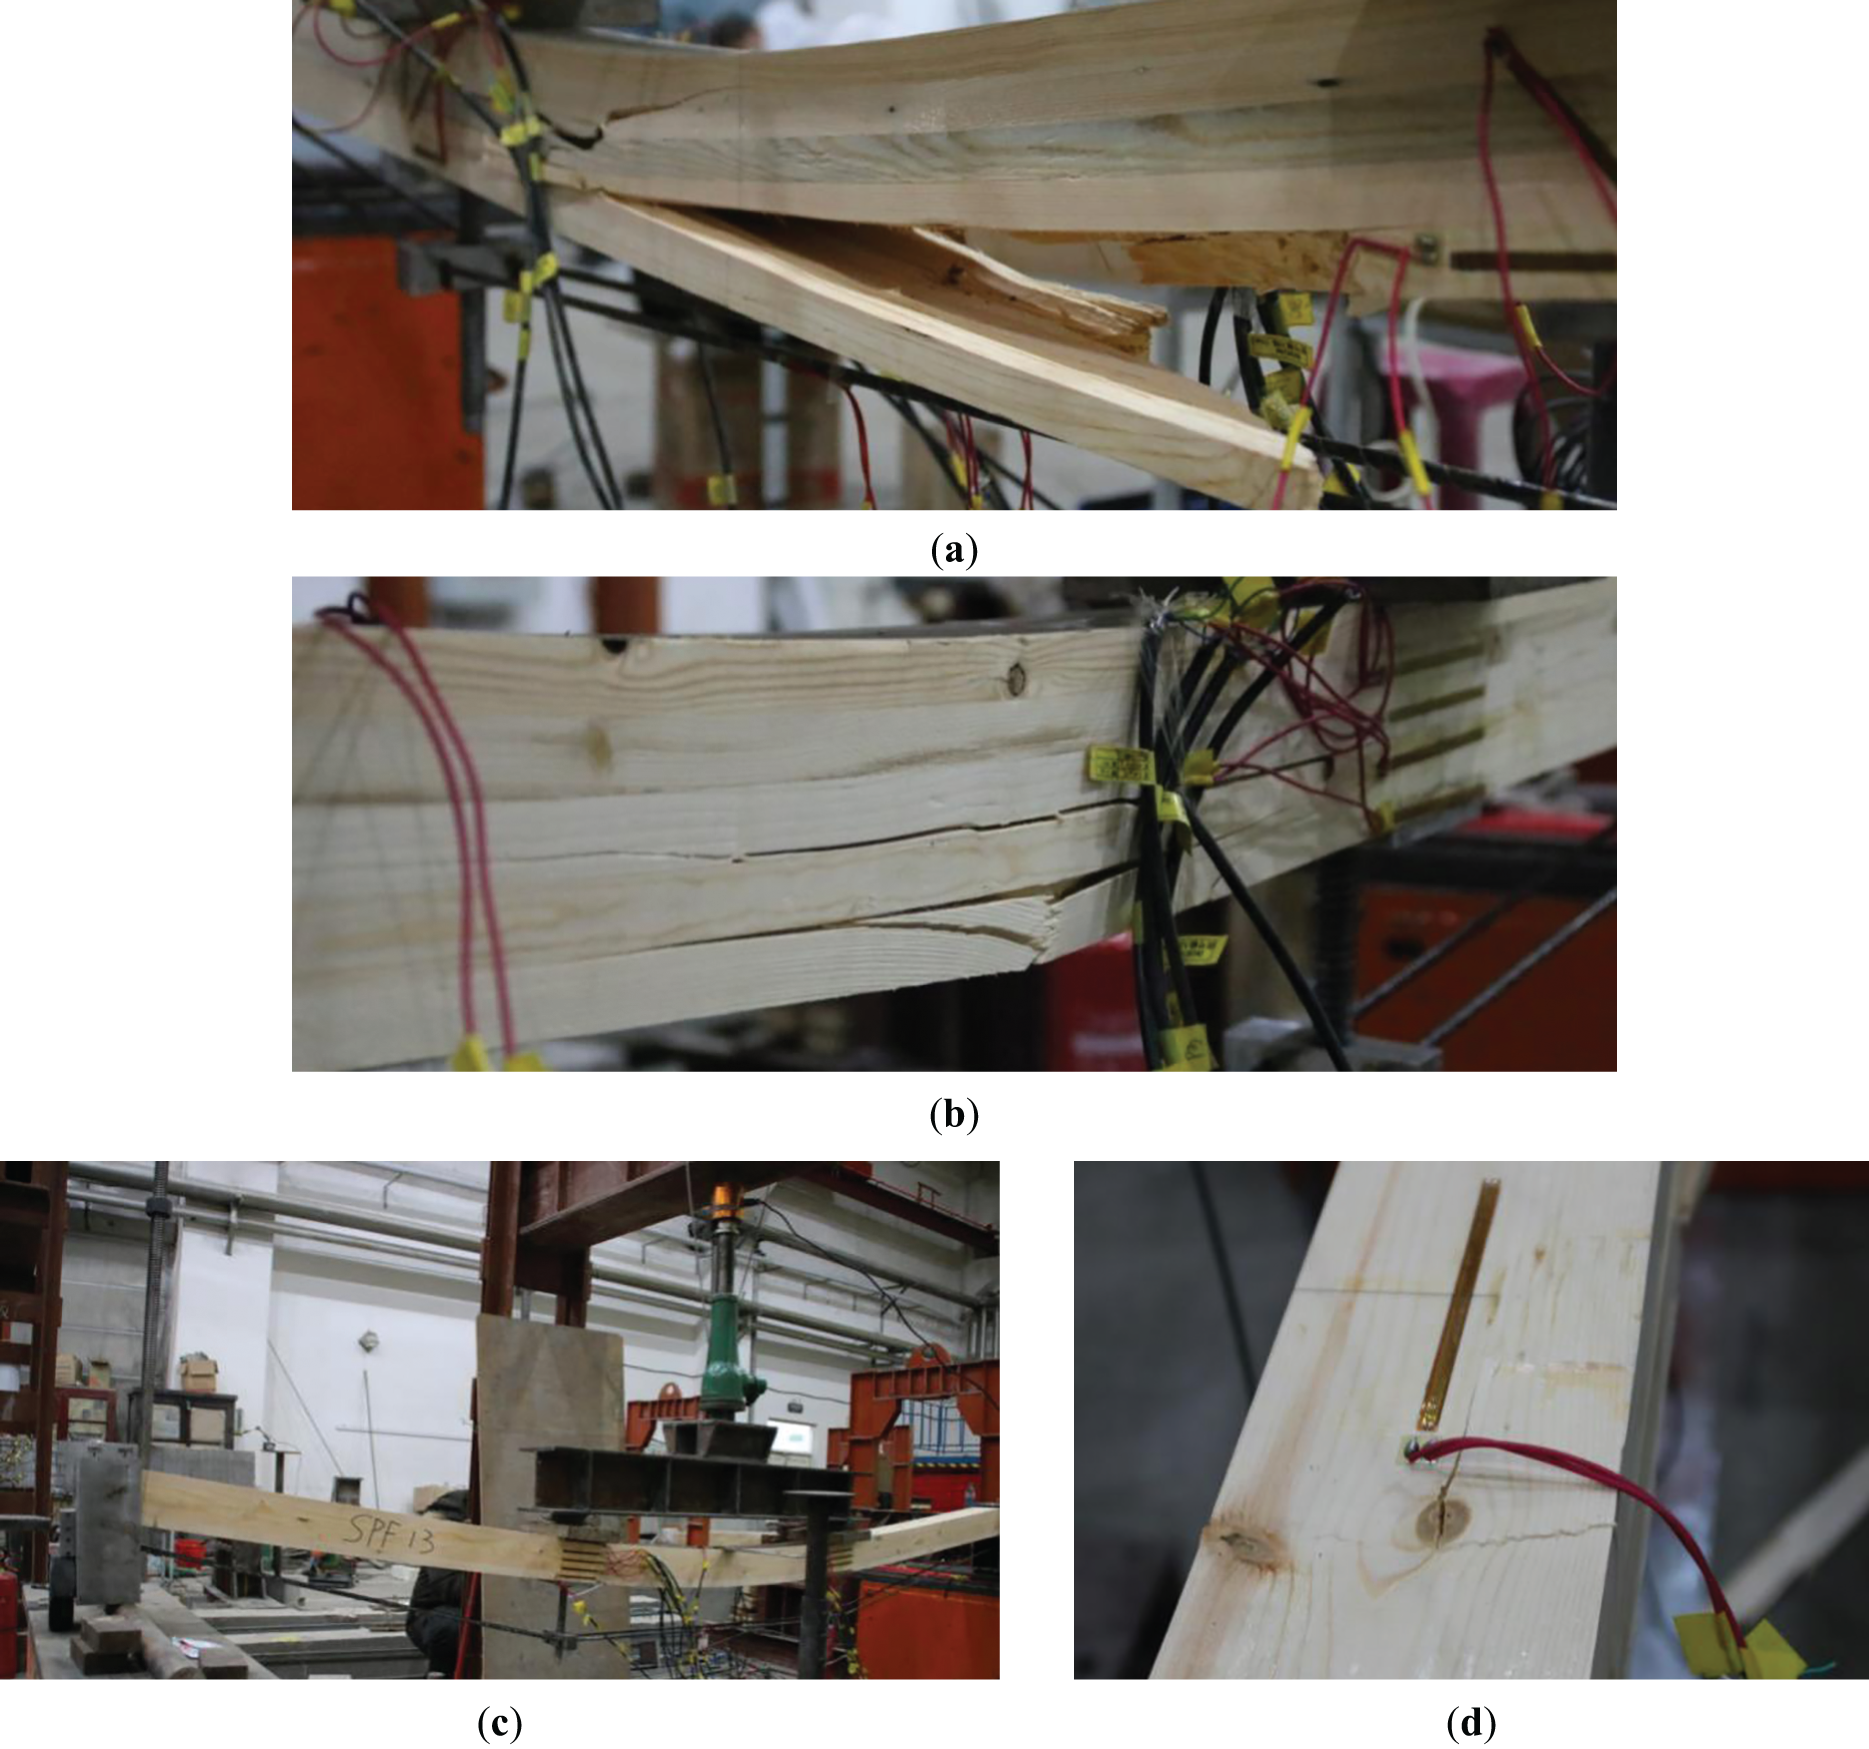
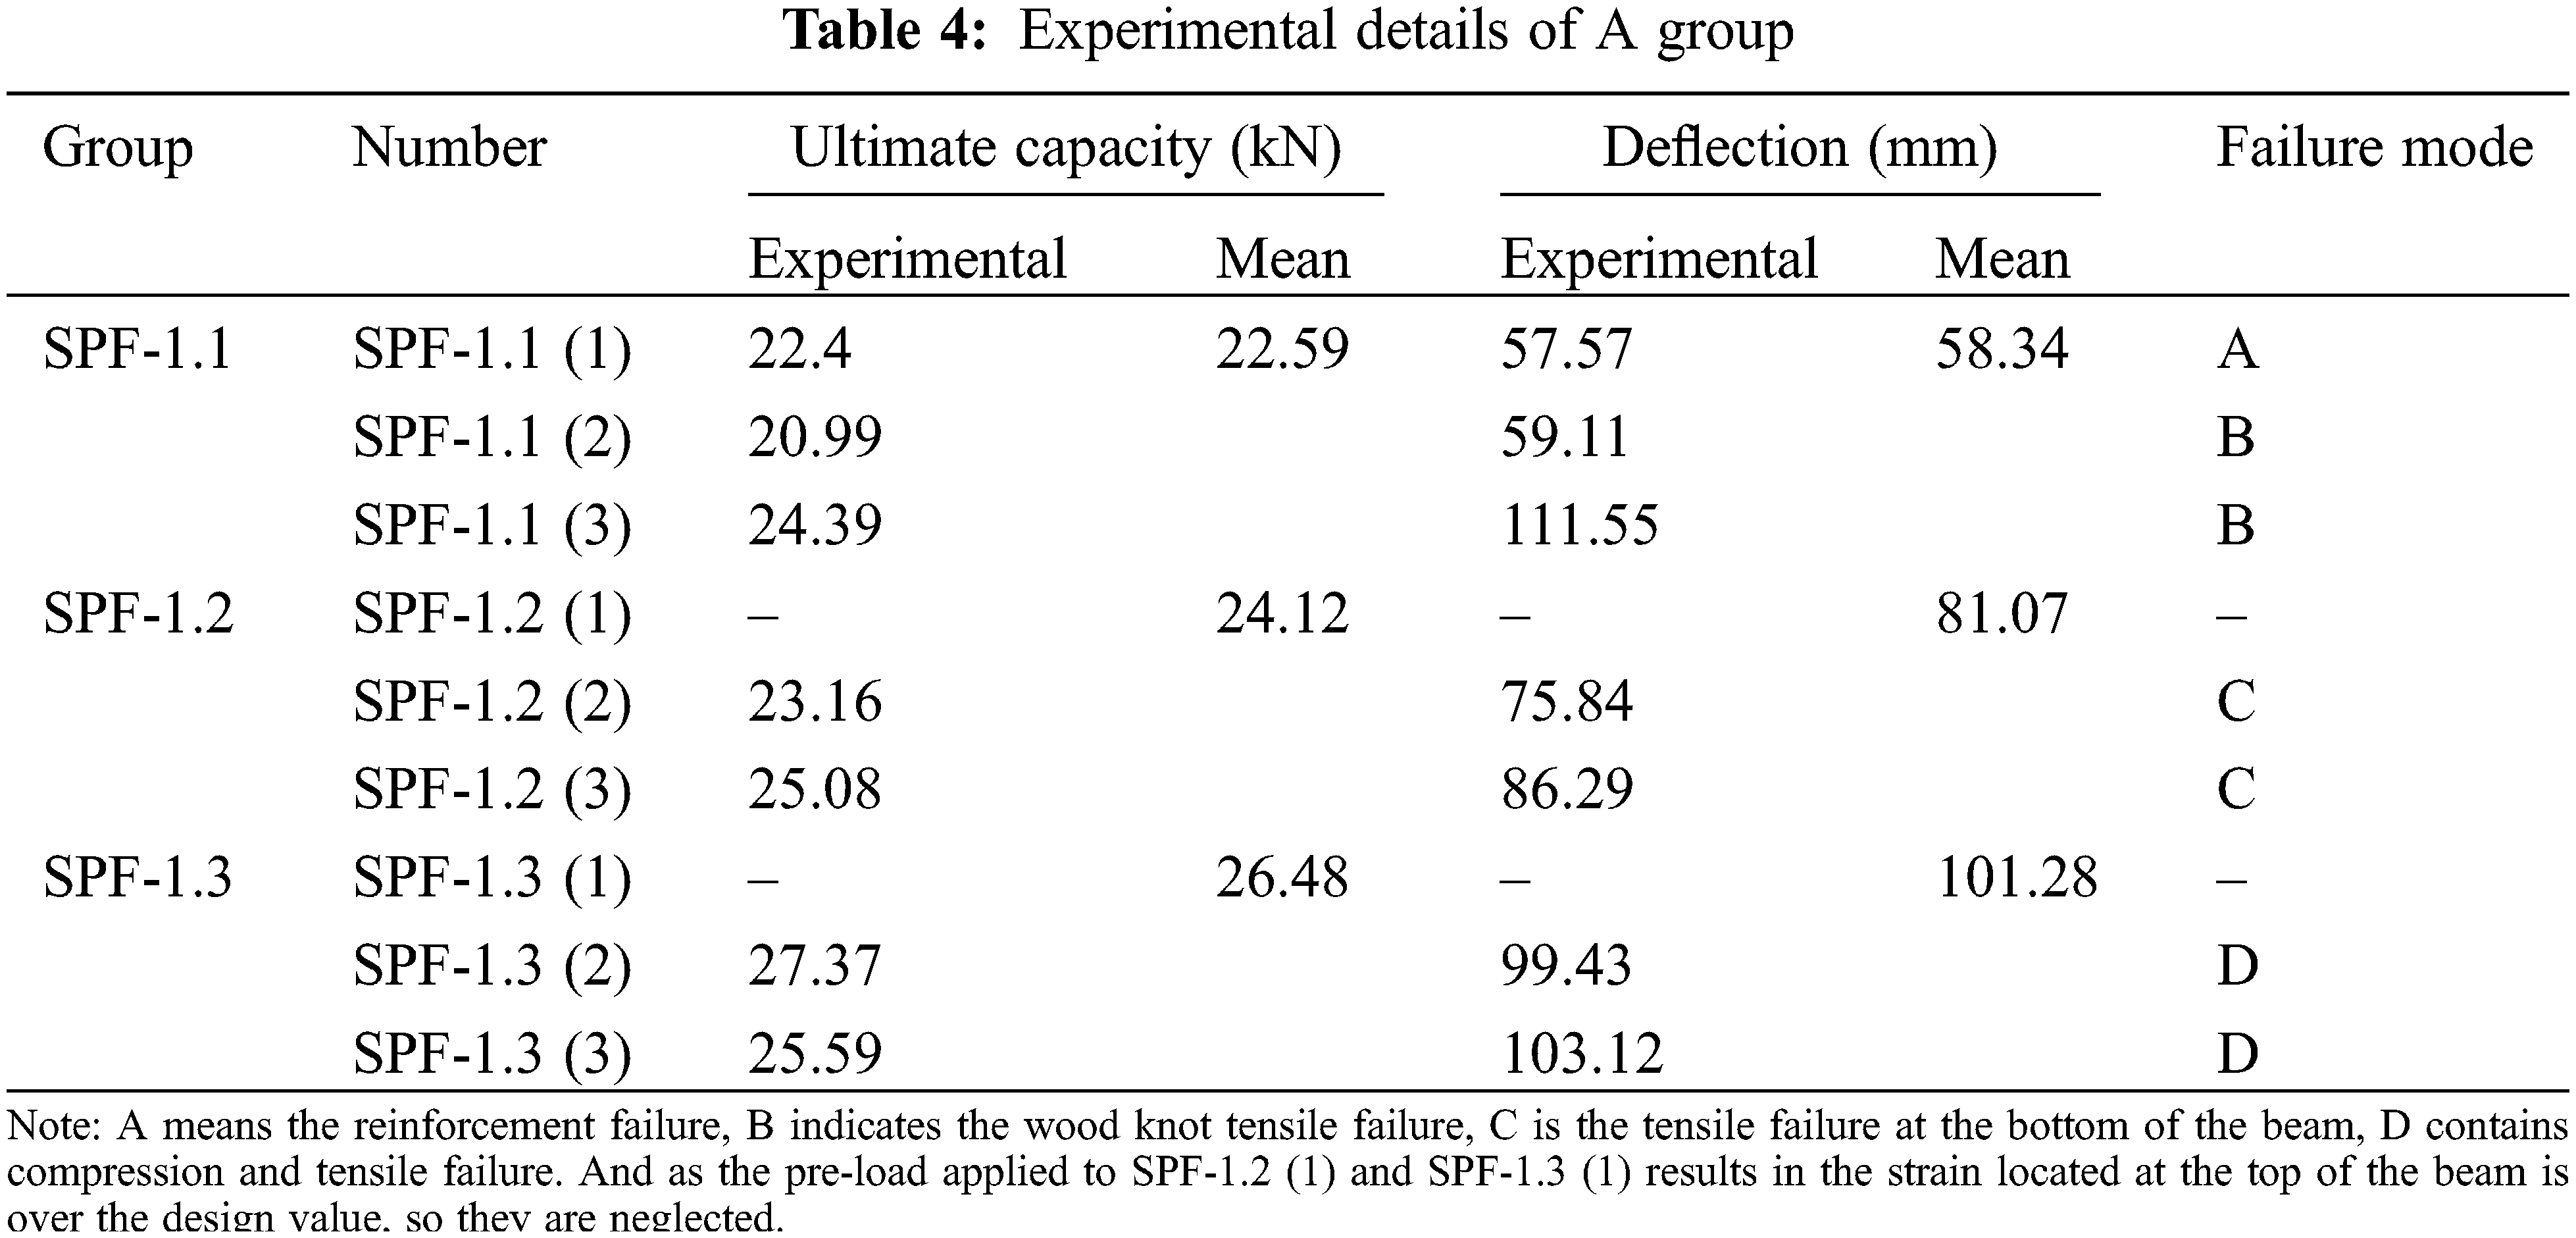
Figure 8: The typical failure molds of a group
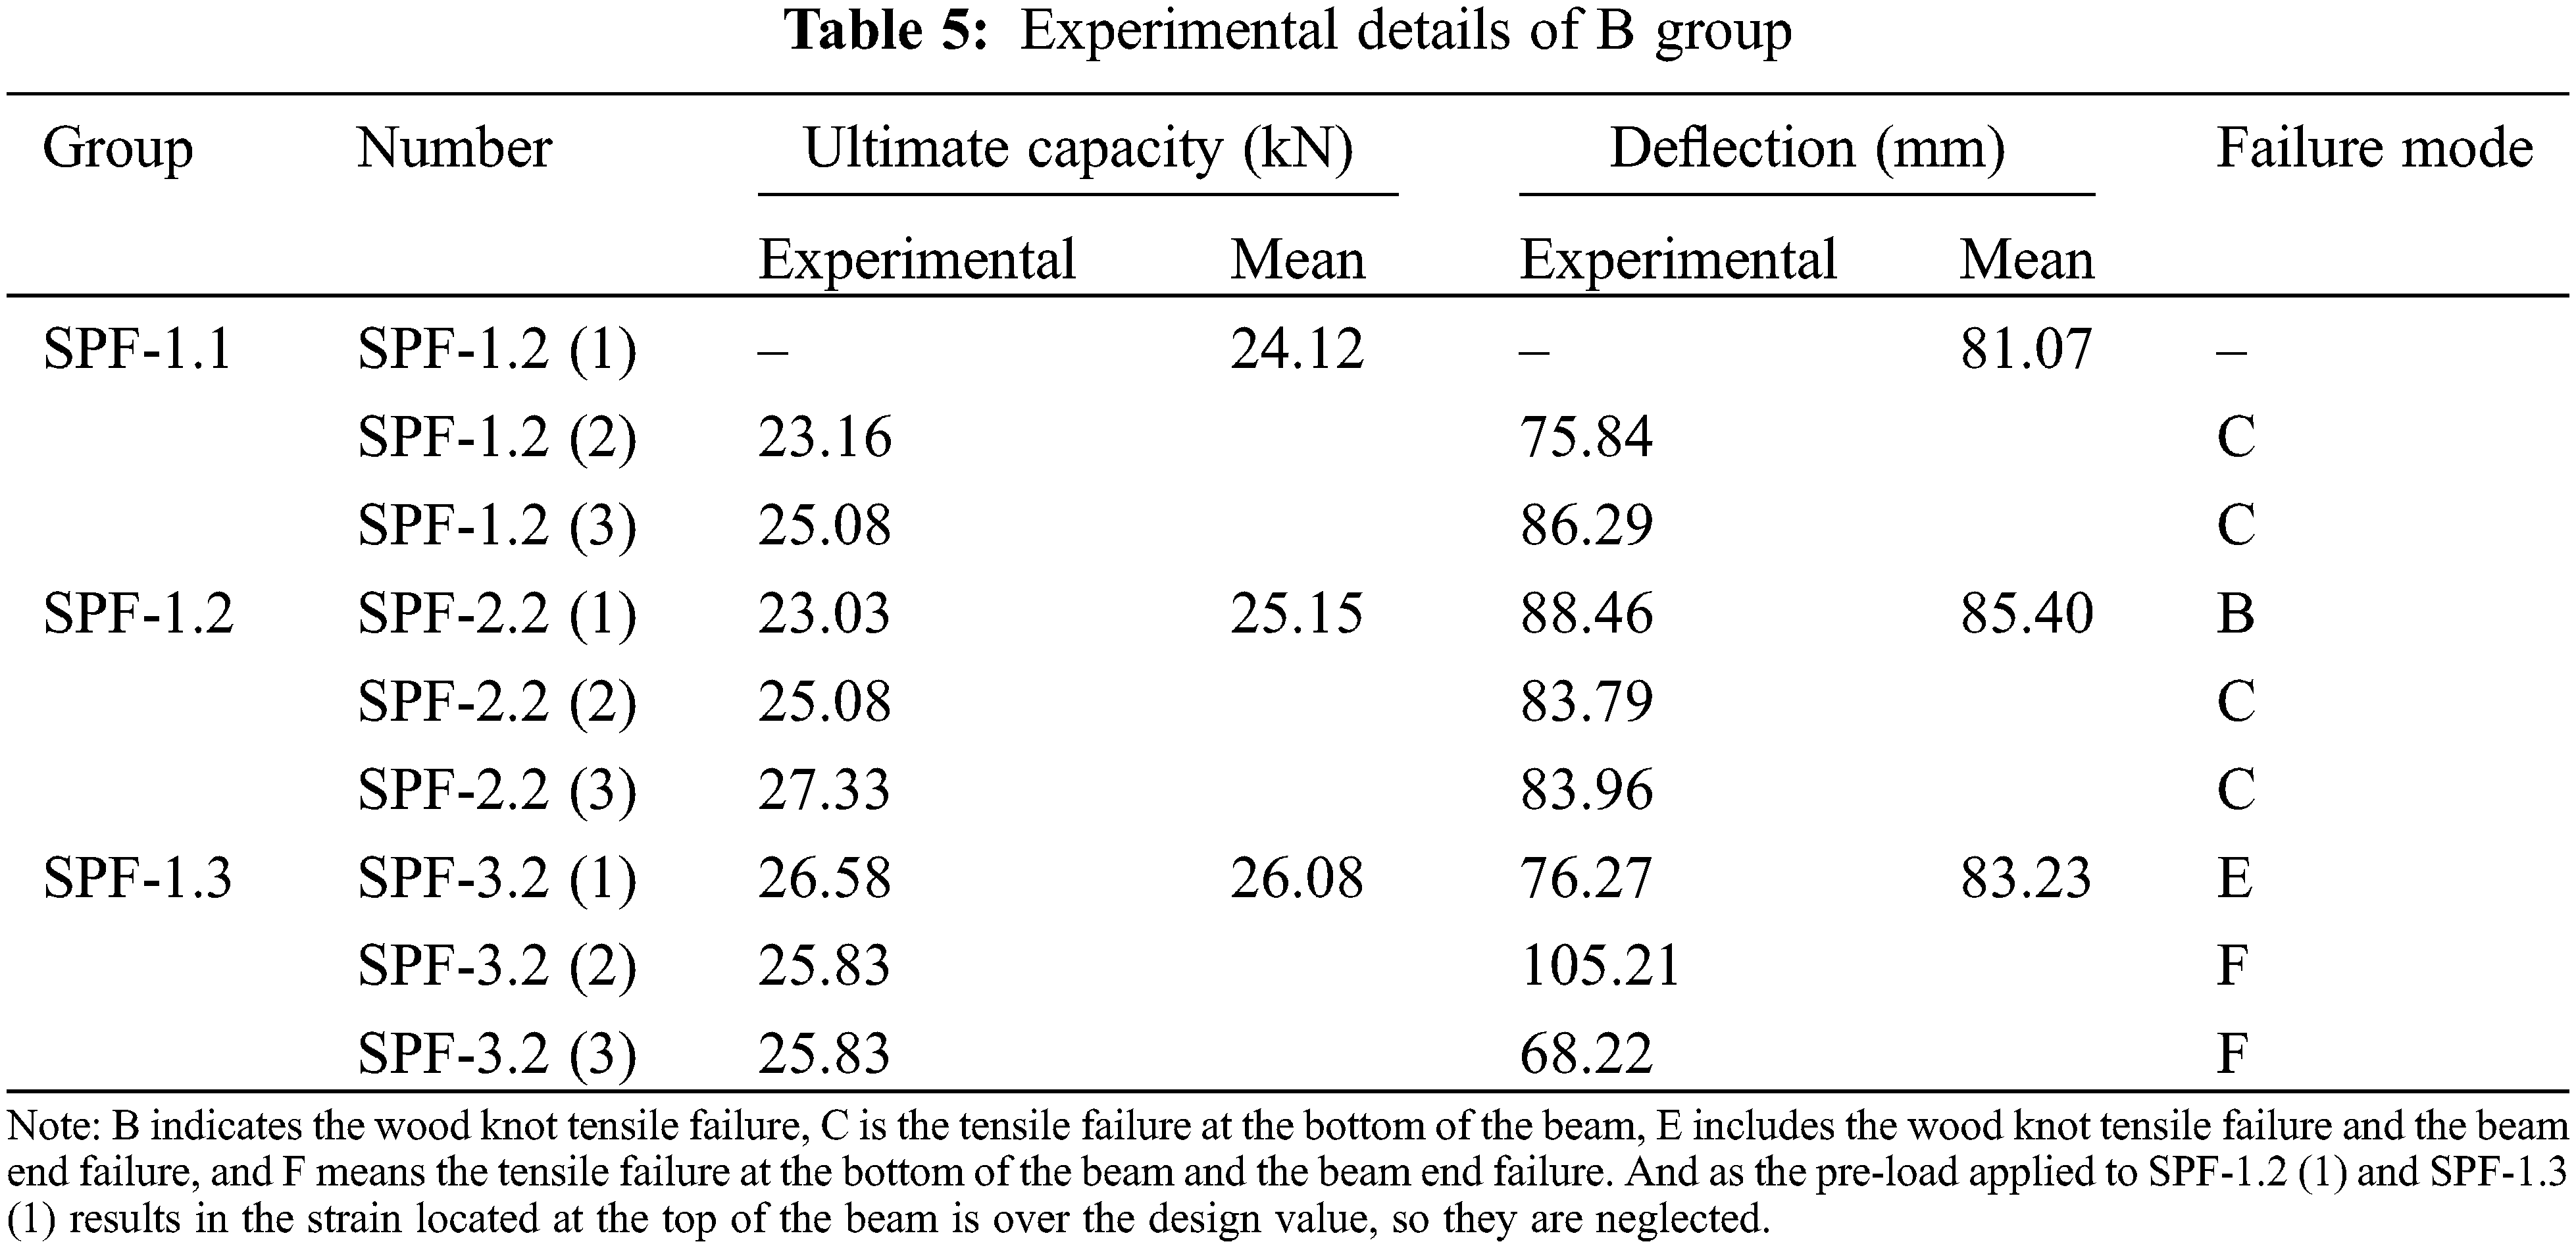
As shown in Fig. 8, the wires are close to the bottom of the beam, resulting in a small tension moment. Therefore, to keep the moment balance, the beam has to bear more pressure. However, the area, where the wood knot locates, is easy to shows cracks. And the bottom wood layer could not continue to bear the load when the cracks extend to the layer, and the capacity of the beam could be reduced which is about 70% of the ultimate capacity. But the beam could damage soon if the load is applied conscientiously, as shown in Fig. 8a. By contrast, the wires of SPF-1.2 are not close to the bottom of the beam like SPF-1.1, resulting in the moment increase. Hence, the deflection is not obvious, and the negative effect from the wood knot is not significant. And the beam is damaged because the fiber cannot bear the stress. The damage mode is a brittle failure, as shown in Fig. 8b. And the wire of SPF-1.3 is far away from the beam, resulting in a large moment. Therefore, with the increase of the load, the compression strain of the beam at the top increases rapidly, and the neural axis begins to drop, so the beam still could work well with obvious deflection. And the top of the beam shows folds, but the beam is not damaged due to instability, so the damage mode is a ductile failure. The detailed failure mode of groups is shown in Tables 4 and 5, respectively.
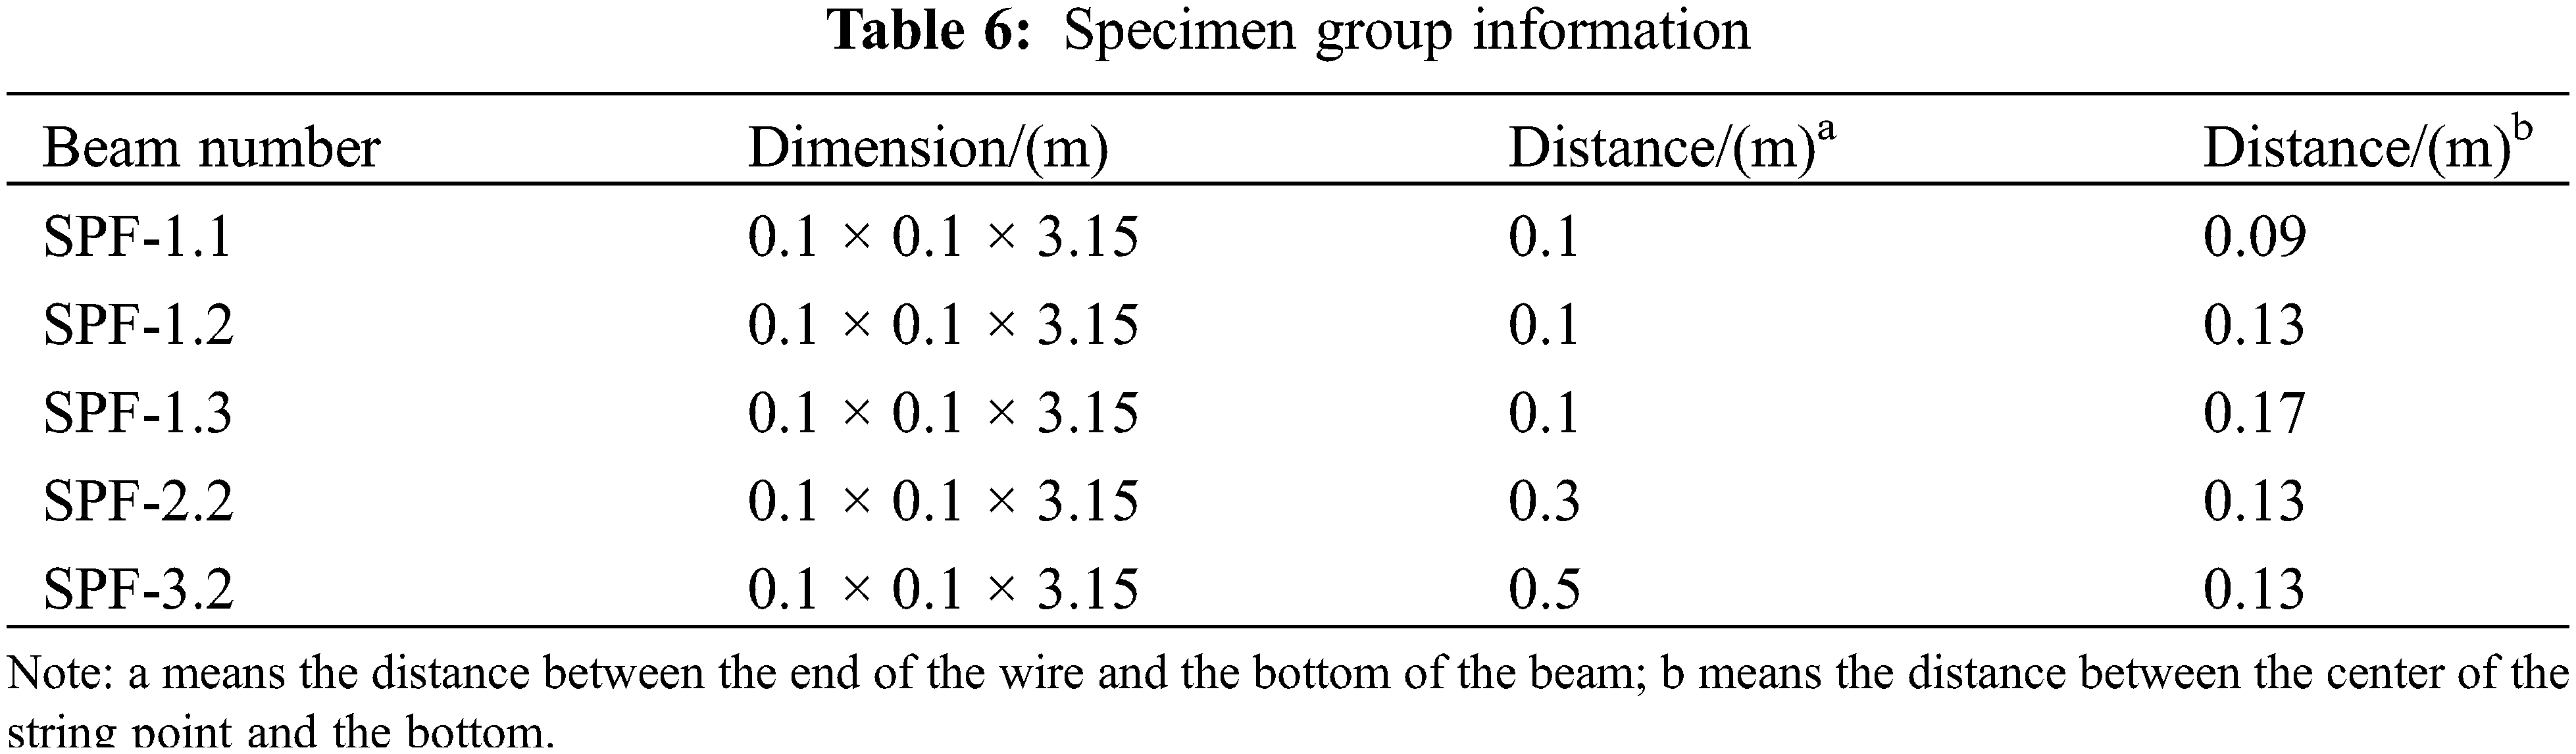
To verify the model’s accuracy, the simulation results are compared with the experimental results. Based on the experiment, the models were simulated, and details are listed in Table 6.
Based on Table 4, the limitation of the bearing capacities of various groups is ensured. Hence, the load limitation of each specimen is 24 kN (SPF-1.1), 8 kN (SPF-1.2), 32 kN (SPF-1.3), 29 kN (SPF-2.2) and 30 kN (SPF-3.2), respectively. The load limitation could avoid Infinite iterative calculation and the analysis termination. Afterward, the deflection value in the middle of the beam, the load value of the loading point, and corresponding tension and compression strains could be obtained, which could drive to obtain the ultimate bending capacity of the beam. Finally, to validate the simulation model, the load-displacement curve is compared with experimental data, as shown in Figs. 9 and 10.
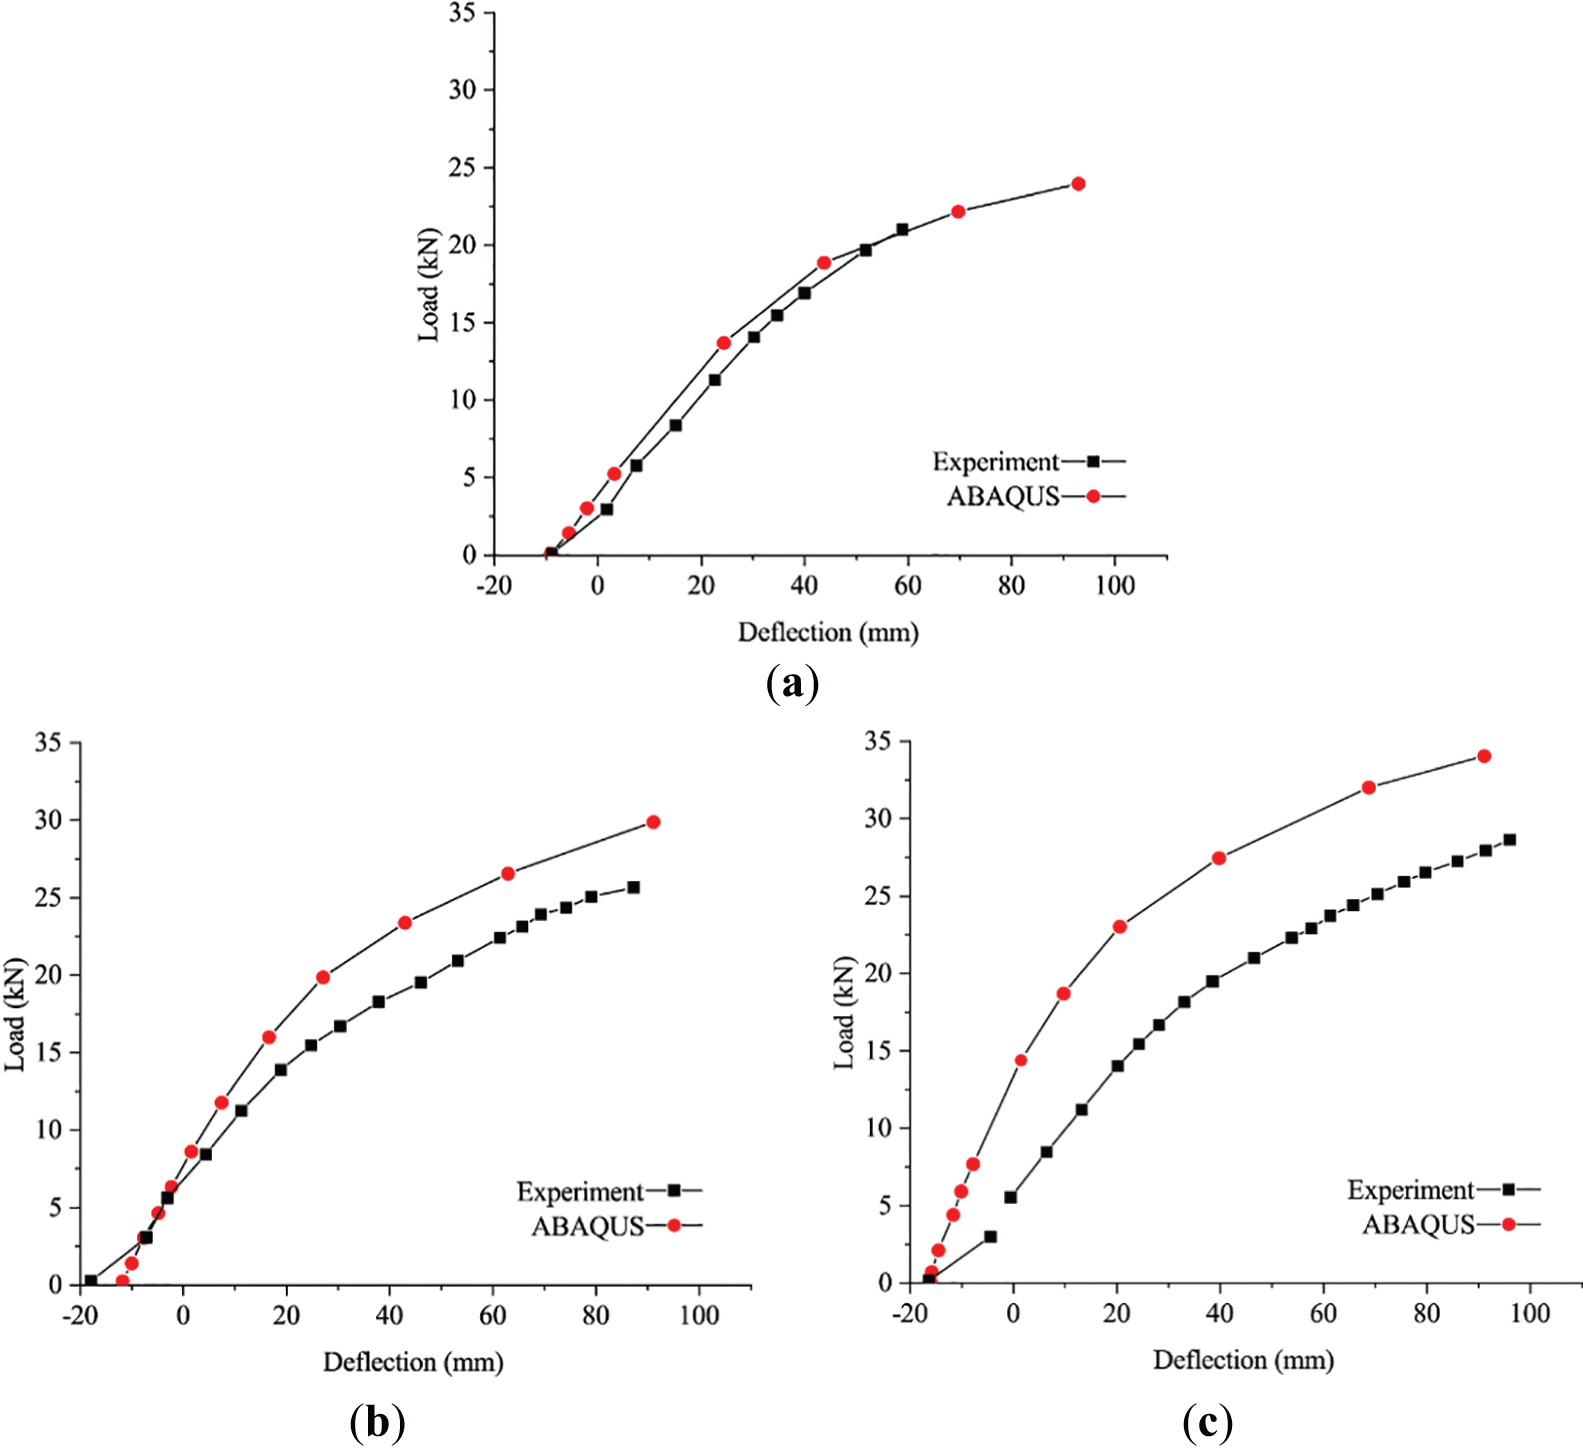
Figure 9: Load-displacement curve comparison between experiment and simulation
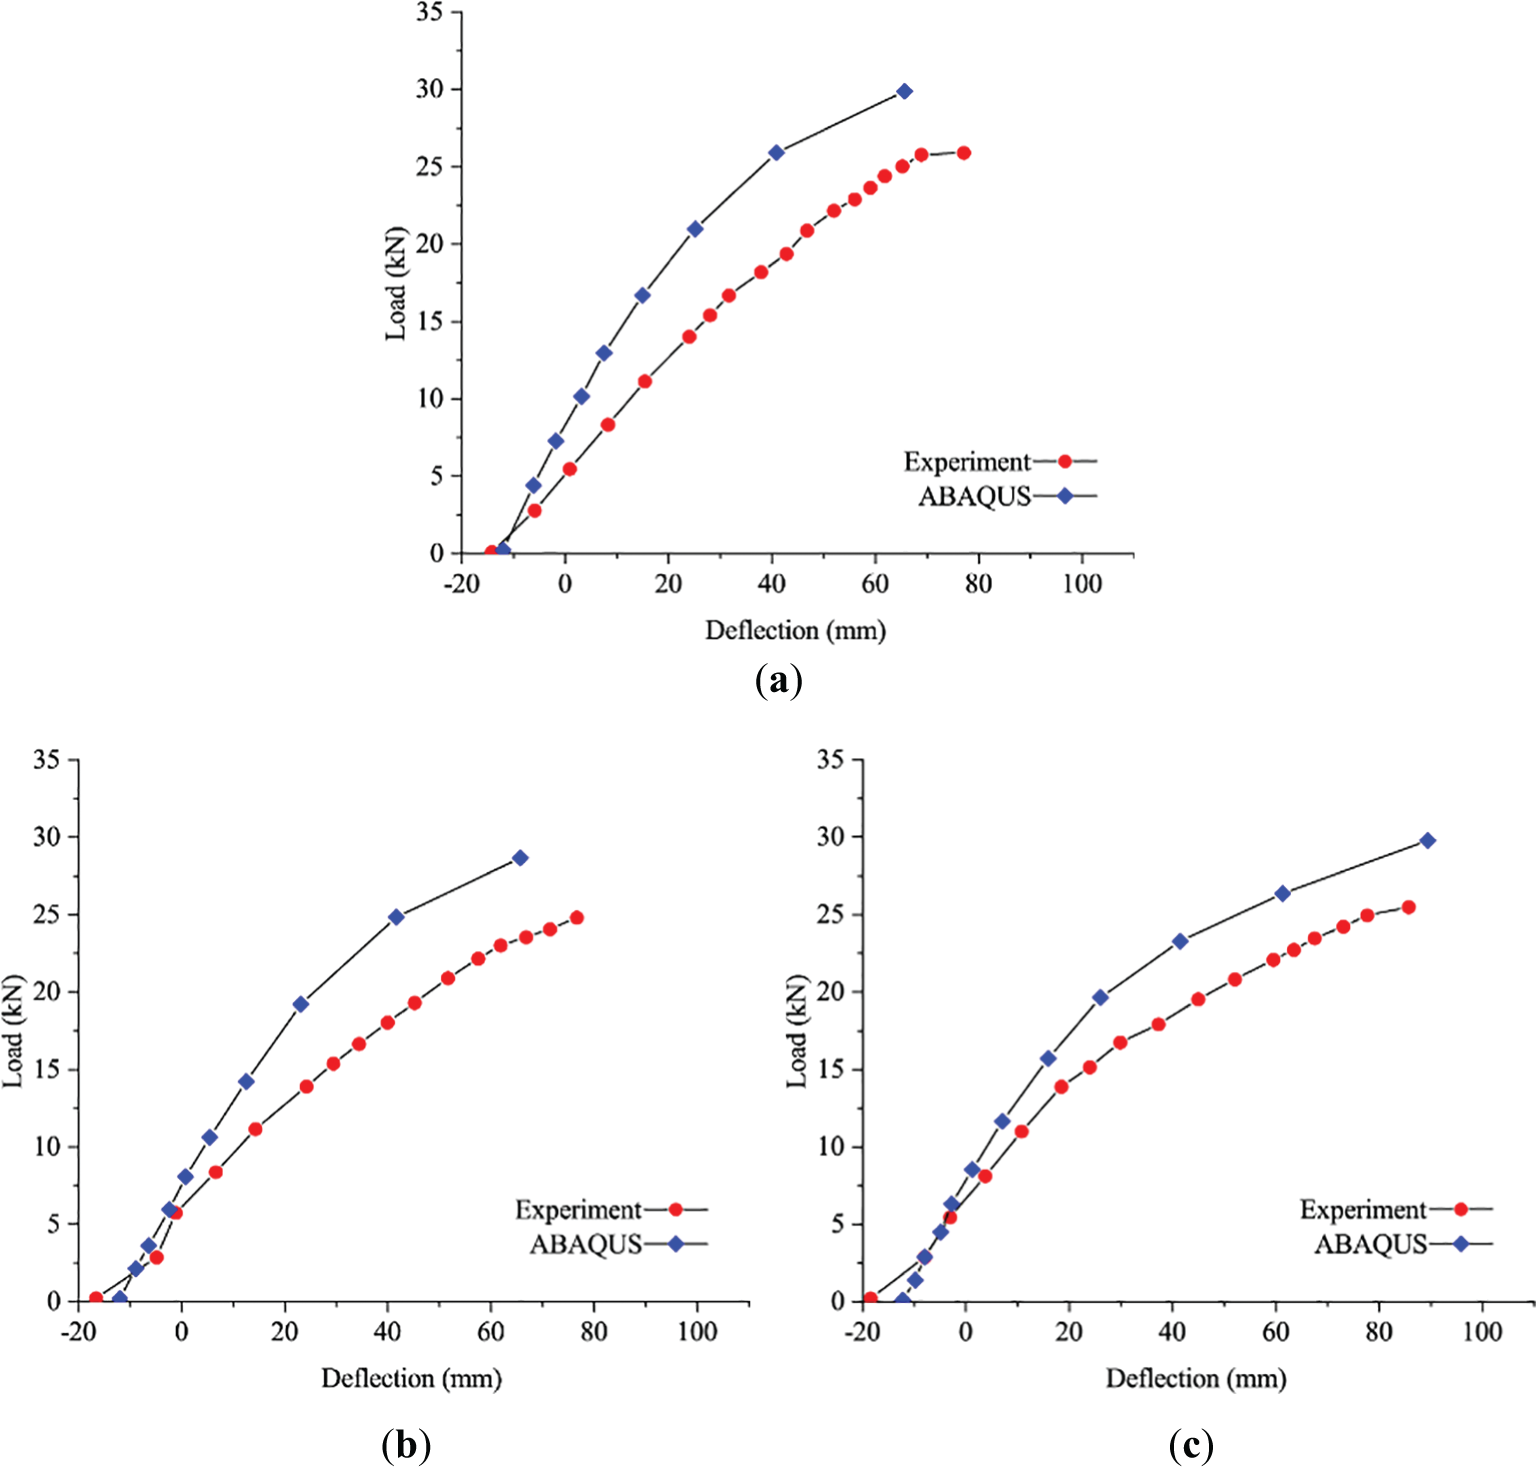
Figure 10: The experiment and simulation comparison of the B group
According to Figs. 9 and 10, it is easy to observe that the deflection from the experiment is slightly higher than that of the FEM during the prestressing stage, the reason is that the length of the wires is slightly shorter to keep the right location of the wire, and no slip between the steel boot and the heading anchor. However, it also could result in a larger deflection. But it could be a perfect condition in the simulation model, the contact between them is set by interaction so that this error could be avoided.
And then during the elastic loading stage, the curve slope of the model is slightly higher than the real value, because of the initial imperfection of the experimental specimens. In the simulation model, the beam is perfect, so they could not be impacted by natural knots, twill, and moisture ratio. Hence, these imperfections result in the difference.
During the elastic-plastic loading stage, the model did not input the initial imperfection codes so that it could predict failures resulting from knots and other drawbacks. But the destructive phenomenon caused by tensile and splitting failure could be estimated by yield strength and strain which could be applied to evaluate the nonlinear deformation, so the curves from the simulation could be by experiments.
And the stress distribution and deformation of the typical model are shown in Fig. 11, it is easy to find the deformation of the model at different stages is similar to the experiments. Therefore, based on the above comparison and analysis, the simulation model based on the above modeling method could be applied to predict the bending performance of the prestressed beam.
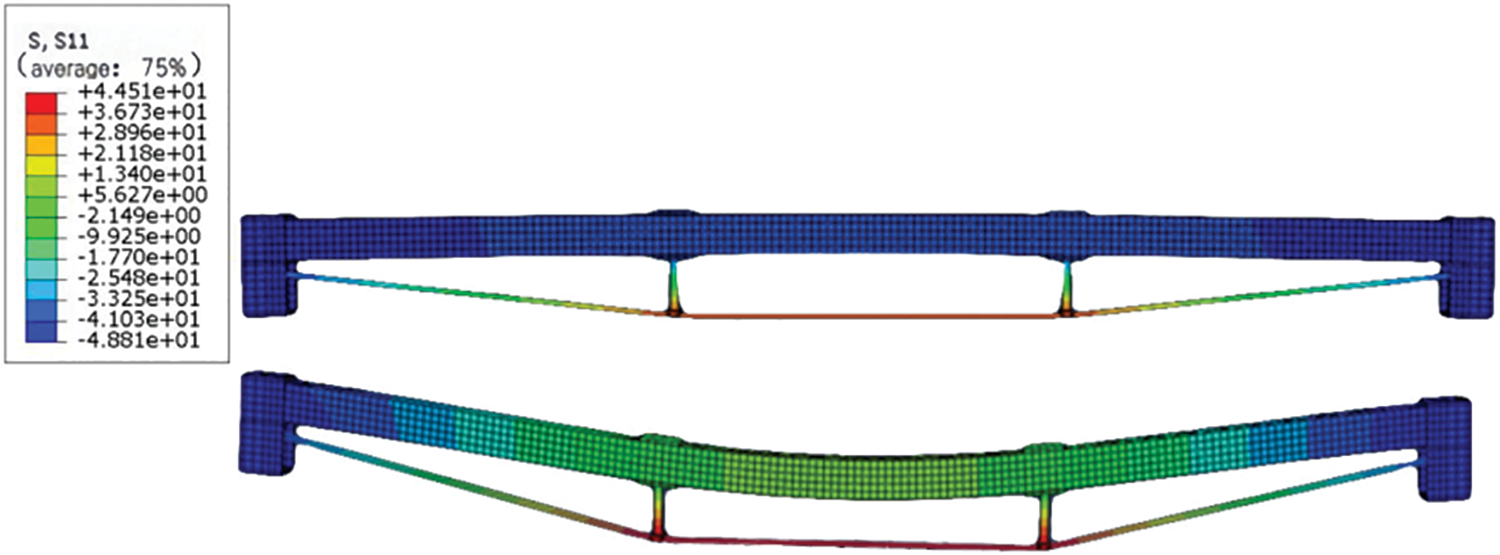
Figure 11: Stress cloud of the model
3.3 Relationship between the Force Arm and the Capacity
To have a better understanding of the relationship between the force arm and the capacity, the force arm value of both groups is set as the X axis and the counterpart is regarded as the Y axis, as shown in Figs. 12 and 13. Based on the data from the A group, the fitting formula could be obtained, which is Y = 0.0486x + 18.075, and its variance (R2) is 0.9851 indicating it is a high fitting formula. The formula shows that with the increase of the force arm, the bearing capacity of the pre-stressed Glulam beam could be improved linearly, and with the large slope, the effect is noticeable.
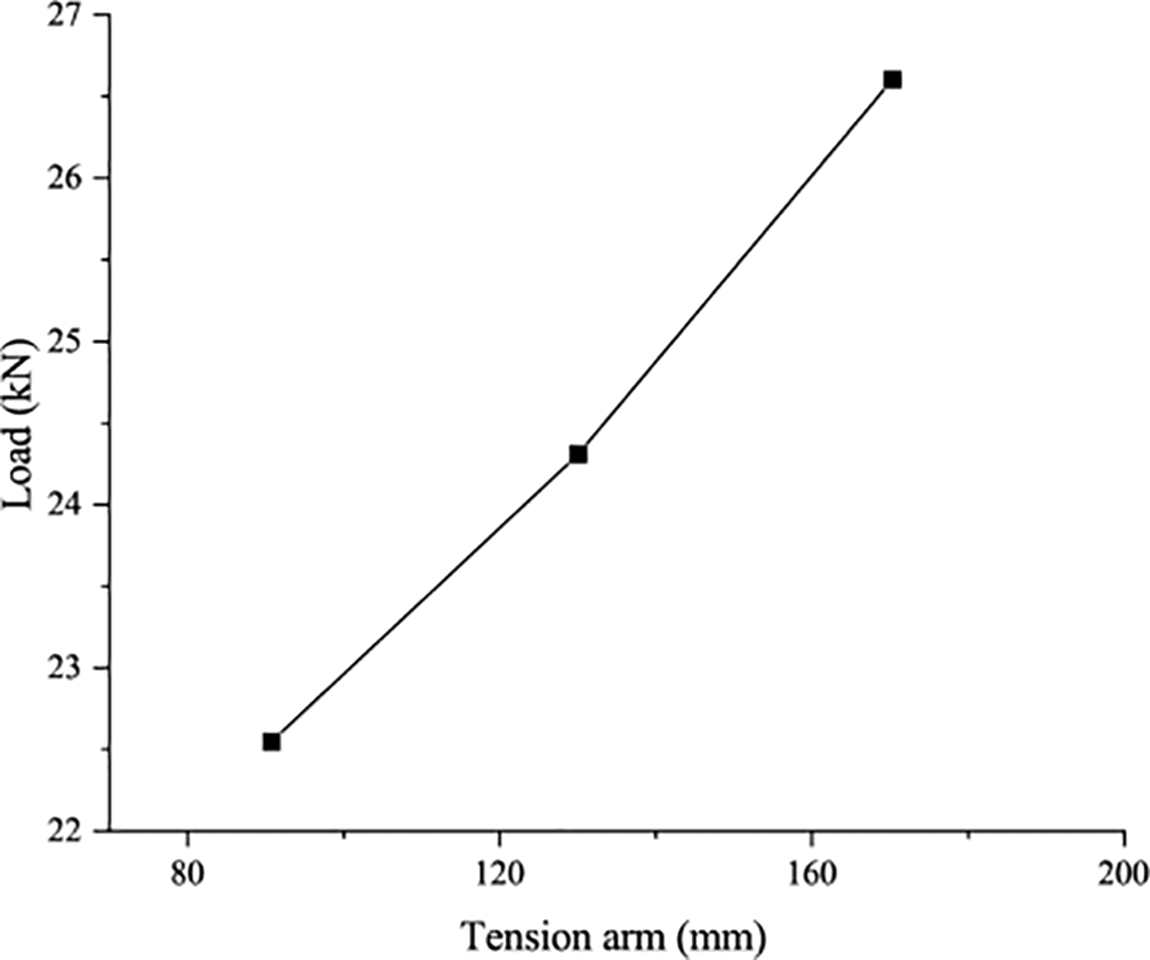
Figure 12: Force arm-capacity curve of A group
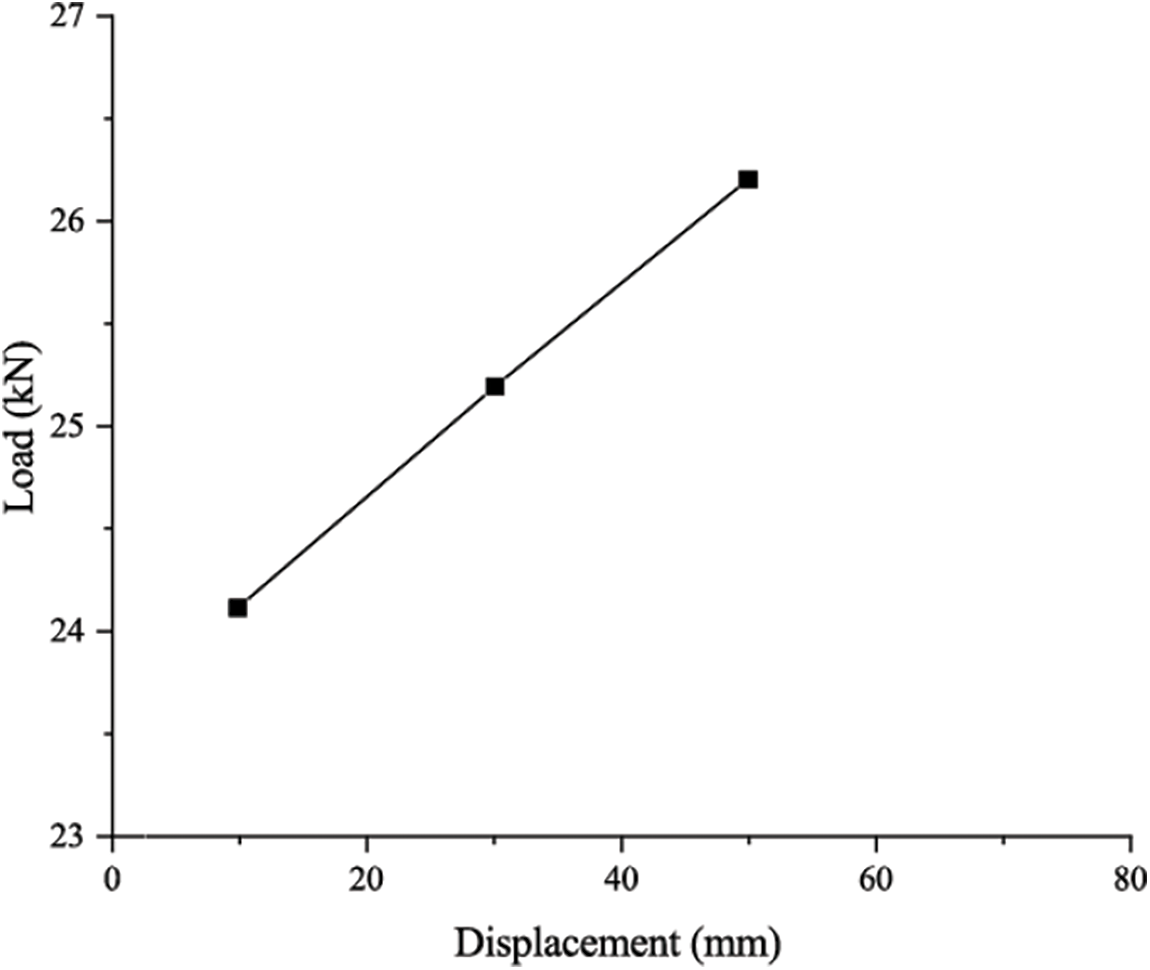
Figure 13: Load-bearing capacity arm value curve of B group
Based on the data from the B group, the fitting formula could be obtained, which is Y = 0.049x + 23.645, and its variance (R2) is 0.9991, indicating it is a high fitting formula. The formula shows that with the increase of the force arm, the bearing capacity of the pre-stressed Glulam beam could be improved linearly, and as the large slope, the positive effect on the stiffness is negligible.
To investigate the effect of the force arm fully, the finite element parametric analysis is grouped in the following Table 7.
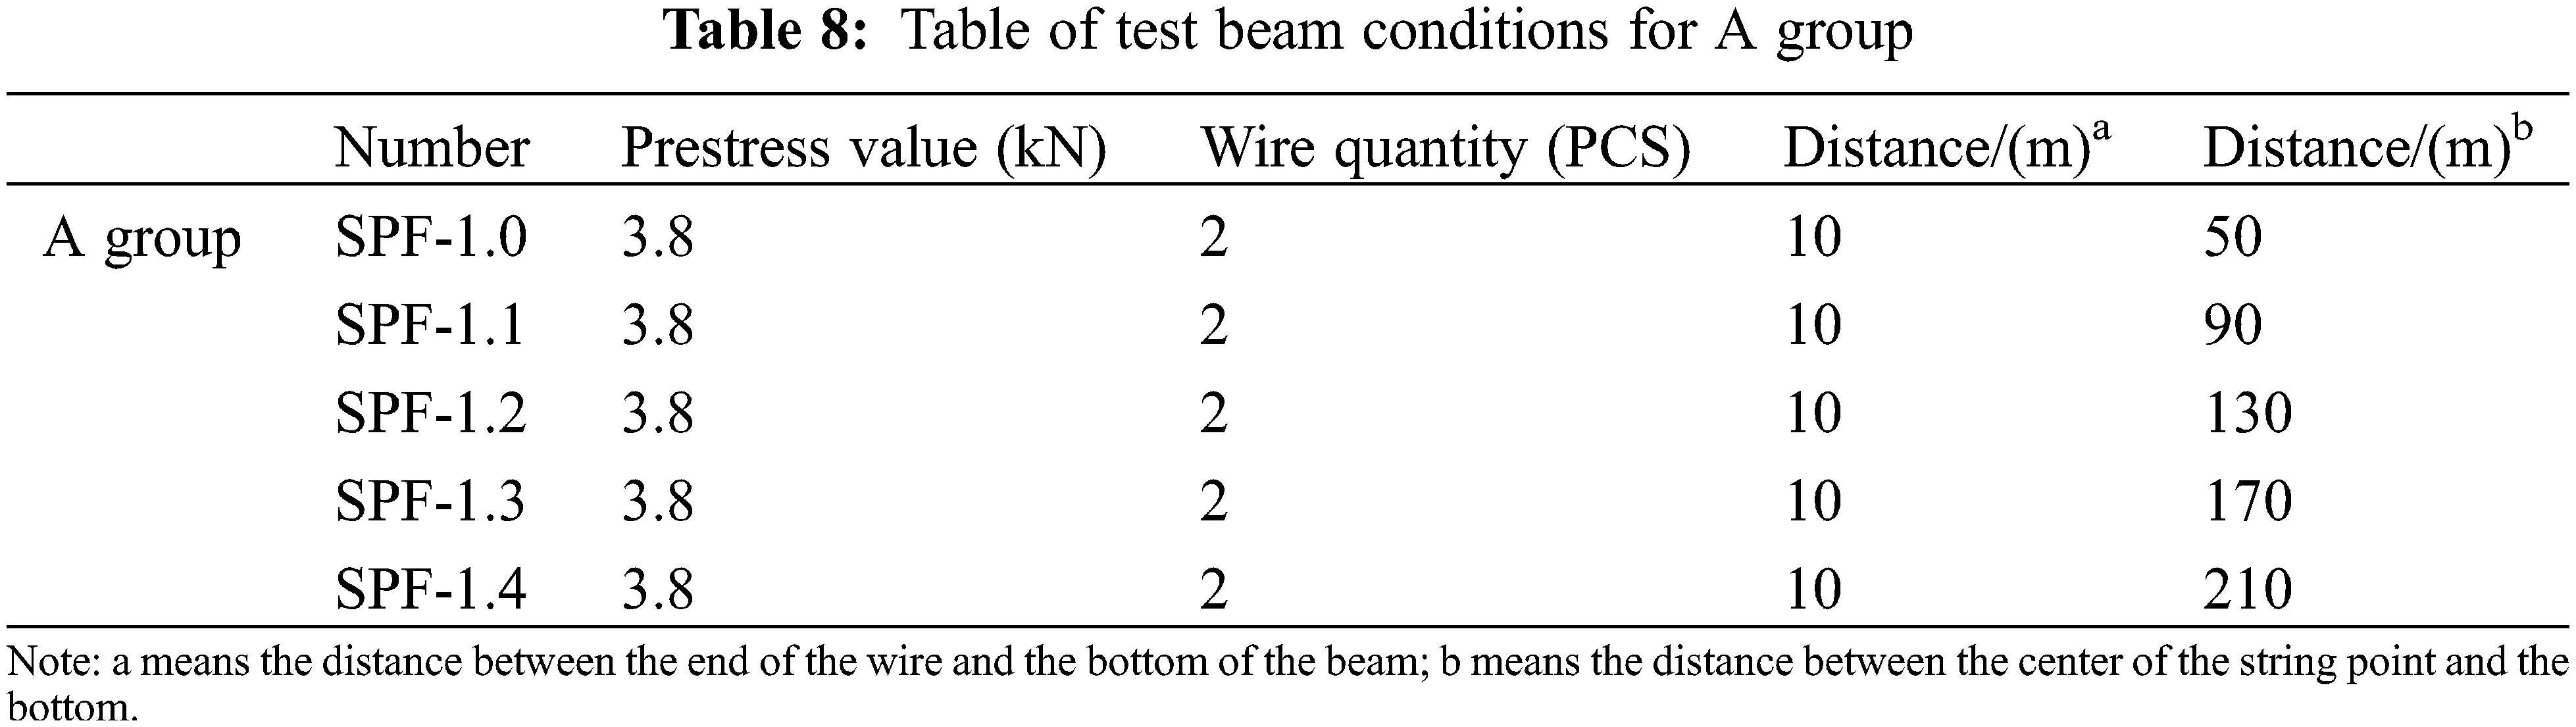
4.2 The Effect of the String Force Arm
Based on the above discussion, the simulation method could predict the experimental result accurately, so to have a better understanding of the effect of the string force arm on the bending performance and stiffness, A group based on SPF-1.0 and SPF-1.4 is investigated, the end arch location of this investigation group is same, but the string point is different, the details are listed in Table 8 (A group). Adjusting the wire location after prestressing and the wire strain to ensure the length of the bolt and the wire, so the applied prestress value could be ensured.
Extracting the ultimate strain at the bottom of the beam to obtain the corresponding ultimate load value, which is the ultimate bending capacity. And then based on load-deflection curves, the effect of the string force arm could be ensured.
As shown in Fig. 14, when the prestressing value is the same, the initial deflection keeps increasing with the string force arm increasing. The initial deflection could not improve the ultimate bearing capacity. Still, it could reduce the deformation and slow down the development of cracks, so it plays an indirect role in improving the ultimate strength of the beam. And then, it is easy to find that with the force arm increasing, the slope of the curve increases, meaning the stiffness of the beam could be improved. Hence, it reduces the middle deflection and the negative effect of initial drawbacks such as knots to enhance the bending performance of the beam.
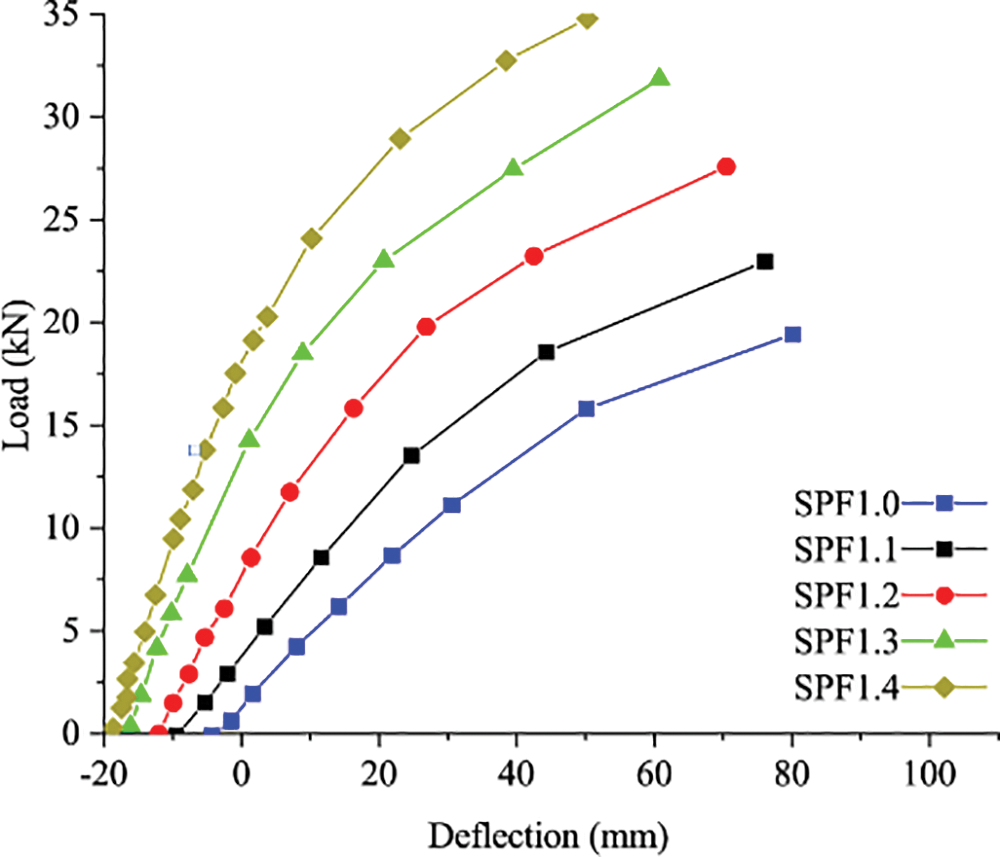
Figure 14: The load-deflection curves of the A group
To have a better understanding of the effect of the end force arm, SPF-0.2, and SPF-4.2 are enriched to form the B group. B group keeps the same string point location and different end anchor location to investigate the effect on the bearing capacity and deformation.
However, during the simulation process of the B group, it is tough to simulate the model as the bolt would be extended to 130 mm to drive the wire to reach 480 MPa, and the force arm needs to be 70 mm. Therefore, Step 3 had been added to increase the strain of the wire, which is to ensure the prestress.
The load-deflection curve is shown in Fig. 15, and it is easy to find that increasing the end force arm has a slight positive effect on improving the initial deflection, and curves from different specimens are similar. But with the increase of the end force air, the slope of curves could have a slight increase, indicating the bending stiffness could be enhanced, it is in accordance with the experimental results.
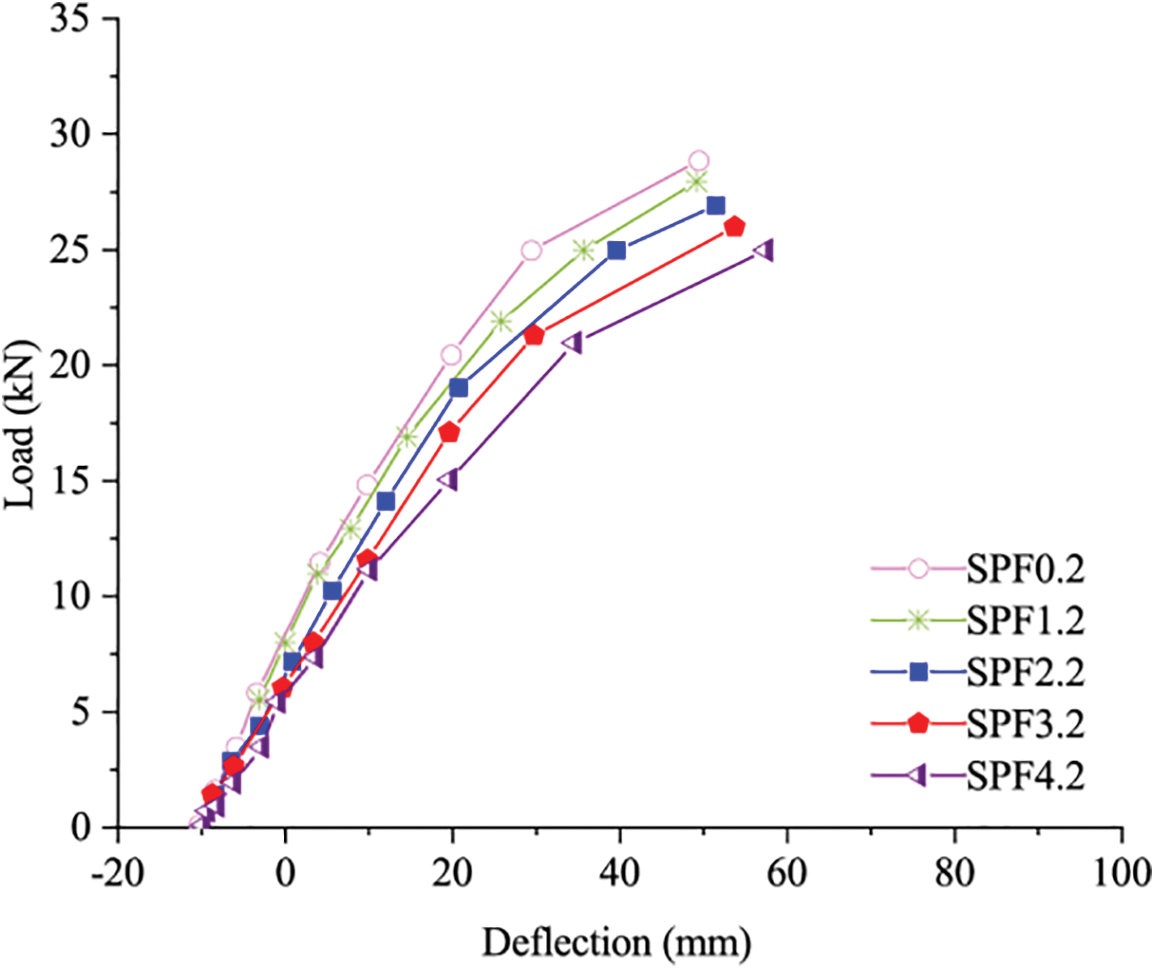
Figure 15: Load deflection curve of B group finite element model
To demonstrate and compare the stress distribution, the stress cloud of the beams is shown in Fig. 16. And as the full beam could display the stress cloud well and the beam is a symmetrical structural element, half of the beam is selected to show the stress cloud.
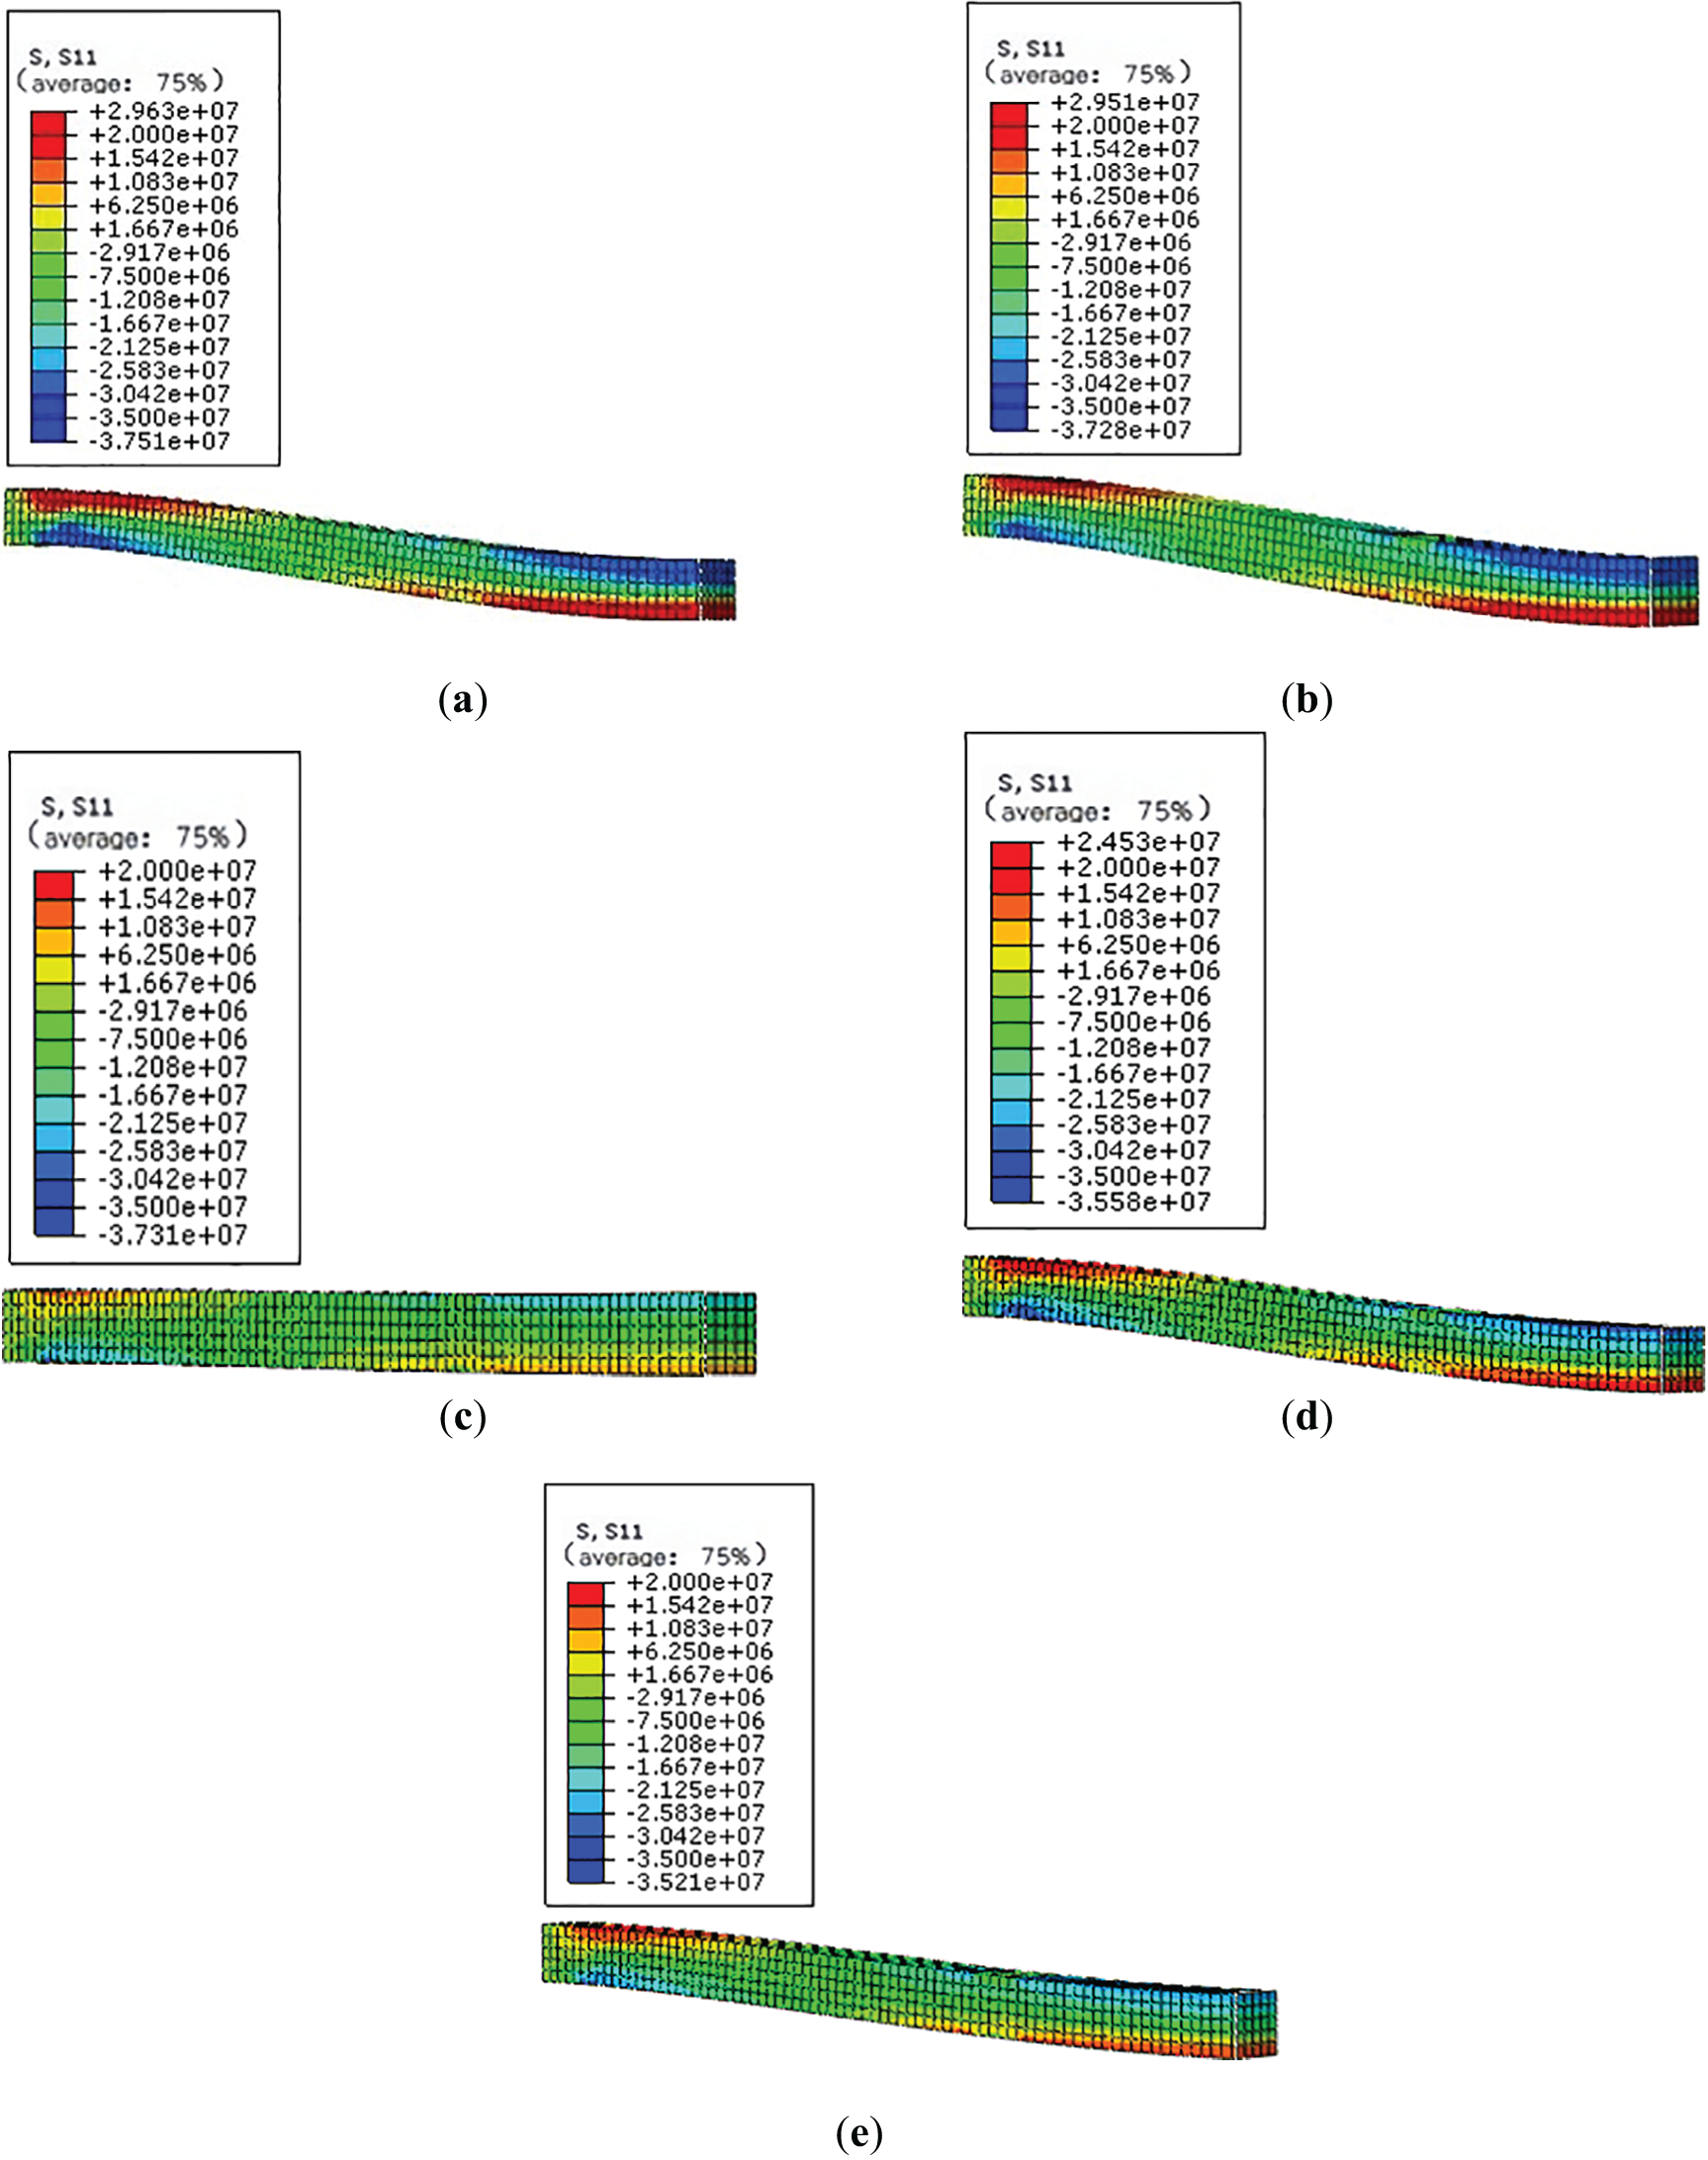
Figure 16: The cloud distribution of the Glulam beam
Experimental results show that the bearing capacity of most of the beam is below 28 kN, so all could show the stress when the beam bore 28 kN load. A group keeps the same load, with the increase of the force arm at the turning block, the maximal tensile and compression stress tends to be decreased. The reason is that increasing the force arm could enable the wire to make more contribution to the moment, and then the beam could bear less moment. Hence, it could improve the stiffness indirectly. In the stress cloud of the B group, the load is the same, and with the end force arm increasing, the maximal tensile stress tends to be small, but the downward trend is not obvious. Meanwhile, the local squeezing phenomenon on the upper and lower surfaces of the Glulam beam in contact with the iron shoe is becoming increasingly severe, resulting in the bottom of the beam end being compressed and cracks being generated at the top, it is in accordance with the experimental result.
Under the action of external loads, the stress analysis of prestressed Glulam beams is shown in Fig. 17, and the following three failure modes may occur:
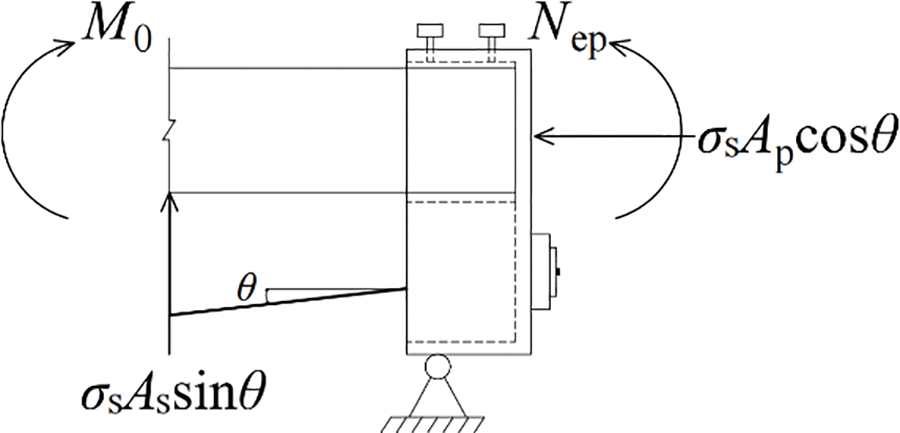
Figure 17: The stress analysis of prestressed Glulam beams
1) Beam failure due to bending
The Glulam beams part is a compression bending component, and its bearing capacity can be calculated according to Eq. (3), where the pressure is the horizontal component of the steel wire tension
where
2) Rope failure due to traction surface
When the stress on the steel wire exceeds its tensile strength, the steel wire fails and is subjected to verification according to Eq. (5).
3) Due to compression of the texture perpendicular to the rope support
The axial force of a string rod is equal to the vertical component of the steel wire tension
Based on the simulation and experimental results, with the same end force arm, increasing the string force arm could improve the stiffness, bearing capacity, and deformation resistance of the beam; but just increasing the end force arm, they could be improved slightly. But excessive end force arm can cause local compression failure of the beam end section in practice. Therefore, it is necessary to increase the three-point string force arm as much as possible and take the appropriate end force arm to ensure the suitable force arm.
As for this experiment and simulation, as the steel boot at the beam end is impacted by the bolt of the turning block, the distance between the string force arm and the bottom of the beam should be 170 to 210 mm, and the 30 mm between end force arm and the bottom of the beam is suitable. The proposed force arm length could improve the stiffness of the beam as well as avoid the buckling of the bolt caused by its excessive length.
Based on the previous investigation, a series of models was simulated to have a better understanding of the prestressed beam, and it also provides more accurate results; the conclusions are as follows:
1. Based on the simulation results, with the same end force arm, increasing the string force arm could improve the bearing and deformation resistance capacity, and stiffness of the beam significantly.
2. With the same string force arm, with the increase of the end force arm, the bending capacity and the stiffness could not be improved obviously. One reason is that the angle between the wire and the anchorage is small, so the moment could not have much contribution to initial deflection. The other one is the compression stress at the end of the beam could harm the beam with the initial deflection increasing.
3. Based on the experiment and simulation results, the distance between the string force arm and the bottom of the beam should be 170 to 210 mm, and 30 mm between the end force arm and the bottom of the beam is recommended. The recommended force arm could ensure enough stiffness of the beam and avoid bolt buckling.
Acknowledgement: The authors are grateful for the financial support provided by the Resources Industry Science and Technology Innovation Joint Funding Project of Nanping, the Special Project of Service Industry Research of Wuyi University, the Research Launch Fund of Wuyi University’s Introduct Talent, the Fujian Training Program of Innovation and Entrepreneurship for Undergraduates.
Funding Statement: This work was supported by the Resources Industry Science and Technology Innovation Joint Funding Project of Nanping (N2021Z003); the Special Project of Service Industry Re-search of Wuyi University under Grant (2021XJFWCY03); the Research Launch Fund of Wuyi University’s Introduct Talent (YJ202309); and the Fujian Training Program of Innovation and Entrepreneurship for Undergraduates (S202210397076); Research on the Stress Performance of Reinforced Bamboo Highway Guardrail with Embedded Channel Steel (LS202304).
Author Contributions: The authors confirm contribution to the paper as follows: study conception and design: Yan Zhao, Yuanyan Wu; data collection: Yuanyan Wu, Shengliang He, Chenzheng Lv; analysis and interpretation of results: Yan Zhao, Yuanyan Wu, Shengliang He; draft manuscript preparation: Yan Zhao, Shengliang He, Zhenglu Gao, Ziyan Huang. All authors reviewed the results and approved the final version of the manuscript.
Availability of Data and Materials: The authors confirm that the data supporting the findings of this study are available within the article.
Conflicts of Interest: The authors declare they have no conflicts of interest to report regarding the present study.
References
1. Wu JJ, Weng J. Study on advantages of modern wood structure construction. Fujian Constr. 2011;7:29–31 (In Chinese). [Google Scholar]
2. Corduban C, Tăranu N, lsopescu D. Modern wooden structures. Between archetype and inovation. Bulletin of the Polytechnic Institute of Jassy. 2011;57(61):105–12. [Google Scholar]
3. Dániel H, Habashneh M, Rad MM. Reliability-based numerical analysis of glulam beams reinforced by CFRP plate. Sci Rep. 2022;12(1):13587. doi:10.1038/s41598-022-17751-6. [Google Scholar] [PubMed] [CrossRef]
4. Ramage MH, Burridge HC, Busse-Wicher M, Fereday G, Reynolds T, Shah DU, et al. The wood from the trees: the use of timber in construction. Renew Sustain Energ Rev. 2017;68:333–59. doi:10.1016/j.rser.2016.09.107. [Google Scholar] [CrossRef]
5. de Luca V, Marano C. Prestressed glulam timbers reinforced with steel bars. Constr Build Mater. 2012;30:206–17. doi:10.1016/j.conbuildmat.2011.11.016. [Google Scholar] [CrossRef]
6. Yang H, Ju D, Liu W, Lu W. Prestressed glulam beams reinforced with CFRP bars. Constr Build Mater. 2016;109:73–83. doi:10.1016/j.conbuildmat.2016.02.008. [Google Scholar] [CrossRef]
7. McConnell E, McPolin D, Taylor S. Post-tensioning of glulam timber with steel tendons. Constr Build Mater. 2014;73:426–33. doi:10.1016/j.conbuildmat.2014.09.079. [Google Scholar] [CrossRef]
8. Zuo HL, Yang YW, Guo N, He DP. Finite element analysis of flexural performance of prestressed glulam beams string structure. J Liaoning Tech Univ. 2015;34(3):390–4 (In Chinese). [Google Scholar]
9. Zuo HL, Sun X, Zuo Y, Guo N. Bending performance test on the prestressed reinforced glue-lumber beam. J North For Univ. 2016;44(2):42–6 (In Chinese). [Google Scholar]
10. Li MF, Wu MT, Guo N, Mei LD, Zhao YX. Analysis of four types of anchorage devices for prestressed glulam beam and experimental research. Materials. 2021;14(21):6494. doi:10.3390/ma14216494. [Google Scholar] [CrossRef]
11. Mei LD, Guo N, Zuo HL, Li L, Li GD. Influence of the force arm on the flexural performance of prestressed glulam beams. Adv Civil Eng. 2021;2021:e8831406. doi:10.1155/2021/8831406. [Google Scholar] [CrossRef]
12. Zhang Q. Experimental investigation on the stress performance of laminated plywood beams. Sichuan Build Mat. 2018;44(9):76–7 (In Chinese). [Google Scholar]
13. de Santis Y, Pasca DP, Aloisio A, Stenstad A, Mahnert KC. Experimental, analytical and numerical investigation on the capacity of composite glulam beams with holes. Eng Struct. 2023;285:115995. doi:10.1016/j.engstruct.2023.115995. [Google Scholar] [CrossRef]
14. Zhang J, Shen H, Qiu RG, Xu QF, Gao S. Short-term flexural behavior of prestressed glulam beams reinforced with curved tendons. J Struct Eng. 2020;146(6):596. doi:10.1061/(ASCE)ST.1943-541X.0002625. [Google Scholar] [CrossRef]
15. Mei LD, Guo N, Li L, Li GD. Study on flexural performance of prestressed glulam continuous beams under control influence. J Wood Sci. 2021;67(1):48. doi:10.1186/s10086-021-01980-w. [Google Scholar] [CrossRef]
16. Yang HF, Liu WQ, Lu WD, Zhu SJ, Geng QF. Flexural behavior of FRP and steel reinforced glulam beams experimental and theoretical evaluation. Constr Build Mat. 2016;106(3):550–63. doi:10.1016/j.conbuildmat.2015.12.135. [Google Scholar] [CrossRef]
17. Soriano J, Pellis Bruno PM, Nilson T. Mechanical performance of glued-laminated timber beams symmetrically reinforced with steel bars. Compos Struct. 2016;150(8):200–7. doi:10.1016/j.compstruct.2016.05.016. [Google Scholar] [CrossRef]
18. Guo N, Jiang HX, Zuo HL. The research on flexural behavior experiment of pre-stressed glue-lumber beams after long-term loading. Model, Meas Control B. 2017;86(1):49–62. doi:10.18280/mmc_b. [Google Scholar] [CrossRef]
19. Guo N, Wang YJ, Zuo HL. Study of short-term flexural behavior for glue-bamboo and lumber beams under different pre-stressed states. Civil Eng J. 2017;26(2):128–42. doi:10.14311/CEJ.2017.02.0012. [Google Scholar] [CrossRef]
20. Wang XL, Qu WL. Long-term cumulative damage model of historical timber member under varying hygrothermal environment. Wuhan Univ J Nat Sci. 2009;14(5):430–6. doi:10.1007/s11859-009-0512-2. [Google Scholar] [CrossRef]
21. Yahyaei-Moayyed M, Taheri F. Creep response of glued-laminated beam reinforced with pre-stressed sub-laminated composite. Constr Build Mater. 2011;25(5):2495–506. doi:10.1016/j.conbuildmat.2010.11.078. [Google Scholar] [CrossRef]
22. Yahyaei-Moayyed M, Taheri F. Experimental and computational investigations into creep response of AFRP reinforced timber beams. Compos Struct. 2011;93(2):616–28. doi:10.1016/j.compstruct.2010.08.017. [Google Scholar] [CrossRef]
23. Chen X, Zhu E. Moisture and thermal stresses in glulam beams. Ind Constr. 2008;S1:826–66. [Google Scholar]
24. Chen Z, Zhu E, Pan J. Numerical simulation of wood mechanical properties under complex stress states. Chinese J Comput Mech. 2011;28:629–34+640 (In Chinese). [Google Scholar]
25. Anshari B, Guan ZW, Wang QY. Modelling of glulam beams pre-stressed by compressed wood. Compos Struct. 2017;165:160–70. doi:10.1016/j.compstruct.2017.01.028. [Google Scholar] [CrossRef]
26. Standardization Administration of the People’s Republic of China. Structural glued laminated timber. Beijing: China Architecture & Building Press; 2011. [Google Scholar]
27. Standardization Administration of the People’s Republic of China. Methods of testing in compressive strength parallel to grain of wood. Beijing: China Architecture & Building Press; 2009. [Google Scholar]
28. National Standard of the People’s Republic of China. Standard for test methods of timber structures. Beijing: China Architecture & Building Press; 2012. [Google Scholar]
29. Andarini RD, Raftery GM. Experimental assessment of self-tapping screws for the reinforcement of multiple holes in laminated veneer lumber beams. Structures. 2023;57:105275. doi:10.1016/j.istruc.2023.105275. [Google Scholar] [CrossRef]
30. Guo N, Wu MT, Li L, Li GD, Zhao Y. Bending performance of prestressed continuous glulam beams. Adv Civil Eng. 2021;2021:e5512350. doi:10.1155/2021/5512350. [Google Scholar] [CrossRef]
31. Liu X, Zhang P, Guo N. Study on flexural performance of prestressed gluing bamboo beam on the basis of ABAQUS. Shanxi Archit. 2016;42(1):48–9 (In Chinese). [Google Scholar]
Cite This Article
 Copyright © 2024 The Author(s). Published by Tech Science Press.
This work is licensed under a Creative Commons Attribution 4.0 International License , which permits unrestricted use, distribution, and reproduction in any medium, provided the original work is properly cited.
 Downloads
 Citation Tools