
 Submit a Paper
 Propose a Special lssue
 Open Access
ARTICLE

Impact Damage Testing Study of Shanxi-Beijing Natural Gas Pipeline Based on Decision Tree Rotary Tiller Operation
1 School of Petroleum and Natural Gas Engineering, Southwest Petroleum University, Chengdu, 610500, China
2 National Pipe Network Group Southwest Pipeline Co., Chengdu, 610500, China
* Corresponding Author: Kai Zhang. Email:
Structural Durability & Health Monitoring 2024, 18(5), 683-706. https://doi.org/10.32604/sdhm.2024.049536
Received 10 January 2024; Accepted 03 April 2024; Issue published 19 July 2024
 View Full Text
 Download PDF
Abstract
The North China Plain and the agricultural region are crossed by the Shanxi-Beijing natural gas pipeline. Residents in the area use rototillers for planting and harvesting; however, the depth of the rototillers into the ground is greater than the depth of the pipeline, posing a significant threat to the safe operation of the pipeline. Therefore, it is of great significance to study the dynamic response of rotary tillers impacting pipelines to ensure the safe operation of pipelines. This article focuses on the Shanxi-Beijing natural gas pipeline, utilizing finite element simulation software to establish a finite element model for the interaction among the machinery, pipeline, and soil, and analyzing the dynamic response of the pipeline. At the same time, a decision tree model is introduced to classify the damage of pipelines under different working conditions, and the boundary value and importance of each influencing factor on pipeline damage are derived. Considering the actual conditions in the hemp yam planting area, targeted management measures have been proposed to ensure the operational safety of the Shanxi-Beijing natural gas pipeline in this region.Keywords
Third-party sabotage is the leading cause of pipeline failures, according to the 2020 EGIG Accident Statistics Report [1], and pipeline accidents caused by third-party sabotage occurred at a rate of up to 27% between 2010 and 2019, a higher percentage than other accident factors. Mechanical operations in third-party vandalism, as the most prevalent vandalism factor, pose a major threat to the safe operation of natural gas pipelines. Current research on rotary tillers acting on pipelines is limited, although directions and more in-depth discussions can be found in similar articles.
More study has been conducted on pipeline damage testing during mechanical operations. Brooker [2–4] investigated the pipeline puncture load caused by the impact of the excavation bucket teeth, developed a calculation model of the pipeline puncture load, analyzed the impact of various parameters on the puncture load, and compared the results with numerical simulation. Yao et al. [5] examined the dynamic stress distribution of underground gas pipelines and excavation limit loads, as well as the dynamic response of town gas pipelines under excavation loads. The dynamic reaction of buried pipelines under excavation was researched by Liu et al. [6], and the study discussed the impacts of excavation location, pipe diameter, wall thickness, and operating pressure on the damage of polythene pipes.
However, rototiller-based research has mostly focused on optimizing the rototiller itself, with little attention paid to the effects of the rototiller on the surrounding pipeline. Jiao [7] used ANSYS to provide an innovative design and decision analysis for a tracked rototiller. Using three-dimensional virtual simulation software, Wang [8] optimized the design of a rotating tiller.
Because the role of the rotary plow poses a certain danger to the pipeline’s safe operation, risk management and control were developed. A variety of risk management technology methods are regularly developed and implemented as computer technology advances. Cui et al. [9] modeled unintended third-party vandalism damage with Bayesian network terminology and purposeful vandalism with a game-theoretic method. Xiang et al. [10] developed a pipeline third-party damage probability model, learned the parameters of the BN model using an expectation-maximization technique, and improved pipeline integrity management using data-driven approaches. Soomro et al. [11] proposed applying machine learning to the pipeline integrity assessment system by feeding a huge amount of pipeline data into a machine-learning model to complete the target pipeline’s integrity review. There is a wealth of research on pipeline risk evaluation that should be addressed to identify the most relevant strategy for the study. Regarding the reliability study of pipelines, Yu et al. [12] used the inspection data to calculate the failure probability of small leaks and bursts, and the rank regression method was used to determine the optimal failure distribution function. Combining failure and maintenance data, they propose an innovative method for updating the failure distribution function and applying Bayesian methods and Markov Chain Monte Carlo (MCMC) simulation techniques to improve it, which provides a new perspective for updating the reliability of corroded natural gas pipelines.
Based on the literature review, the primary research emphasis in the field of damage testing under mechanical pipeline operation is on mechanical excavation. These studies have uncovered patterns of influence of various factors on pipeline failure damage. Whereas, research is more limited to rototiller-based studies. Research findings on rotary tiller testing for optional impact damage to pipelines are comparatively rare and differ significantly between locations. Therefore, when researching pipeline control measures, it is necessary to propose locally applicable control measures that can be effectively implemented in the area.
To determine the importance of each influencing factor and the conditions for the safe operation of pipelines, a decision tree model is introduced in this paper. In the application of decision tree models in the fields of oil and natural gas transportation as well as the petrochemical industry, Xu et al. [13] proposed a study based on a hybrid-driven model. They applied the decision tree model to the process discrimination of natural gas flow calibration stations. The method effectively identifies different processes and automatically adjusts to the optimal process, demonstrating strong intelligence and adaptability. This study provides an effective means to understand the importance of various factors in pipeline operation and, at the same time, lays the theoretical foundation for achieving efficient automatic calibration of natural gas flow metres.
As a result, the rotary tiller operation will be the subject of this research paper, which will then use the finite element method to investigate the influence law of the rotary tiller on pipeline damage under various influencing factors. Utilizing the decision tree model, this study will consider the specific environments of the pipelines in Shaanxi and Beijing and analyze the importance of each influencing factor. It will then define the essential parameters for safe pipeline operation during rotary tiller use and recommend practical risk management and control measures to ensure the safe operation of the natural gas pipeline.
2 Mechanical Examination of Pipes Rotating with a Tiller
The Shanxi-Beijing natural gas pipeline travels through the North China Plain, one of China’s three main plains. The North China Plain has a long history of farming culture and is also the most populous plain in China due to its ideal geographic location and high standard of living. Owing to the Shaanxi-Beijing Natural Gas Pipeline’s quick construction, new farmland is continuously being reclaimed in the pipeline’s vicinity. Additionally, the rotary tiller operation area will be overlapped with the pipeline’s route and even its laying lots. Operations involving rotary tillers present a serious risk to pipeline operations.
The study discovered an overlap between the gas pipeline’s shallowest burial level and the greatest depth at which rotary tillers can operate. For example, the maximum depth at which the jatropha can grow is approximately 1.2 meters, and the blade of a rotary tiller can be immersed in 1.5 meters of deep soil. Fig. 1 illustrates the potential location of crops and underground pipelines. If the jatropha is planted straight above the pipeline, there is a good chance that the rotary tiller will hit the adjacent pipeline while planting the jatropha. As a result, there will be a significant safety risk to the Shanxi-Beijing natural gas pipeline from agricultural activity.
Figure 1: Diagrammatic representation of potential locations of crops and underground pipes
2.2 Force Analysis of Buried Natural Gas Pipeline
Rototiller construction damages buried pipelines that are subject to static and dynamic loads from the outside. Static loads include the internal pressure of the gas pipeline operation and the pressure of the overburden above the pipeline. The dynamic loads are mainly rotational impact loads from the drill bit on the gas pipeline. As seen in Fig. 2, the pipe will deform significantly on its impact and shear sides when it is subjected to a load in a horizontal direction. The pipe will also be supported by a reverse force from the other side of the soil, and its two vertical directions will cause it to extrude to both sides of the deformation.
Figure 2: Schematic diagram of pipe force
3 The Theory of Decision Trees and Finite Elements
The force on the pipeline when the rotary tiller acts on the natural gas pipeline is modeled using finite element simulation software, and the modeling process and specific parameters are shown below. This is established for the specific case of the impact load on the pipeline by the rotary tiller in the agricultural area of the Shanxi-Beijing pipeline.
3.1.1 The Process of Building Finite Element Model
(1) Overburden model parameters
Because the soil to be estimated in compressive yield strength much surpasses the tensile yield strength [14] and because the specific soil parameters of the overburden model are presented in Table 1 below, the D-P model is chosen in this research to simulate the soil properties.
(2) Pipeline model
The pipe in the Shanxi-Beijing natural gas pipeline’s rotary tiller working area is X70, according to a field study. Thus, any homogeneous elastic-plastic model that complies with the Von-Mises yield criterion is selected for this paper’s research object, the X70 pipe, and its associated characteristics are provided in Table 2. According to the data in Table 2, when the maximum Mises stress is less than the material’s yield strength of 487 MPa, it indicates that the material is in the elastic deformation stage. When the maximum Mises stress is between the material’s yield strength of 487 MPa and the ultimate strength of 584 MPa, it suggests that the material undergoes plastic deformation. However, when the maximum Mises stress exceeds the ultimate strength of 584 MPa, it signifies that the pipeline has failed.
The pipeline’s rotary tiller operating area is buried at a depth of 0.8 meters, while the local agricultural area’s monopoly furrow is buried at a depth of 0.1–0.15 meters, and there is a local phenomenon called local rainfall scouring that causes some of the pipeline’s surface cover to be lost at a depth of 0.02–0.05 meters. As a result, the baseline finite element model in this work will use a modeling depth of 0.6 m and a pressure of 6.0 MPa as the operational pressure.
(3) Rotary tiller model
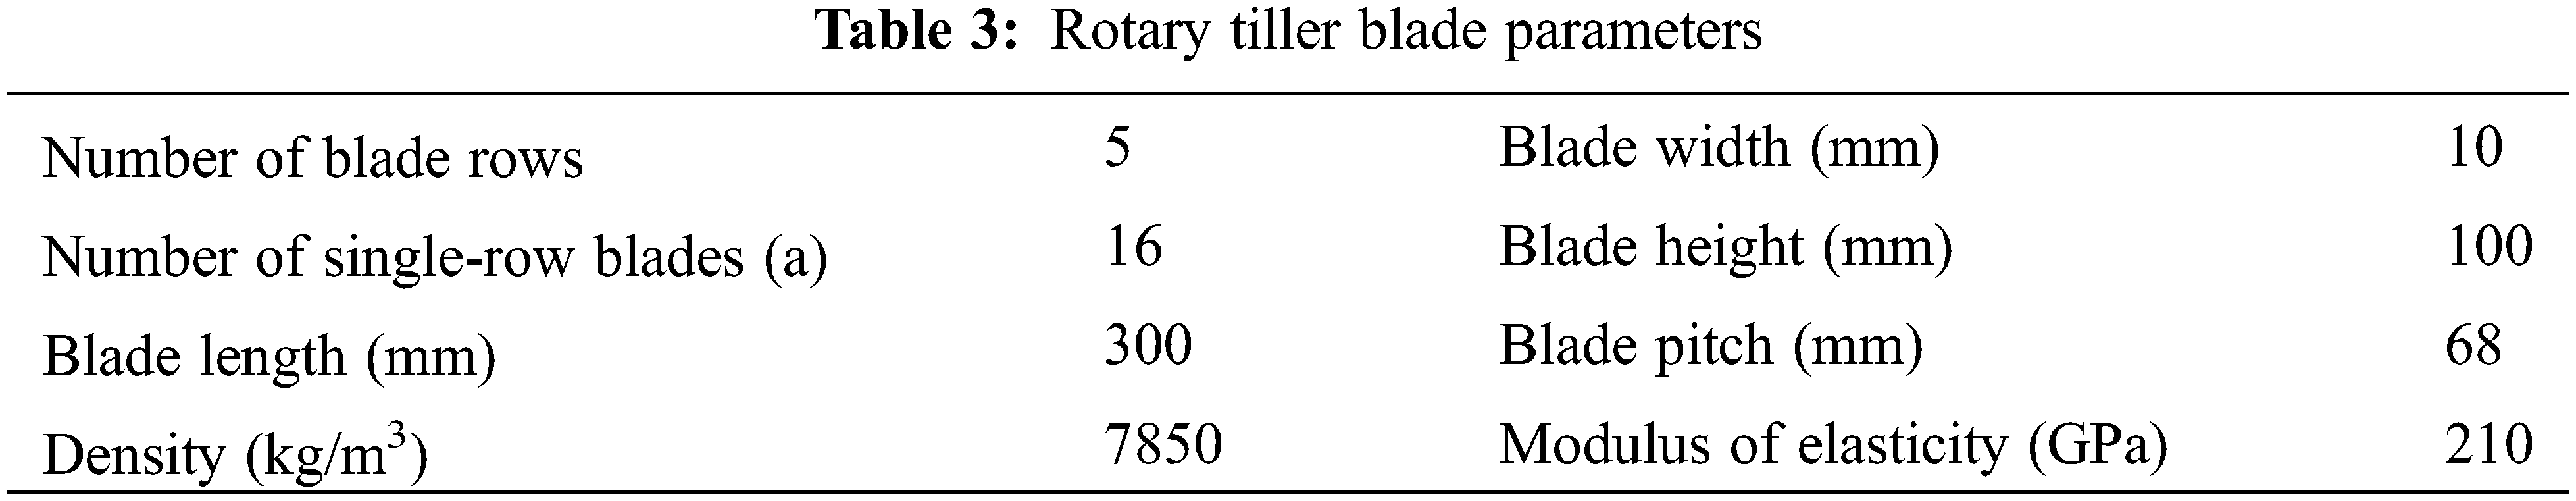
Figs. 3 and 4 depict the rototiller’s actual model and the blade’s finite element model, respectively. The rototiller uses eight different parameter variables in total: the number of blade rows, the number of single-sided blades, and the length, density, width, height, and spacing of the blades. The particular parameter settings are listed in Table 3 along with the model, which has the rototiller’s weight set to 3 t.
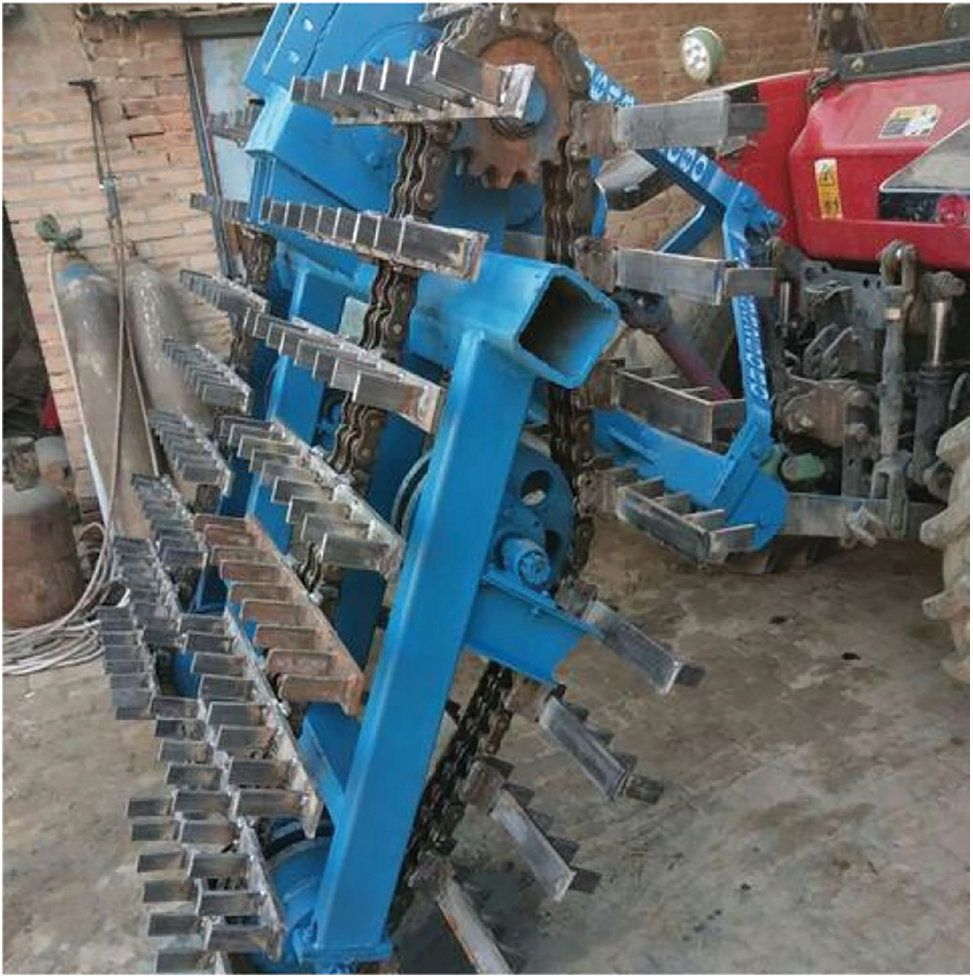
Figure 3: Actual diagram of rotary tiller
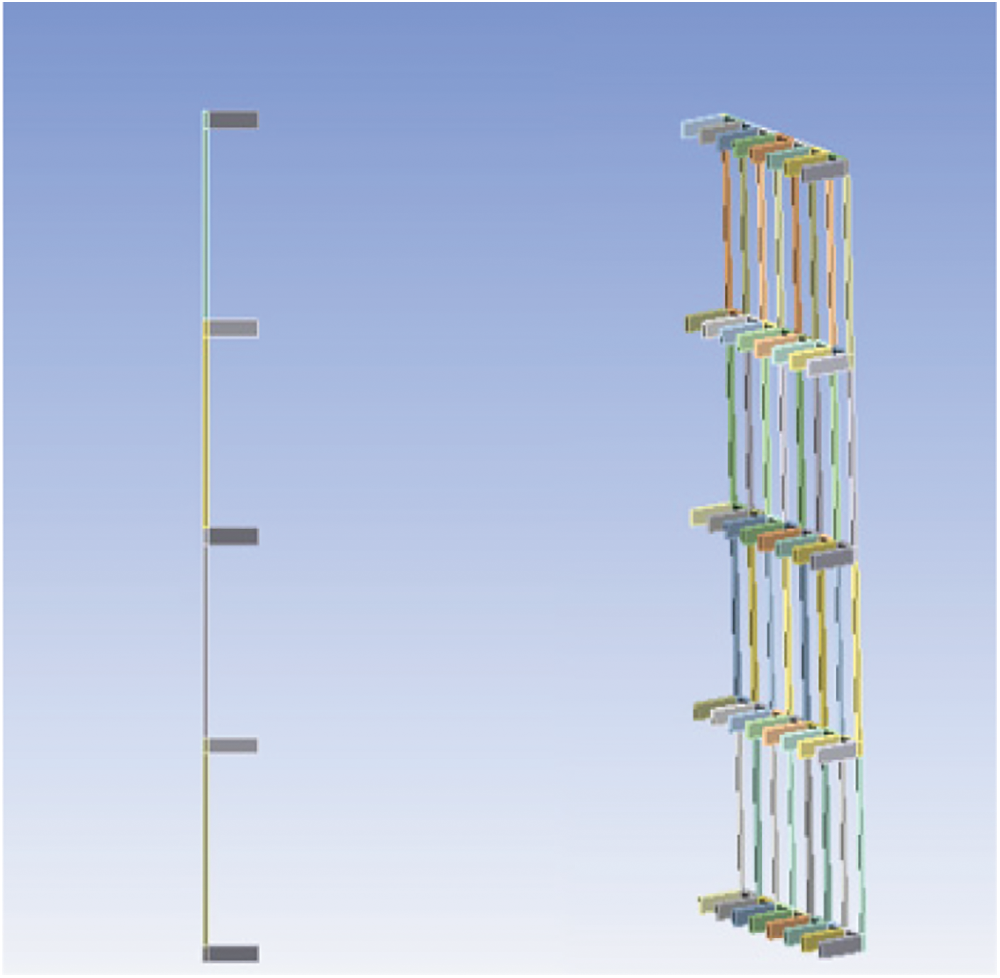
Figure 4: Finite element model diagram of rotary tiller
(4) Machine-earth pipe modelling using finite elements
Modeling the soil that will be semi-encapsulated by the pipe in conjunction with the actual site conditions results in a model with dimensions of 1000 mm by 800 mm by 1800 mm [15]; Frictional contact is established between the pipe and the soil body; the upper, bottom, and rear sides of the soil body are designated as fixed boundaries; The model collision process is reduced to a semi-infinite body that is subjected to impact loads, and the rotary tiller blade is restrained by a steel body. Fig. 5 illustrates the establishment of the machine-tube-soil finite element model.
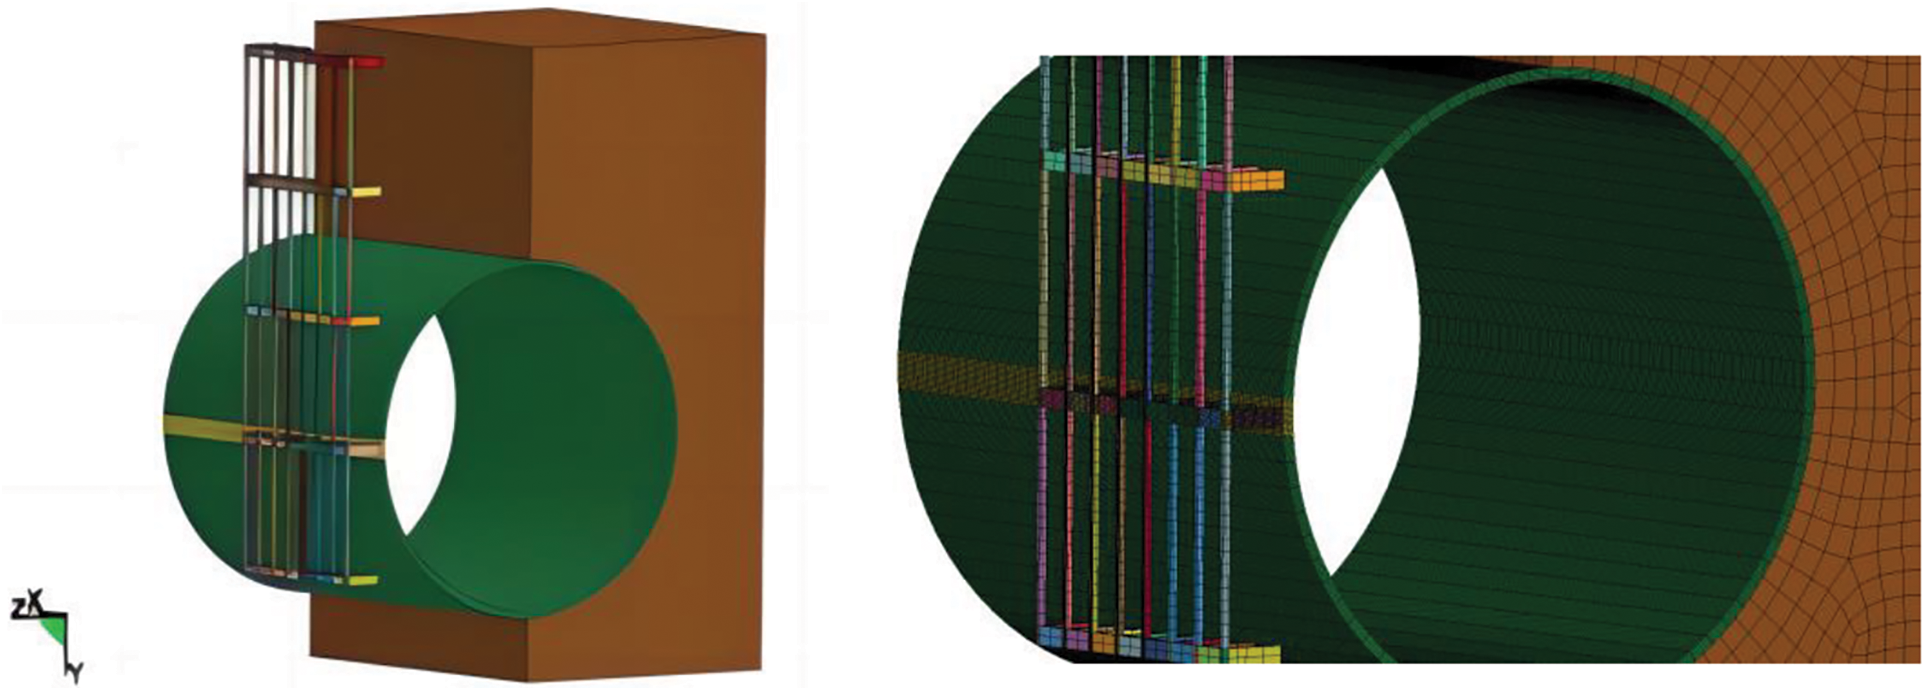
Figure 5: Meshing of the finite element model
To increase the effectiveness of numerical simulation, some assumptions on the rotary tiller’s effects on the pipe must be made due to its very complicated motion:
① In this soil environment, the soil is elastoplastic, uniformly distributed, and isotropic;
② Considering the small deformation of the rotary tiller blade in the process of soil breaking, the blade is set to be a rigid material;
③ Ignore the effect of soil on rototiller blade breakage;
④ Disregard the longitudinal vibrations produced by the rototiller’s rotation;
⑤ The impact load given to the pipe by the rotary tiller is assumed to be the rated thrust given by the drill rig;
⑥ It is assumed that the shear force given to the pipe by the rototiller is transformed into a rotational variable.
(5) Grid division
The only areas that underwent encrypted mesh processing were the pipeline and the rotary tiller; this prevented the rotary tiller blade from colliding with the pipeline at the densest point and ensured the accuracy of the calculation results while also speeding up the calculation process. The sparser portions of the mesh remain unencrypted, as illustrated in Fig. 6. There are 2110 total cells in the pipe mesh cell type, which is a four-node surface thin shell (S4R); An eight-node linearly reduced integral hexahedral cell (C3D8R), having a total of 7750 cells, is the mesh unit type used in the soil model. as a result of its more intricate structure, the rotary tiller is configured as a tetrahedral cell mesh. The drill mesh type is a ten-node modified quadratic tetrahedral cell (C3D10M), with 19,134 cells altogether.
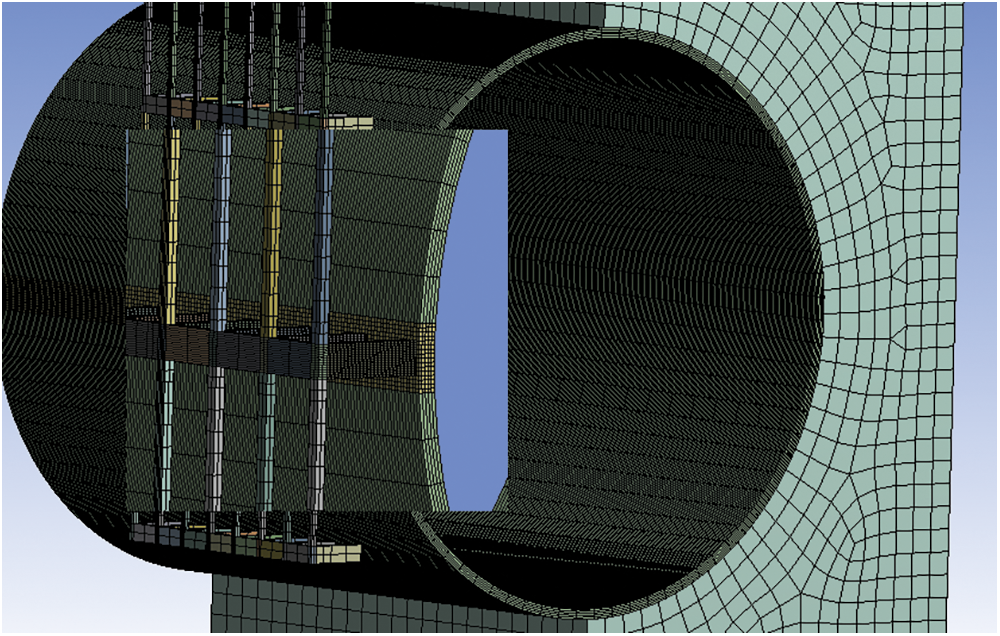
Figure 6: Meshing of finite element models
(6) Boundary conditions and amplitude settings
The X-axis, Y-axis, and Z-axis front and rear faces of the soil-pipe model have U1 = UR2 = UR3 = 0 set in them to simulate the actual working conditions as much as possible. Symmetric constraints are applied in the left, right, front, and rear directions of the soil, with axial constraints set at both ends of the pipeline to restrict axial displacement.
(7) Dynamic response test
Based on the finite element model mentioned above and a simulation that takes into account the real-world working conditions in the field. The rotary tiller has six single-row blades, a burial depth of 0.6 meters, an operating pressure of 6 MPa, a diameter of 1016 millimeters, and a wall thickness of 17.5 millimeters. Its traveling speed is 50 mm/s. According to the research [16,17], when a dynamic load strikes a pipe, the contact period is often concentrated in the range of 10–3–10–2 s. Fig. 7 depicts the rotary tiller striking the pipe from the side. Fig. 8 depicts the simulated Mises stress cloud caused by the rotating tiller load operating on the pipe. Fig. 9 displays the stress variation within the time series obtained by removing the data from the stress maximum zone.
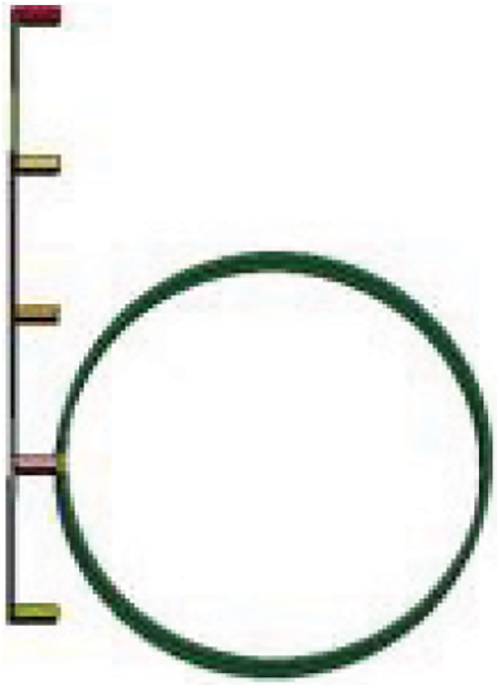
Figure 7: Side view of the model
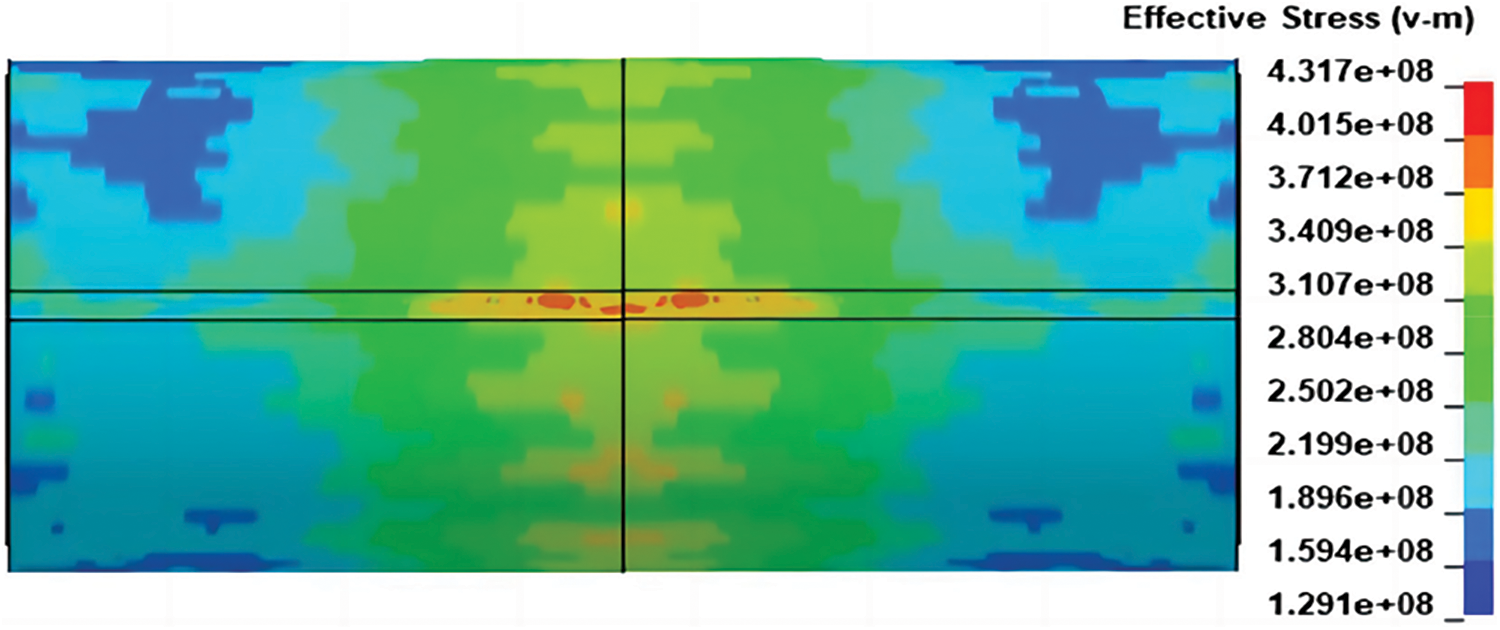
Figure 8: Pipeline Mises stress cloud
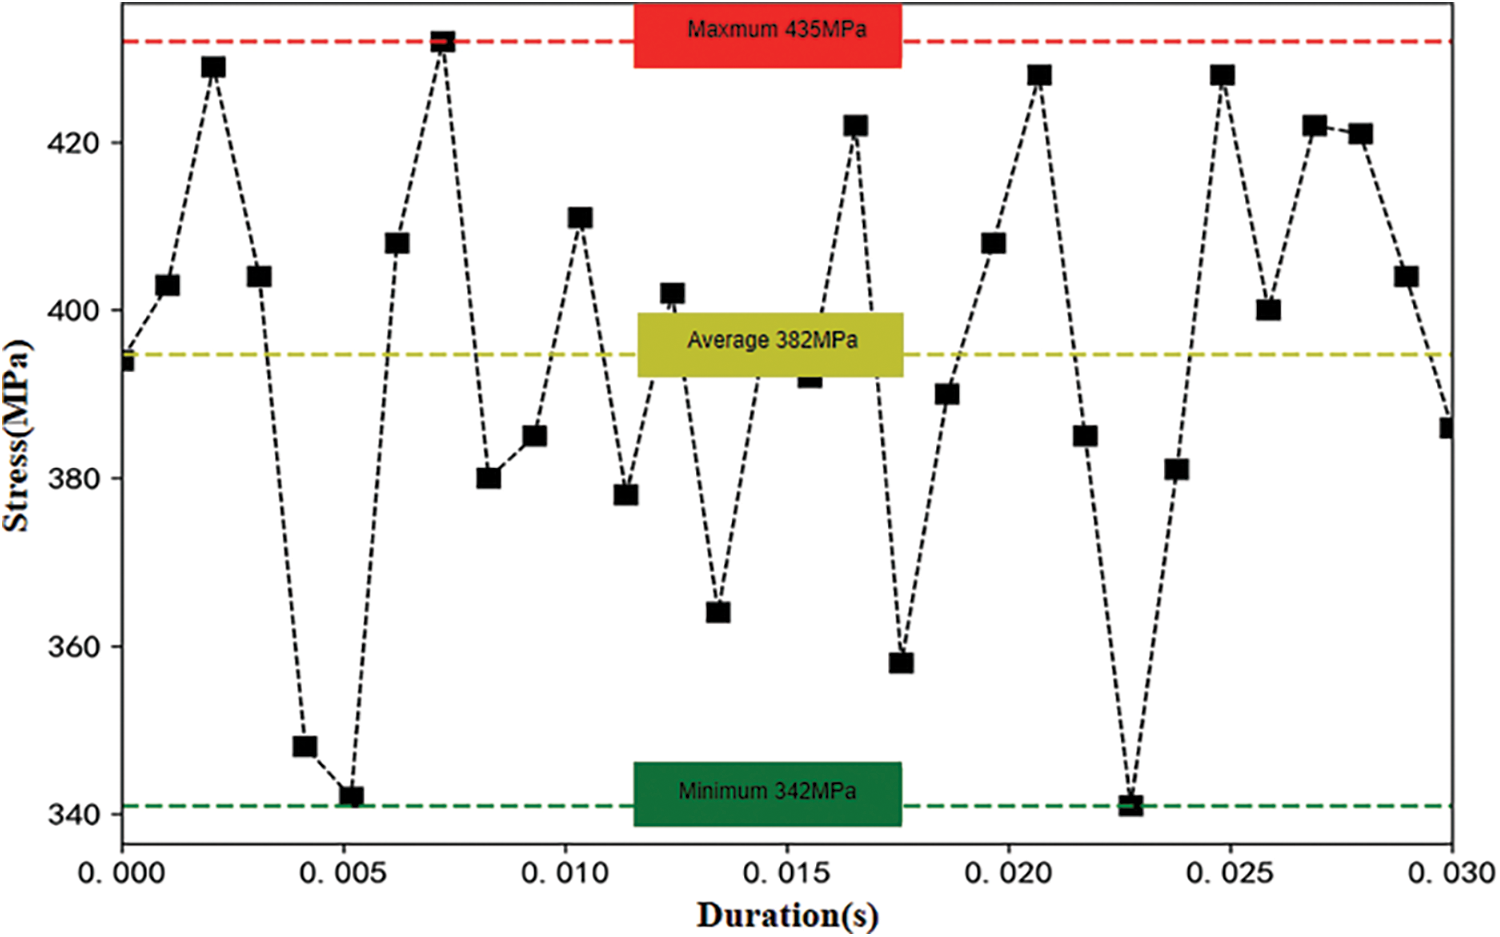
Figure 9: Regional stress variation under time series
According to Fig. 9, the pipe stress fluctuates irregularly within 0.03 s of the rotating tiller blade contacting the pipe, reaching a maximum of 435 MPa, a minimum of 341 MPa, and an average of 382 MPa during that time. As a result, the contact time in the simulation is consistently set to 0.03 s while taking into account the clearance and contact time between the machinery and the pipe.
3.1.2 Validation of Finite Element Model
The accuracy of the model is confirmed by calculating the stress of the pipeline under internal pressure and comparing the calculation results with the simulation values.
The gas pipeline will experience hoop stress, axial stress, and radial stress when there is internal pressure. The radial stress for the pipeline in this study has a very low value, therefore it can be directly disregarded in favor of the other two stresses. The following formula can be used to determine the pipeline’s hoop stress when it is under internal pressure:
where P is the internal pressure, r is the radius of the circle measured from a point on the tube wall, r0 is the pipe’s inner diameter, and R is the pipe’s outer diameter.
Eq. (2) can be used to calculate the axial tension that the pipe will experience:
where μ is the poisson ratio.
The effective stress is:
When the pressure of the pipeline during normal operation is 6 MPa, the calculation using Eq. (3) yields the results shown in Table 4 below.
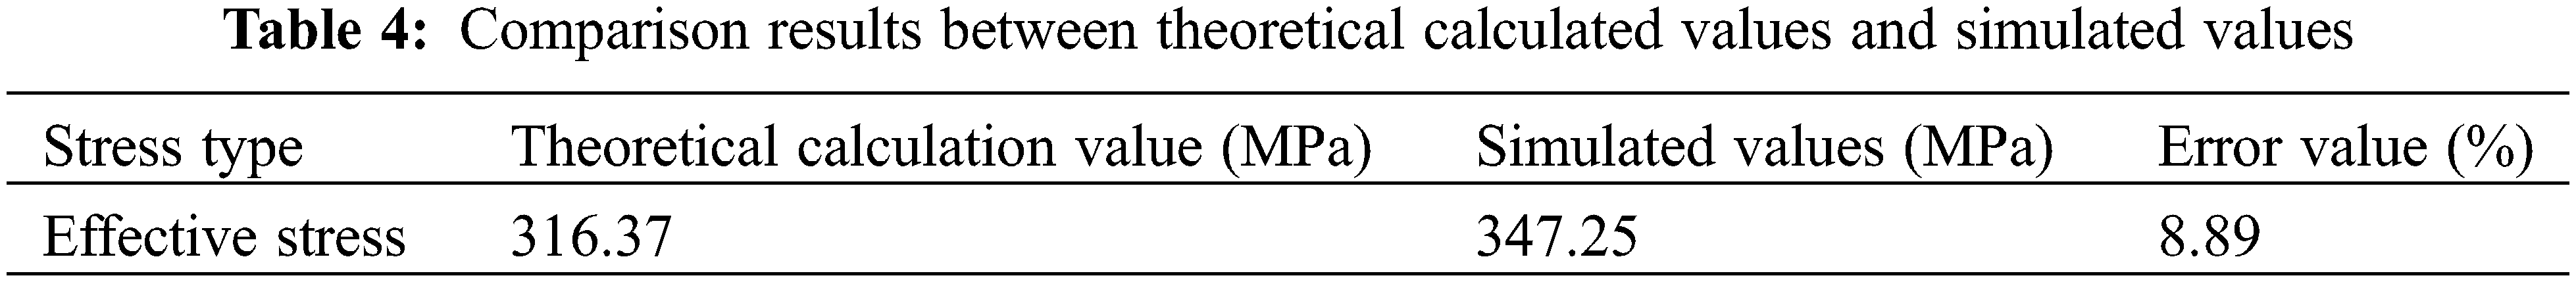
According to the following table, the model is fair because there is a difference of 8.89%, or less than 10%, between the theoretical and simulated values.
The importance of each influencing factor and the requirements for safe pipeline operation can be determined by analyzing the dynamic response of the Shanxi-Beijing natural gas pipeline under the influence of a rotary tiller and incorporating a decision tree model into the study, and numerous measures to reduce the risk of pipeline damage can be derived in a targeted manner.
3.2.1 The Basic Process of Decision Tree
Decision trees are a popular and widespread class of machine learning techniques that can find relationships between models and data in a lot of data and make dynamic predictions about the models with less computational work, the ability to display key decision attributes, and high classification accuracy [18–21].
A decision tree’s fundamental steps are as follows: calculate each feature’s impurity index, choose the feature with the best impurity index for classification, compute the impurity index of every feature under the first feature’s branch, choose the feature with the best impurity index for classification, and so on until all features are available or the impurity index reaches the optimal value, at which point the decision tree stops expanding.
The decision-making method of a decision tree is to evaluate the provided problem using a tree-like structure. Fig. 10 below illustrates the decision-making process.
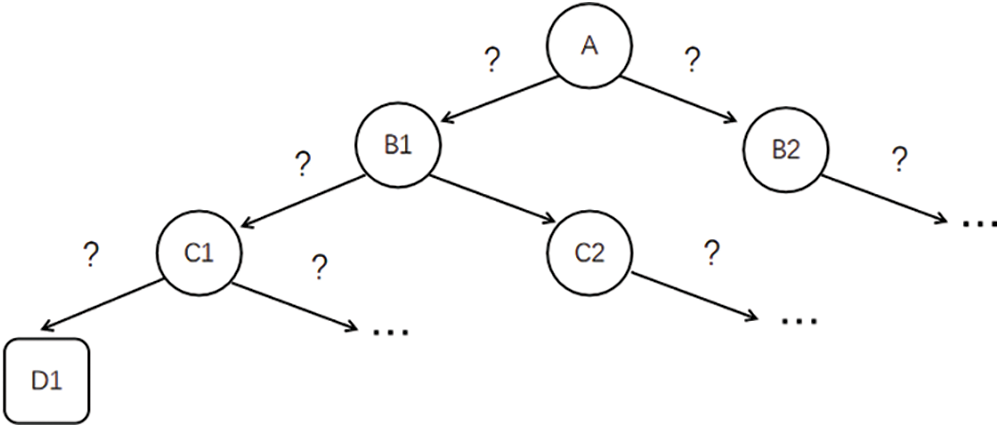
Figure 10: Schematic diagram of the decision tree
The highest node of a decision tree is referred to as the root node, the ultimate decision result is referred to as the leaf node, and all of the intermediate nodes are referred to as the internal nodes. The root node, which is the collection of all decision tree samples, is found at the top of the decision tree. The decision result provided by the leaf node is divided by each attribute test corresponding to the internal nodes through which it goes. The leaf node can be thought of as the ultimate decision result for the final problem.
The decision-making process of decision trees is a recursive process where each problem is tested for a specific attribute and the result derived will either be a conclusion for that attribute or a further determination problem within the range given by the last problem, with a large number of problems leading to a cascading conclusion and ultimately the decision result required by the decision maker [22,23].
When making decisions, each sample can locate a corresponding point on the axes, and there will be classification boundaries between samples with the same attributes and samples with different attributes. However, univariate decision trees’ classification boundaries can only be parallel to the axes, which can be challenging when there are more attributes.
Multivariate decision trees can solve the problems of univariate decision trees by testing linear combinations of attributes, enabling “skewed partitioning” of samples with different attributes. Multivariate decision trees no longer seek to optimally divide attributes but to create a linear classifier within the existing set of samples. In this paper, multivariate decision trees are used for decision tree building.
The dynamic response of a subterranean gas transmission pipeline under the influence of a rotating tiller was further investigated and analyzed using ANSYS/LS-DYNA finite element software based on the previously created finite element model.
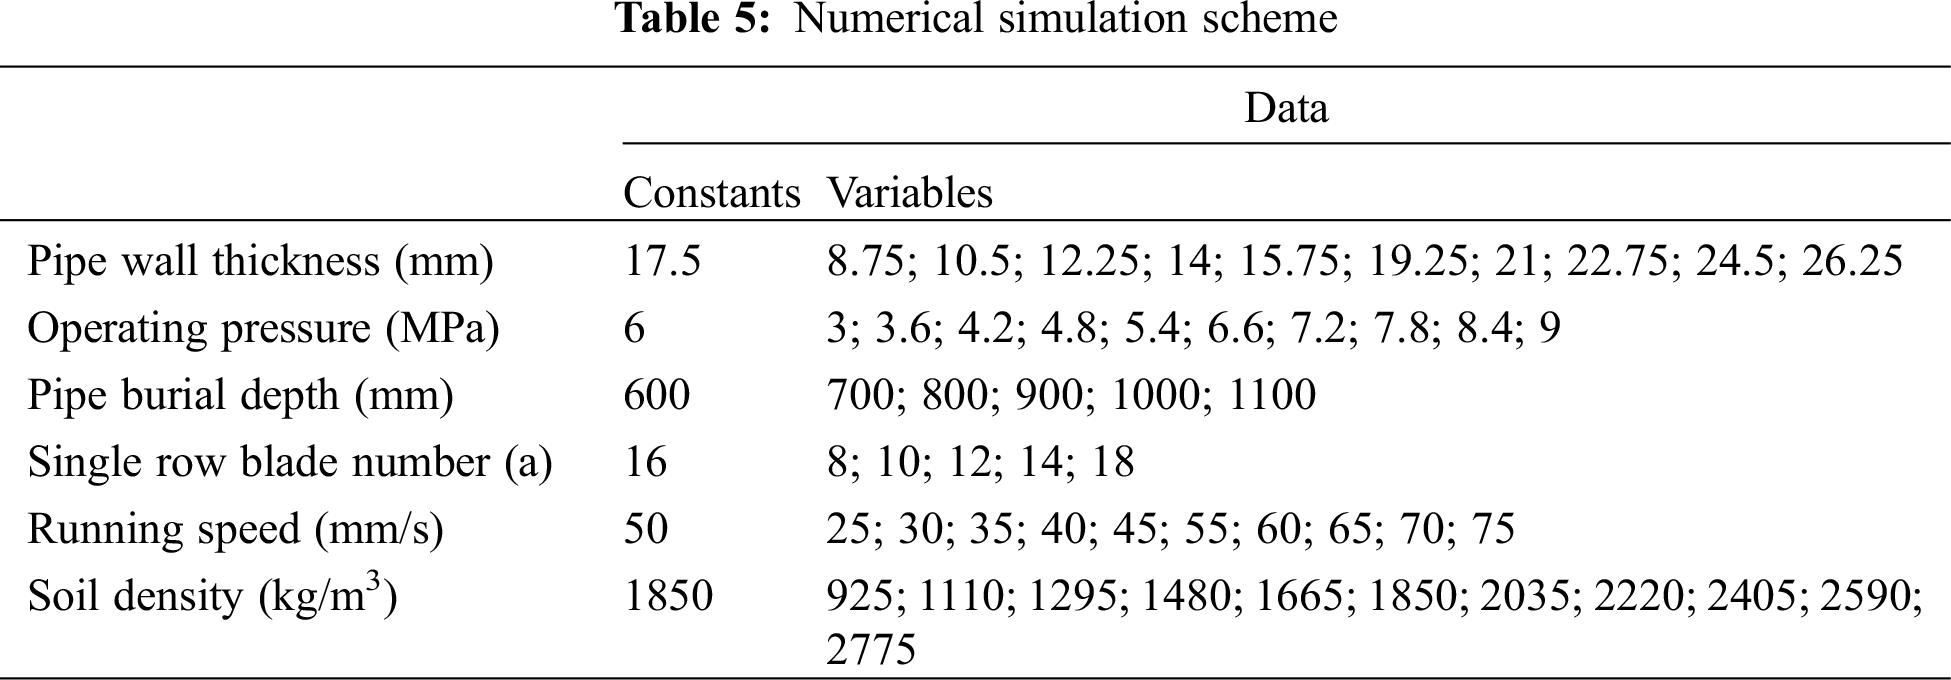
The factors affecting the degree of damage to the natural gas pipeline after the impact of the rotary tiller can be divided into: pipeline body factors and external environmental factors. The external environmental factors include the burial depth of the pipeline, the number of single-row blades of the rotary tiller, the rotary tiller running speed, and the soil density. Based on the above factors, the numerical simulation scheme is shown in Table 5.
4.1 The Effect of Pipeline Burial Depth
The Shanxi-Beijing natural gas pipeline has varying burial depths, and for each state of burial depth, there is little variation in the area where the rotating tiller strikes the underground pipeline. The same row of blades is not in contact with the pipeline due to variations in burying depth. Fig. 11 below illustrates how the various positions of the underground pipe relate to the rotary tiller blades. According to the plan in Table 5, simulations were run, and the results are shown in Table 6.
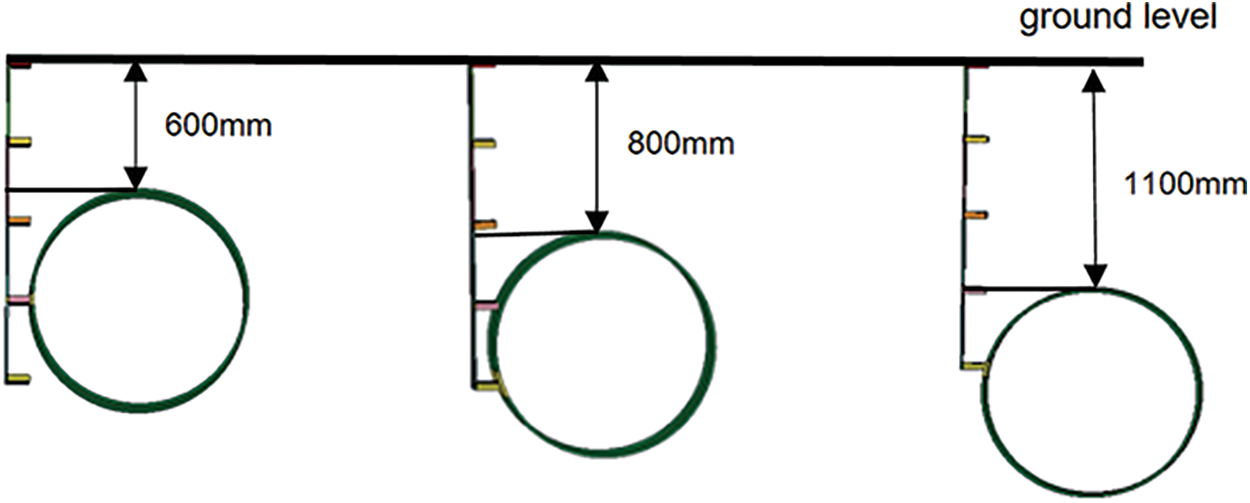
Figure 11: Relative position relationship between machine and pipe at different burial depths
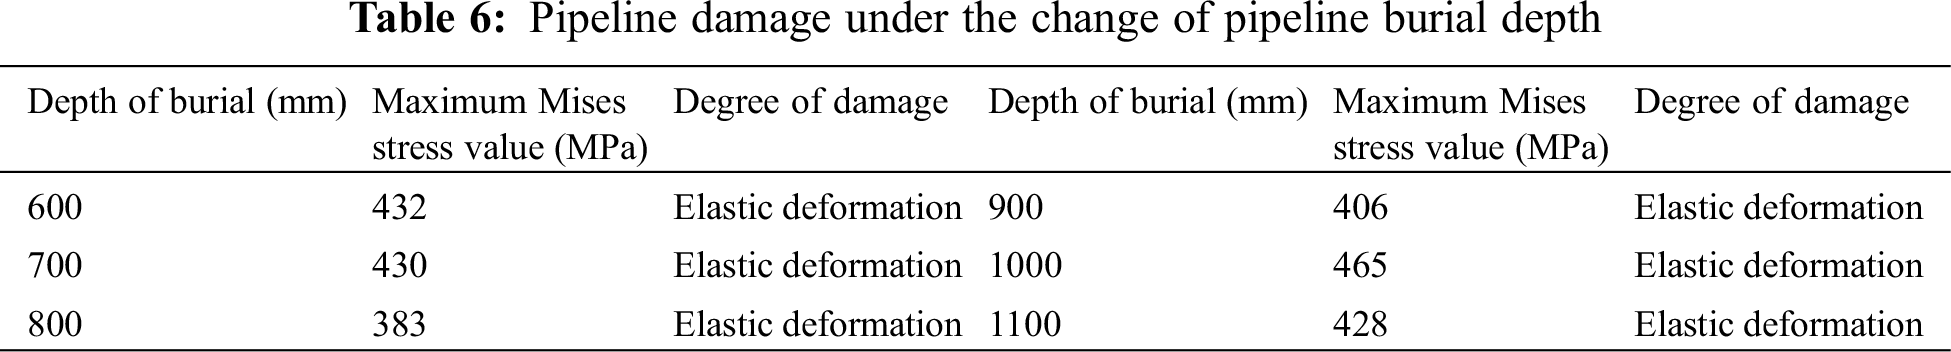
The trend of the maximum stress value on the pipeline under the change of pipeline burial depth is plotted, as shown in Fig. 12. It shows that as the depth of burial increases, the maximum Mises stress value of the buried pipe subjected to the impact of the rotary tiller changes. The area where the rototiller blade made contact with the pipe varied significantly depending on where the pipe was buried. According to the simulation findings, the fourth row of blades makes contact with the pipe at a burial depth of 600 mm, and the fifth row makes contact with the pipe at 800 mm, however the contact is insufficient, causing the stress value to drop significantly; when the blade is in complete contact with the pipe’s center at 1000 mm, the maximum Mises stress value is at its highest; The pipe and blade make contact on the upper side at 1100 mm, at which point the stress starts to reduce. The fuller the contact and ultimately the higher the stress is, the closer the blade is to the center of the pipe. As a result, it is critical to consider the pipeline’s burial depth in the operation area to minimize the likelihood of a rotating tiller hitting the pipeline’s center and to maximize the protection of the buried pipeline.
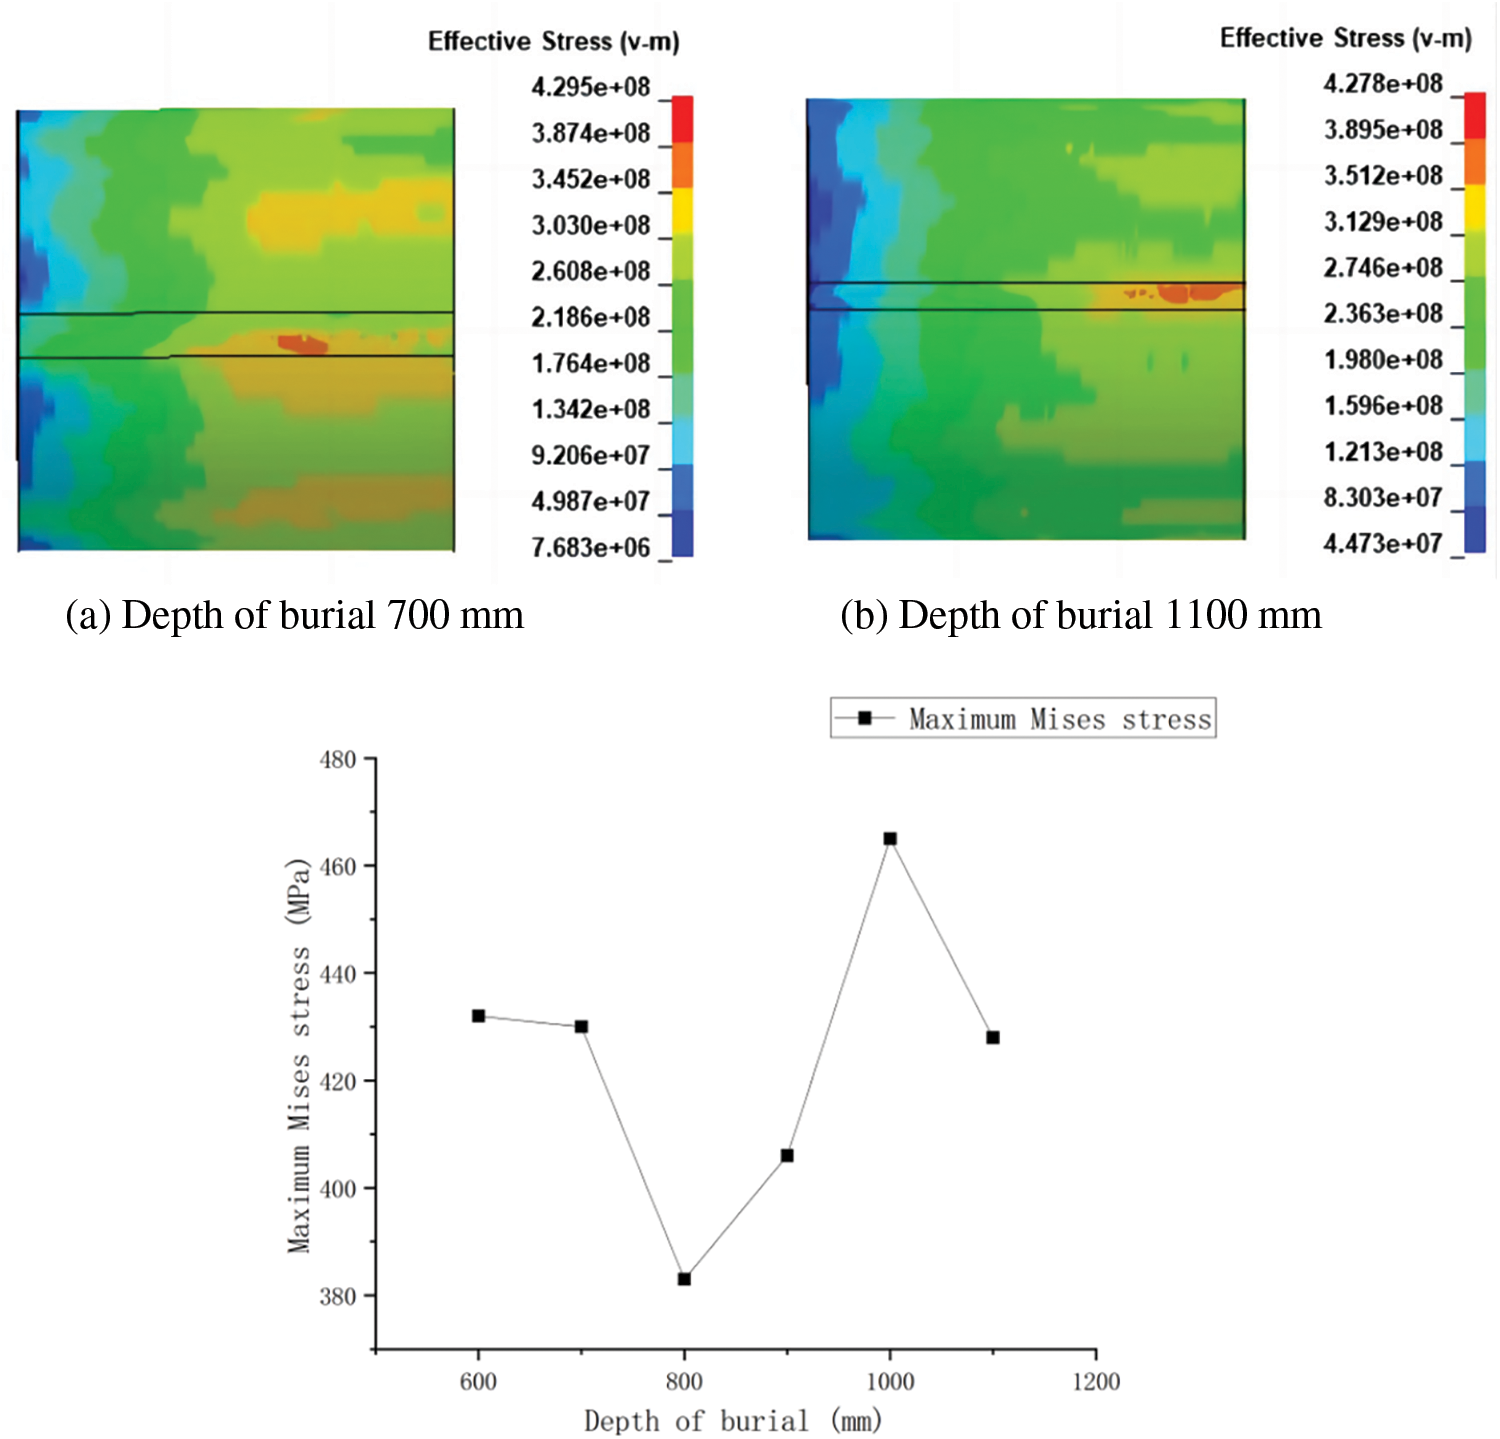
Figure 12: Variation of the maximum Mises stress value after the change of pipe burial depth
4.2 The Effect of Number of Blades in a Single Row of a Rotary Tiller on the Pipeline
Since there are many rotating tiller blades and very little space between them, the number of blades per row might have some bearing on the dynamic reaction brought on by the buried pipe. The data in Table 7 were obtained after simulations were carried out by the plan in Table 5, and Fig. 13 illustrates the trend of the maximum stress applied to the pipe as a function of the number of blades.
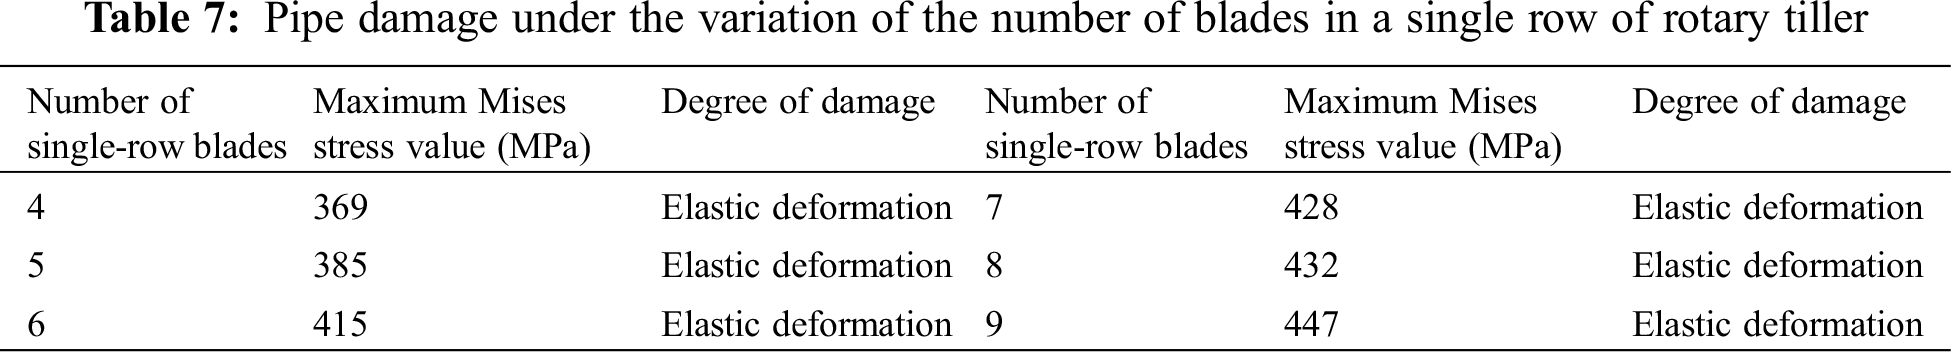
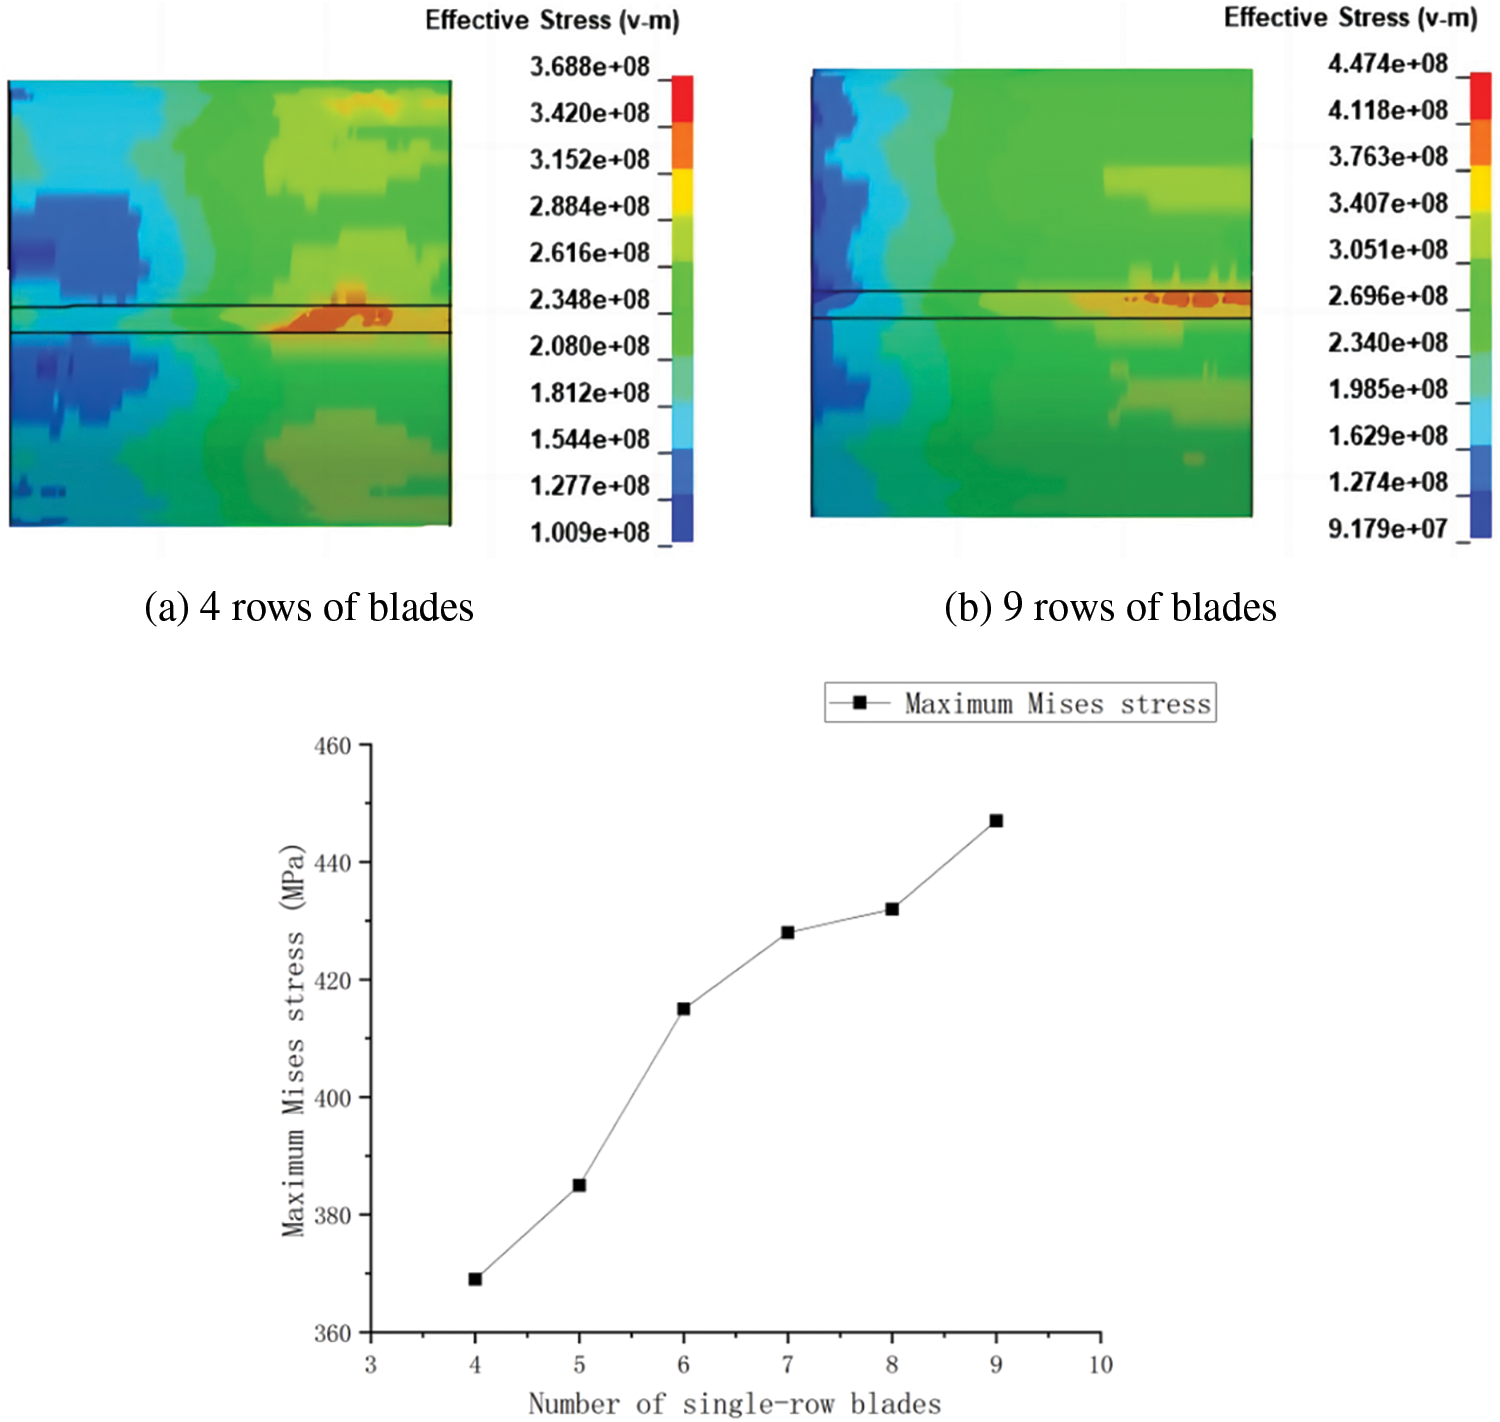
Figure 13: Variation of the maximum Mises stress value on the pipe after changing the number of blades
Fig. 13 illustrates how the influence of mechanical loads on the buried pipe rises with the number of rototiller blades. When operating under the same conditions, rototillers with more blades will exert more force on underground pipes, but those with fewer blades will be less effective at disturbing the soil. While buried pipelines are in the elastic strain stage, they will still come into contact with other farming equipment and rotary tillers frequently, increasing the likelihood of corrosion and fatigue, among other factors, leading to pipeline failure. Thus, to reduce the impact of rotary tiller operations on buried pipelines, it is crucial to carefully select the type of rotary tiller and to urge farmers to acquire rotary tillers with less than eight blades.
4.3 The Effect of Running Speed
The rotary tiller’s operating speed will fluctuate, and different speeds will result in different amounts of impact force on the pipe. Table 8 depicts the trend of the maximum stress value on the pipe under the influence of various speeds as a result of simulation using the plan in Table 5; this trend is depicted in Fig. 14.
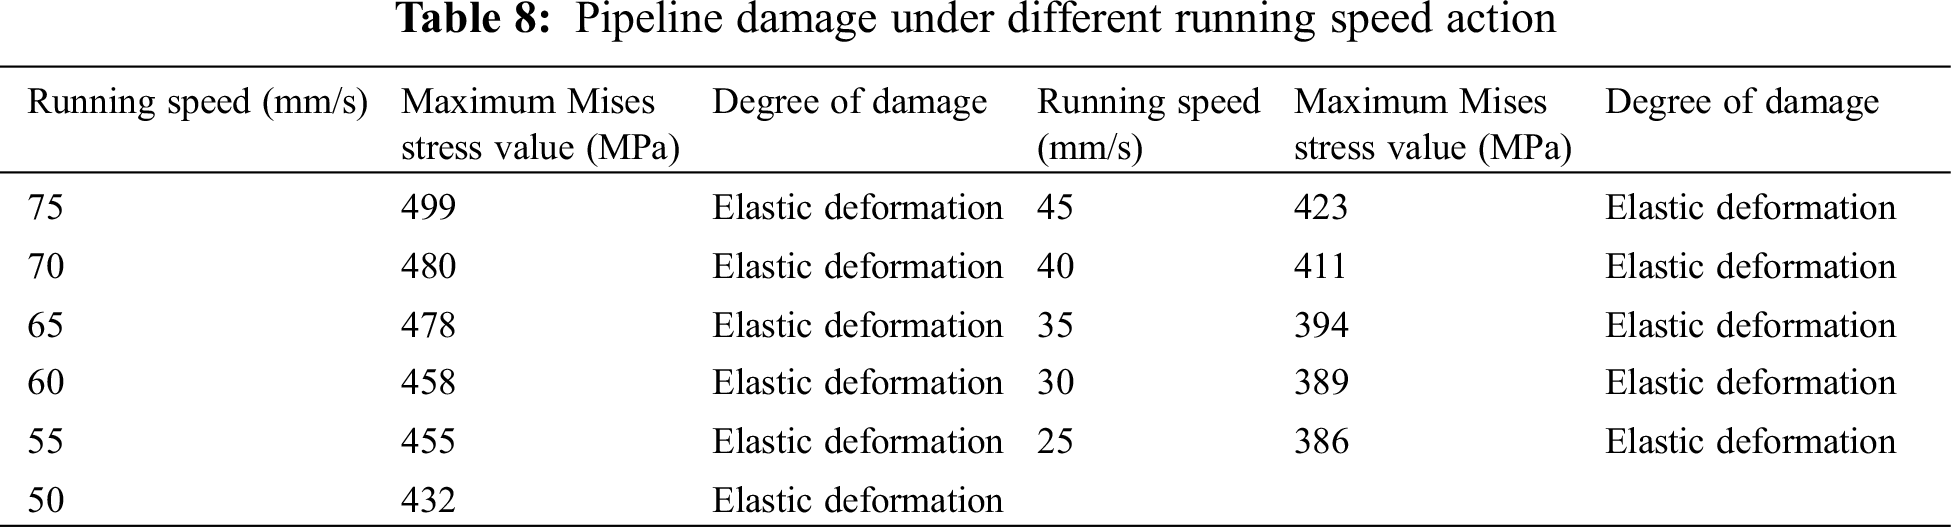
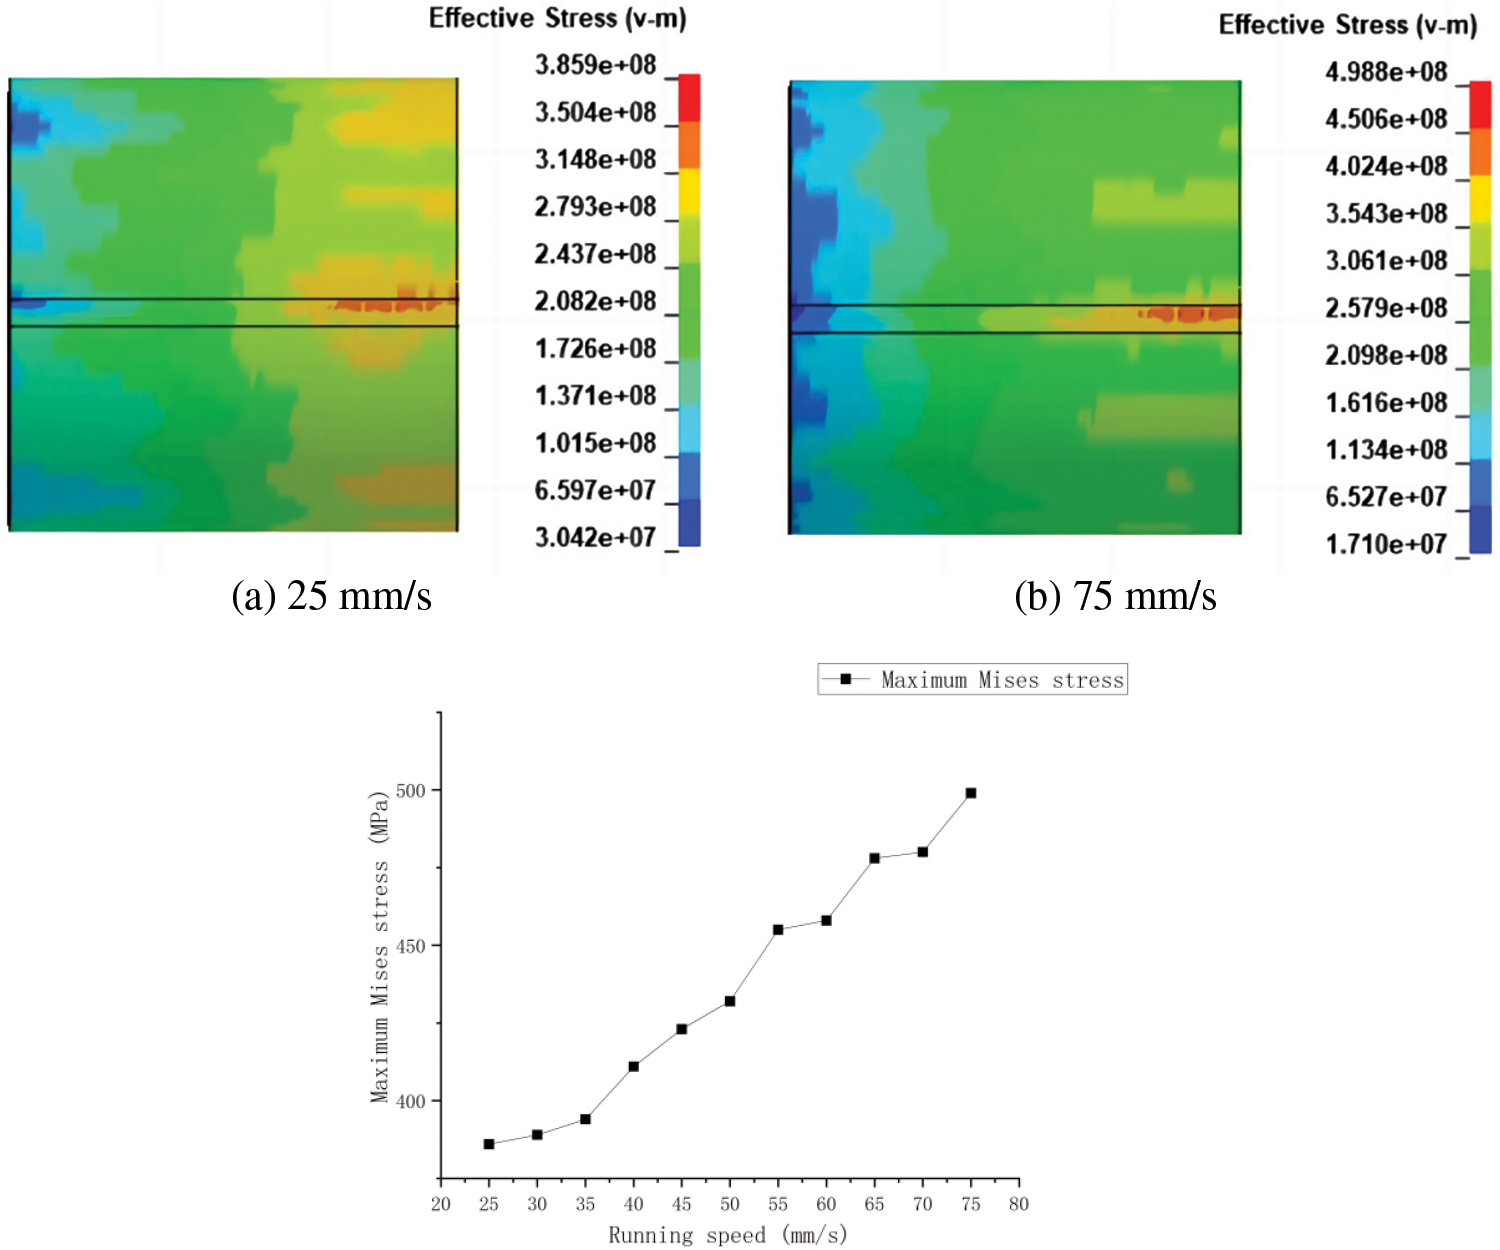
Figure 14: Trend of the maximum Mises stress on the pipe at different running speed
4.4 The Effect of Soil Density
The magnitude of the support force that the soil provides to the pipe when it is subjected to external forces varies depending on the soil density. The maximum stress value applied to the pipe at various velocities was trended, as shown in Fig. 15, after simulations were run in accordance with the plan in Table 5 and the data in Table 9 were collected.
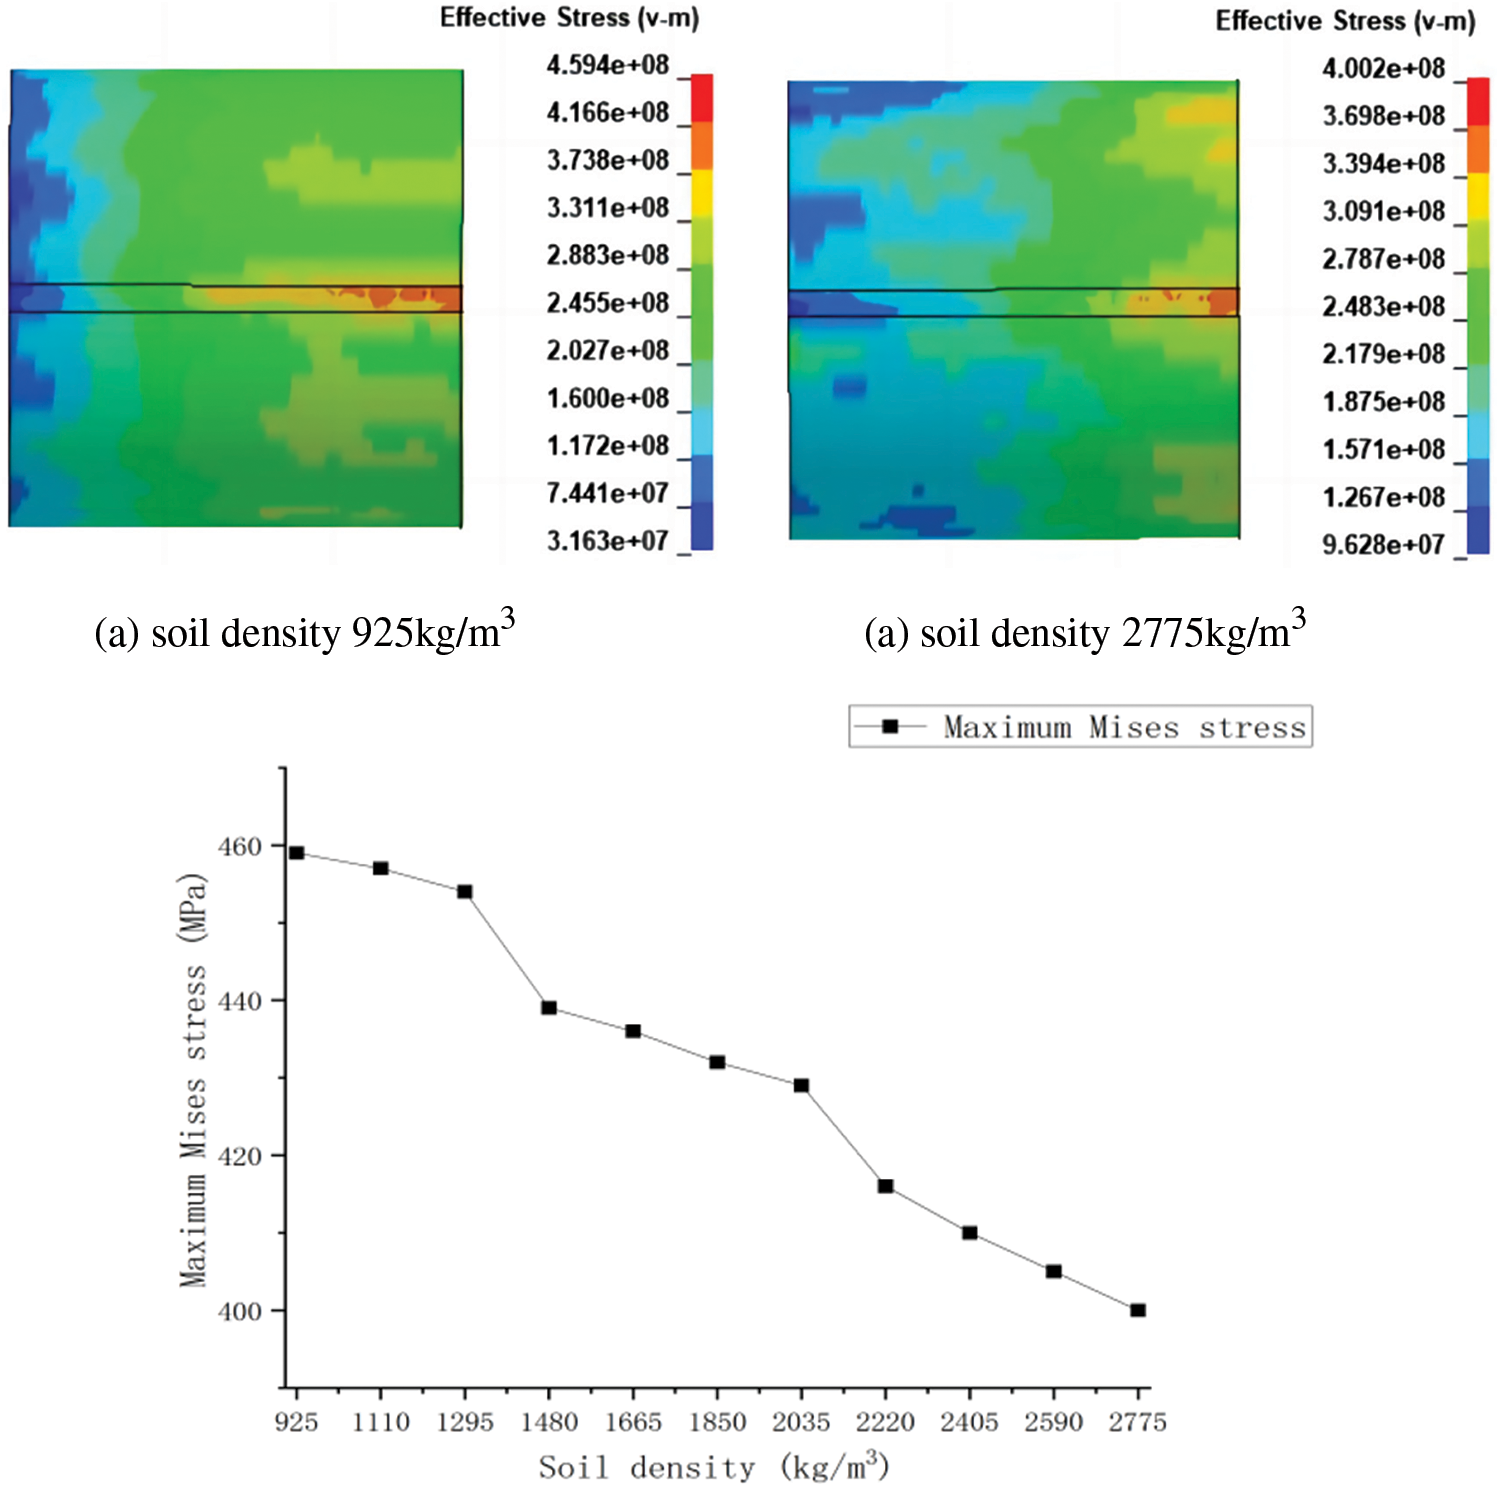
Figure 15: Trend of the maximum Mises stress on the pipe under the change of soil density
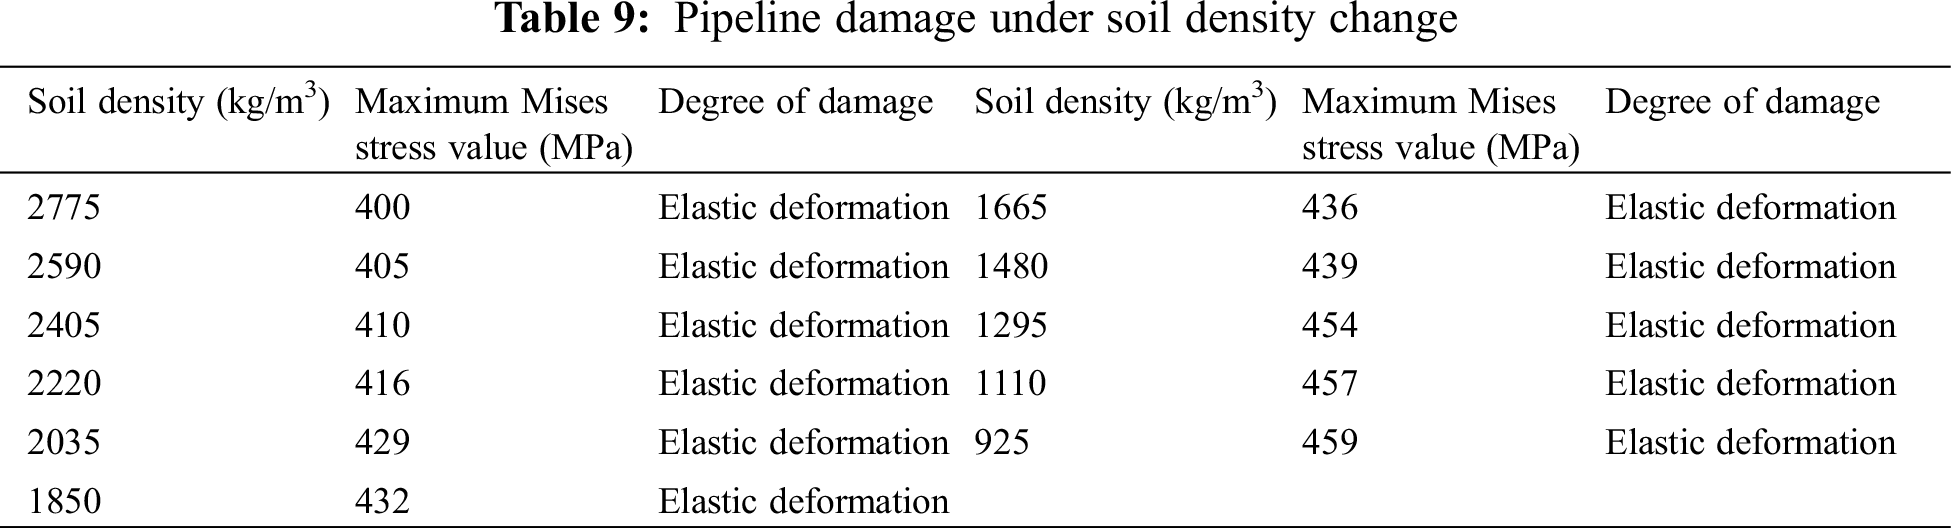
Fig. 15 illustrates this phenomenon: for a given change in soil density, the damage resulting from the mechanical load on the pipe diminishes with increasing soil density, but the maximum stress value falls with increasing soil density. In the field of engineering, it is vital to guarantee that the backfilled soil’s compactness surpasses 1081.44 kg/m3 following the operation. As a result, the pipeline’s soil near the rotary tiller operation region can be collected and analyzed annually before the agricultural season, and the soil in the locations where the values fall outside of the designated range can be improved.
4.5 The Effect of Wall Thickness
The values in Table 10 were obtained by simulations carried out by Table 5 for various wall thicknesses, and Fig. 16 illustrates the trend of the maximum stress value applied to the pipe at various velocities.
Figure 16: Trend of the maximum Mises stress on the pipe with varying pipe wall thickness
From Fig. 16, it is evident that the damage resulting from mechanical loads on the pipe decreases with increasing pipe wall thickness. Pipeline construction units should choose a suitable pipeline wall thickness, maintain a constant eye out for pipeline corrosion, and strike a balance between the economy and the pipeline’s risk level. Although the rotary tiller causes more elastic deformation of the pipe when it acts on the pipe, the rotary tiller blades can also cut the corrosion protection layer of the pipe, causing the corrosion protection layer to fall off. The wall thickness of the corroded pipe will be thinned, and the maximum stress value caused by the rotary tiller acting again on the pipe containing the corrosion defects will be significantly higher, resulting in a greater potential danger.
4.6 The Effect of Internal Pressure in the Pipe
The data in Table 11, which displays the trend of the maximum stress values applied to the pipe at various velocities, is the result of simulation based on the various internal pressures in Table 5, as illustrated in Fig. 17.
Figure 17: Trend of the maximum Mises stress on the pipe under the change of the internal pressure of the pipe
Fig. 17 shows the magnitude of the pipeline’s internal pressure and its maximum Mises stress value are positively connected. Given the same operating parameters and internal pressure variation, the stress impact increases as internal pressure increases in a pipeline. The pipe will exhibit plastic deformation when the operating pressure reaches 8.4 MPa or higher and the maximum Mises stress value exceeds the yield strength. In daily operation, pay attention to the pipeline operation when the delivery pressure is less than 7.92 MPa, to meet the operating pressure at the same time as far as possible in the lower pressure interval for the operation.
5 Decision Tree Prediction Model for Pipeline Failure Based on Dynamic Response
Using the aforementioned finite element analysis, various significant factors affecting the degree of damage to natural gas pipelines following rototiller strikes are examined. To precisely ascertain the prerequisites for the secure functioning of pipelines, this section presents four widely utilized machine learning models: k-neighborhood, support vector product, simple Bayes, and decision trees. Following a comparative analysis, a decision tree is selected to build a machine-learning prediction model for the pipeline’s response to the action of the rotary tiller. This model will be used to classify the factors affecting the pipeline’s dynamic response, ascertain the significance of each influencing factor, and identify the circumstances that will lead to elastic deformation, plastic deformation, pipeline failure, and damage.
Since a large amount of scattered data is needed to support the establishment of the machine learning model, the following five independent variables—the number of rotary tiller teeth, the rotary tiller operation rate, the internal pressure of pipeline operation, the thickness of the pipeline wall, and the soil density—are randomly permuted and combined to carry out the simulation, increasing the number of samples, and the data of the corresponding variables are selected as indicated in Table 12 below. The degree of damage caused by the maximum Mises stress value acting on the pipe by the rotary tiller was taken as the dependent variable and included in the decision tree analysis. The machine learning model inputs and outputs are shown in Table 13.
Regression and classification are the two primary prediction problems in machine learning. Regression involves predicting the output of a continuous value, while classification involves classifying known data into distinct groups. The distinction between the two lies in the type of output variable. In regression problems, the output variables are continuous. Whereas in classification problems, the output variables are discrete. The classification model is selected based on the data simulated by the finite element model and the task needs of the scenario.
This chapter introduces four commonly used classification models in machine learning, k-neighborhood, support vector product, plain Bayes, and decision tree, which are modeled and analyzed in the scikit-learn module of Python software, with 70% of the data used as the training set and 30% of the data used as the test set, and the results of each model’s evaluation are shown in Table 14 below.
Table 14 displays the evaluation results for each model, where quantitative measures are utilized to determine the classification effectiveness of each model on the training and test sets. By comparison, it can be concluded that decision tree is the best for classification in this scenario and simple Bayes is the worst. So the decision tree has better accuracy in this scenario, and secondly, because the decision tree is easy to interpret, uses a white-box model, and can be visualized, it is chosen to construct the prediction model under the action of the rotary tiller on the pipeline.
5.3 Decision Tree Prediction Modeling under the Action of Rotary Tiller on Pipeline
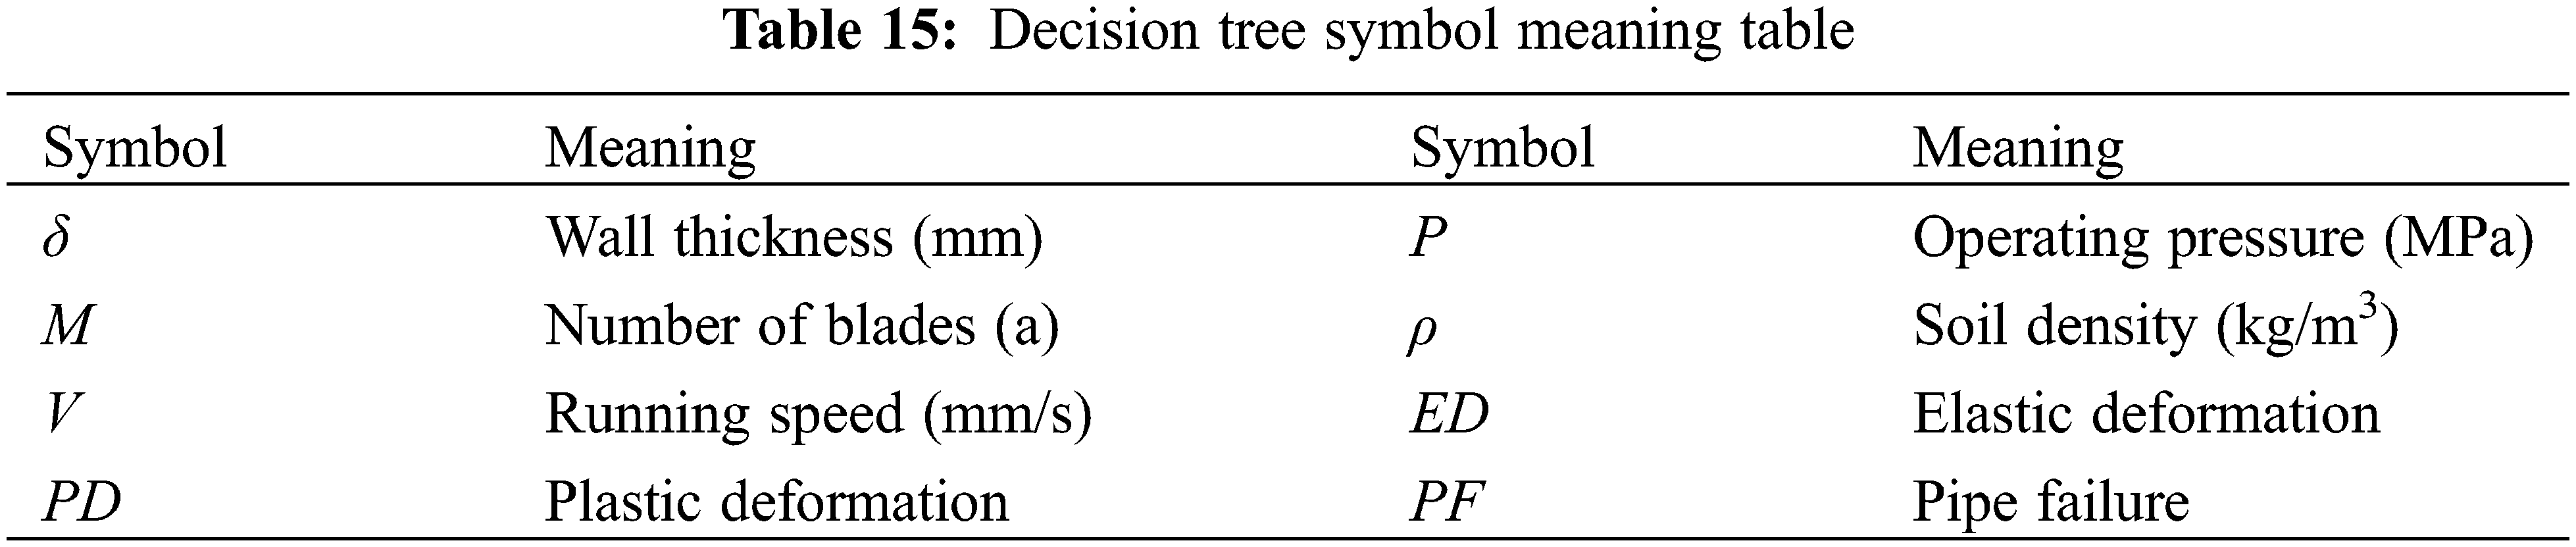
This work constructs the decision tree code in Python’s scikit-learn module, redefining each data index, and utilises the train_test_split function to randomly divide the data set into the training set and the test set in a 7:3 ratio. DecisionTreeClassifier is used to create instantiated models. Training sets are imported into the instantiated model via the fit interface to train the model, and test sets are imported via the score interface to output model accuracy and model validation results. The grid search is utilized to find the best pruning parameters, and the final model classification accuracy is 90%, yielding the decision tree illustrated in Fig. 18. The meaning of the decision tree symbols is shown in Table 15 below.
Figure 18: Decision tree for damage to pipes under the action of rotary tiller
The optimized parameters result in: criterion=‘gini’, spliter=‘best’, max_depth=8, min_samples_leaf=1, min_samples_split=6, random_state=25.
The size of this decision tree is 67, with 32 leaves and an 8-layer structure. The final model has a classification accuracy of 90% and was built with 30 leaf nodes. Each node in the decision tree decides by branching to the left to indicate that the conditions for the decision problem are fulfilled and branching to the right to indicate that the conditions for the decision problem are not met. The variable of the first branch appearing in the decision tree is the pipe wall thickness, whether the pipe wall thickness is less than or equal to 10.52 mm is the root node of this decision tree, the next number of rotary tiller tines, the speed, the pipe running pressure and the soil density are the internal nodes for conducting the test, and the final result is the leaf node. The importance of each feature is obtained through the feature_importances_ attribute in the scikit-learn module as shown in Fig. 19.
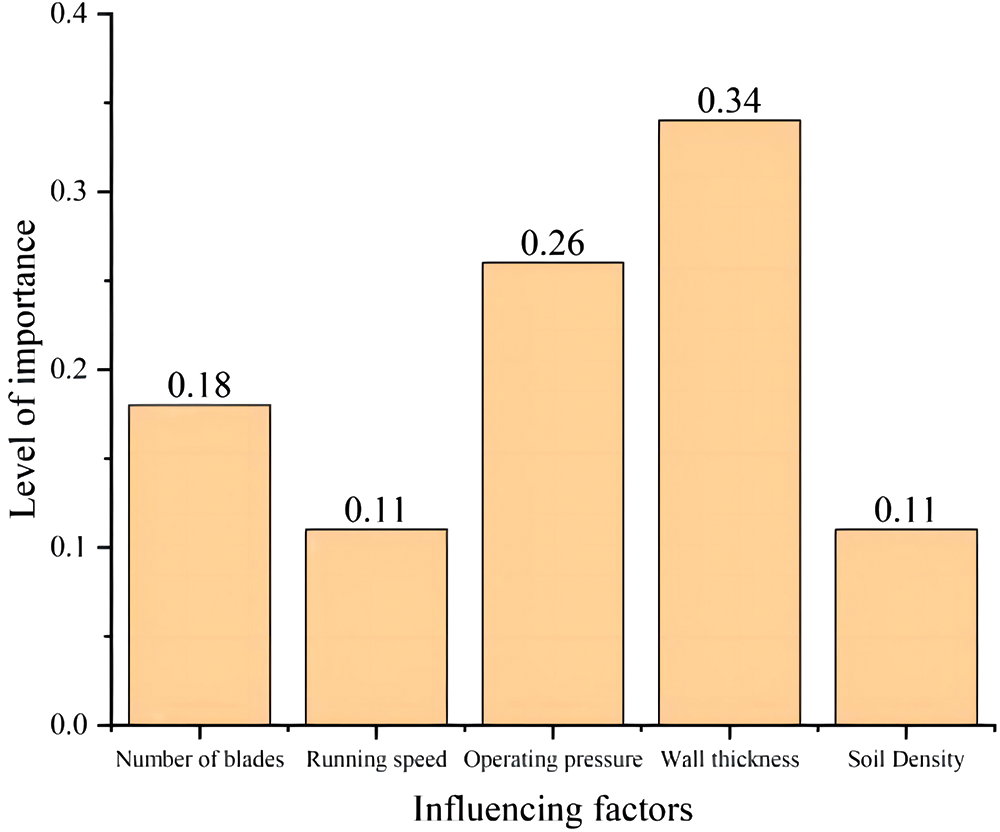
Figure 19: Importance of each influencing factor
From the above figure, it can be obtained that the size of the various influencing factors are ranked as follows: pipe wall thickness > operating internal pressure > number of blades per row of rotary tiller > operating speed > soil density.
5.4 Decision Tree Based Pipeline Damage Level Prediction
Based on the results of the decision tree simulation, scenarios are predicted in which the pipe deforms elastically, deforms plastically, or the pipe fails, as shown in Table 16.
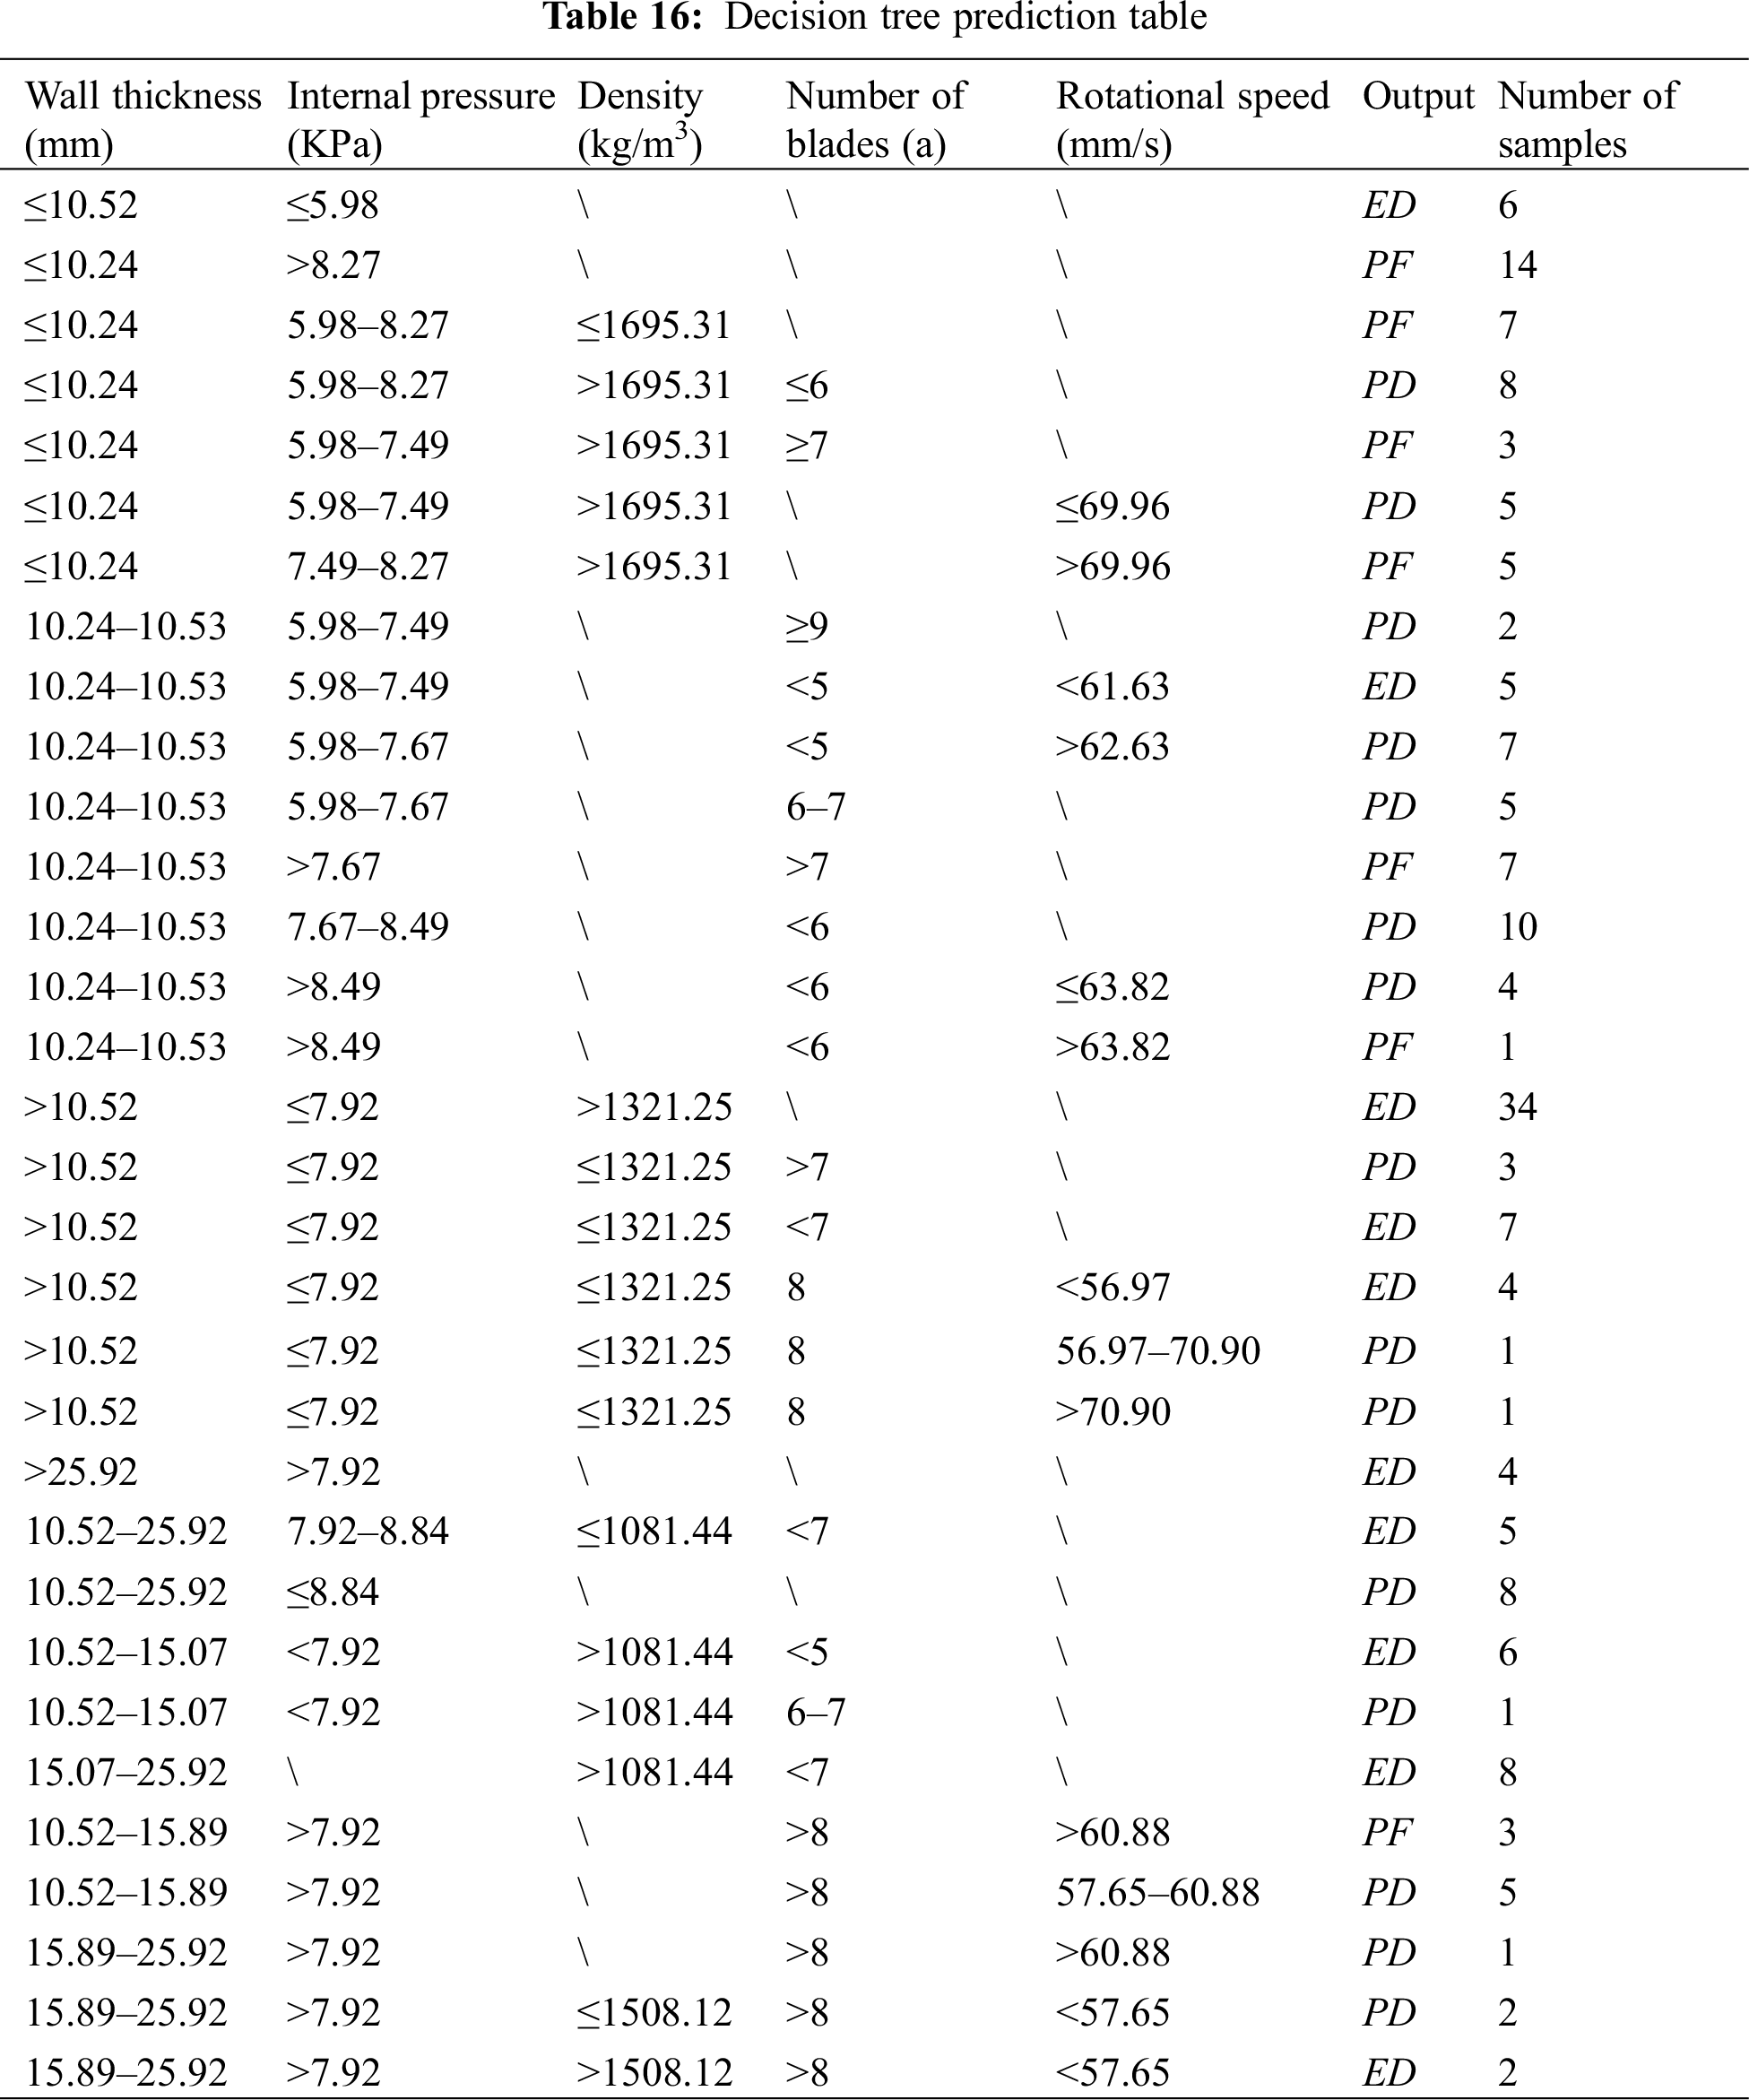
The following conclusions can be drawn from an analysis of the above table and Fig. 19:
(1) The pipe’s wall thickness has the biggest influence on the severity of the damage. A wall thickness of 10.54 mm or more can guarantee pipeline operation safety.
(2) To maintain the highest level of safety for the operation of the pipeline, it is best to keep the pipeline operating pressure below 7.92 MPa. This has the second-largest influence on the extent of damage to the pipeline.
(3) The number of blades has a moderate impact on the degree of damage to the pipe. The number of blades less than 8 rotary tiller can minimize the impact on the pipe during operation.
(4) The amount of pipe damage is less affected by the speed of the rotary tiller. It is safest to use the rotary tiller to adjust the machine’s speed as much as possible when the pipe is moving at 61.63 mm per second or less.
(5) Working conditions are safer when the soil density is greater than 1081.44 kg/m3, which has the least impact on the severity of pipe damage.
In this study, the damage law of a natural gas pipeline under rotary tiller operation is investigated using the finite element method. The maximum Mises stress change law of the pipeline is analyzed under six influencing circumstances. A decision tree model is then developed based on the collected data to predict whether the pipeline will undergo elastic deformation, plastic deformation, or pipeline failure and to offer practical and accurate risk management strategies for the pipeline:
(1) The pipe wall thickness and soil density are negatively correlated with the pipe stress after the rotary tiller strikes the pipe; the pipe running pressure, the number of rotary tiller blades, and the rotary tiller running speed are positively correlated with the pipe stress; the pipe burial depth is cyclically correlated with the pipe stress;
(2) The size of the various influencing factors in the following order: pipe wall thickness > operating internal pressure > number of blades per row of rotary tiller > operating speed > soil density;
(3) The pipe can be used safely if the wall thickness is at least 10.52 mm, the operating internal pressure is below 7.92 MPa, there are fewer than 8 rotating tiller blades, the operating speed of the rotary tiller is below 61.63 mm/s, and the soil density is at least 1081.44 kg/m3.
(4) The safe operation of the Shanxi-Beijing natural gas pipeline requires the joint efforts of the local government, enterprises, and residents. A set of complete and feasible pipeline management measures can maintain the safe operation of the Shanxi-Beijing natural gas pipeline and rotary plow operation smoothly, but also ensure the maximum extent of Shanxi-Beijing natural gas pipeline rotary plow operation area of the personal safety of the residents and property safety.
(5) Focusing on the impact of jatropha planting operations on the Shanxi-Beijing natural gas pipeline, the dynamic response of rotary ploughing machines on the pipeline was studied in depth. The decision tree model was introduced to systematically analyze the impact of various influencing factors on pipeline damage and quantify their importance in the safe operation of the pipeline. However, this study has some potential limitations: The study simplified the actual working conditions, such as uniform soil conditions and the constant properties of pipeline materials. In reality, soil composition may vary, and the pipeline may encounter different dynamic responses. Secondly, the modelling in this paper only selected one type of crawler rotary ploughing machine. In the local area of the jatropha planting operation zone, there are various types of rotary ploughing machines available. Therefore, future research should explore more types of farming machinery, expanding the scope of the study to make the content more comprehensive.
Acknowledgement: Many thanks to the National Pipe Network Group Beijing Pipeline Company Limited for providing the necessary resources for this study.
Funding Statement: The authors received no specific funding for this study.
Author Contributions: The authors confirm contribution to the paper as follows: study conception and design: Liqiong Chen, Kai Zhang, Weihe Huang; data collection: Duo Xu, Hongxuan Hu, Haonan Liu; analysis and interpretation of results: Kai Zhang, Song Yang, Duo Xu; draft manuscript preparation: Kai Zhang, Song Yang.
Availability of Data and Materials: The data used and/or analyzed during the current study are available from the corresponding author upon reasonable request.
Conflicts of Interest: The authors declare that they have no conflicts of interest to report regarding the present study.
References
1. European Gas Pipeline Incident Data Group (EGIG). 11th report of the European Gas Pipeline Incident Data Group (Period 1970–2019) Comprising(R); 2020. Report No. VA 20.0432. [Google Scholar]
2. Brooker DC. Experimental puncture loads for external interference of pipelines by excavator equipment. Int J Press Vessel Piping. 2005;82(11):825–32. doi:10.1016/j.ijpvp.2005.07.005. [Google Scholar] [CrossRef]
3. Brooker DC. Numerical modelling of pipeline puncture under excavator loading. Part I. Development and validation of a finite element material failure model for puncture simulation. Int J Press Vessel Piping. 2003;80(10):715–25. doi:10.1016/j.ijpvp.2003.08.003. [Google Scholar] [CrossRef]
4. Brooker DC. Numerical modelling of pipeline puncture under excavator loading. Part II: parametric study. Int J Press Vessel Piping. 2003;80(10):727–35. doi:10.1016/j.ijpvp.2003.08.002. [Google Scholar] [CrossRef]
5. Yao A, Xu T, Zeng X, Jiang H. Numerical analyses of the stress and limiting load for buried gas pipelines under excavation machine impact. J Pipeline Syst Eng Pract. 2015;6(3):A4014003. doi:10.1061/(ASCE)PS.1949-1204.0000137. [Google Scholar] [CrossRef]
6. Liu X, Zhang H, Xia M, Wu K, Chen Y, Zheng Q, et al. Mechanical response of buried polyethylene pipelines under excavation load during pavement construction. Eng Fail Anal. 2018;90:355–70. doi:10.1016/j.engfailanal.2018.03.027. [Google Scholar] [CrossRef]
7. Jiao YH. Innovative design and decision analysis of track rotary cultivator based on ANSYS (Ph.D. Thesis). University of Chang’an: China; 2021. [Google Scholar]
8. Wang Y. Optimization design of rotary cultivator based on 3D virtual simulation. J Agricult Mech Res. 2023;45(6):252–55+259 (In Chinese). [Google Scholar]
9. Cui Y, Quddus N, Mashuga CV. Bayesian network and game theory risk assessment model for third-party damage to oil and gas pipelines. Process Saf Environ Protect: Trans Inst Chem Eng Part B. 2020;134:178–88. doi:10.1016/j.psep.2019.11.038. [Google Scholar] [CrossRef]
10. Xiang W, Zhou W. Bayesian network model for predicting probability of third-party damage to underground pipelines and learning model parameters from incomplete datasets. Reliab Eng Syst Saf. 2021;205:107262. doi:10.1016/j.ress.2020.107262. [Google Scholar] [CrossRef]
11. Soomro AA, Mokhtar AA, Kurnia JC, Lashari N, Lu H, Sambo C. Integrity assessment of corroded oil and gas pipelines using machine learning: a systematic review. Eng Fail Anal. 2022;131:105810. doi:10.1016/j.engfailanal.2021.105810. [Google Scholar] [CrossRef]
12. Yu W, Zhang J, Wen K, Huang W, Min Y, Li Y, et al. A novel methodology to update the reliability of the corroding natural gas pipeline by introducing the effects of failure data and corrective maintenance. Int J Press Vessel Piping. 2019;169(0):48–56. [Google Scholar]
13. Xu H, Zheng H, Song C, Lei Z, Yan W, Hong B, et al. Fully automated controller for the real-flow calibration of natural gas flowmeters based. In: Proceedings of the 19th International Flow Measurement Conference 2022; 2023; Chongqing, China. [Google Scholar]
14. Luo X, Lu S, Shi J, Li X, Zheng J. Numerical simulation of strength failure of buried polyethylene pipe under foundation settlement. Eng Fail Anal. 2015;48(3):144–52. [Google Scholar]
15. Ma T, Yang Y, Xu Z, Li A. Tang Y constitutive relation and failure criterion of X60 pipeline steel. J Chongqing Univ. 2014;37(8):67–75 (In Chinese). [Google Scholar]
16. Ma W, Li H. Experimental study on rockfall impact response of buried gas pipeline. China Testing. 2018;44(9):23–8 (In Chinese). [Google Scholar]
17. Ding FF, Shi YC, Feng WK. Numerical simulation of buried pipeline under rockfall impact. Shanxi Archit. 2009;35(30):87–8 (In Chinese). [Google Scholar]
18. Cañete-Sifuentes L, Monroy R, Medina-Pérez MA. A review and experimental comparison of multivariate decision trees. IEEE Access. 2021;9:110451–79. doi:10.1109/ACCESS.2021.3102239. [Google Scholar] [CrossRef]
19. Sok HK, Ooi MPL, Kuang YC, Demidenko S. Multivariate alternating decision trees. Pattern Recognit. 2016;50(12):195–209. [Google Scholar]
20. Yang Y, Li S, Zhang P. Data-driven accident consequence assessment on urban gas pipeline network based on machine learning. Reliab Eng Syst Saf. 2022;219(3):108216. [Google Scholar]
21. Wang F, Wang Q, Nie F, Li Z, Yu W, Ren F. A linear multivariate binary decision tree classifier based on K-means splitting. Pattern Recognit. 2020;170:107521. [Google Scholar]
22. Rivera-Lopez R, Canul-Reich J, Mezura-Montes E, Cruz-Chávez MA. Induction of decision trees as classification models through metaheuristics. Swarm Evol Comput. 2022;69(1):101006. [Google Scholar]
23. Lan Y, Xu X, Fang Q, Zeng Y, Liu X, Zhang X. Transfer reinforcement learning via meta-knowledge extraction using auto-pruned decision trees. Knowl-Based Syst. 2022;242(4):108221. [Google Scholar]
Cite This Article
 Copyright © 2024 The Author(s). Published by Tech Science Press.
This work is licensed under a Creative Commons Attribution 4.0 International License , which permits unrestricted use, distribution, and reproduction in any medium, provided the original work is properly cited.
 Downloads
 Citation Tools