
 Submit a Paper
 Propose a Special lssue
 Open Access
ARTICLE

Research on Damage Identification of Cable-Stayed Bridges Based on Modal Fingerprint Data Fusion
1 School of Transportation and Geomatics Engineering, Shenyang Jianzhu University, Shenyang, 110168, China
2 College of Civil Engineering, Shenyang Jianzhu University, Shenyang, 110168, China
* Corresponding Author: Xiaowei Zhang. Email:
Structural Durability & Health Monitoring 2024, 18(4), 485-503. https://doi.org/10.32604/sdhm.2024.049698
Received 15 January 2024; Accepted 15 March 2024; Issue published 05 June 2024
 View Full Text
 Download PDF
Abstract
This study addresses the issue of inaccurate single damage fingerprint recognition during the process of bridge damage identification. To improve accuracy, the proposed approach involves fusing displacement mode difference and curvature mode difference data for single damage identification, and curvature mode difference and displacement mode wavelet coefficient difference data for two damage identification. The methodology begins by establishing a finite element model of the cable-stayed bridge and obtaining the original damage fingerprints, displacement modes, curvature modes, and wavelet coefficient differences of displacement modes through modal analysis. A fusion program based on the D-S evidence theory criterion is then developed using Matlab to calculate the displacement mode difference (DMD), curvature mode difference (CMD), and wavelet coefficient difference of displacement mode (WCDM) for data fusion. The recognition effect of a single fingerprint is analyzed using modal data for both single and two damage conditions. Additionally, the fusion of multiple fingerprint initial data is performed, and the recognition effect of the data fusion method is quantitatively analyzed through sub peak to peak comparison. It is observed that when the fusion index is used as the recognition index, the sub peak to peak ratio is smaller compared to using the curvature mode as the damage index. Consequently, the reduction in single damage is more significant, ranging from 12% to 48%, while the reduction in multi damage is approximately 2%. This method demonstrates the ability to accurately identify the location of damage, yielding satisfactory recognition results and showing promising feasibility.Graphic Abstract
Keywords
As a cable system, cable-stayed bridges are the main type of long-span bridges and have a greater crossing capacity than beam bridges. They offer advantages such as reasonable stress, diverse design concepts, high stiffness, and beautiful appearance, making them widely used in river crossing bridges and overpass bridges [1]. However, it is important to note that cable-stayed bridges belong to multiple statically indeterminate structures and have complex forces, requiring special attention to safety during service. Due to factors such as dynamic loads, environmental conditions, and even earthquakes, the bridge may gradually experience damage, including potentially dangerous damage that is not visible to the naked eye. If the damage goes unnoticed and accumulates over time, it can significantly impact the durability and safety of the structure, posing a threat to people’s lives and property. Therefore, it is crucial to have a clear understanding of the development of bridge damage that cannot be detected visually and to promptly address any necessary repairs or reinforcements.
In recent years, the field of bridge damage identification has gained significant attention [2,3]. Researchers have extensively studied various damage indicators, including frequency, displacement mode, curvature mode, and strain mode [4]. Tian et al. [5] conducted detailed studies on the damage of simply supported beams using natural frequencies. Shu et al. [6] proposed the use of the 4th derivative of displacement modes for damage identification. Li et al. [7] focused on the identification of bridge damage using curvature modes. Luo et al. [8] proposed a method for identifying cracks and void damage in ballastless track slabs based on strain modes. Zhou et al. [9] suggested the application of probabilistic neural networks for damage localization of cable-stayed bridges. However, evaluating a single indicator for bridges may sometimes lead to distorted identification results due to the complex nature of large-scale structures. Therefore, it is necessary to explore the collaborative analysis of bridge damage using multiple indicators, which is known as Data Fusion (DF) technology.
Data fusion technology combines various information sources to assist people in making reasonable judgments or diagnoses of the situation. So we will introduce this technology into structural damage identification to diagnose structural damage [10,11]. In recent years, many scholars have applied Bayesian theory to damage identification [12,13]. Existing data fusion methods are mostly used for single-stage data fusion of simply supported system structures and framework structures, while research on damage identification through data fusion for cable-stayed bridges still needs further investigation.
Based on this, the author applied finite element software to numerically simulate a cable-stayed bridge and used Matlab to write a program to process modal data. Different damage indicators were fused using a program based on the D-S evidence theory fusion criterion, and the damage identification effect was verified and analyzed.
The S evidence theory was initially proposed by Dempster [14] and has since been continuously improved by Shafter [15] to form a theory that can determine the basic probability assignment of uncertain events and fuse it with specific rules to solve uncertainty problems [16].
After applying this theory to damage identification in civil engineering structures, the probability of damage identification results from multiple independent sensors can be assigned and the data from multiple sensors can be fused through their operation rules.
Hypothesis θ Framework or hypothetical space for identifying damage in cable-stayed bridge:
In the formula: θi (i = 1, 2,..., n) is the i-th element damage of the cable-stayed bridge. Its power set 2 θ A function assigned to the basic probability in the recognition framework, called the mass function, where 0 ≤ mass ≤ 1, satisfies
When there are n sensors, there are n mass functions whose synthesis rules are as follows:
wherein,
Based on the synthesis rules of D-S evidence theory, the author extends multi-sensor fusion to the fusion of multiple damage identification methods. The specific fusion model diagram is shown in Fig. 1:
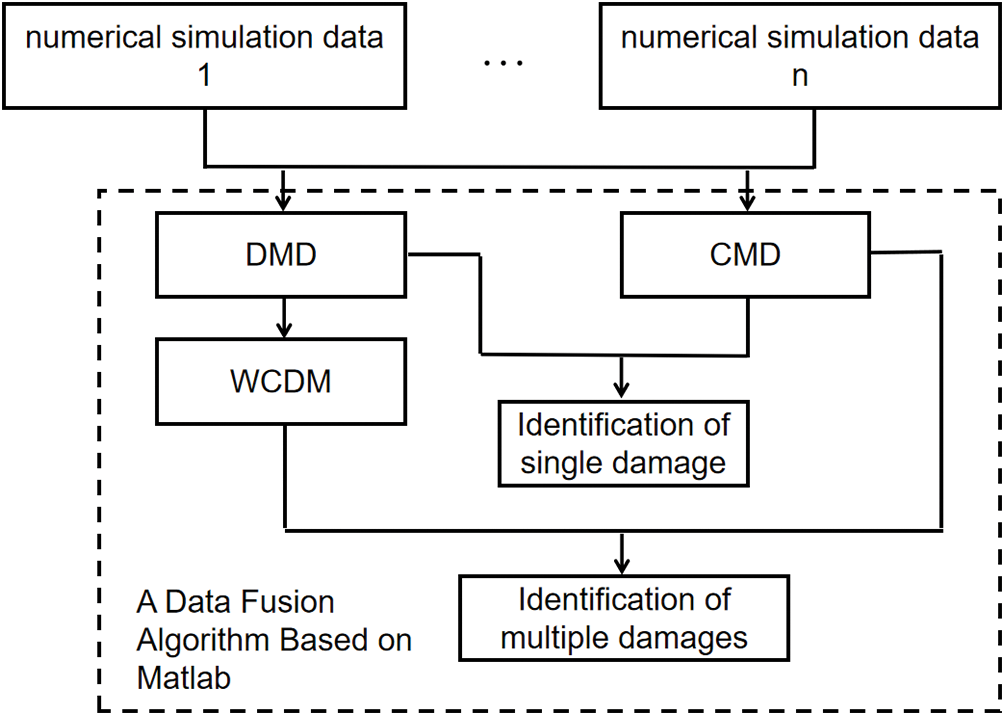
Figure 1: Data fusion flowchart
3 Construction of 3 Damage Indicators
The displacement mode contains more structural information than the frequency and is more sensitive to local structural damage. High order displacement modes are more sensitive and can determine the model error of the structure and identify the location of damage.
As is well known, high-order modes pose certain difficulties in actual engineering acquisition, so the author only uses first-order and second-order displacement modes as examples for calculation and analysis.
Displacement mode difference (DMD). Using the first-order displacement modal difference and second-order displacement modal difference before and after the damage of cable-stayed bridges as damage indicators to identify bridge damage.
In the formula:
In bridge structures, the main beam serves as the main bending component, with bending deformation being the main deformation, while other deformations such as shear deformation can be ignored. Therefore, by simplifying the principle of virtual work, the deflection expression is:
The formula for curve curvature is:
In the formula:
The relationship between bending moment and deflection at the cross-section of the beam is as follows:
Combining Eqs. (7) and (8), it can be concluded that:
According to Eq. (5), it can be inferred that the curvature of a point on the main beam is inversely proportional to its corresponding stiffness. Therefore, once the stiffness of the structure changes, it can be reflected by the curvature.
Therefore, the curvature mode difference (CMD) is used as the damage fingerprint.
In the formula:
Once a structure is damaged, some characteristic parameters of the structure will undergo irregular changes or mutations at the damage site, which contain certain damage signals. These changes or abrupt changes often correspond to the maximum or zero crossing points of wavelet transform coefficients in the wavelet transform domain, and the magnitude of signal singularity corresponds to the variation law of the maximum scale of wavelet transform coefficients [17–19].
If the
The above integral transformation is an integrated continuous wavelet transform based on
Simply put, the process of continuous wavelet transform (CWT) involves approximating known signals as closely as possible based on the selected wavelet basis, in order to calculate wavelet coefficients. The larger the wavelet coefficient, the higher the similarity between the wavelet basis and the known signal; On the contrary, the signal can also be reconstructed based on the selected wavelet basis and wavelet coefficients.
4 Research on Damage Identification of Cable Stayed Bridges Based on Data Fusion
The numerical example is based on a cable-stayed bridge and modeled according to the actual construction drawings. The overview of the bridge is as follows:
The main bridge structure is a single tower cable-stayed bridge, and the approach bridge adopts reinforced concrete cast-in-place box beams and prestressed concrete cast-in-place box beams. The specific span layout is (32.50 + 40.00 + 30.76) m + (152.00 + 48.00 + 42.00) m + 13.0 m, where (152.00 + 48.00 + 42.00) m is within the main bridge range. The bridge layout diagram is shown in Fig. 2.
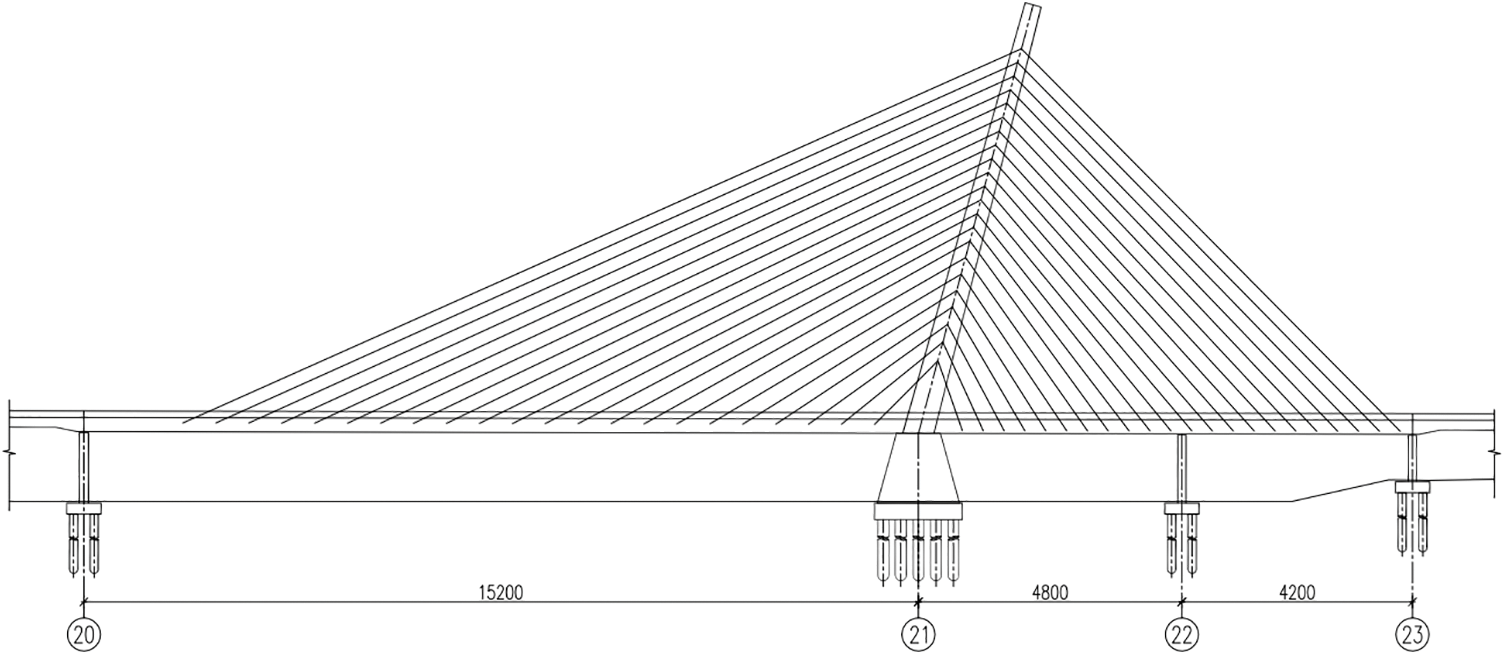
Figure 2: (152.00 + 48.00 + 42.00) m bridge type layout
The main beam adopts a mixed type of steel main beam and prestressed concrete beam. The section form of the main beam is a double box and double chamber thin-walled section, with wind nozzles. The main span adopts a steel main beam, and the side span adopts a prestressed concrete main beam. The joint position is located 7 meters away from the main pier on the side of the main span.
The main bridge cable tower is an arched steel structure, with an elliptical axis. The height of the main tower above the main beam structure is 78.00 m, with an inclination angle of 75.0°. The main beam passes through the tower, and the spacing between the cables on the main tower gradually changes from 2.50 to 3.40 m from top to bottom. The cables are in the form of fan-shaped cables, with an inclination angle of 24.1° to 47.7° for the main span and 45.2° to 70.6° for the side span cables. The diagonal cables use multi-strand parallel steel wire finished cables, with a mid-span cable spacing of 6.00 m and a side span cable spacing of 3.80 m, The main beam at the main tower is consolidated with the lower tower pier.
The main tower is divided into two sections: the lower tower pier is a trapezoidal solid pier structure, and the cross-sectional size of the pier position is 14.75 m × 15.00 m, the cross-sectional dimension at the bottom of the beam is 14.75 m × 8.00 m, with a tower height of 78.00 m above the top of the lower tower pier. The main bridge adopts a dense cable arrangement, with 22 pairs of diagonal cables arranged on the main span, with a distance of 6.00 m. The angle between the diagonal cables and the horizontal is 24.1°~47.7°, and the side span is arranged with 22 pairs of diagonal cables, with a distance of 3.80 m. The angle between the diagonal locks and the horizontal is 45.2°~70.6°. The total number of cables in the bridge is 88.
A spatial beam grid model was established using Midas Civil 2009 version. The steel main beam, concrete main beam, and bridge tower sections were simulated using beam elements, while the cables were simulated using truss cable elements. The model has a total of 493 units. The main beam has a total of 148 nodes and 147 units, with unit lengths set according to the actual length of the bridge.
The spatial finite element model is shown in Fig. 3:
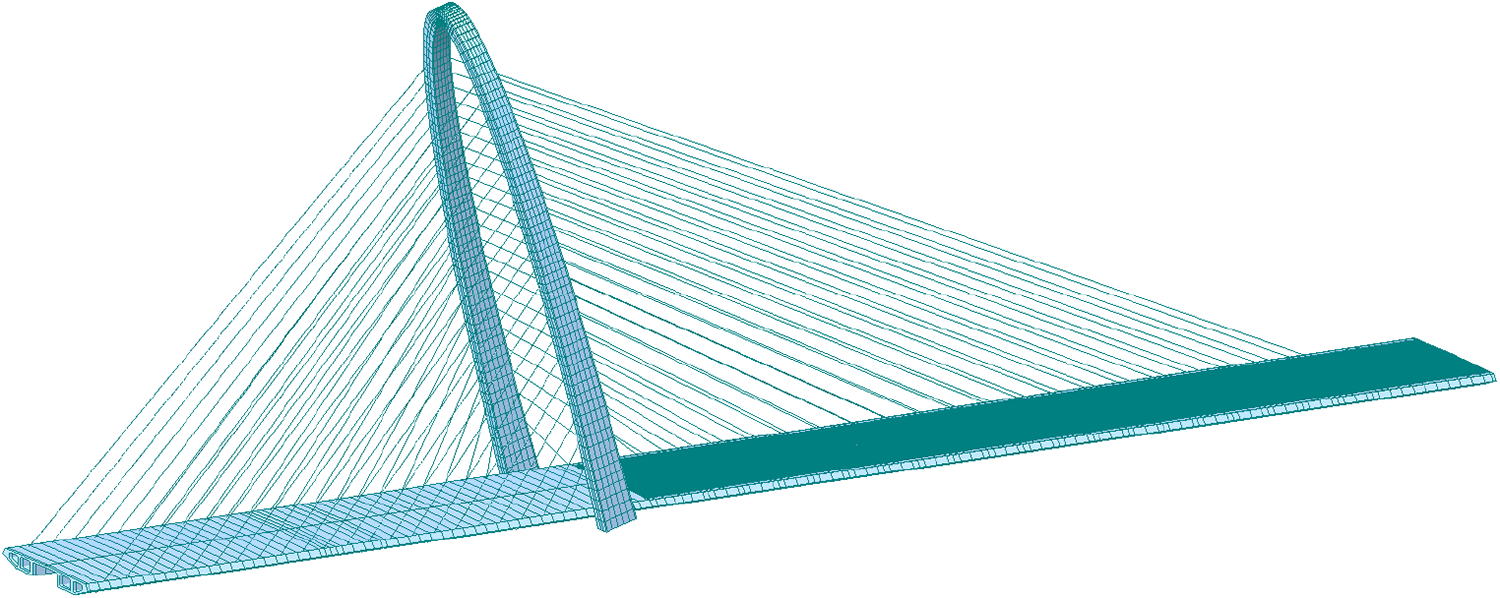
Figure 3: Overall model diagram
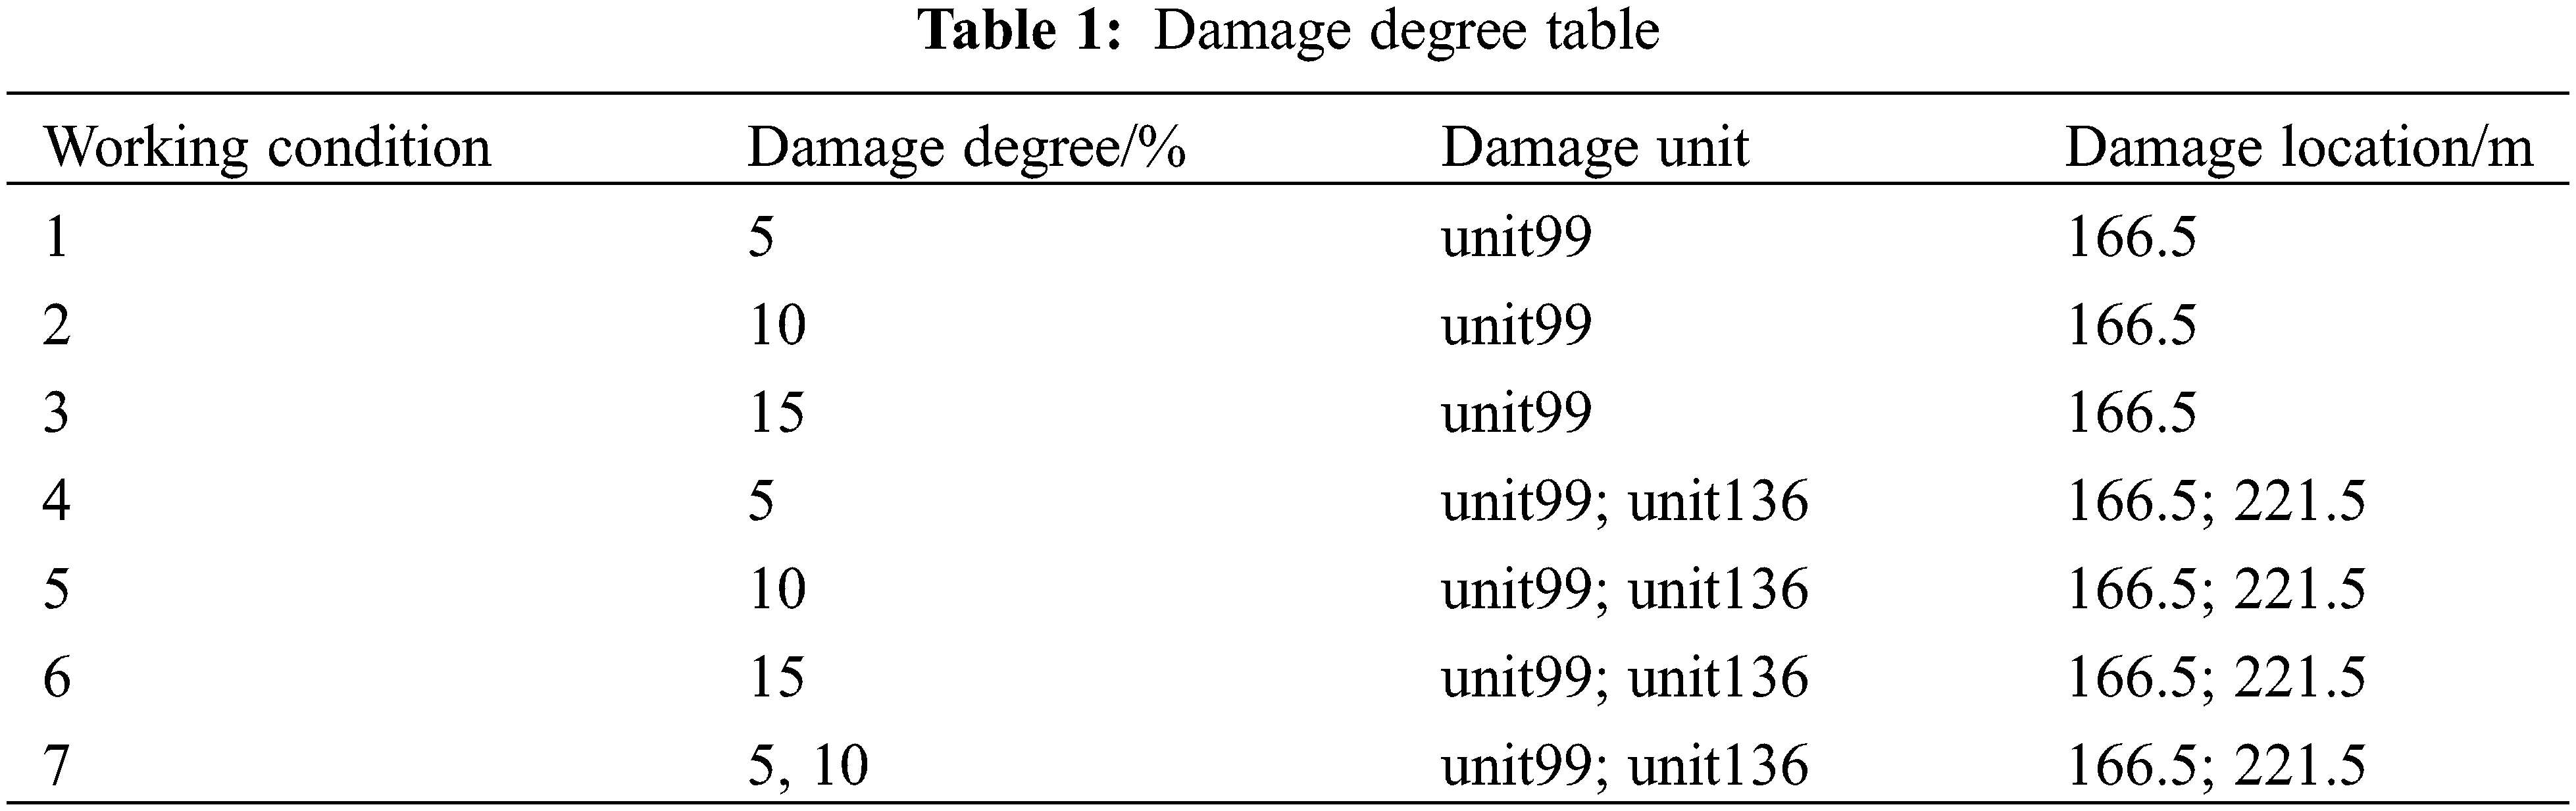
This article assumes that when a structure is damaged, it is only related to changes in structural stiffness, so the damage in this article is simulated using stiffness reduction. Considering that there are many influencing factors on the dynamic response in engineering practice, and the allowable measurement error in engineering is about 5% [20], this article assumes that 5% damage is defined as minor damage. The setting of damage conditions includes two situations: single damage and two damages, as shown in Table 1:
4.2 Research on Damage Localization Based on Modal Fingerprints
After calculating the numerical model mentioned earlier, extract the basic fingerprint and construct the damage identification fingerprint according to the fingerprint construction method mentioned in the previous section.
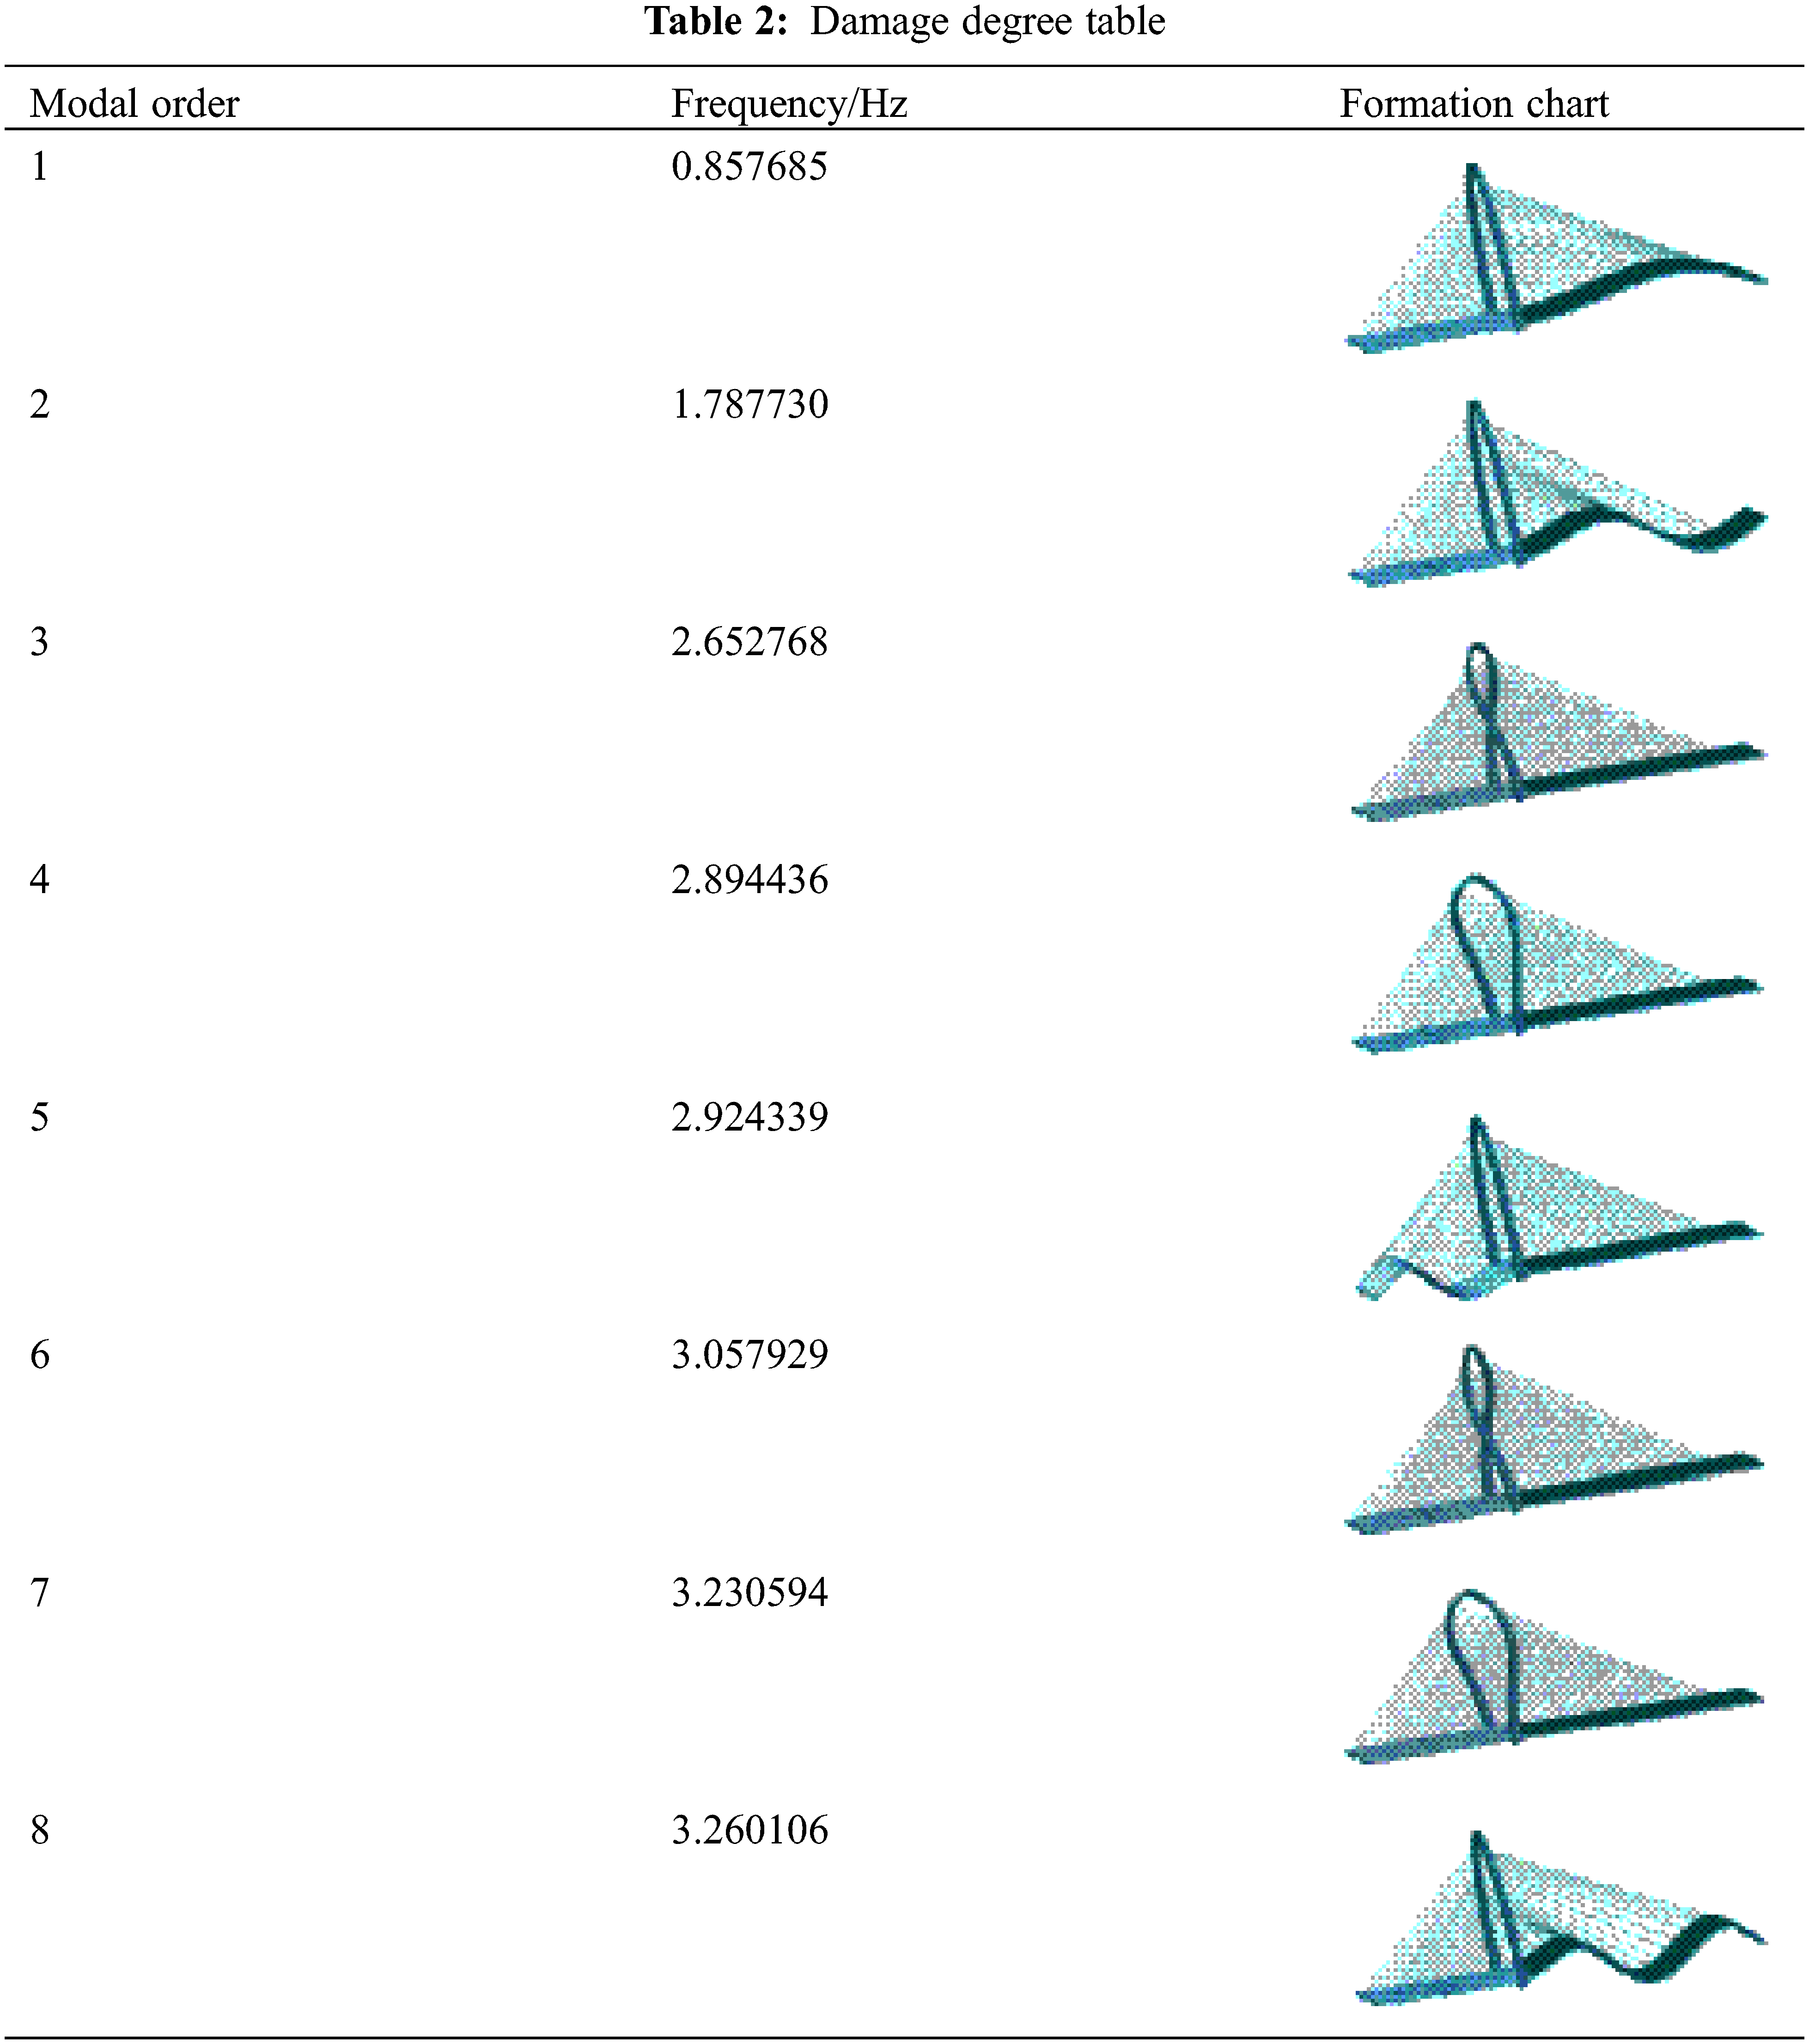
By analyzing the dynamic characteristics of the bridge through a finite element model, the first 8 modal characteristics of the bridge are shown in Table 2: the overall stiffness of the bridge is relatively flexible, the span is large, the fundamental frequency is low, and the frequency distribution is dense. The first, second, fifth, and eighth orders are mainly vertical curves. Therefore, these 4th order modal data can be used as the basic fingerprint for the bridge. Considering that the actual high-order information of the structure is generally difficult to accurately obtain during the actual structural dynamic testing process, this numerical simulation analysis is conducted through the first-order and second-order modes of the structure.
Based on the modal information, first extract the displacement mode and curvature mode, and then construct the displacement mode difference and curvature mode difference separately. Working conditions 1 to 3 are single damage working conditions, which are calculated using a pre-programmed calculation program in Matlab.
The output of the Matlab calculation program is shown in Fig. 4. When condition 1 occurred, the 99 units of the bridge suffered 5% damage. The damage index curvature mode difference reveals that both first-order and second-order curvature mode differences experienced waveform convexity in element 99, while the waveform peaks of all other elements were much smaller. The waveform oscillations become more stable as the distance from Unit 99 increases, indicating that both first-order and second-order curvature modal differences can identify minor damage to a degree of 5%. Comparing the identification results of first-order and second-order curvature modal differences, it is observed that the waveform of the second-order curvature modal difference is clearer at the damaged and undamaged parts, and the waveform at the undamaged part is more stable. The ratio of the extreme values at the damaged and undamaged areas is larger, suggesting that the second-order index is relatively more sensitive than the first-order index, which aligns with the principle that high-order modes are more sensitive to identification than lower-order modes. Observing the displacement mode difference of the damage index, it is found that both the first-order and second-order displacement mode differences experienced waveform mutations at element 99. However, not all waveforms of other undamaged areas tend to zero. If displacement modes are solely used for damage identification, it may result in misjudgment of damage. Analyzing the identification results of working condition 1, it is concluded that the two damage fingerprint recognition effects of the modal-based system differ, with the curvature mode difference being superior to the displacement mode difference.
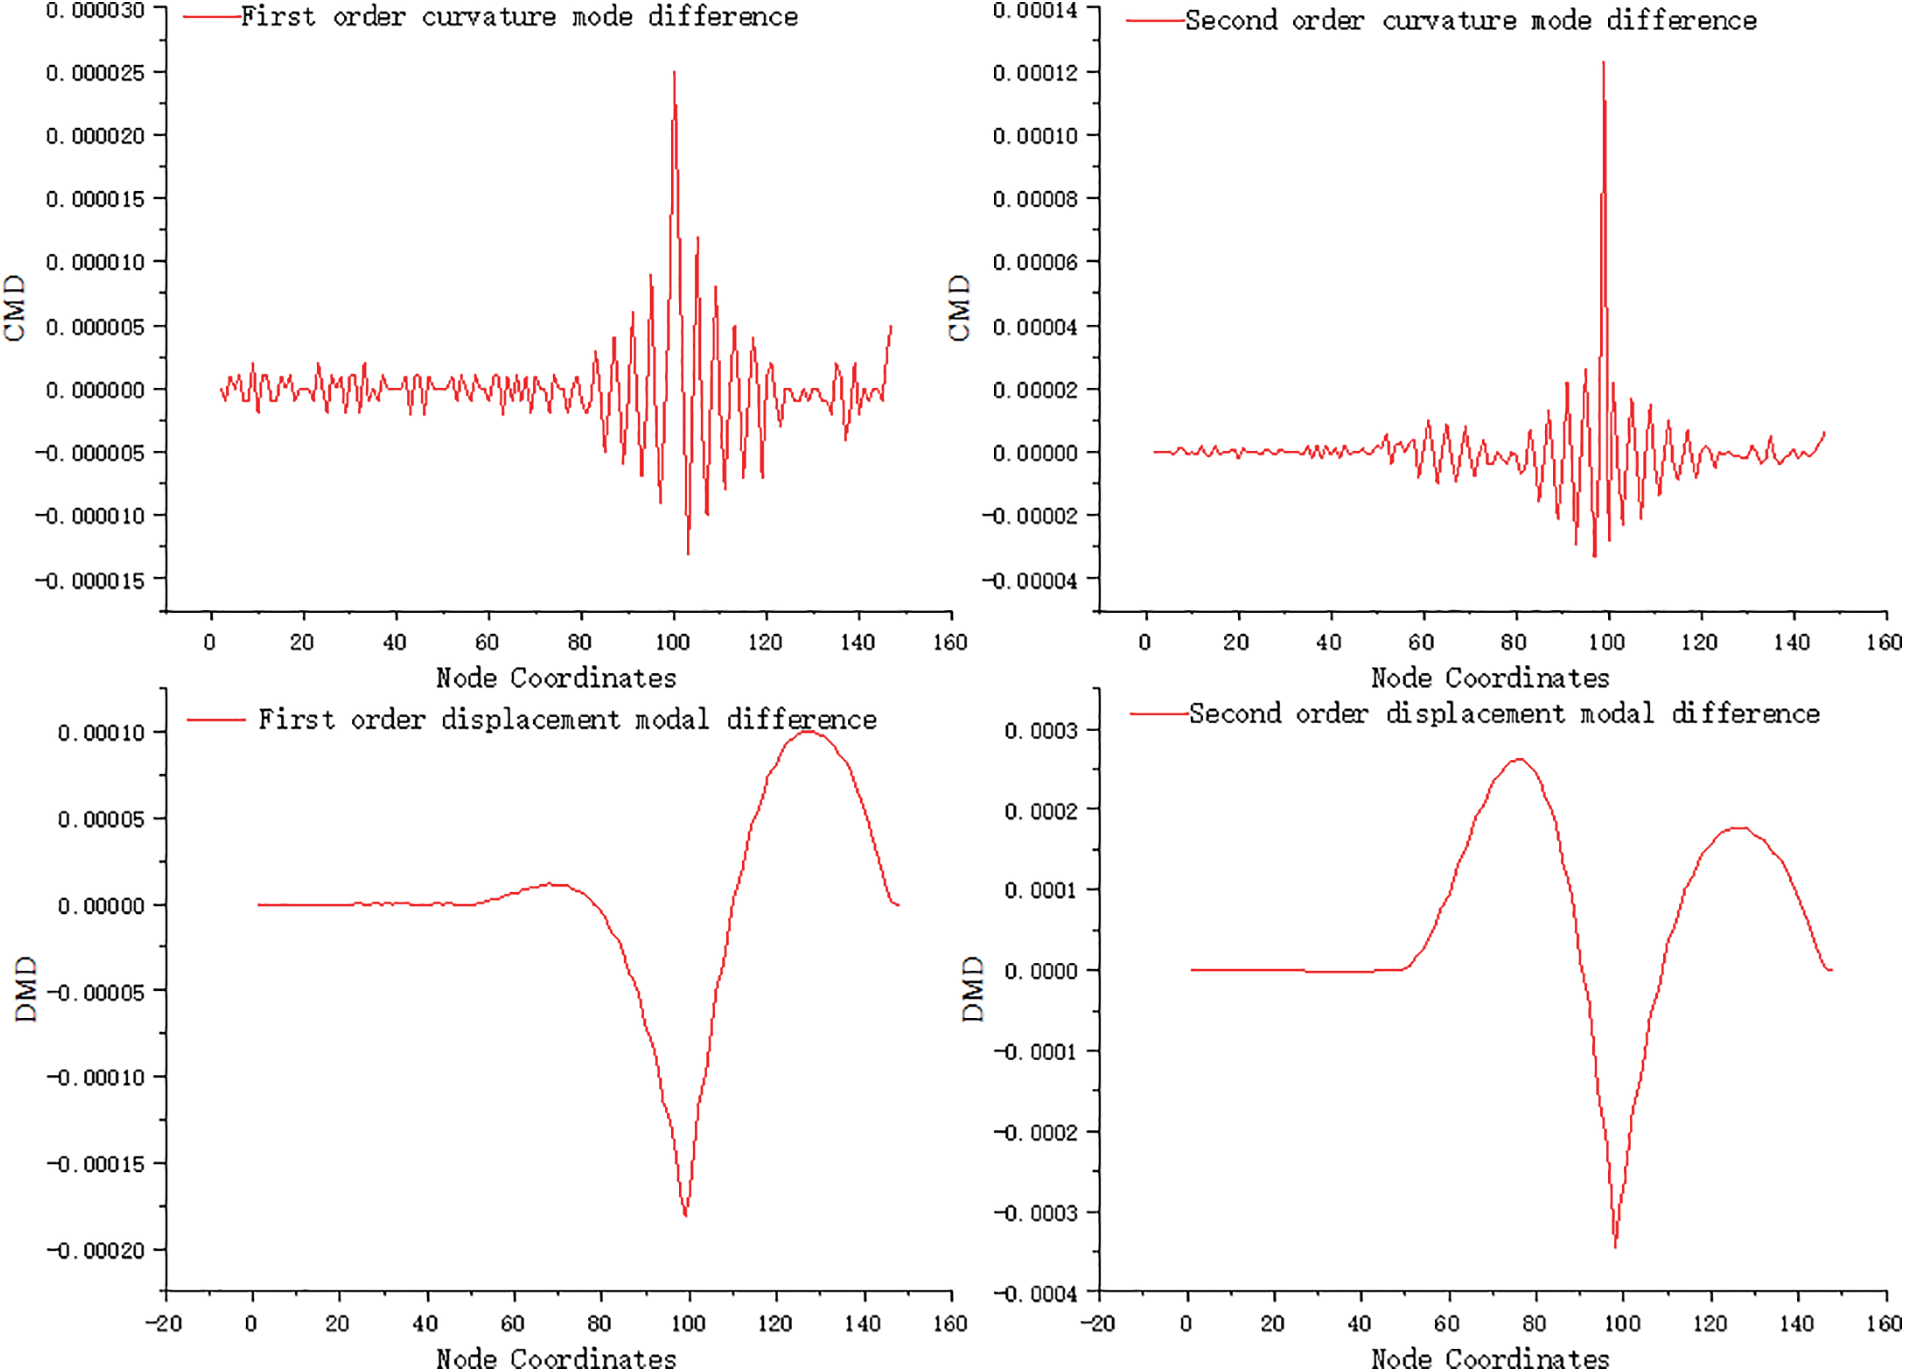
Figure 4: Result of damage identification under condition 1
The output of the Matlab calculation program is shown in Fig. 5. When condition 2 occurred, the 99 units of the bridge suffered 10% damage. Upon observing the curvature mode difference of the damage index, it was found that, similar to operating condition 1, there was a significant waveform surge at unit 99, and all waveform trends were consistent with operating condition 1. The peak of Unit 99 is significantly higher than that of Condition 1, with the first-order peak increasing from 2.5 × 10⁻⁵ to 5.5 × 10⁻⁵, and the second-order peak increasing from 0.000123 to 0.00026. The curvature mode difference index increases with the degree of damage, and its peak value also increases, indicating a positive correlation with the degree of damage. Additionally, the waveform at other undamaged areas becomes smoother, showing a negative correlation with the degree of damage. Upon observing the displacement mode difference of the damage index, it was found that both the first-order and second-order displacement mode differences experienced waveform mutations at element 99. Compared to condition 1, the absolute value of the extreme point of unit 99 also increases due to the increase in damage degree, and the trend of change is consistent with the difference in curvature mode.
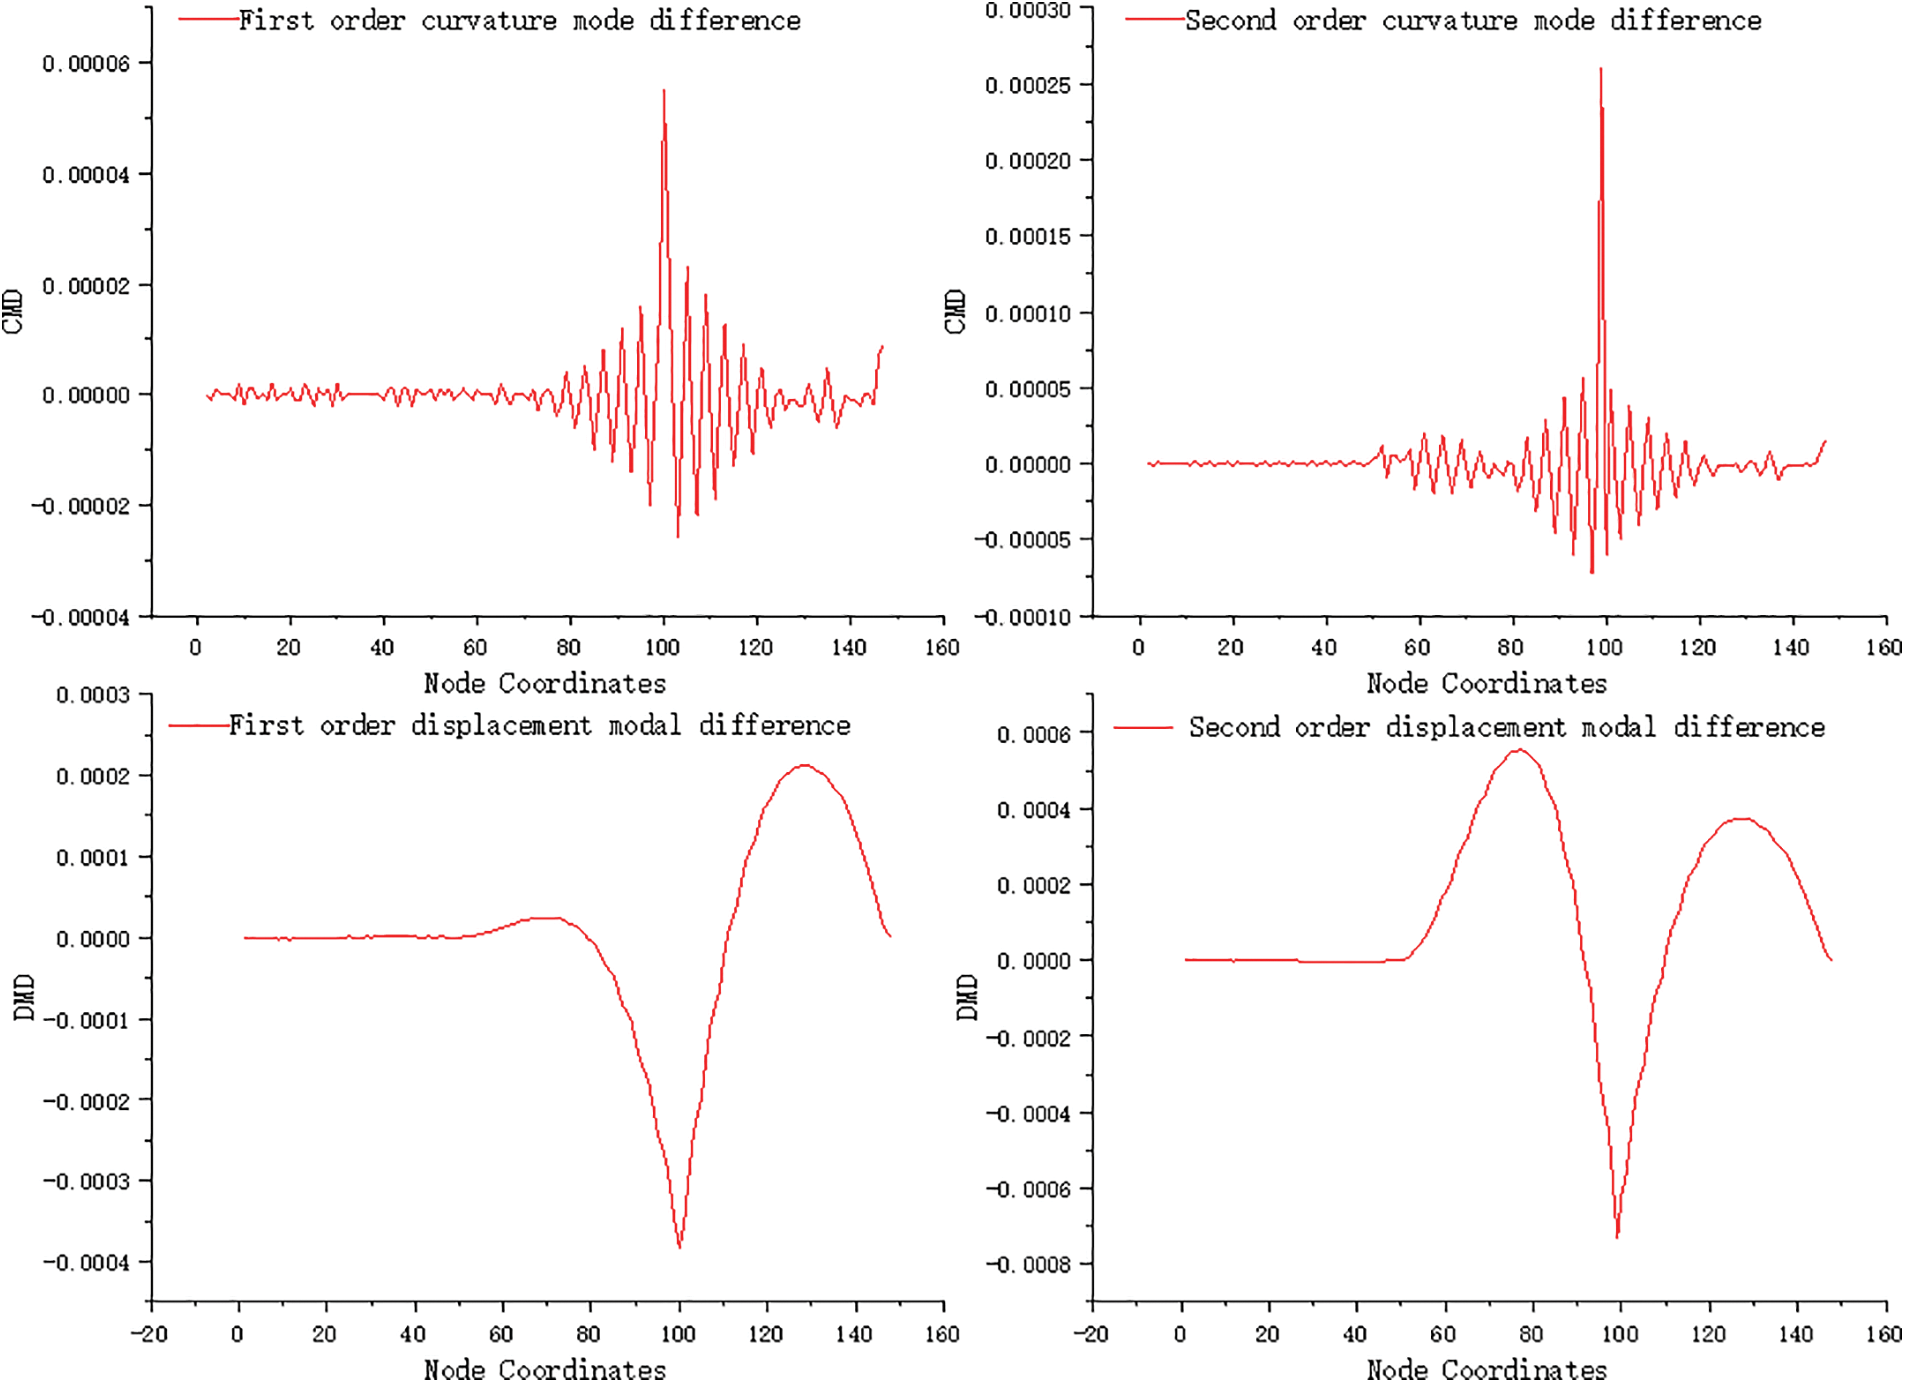
Figure 5: Damage identification results for condition 2
The output of the Matlab calculation program is shown in Fig. 6. When condition 3 occurred, the 99 units of the bridge suffered 15% damage. By analyzing the curvature mode difference of the damage index, it was observed that a significant waveform surge occurred at Unit 99, similar to conditions 1 and 2. The first wave peak of Unit 99 increased to 9 × 10⁻⁵ with the degree of damage, while the second order peak increased to 0.000412. The waveform in other undamaged areas appeared smoother compared to condition 2, and the overall trend was consistent with conditions 1 and 2. By analyzing the displacement mode difference of the damage index, it was found that there were differences in both first-order and second-order displacement modes. Compared to condition 1, the extreme point of Unit 99 also increased in absolute value due to the higher degree of damage, and the trend of change was consistent with the difference in curvature mode. Working conditions 4 to 6 are two additional damage working conditions that were calculated using a pre-programmed calculation program in Matlab.
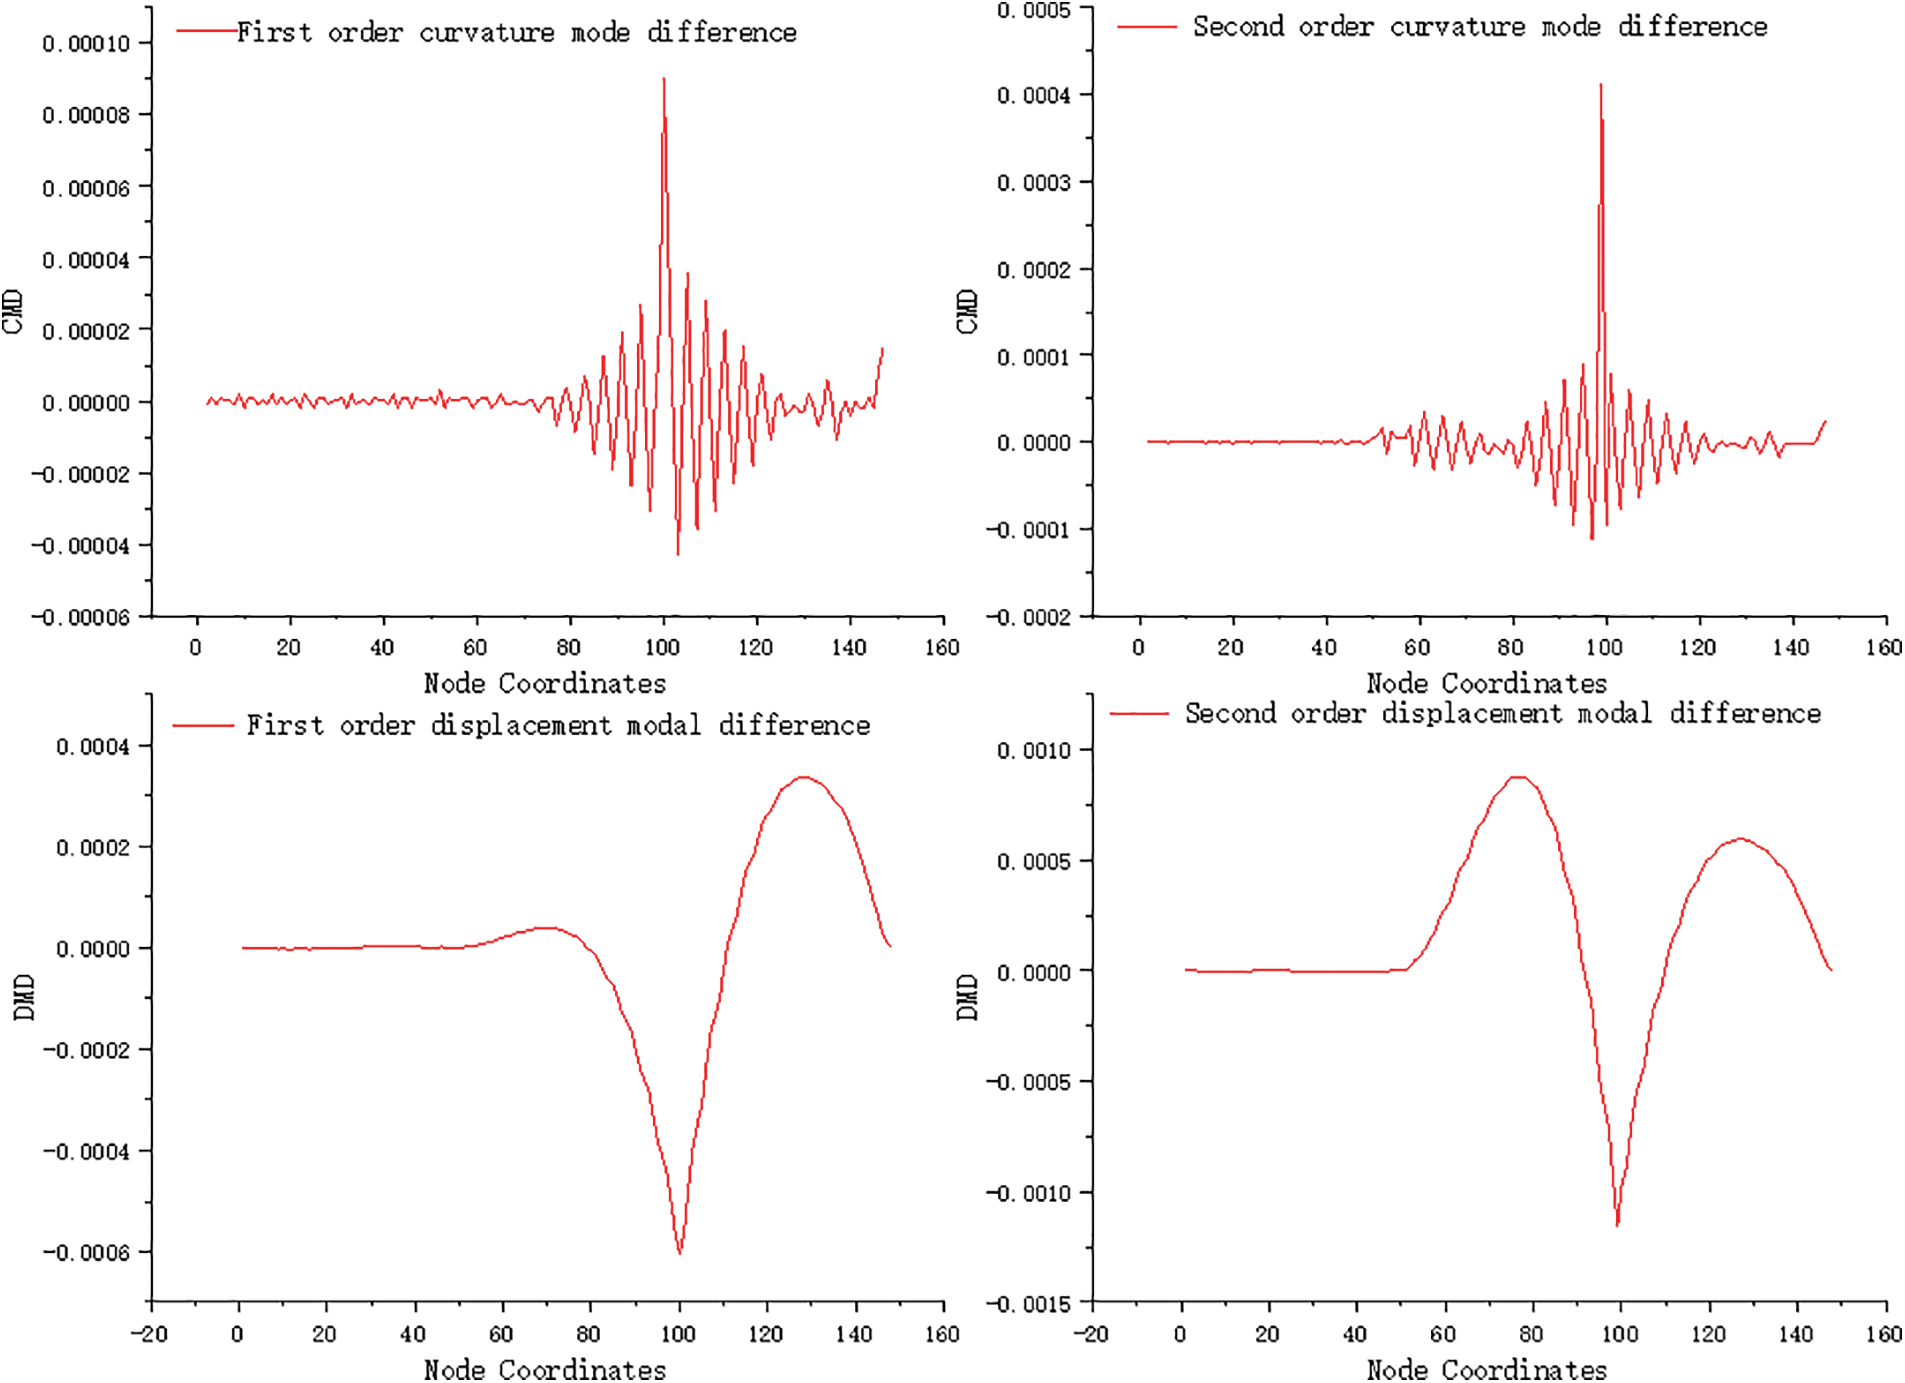
Figure 6: Damage identification results under condition 3
The output of the Matlab calculation program is shown in Fig. 7. When condition 4 occurs, both Unit 99 and Unit 136 of the bridge experience 5% minor damage. Analysis of the damage index curvature mode difference reveals that Unit 99 and Unit 136 exhibit waveform convexity in both the first-order and second-order curvature modes, while all other units have significantly smaller waveform peaks. Both the first-order and second-order curvature modes can identify minor damage up to 5%. Comparing the identification results of the first-order and second-order curvature modes, it is observed that the waveform comparison of the second-order curvature mode difference is clearer at the damaged and undamaged areas. The waveform at the undamaged area is more stable, and the ratio of the extreme values at the damaged area to the extreme values at the undamaged area is larger. The second-order index is relatively more sensitive than the first-order index, which aligns with the general rule that higher-order modes are more sensitive for identification purposes than lower-order modes.
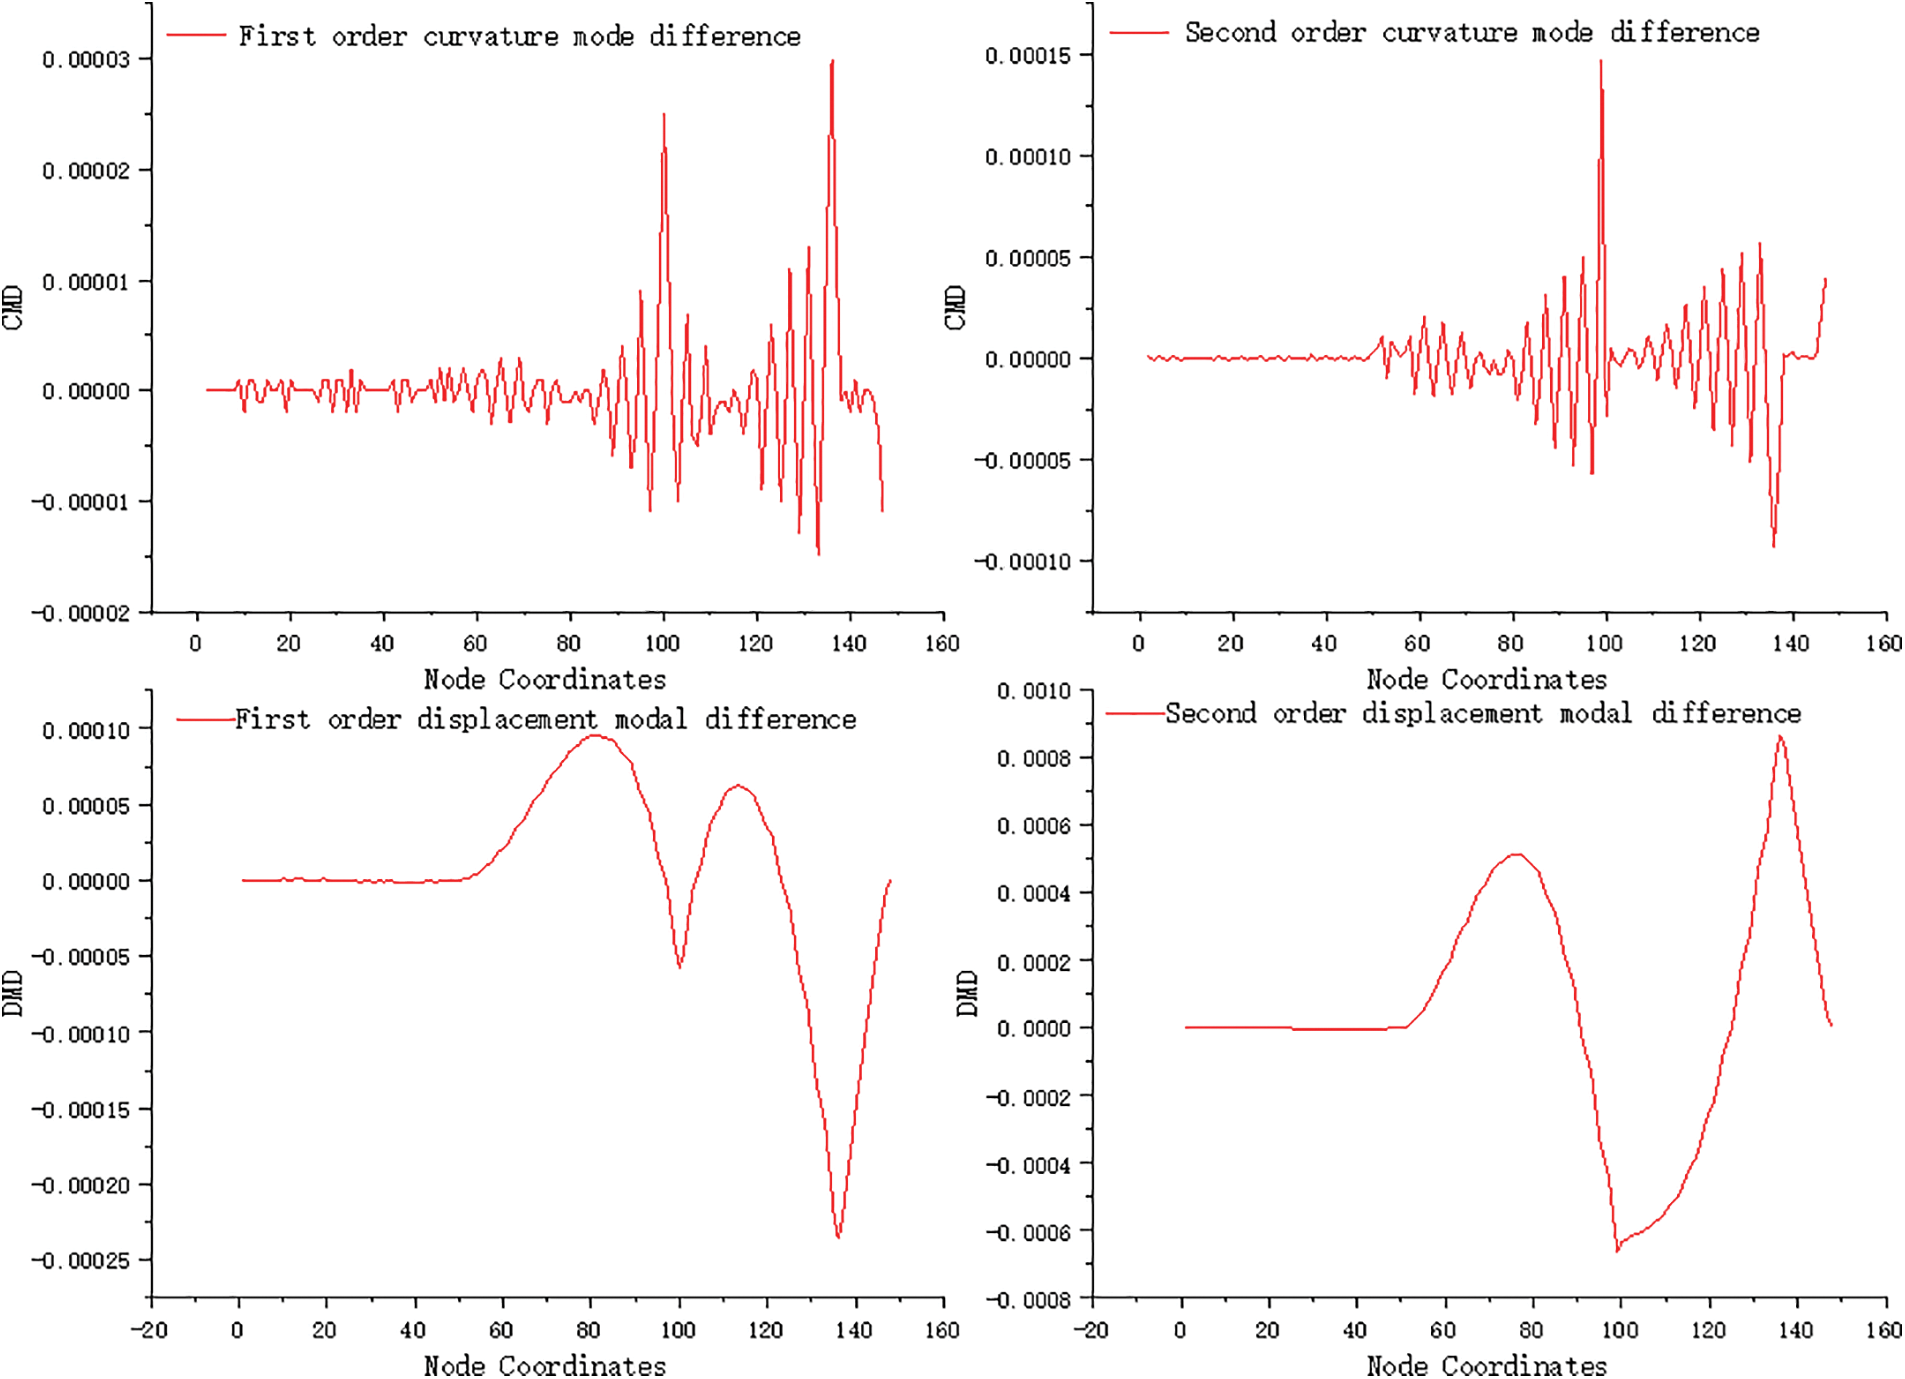
Figure 7: Damage identification results under condition 4
By analyzing the displacement modal difference identification results, it is evident that there are two distinct abrupt points in the waveform. These two mutation points correspond to the location of the damage, implying that even in the presence of multiple damages, the displacement mode difference can still identify the damage. However, it is worth noting that the recognition effect of the displacement mode difference is not as strong as that of the curvature mode difference. Therefore, in cases where multiple damages occur, further improvements should be made to enhance the efficiency of damage indicators based on the displacement mode difference.
The output of the Matlab calculation program is shown in Fig. 8. When condition 5 occurs, both Unit 99 and Unit 136 of the bridge experience 10% damage. Similar to operating condition 4, significant waveform surges are observed in both Unit 99 and Unit 136, with all waveforms showing consistent trends. The peaks in Unit 99 and Unit 136 are notably higher compared to operating condition 4. Specifically, in Unit 99, the first wave peak increases from 2.5 × 10⁻⁵ to 5.5 × 10⁻⁵, and the second-order peak increases from 0.000147 to 0.000308. In Unit 136, the first wave peak increases from 3 × 10⁻⁵ to 6.2 × 10⁻⁵, and the absolute value of the second-order peak ranges from 9.3 × 10⁻⁵ to 0.000197. The curvature mode difference index and its peak value show a positive correlation with the degree of damage, indicating that as the damage increases, so does the index. Moreover, the waveforms in other undamaged areas appear smoother, demonstrating a negative correlation with the degree of damage. Overall, these observations align with the occurrence of a single injury. When examining the displacement mode difference of the damage index, it is evident that both the first-order and second-order displacement mode differences undergo waveform mutations in elements 99 and 136. The absolute values of extreme points in units 99 and 136 also increase due to the higher degree of damage, and this trend aligns with the difference in curvature modes.
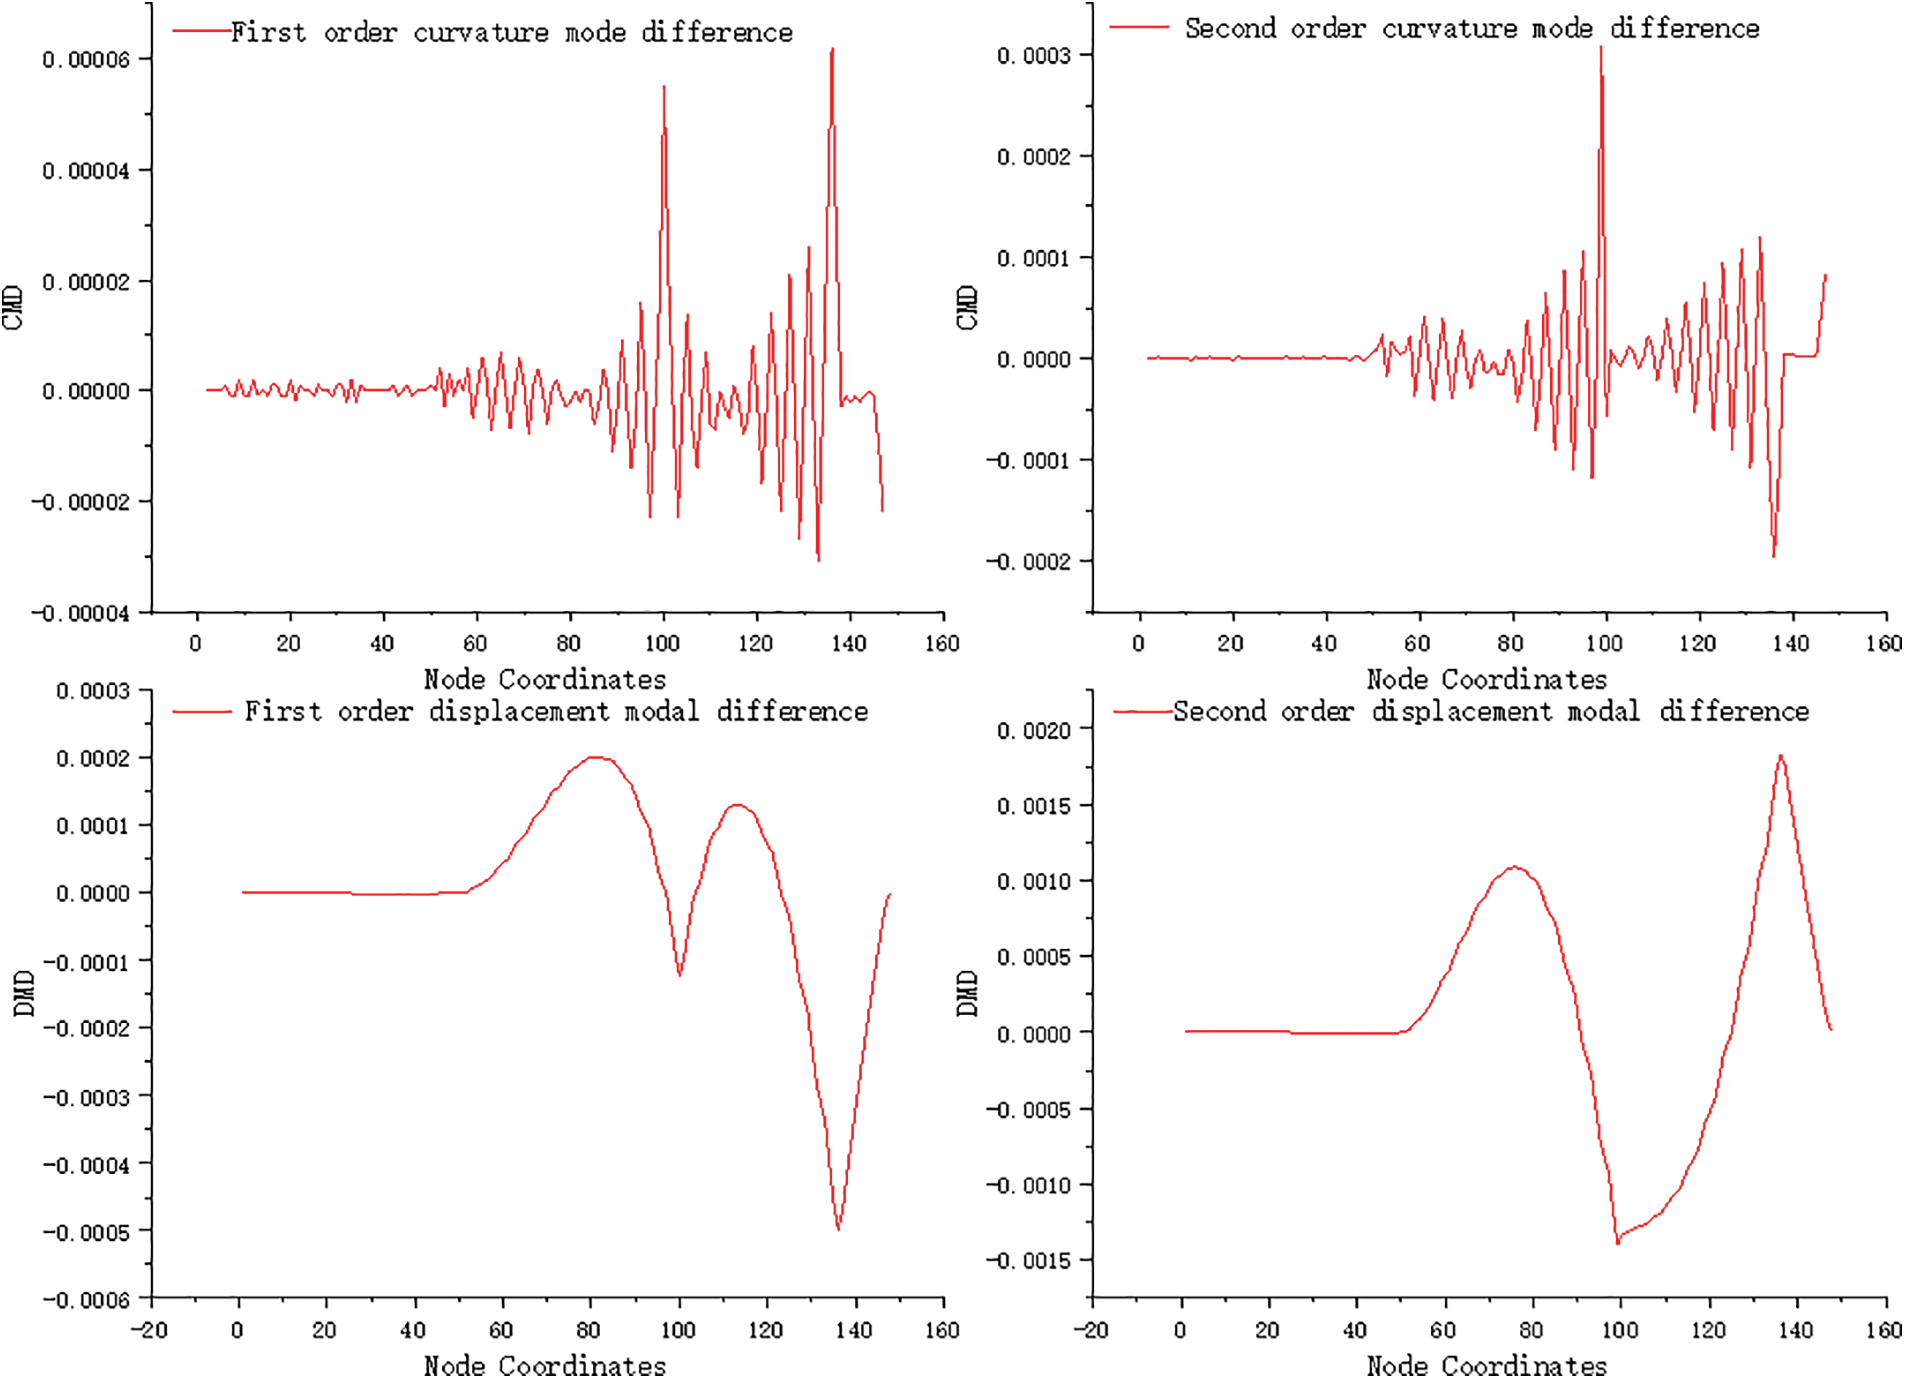
Figure 8: Damage identification results under working condition 5
The output of the Matlab calculation program is shown in Fig. 9. When condition 6 occurs, both Unit 99 and Unit 136 of the bridge experience 15% damage. Working condition 6 is similar to conditions 4 and 5, as there are significant waveform surges observed in both Unit 99 and Unit 136. The waveform trends in condition 6 are consistent with those in conditions 4 and 5. In Unit 99, the first-order peak increases again to 8.7 × 10⁻⁵, and the second-order peak also increases to 0.00049. Similarly, in Unit 136, the first-order peak increases to 9.8 × 10⁻⁵, and the absolute value of the second-order wave peak increases to 0.000312. The curvature mode difference index and its peak value exhibit a positive correlation with the degree of damage, indicating an increase in damage. Additionally, the waveforms in other undamaged areas become smoother, showing a negative correlation with the degree of damage. Overall, these trends align with the occurrence of a single injury.
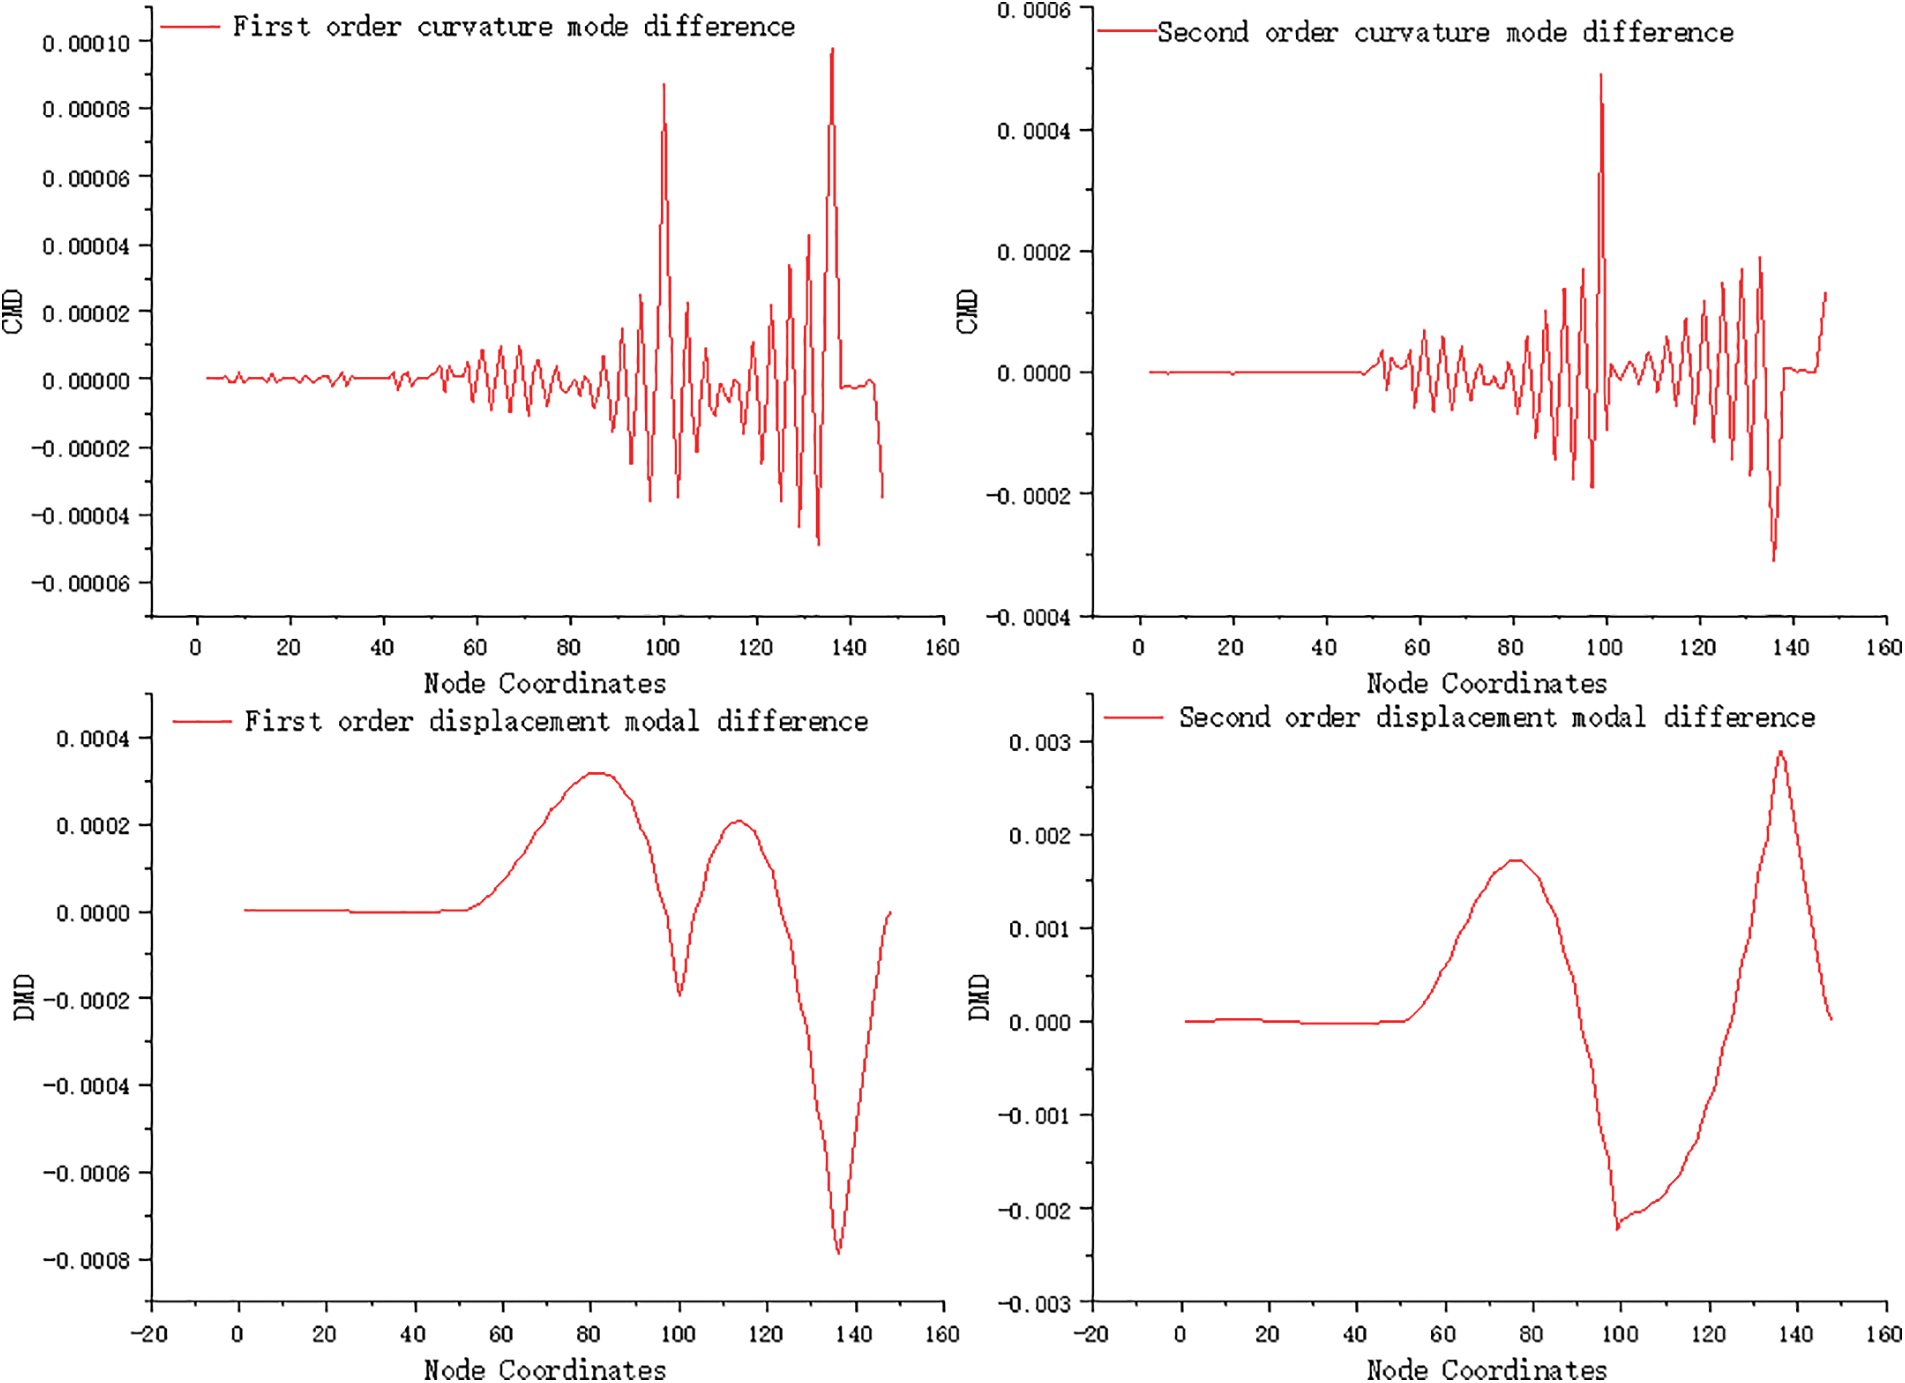
Figure 9: Damage identification results under working condition 6
By examining the displacement mode difference index, it was observed that both the first-order and second-order displacement mode differences undergo waveform mutations at elements 99 and 136. Compared to conditions 4 and 5, the extreme values of Unit 99 and Unit 136 increase due to the higher degree of damage, and this change aligns with the difference in curvature modes.
Working condition 7 involves two damages with varying degrees, and these damages were calculated using a pre-programmed calculation program in Matlab.
The output of the Matlab calculation program is shown in Fig. 10, displaying the recognition results of working condition 7. It indicates that Unit 99 of the bridge has a 5% degree of damage, while Unit 136 has a 10% degree of damage. The damage index shows significant waveform surges in both units, but the overall trend suggests that the degree of damage is consistent between the two locations.
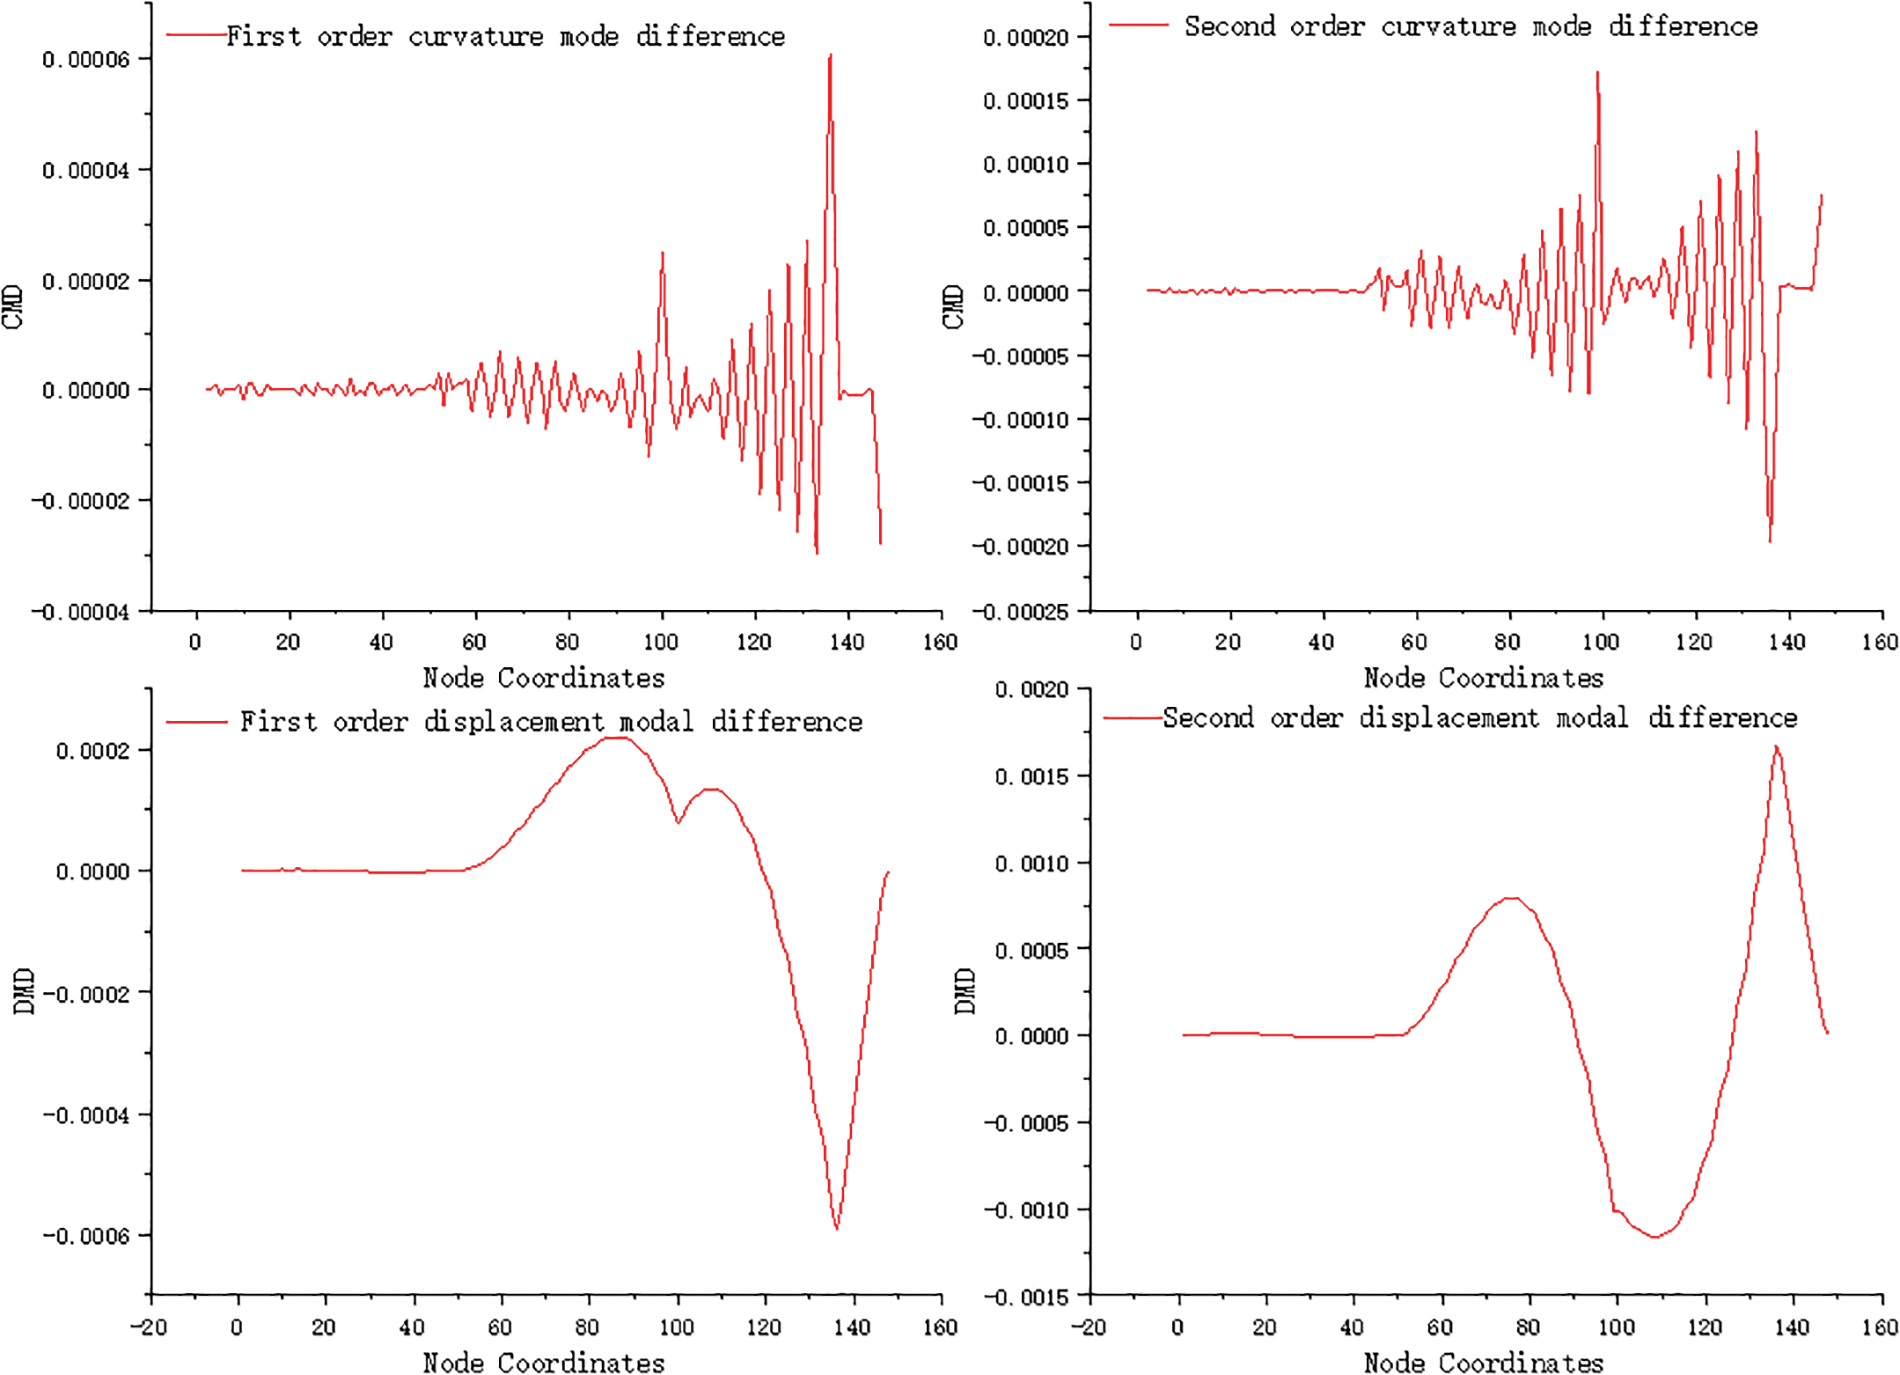
Figure 10: Damage identification results under working condition 7
By analyzing the displacement modal difference of the damage index, it is observed that both Unit 99 and Unit 136 experience waveform mutations in the first-order and second-order displacement modes. However, the waveform mutation is more pronounced in Unit 136 compared to Unit 99. When comparing operating conditions 4, 5, and 6, it is evident that the waveform in the unit with smaller damage is easily influenced by the unit with larger damage when different degrees of damage occur.
According to the analysis of the identification results, it is evident that the two damage fingerprints obtained from the modal system have varying recognition effects. The recognition effect of the curvature mode difference is relatively better than that of the displacement mode difference, while the recognition effect of the displacement mode difference is not significant. However, relying solely on a single damage identification indicator can lead to misjudgment. By using two indicators for mutual verification, the credibility of the identification can be improved. Therefore, the displacement mode difference, which has a weaker recognition effect, is further developed. The wavelet coefficient difference of the displacement mode difference is constructed through wavelet transform and used as the damage fingerprint, along with the curvature mode difference, for verification of damage identification.
By extracting the displacement mode and applying the wavelet transform, the damage identification index under the modal system is obtained in the form of the displacement mode wavelet coefficient difference.
As shown in Fig. 11, the identification results are clear and distinct. Waveform mutations occur at the damage location in each identification diagram. Regardless of single or two damages, the identification effect is qualitatively improved compared to the displacement mode difference. The displacement mode wavelet coefficient difference can be cross checked with the curvature mode difference identification results, improving identification accuracy and efficiency.
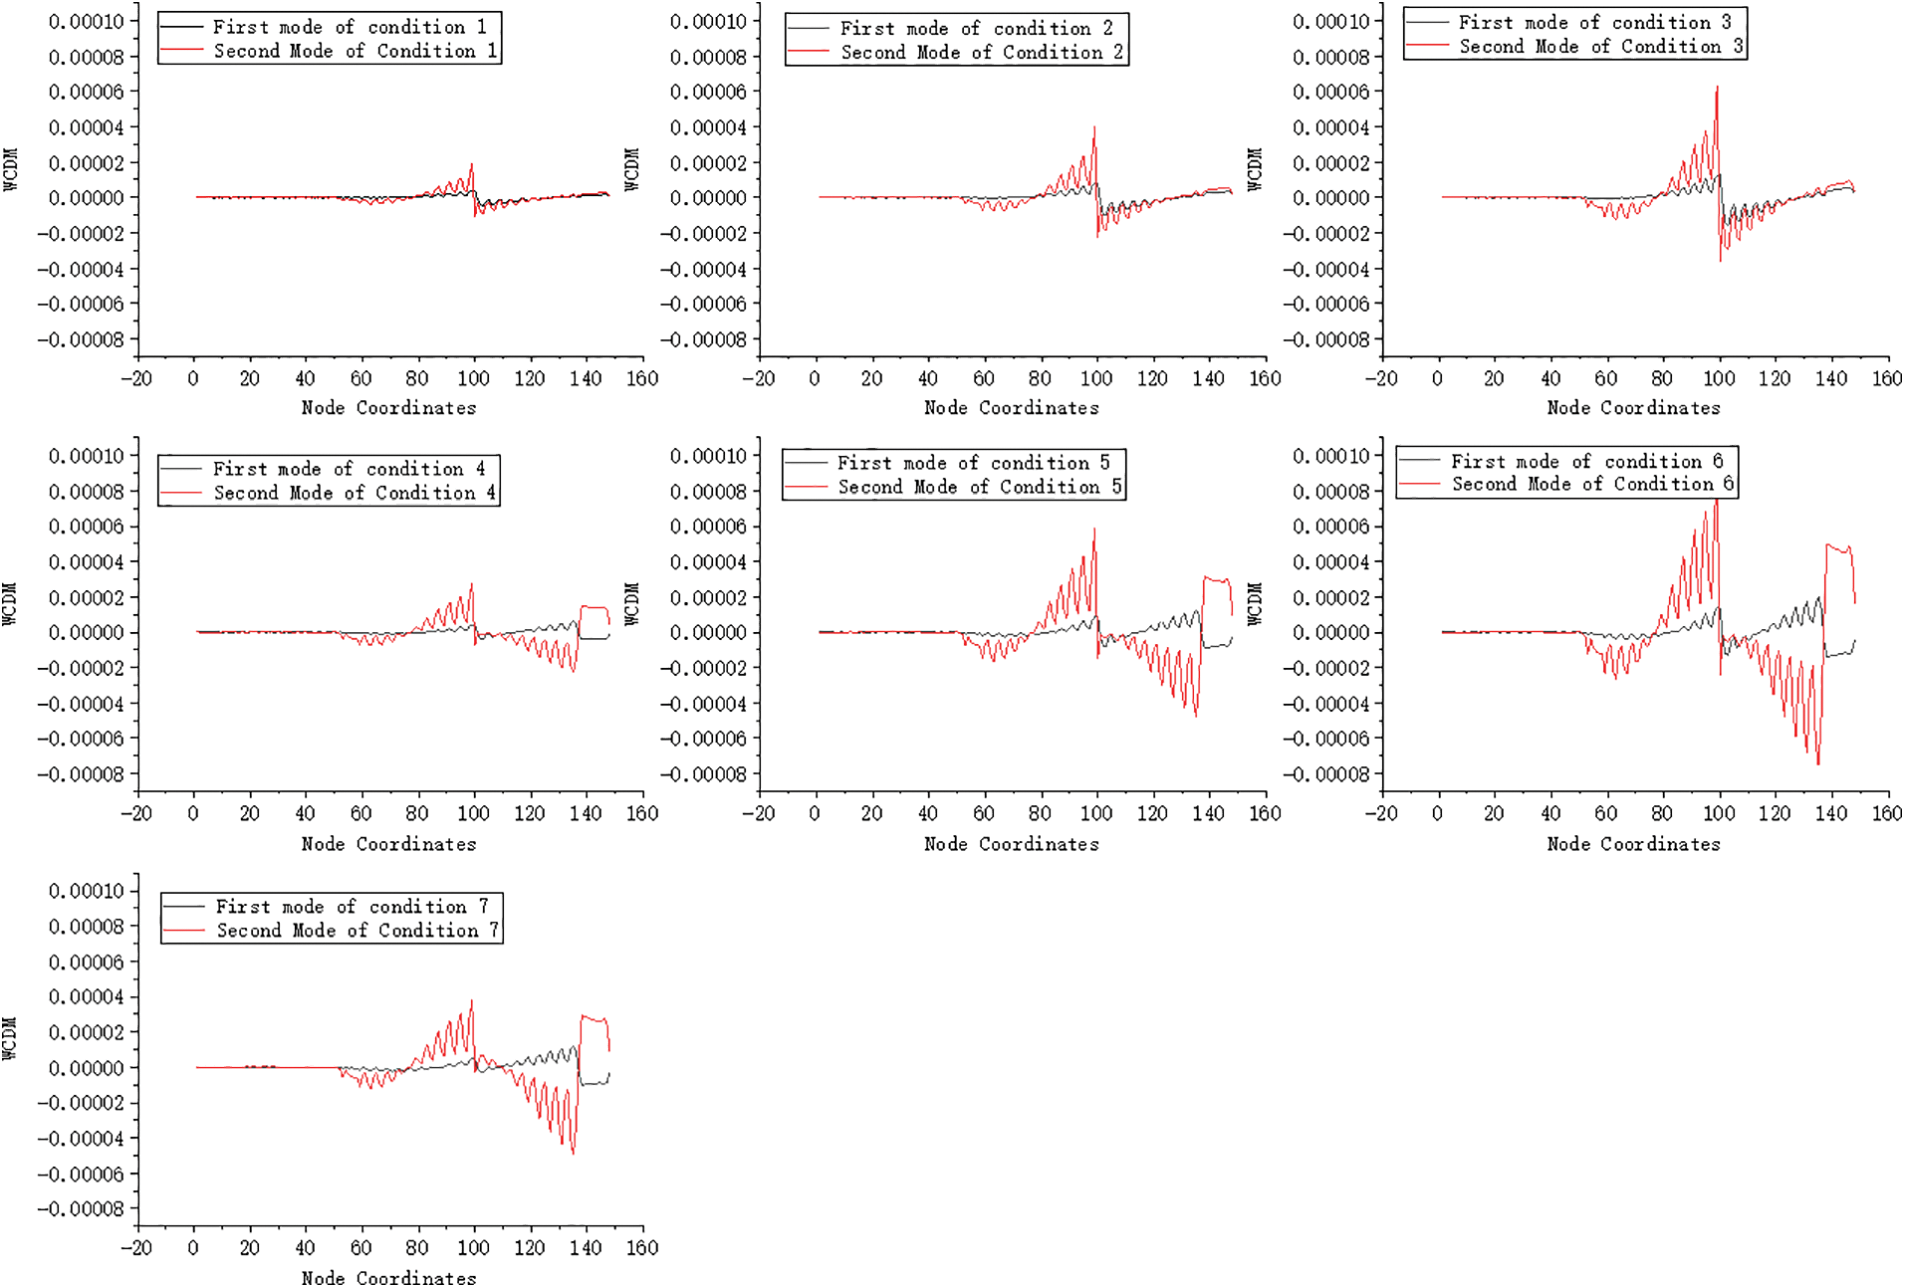
Figure 11: Wavelet coefficient difference of displacement mode
4.3 Research on Damage Degree Based on Modal Fingerprinting
By analyzing the damage identification results and extracting the recognition results of curvature mode fingerprints, the degree of damage can be analyzed. When a single damage occurs to the bridge, we extract the curvature mode differences of three operating conditions: operating condition 1, operating condition 2, and operating condition 3 for fitting.
Fig. 12 shows a three-dimensional surface graph of the curvature pattern under a single damage condition. It can reflect the changes in extreme points under different working conditions.
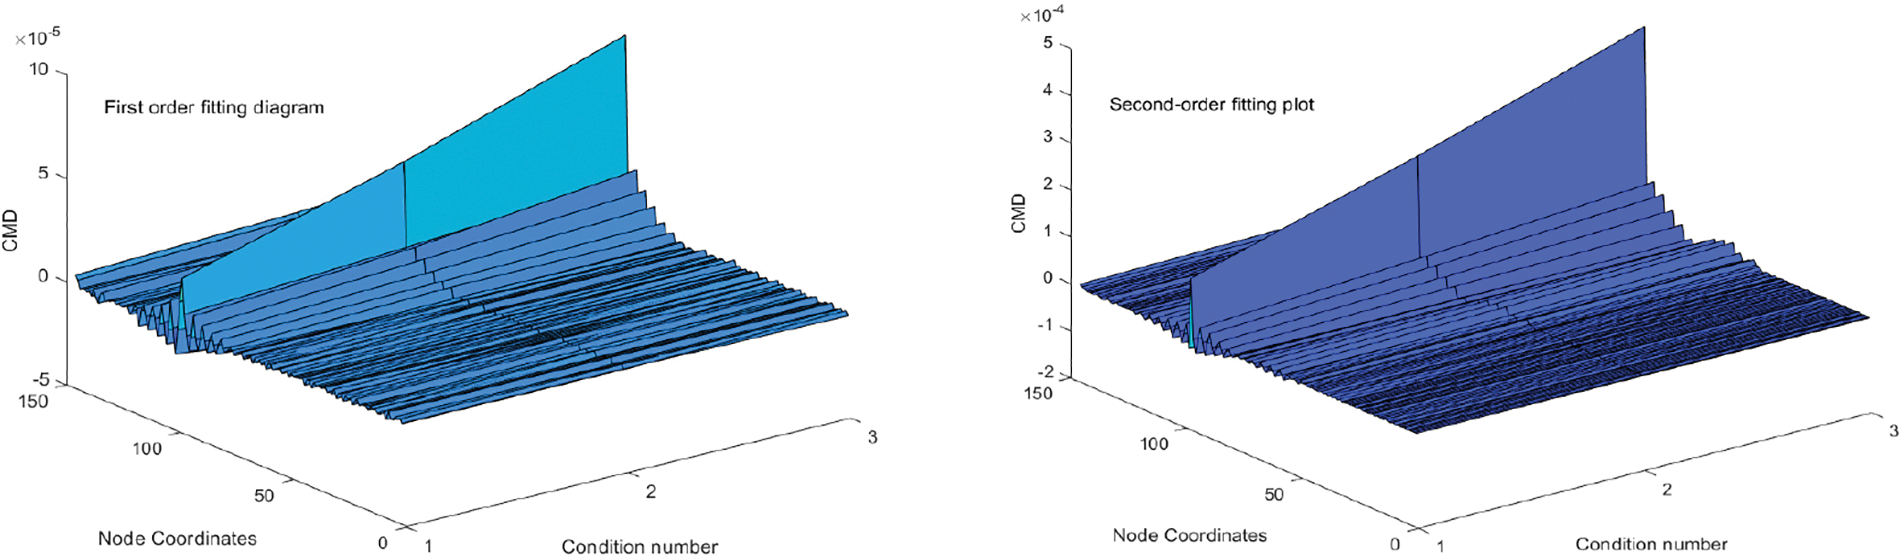
Figure 12: Single damage degree fitting diagram
From Fig. 12, it can be seen that as the degree of damage increases, the peak value of Unit 99 continues to increase. The damage peaks of condition 1, condition 2, and condition 3 are extracted for fitting.
In the formula, x represents the coordinates of different peak extreme points. y is the value corresponding to the degree of damage.
In the formula, x1 represents the coordinates of the first peak extreme point, and x2 represents the coordinates of the second peak extreme point; The value corresponding to the degree of damage at the first peak of position y1, and the value corresponding to the degree of damage at the second peak of position y2.
When there are multiple damage points in the structure, the peak value of the damage index is calculated and a fitting formula is used to evaluate the degree of damage to the structure. As shown in Fig. 13.
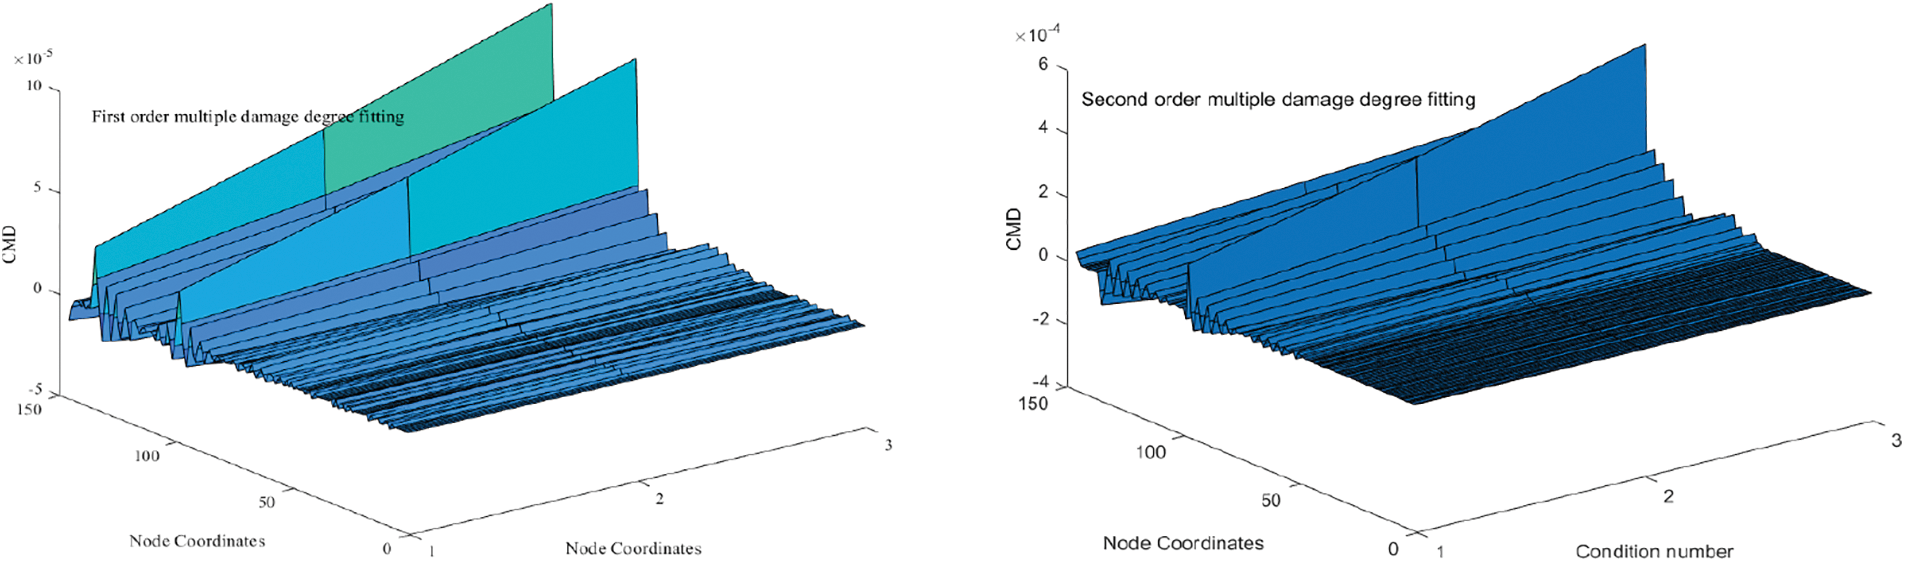
Figure 13: Multiple damage degree fitting diagram
4.4 Research on Data Fusion Based on Modal Fingerprinting
In many testing environments, due to limitations in on-site conditions, only a single fingerprint can be collected. When only modal data is available, the curvature mode and displacement mode wavelet coefficient differences can be constructed using the method mentioned earlier. We will integrate these two indicators according to the D-S evidence theory mentioned earlier, and analyze and study the single damage fusion condition from condition 1 to condition 3 in Section 3.2, and the multiple damage fusion condition from condition 4 to condition 6 in Section 3.2. Considering that a single damage condition is relatively easy to identify, the curvature mode and displacement mode are directly fused for data fusion, while the wavelet coefficients of the curvature mode and displacement mode are fused for two damage conditions.
Considering the on-site analysis from the perspectives of excitation components, excitation energy, and damping energy consumption, the structural vibration is always dominated by low order vibration. So we are considering using first-order data for analysis.
Analyze the data fusion results according to Fig. 14, we can find that the identification results can clearly identify the location of the damage. Whether it is a single damage or two damages, the waveform of the undamaged area has almost no fluctuation compared to a single fingerprint recognition image and tends to 0. Compared with the single index curvature mode identification results in Section 3.2, there is a great improvement, and there is basically no damage misjudgment.
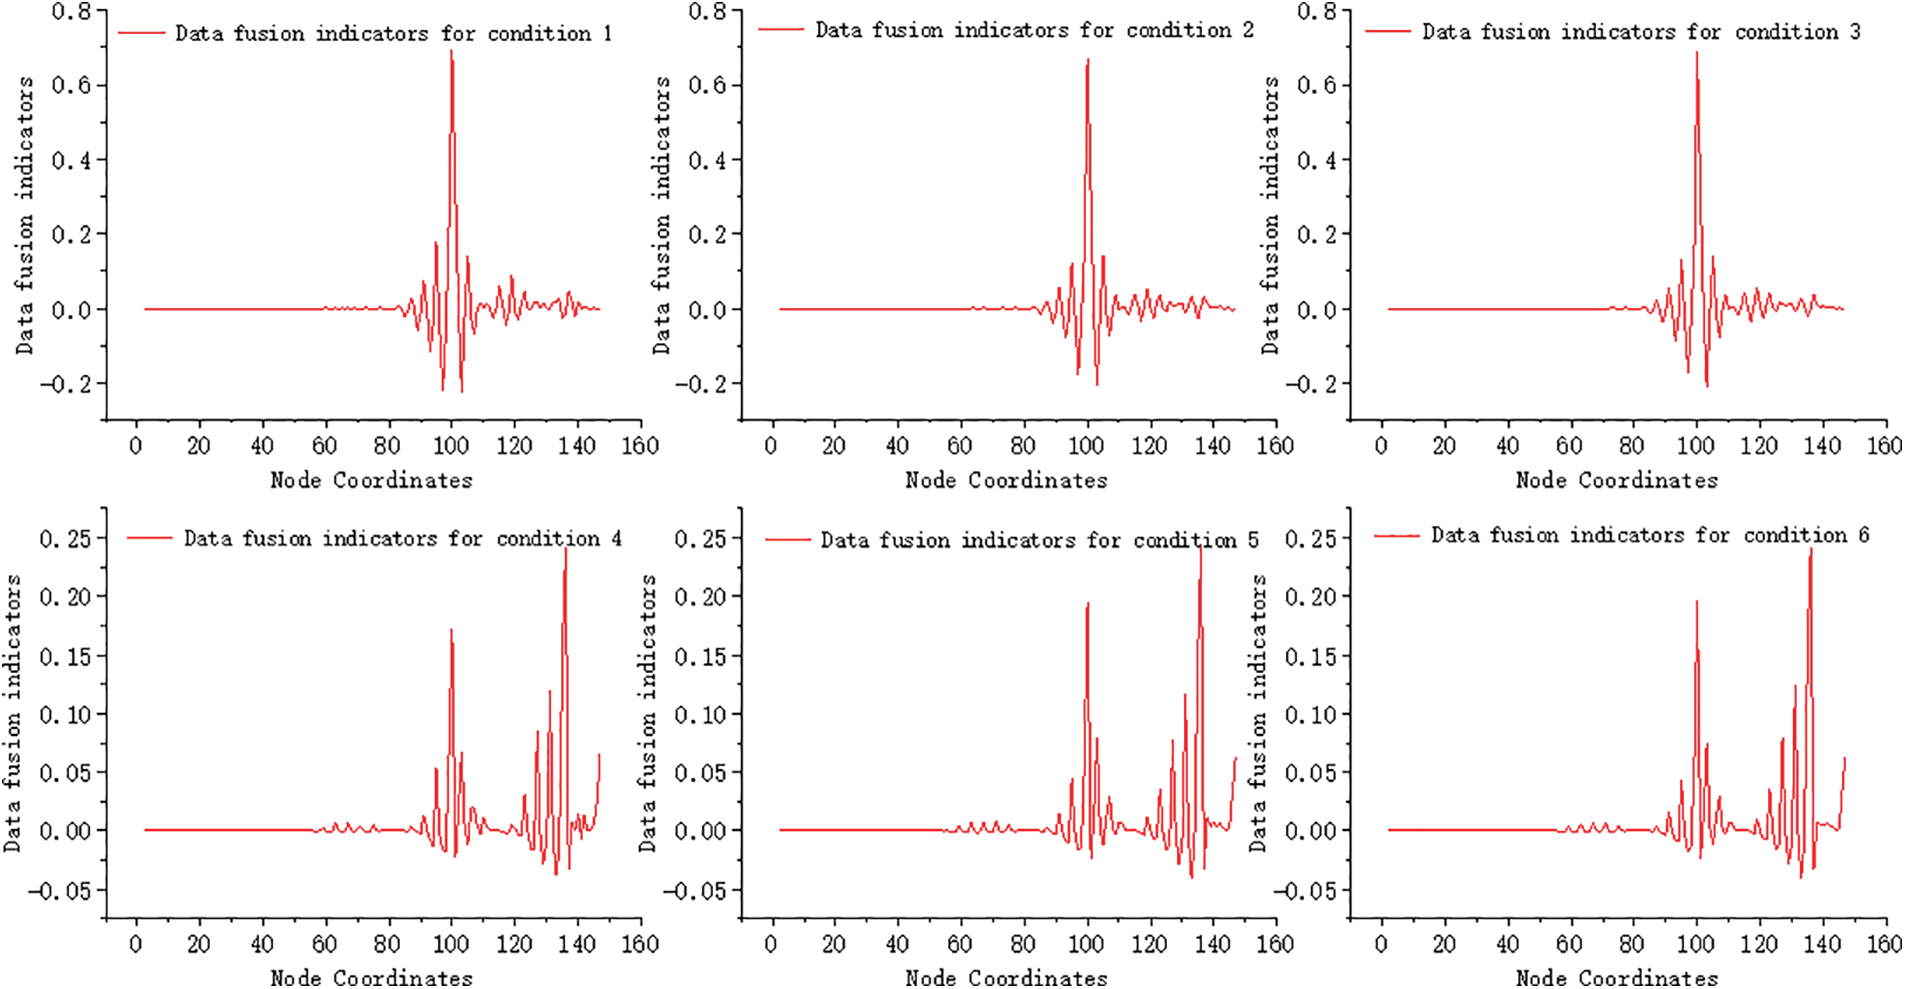
Figure 14: Modal based multivariate data fusion
In order to evaluate the impact of fusion methods on damage identification, the secondary peak of the identification result is defined as the peak near the damaged unit, while the peak of the identification result at the damaged unit is termed as the damage index. The ratio of the sub-peak to peak is denoted as the ‘sub-peak to peak ratio’. A smaller sub-peak to peak ratio indicates a lower damage index around the damaged unit. A more pronounced damage index at the damaged unit reduces the likelihood of misjudgment of damage. Table 3 presents the sub-peak to peak ratio of the curvature pattern before fusion and the fusion index after fusion.
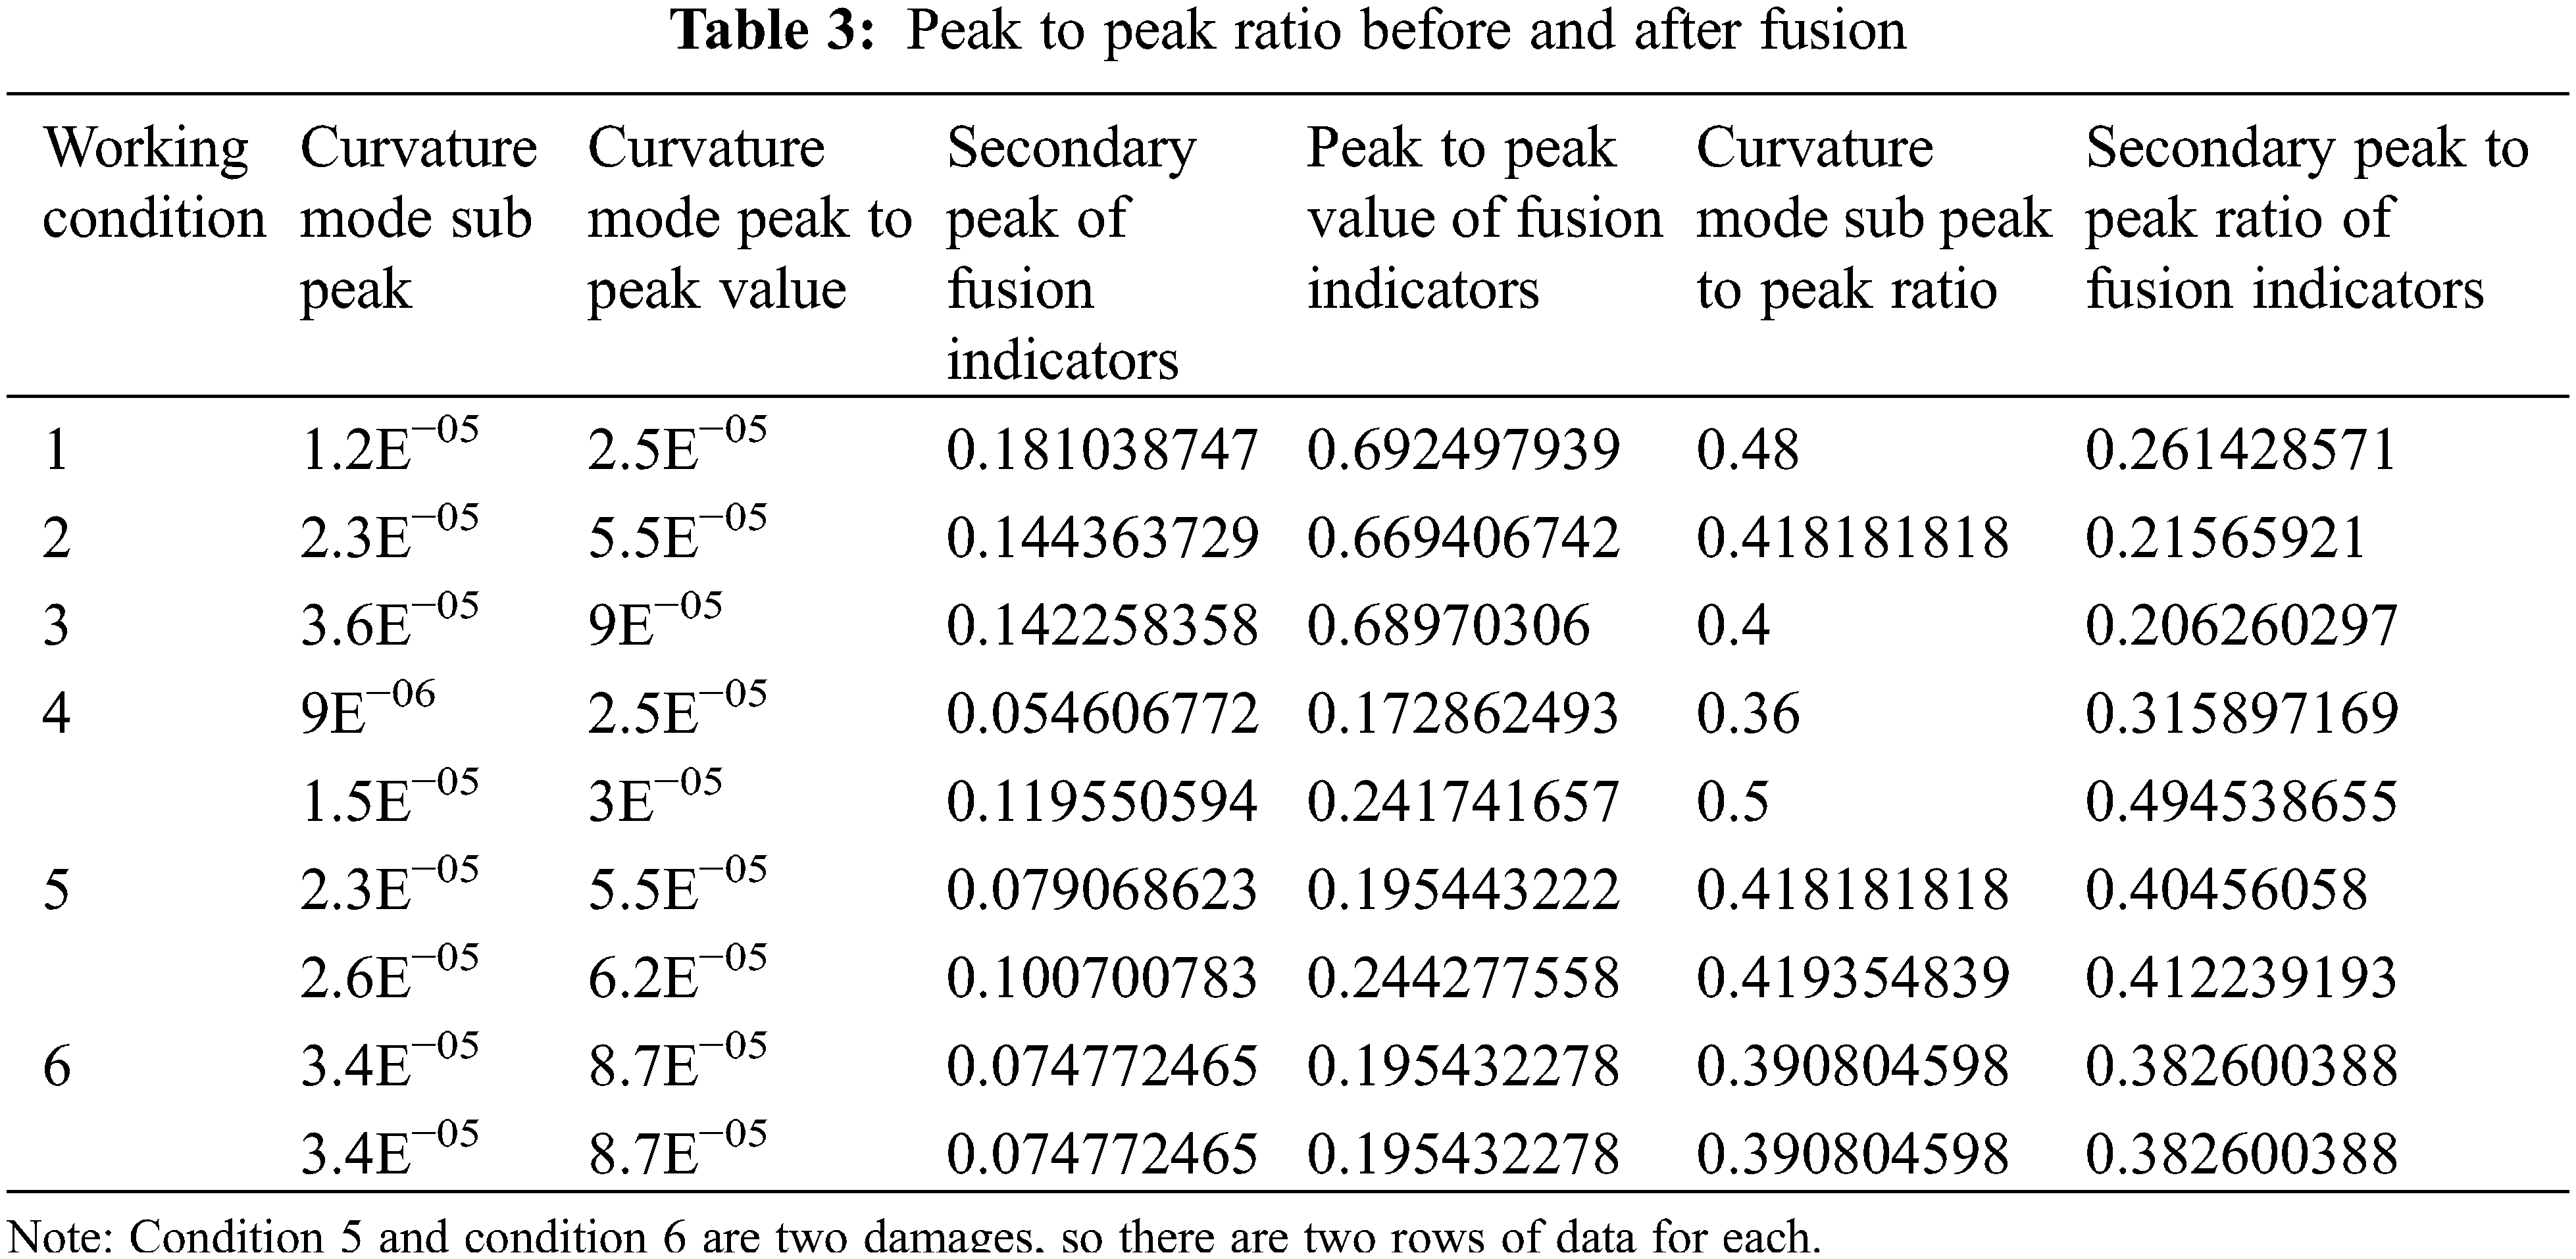
By analyzing the sub peak to peak ratio before and after fusion, it is evident that the sub peak to peak ratio calculated using the fusion index as the identification index is lower than the ratio calculated using the curvature mode as the damage index. The decrease in damage at individual sites is more pronounced, ranging from 12% to 48%, with two injuries showing a reduction of approximately 2%. This highlights the superiority of fusion indicators, which is not only visually apparent from the recognition chart but also quantitatively supported. The sub peak to peak ratio further indicates that the fusion index outperforms a single index in the recognition process.
This article proposes a damage identification method for cable-stayed bridges based on modal data fusion. The method uses D-S evidence theory to fuse the curvature mode difference and displacement mode wavelet coefficient difference as the final damage indicators, in order to effectively identify single and two damages of cable-stayed bridges. And the effectiveness of the method was verified through finite element numerical examples, and the following conclusions were obtained:
(1) Data fusion can effectively improve the effectiveness of damage identification, avoid misjudgment of damage when using a single damage indicator identification, and improve the accuracy of damage identification.
(2) In modal-based damage identification methods, both basic damage indicators constructed can identify damage. In terms of recognition performance, the curvature mode difference is better than the displacement mode difference. The new indicator of displacement mode wavelet coefficient difference constructed by combining displacement mode difference with wavelet transform has better recognition performance and can be cross-checked with the results of curvature mode difference recognition. The damage indicators constructed using second-order modes are generally more sensitive than those constructed using first-order modes. Based on the peak points of the identification results, fitting can ultimately evaluate the degree of damage.
(3) By fitting the damage indicators using the method described in this article, the degree of damage can be evaluated.
(4) This method is validated using finite element examples of cable-stayed bridges, and further research and verification are needed for actual bridges.
Acknowledgement: None.
Funding Statement: The authors disclosed receipt of the following financial support for the research, authorship, and/or publication of this article: This work was supported by National Key R&D Program of China (2018YFC0809606 and 2018YFC0809600). Shenyang Science and Technology Plan Project Fund (23-407-3-19).
Author Contributions: The authors confirm contribution to the paper as follows: study conception and design: Yue Cao and Longsheng Bao; data collection: Xiaowei Zhang; analysis and interpretation of results: Yue Cao, Xiaowei Zhang and Bingqian Li; draft manuscript preparation: Yue Cao and Zhanfei Wang. All authors reviewed the results and approved the final version of the manuscript.
Availability of Data and Materials: The data used to support the findings of this study are included within the article.
Conflicts of Interest: The authors declare that they have no conflicts of interest to report regarding the present study.
References
1. Song, C., Xiao, R., Sun, B., Wang, Z., Zhang, C. (2023). Cable force optimization of cable-stayed bridges: A surrogate model-assisted differential evolution method combined with b-spline interpolation curves. Engineering Structures, 283(15), 115856. [Google Scholar]
2. Zhang, L., Obrien, E. J., Hajializadeh, D., Deng, L., Yin, S. (2023). Bridge damage identification using rotation measurement. Journal of Bridge Engineering, 28(5). [Google Scholar]
3. Gai, T., Yu, D., Zeng, S., Lin, C. W. (2023). An optimization neural network model for bridge cable force identification. Engineering Structures, 286, 116056. [Google Scholar]
4. Alamdari, M. M., Samali, B., Li, J., Kalhori, H., Mustapha, S. (2016). Spectral-based damage identification in structures under ambient vibration. Journal of Computing in Civil Engineering, 30(4), 04015062. [Google Scholar]
5. Tian, Y. D., Zhang, J. (2022). Recent advancements in mobile impact vibration-based bridge rapidtesting and flexibility identification. Journal of Civil Engineering, 55(10), 46–61 (In Chinese). [Google Scholar]
6. Shu, X. Y., Li, X. F., Wang, C. Y. (2023). Research on multi-damage identification of continuous beam bridge with constant cross-section based on vehicle-bridge coupling vibration. Journal of Hefei University of Technology, 46(1), 81–87+103 (In Chinese). [Google Scholar]
7. Li, H. M., Dong, M. M., Xiong, D. (2021). State-of-the-art review of vibration-based damage identificationframework for structures. Building Structures, 51(4), 45–50+38 (In Chinese). [Google Scholar]
8. Luo, J., Huang, M., Xiang, C., Lei, Y. (2023). A novel method for damage identification based on tuning-free strategy and simple population metropolis-hastings algorithm. International Journal of Structural Stability and Dynamics, 23(4), 2350043. [Google Scholar]
9. Zhou, X. T., Ni, Y. Q., Zhang, F. L. (2014). Damage localization of cable-supported bridges using modal frequency data and probabilistic neural network. Mathematical Problems in Engineering, 37(3), 558–563. [Google Scholar]
10. Wang, H., Smith, A., Barone, G. (2023). A novel multi-level data fusion and anomaly detection approach for infrastructure damage identification and localisation. Engineering Structures, 292, 116473. [Google Scholar]
11. Sun, D., Li, Y., Jia, S., Feng, K., Liu, Z. (2023). Non-contact diagnosis for gearbox based on the fusion of multi-sensor heterogeneous data. Information Fusion, 94, 112–125. [Google Scholar]
12. Zheng, W., Yu, Y. (2013). Bayesian probabilistic framework for damage identification of steel truss bridges under joint uncertainties. Advances in Civil Engineering, 2013, 89–101. [Google Scholar]
13. Cordeiro, C. E. Z., Stutz, L. T., Knupp, D. C., Mattc, C. F. T. (2022). Generalized integral transform and hamiltonian monte carlo for bayesian structural damage identification. Applied Mathematical Modelling, 104, 243–258. [Google Scholar]
14. Emanuel, S. T., Mário, P., Figueiras, J. (2019). Online early damage detection and localisation using multivariate data analysis: Application to a cable-stayed bridge. Structural Control and Health Monitoring, 26(11), e2434. [Google Scholar]
15. Liu, X. J., Xiang, L., Zhang, S. X. (2021). Damage identification of simply supported beam bridges based on wavelet analysis. Journal of Vibration, Measurement & Diagnosis, 236–237, 617. [Google Scholar]
16. Li, X. Y., Liu, L. C. (2021). Adoption of vibration response covariance and data fusion for damageidentification. Journal of Vibration Engineering, 34(1), 141–149 (In Chinese). [Google Scholar]
17. Poudel, U. P., Fu, G., Ye, J. (2007). Wavelet transformation of mode shape difference function for structural damage location identification. Earthquake Engineering & Structural Dynamics, 36(8), 1089–1107. [Google Scholar]
18. Min, Z., Sun, L. M. (2013). Wavelet-based structural modal parameter identification. Structural Control & Health Monitoring, 20(2), 1–18. [Google Scholar]
19. Peng, X. L., Hao, H., Li, Z. X. (2012). Application of wavelet packet transform in subsea pipeline bedding condition assessment. Engineering Structures, 38(9), 50–65. [Google Scholar]
20. Saadatmorad, M., Jafari-Talookolaei, R. A., Pashaei, M. H., Khatir, S., Wahab, M. A. (2022). A robust technique for damage identification of marine fiberglass rectangular composite plates using 2-D discrete wavelet transform and radial basis function networks. Ocean Engineering, 263, 747–759. [Google Scholar]
Cite This Article
 Copyright © 2024 The Author(s). Published by Tech Science Press.
This work is licensed under a Creative Commons Attribution 4.0 International License , which permits unrestricted use, distribution, and reproduction in any medium, provided the original work is properly cited.
 Downloads
 Citation Tools