
 Submit a Paper
 Propose a Special lssue
 Open Access
ARTICLE

An Innovative Technique to Measure Lateral Pressure of Self-Compacting Concrete Using Fiber Bragg Grating Sensor
1 Institute of Construction Materials, Sydney, Australia
2 Technical College of Engineering, Sulaimani Polytechnic University, Sulaymaniyah, Iraq
3 School of Civil and Environmental Engineering, University of Technology Sydney, Sydney, Australia
4 National Materials Technology Manager at Holcim Australia Pty Ltd., Sydney, Australia
* Corresponding Author: Pshtiwan Shakor. Email:
Structural Durability & Health Monitoring 2024, 18(4), 395-408. https://doi.org/10.32604/sdhm.2024.049366
Received 04 January 2024; Accepted 28 March 2024; Issue published 05 June 2024
 View Full Text
 Download PDF
Abstract
Self-compacting concrete (SCC) is the most flowable concrete type that exerts high pressure on formwork. SCC is the most commonly used concrete globally for construction applications due to its cost-effectiveness. However, to make a formwork resist the exerted lateral pressure of SCC, it is required to have a suitable design for formwork. This paper presents a novel approach on how could create and prepare the Fiber Bragg Grating (FBG) optics using as a sensor to measure lateral pressure and temperature of SCC. To ensure the FBG sensor works properly a validated methodology is conducted. In the first stage, FBG sensors are calibrated with temperature sensitivity and then are calibrated with water pressure. The latter calibration is used to verify lateral pressure with SCC. However, this is not the only sensor used to record the result, a genuine sensor such as a transducer sensor has been positioned close to the FBG sensor to validate the results of the FBG sensor. The created FBG sensor demonstrates highly promising results, effectively validating the outcomes of the transducer sensor, while also reducing costs and enhancing usability for construction applications.Graphic Abstract
Keywords
Graphical Abstract
Having different types of concrete makes it easy for the construction industry to produce and implement various projects with a specific type of concrete for certain applications [1,2]. Self-compacting concrete (SCC) is the most flowable concrete in the construction industry [3]. SCC could be used highly for congested reinforcement members due to the flowability of the materials and the high performance [4].
Distinguishing between SCC and other types of concrete is the physical properties of the materials such as extremely workable, self-flows, and easily spread through the steel reinforcement [5]. Under the influence of its weight, and expels trapped air without resorting to external or internal means of compaction [6]. This feature led to overcoming the problems of pouring concrete on the site without the need for compaction and vibration to provide a homogeneous concrete mix. This study focused on the problems associated with the SCC exerted lateral pressure while casting large mass into the formwork. Regarding the SCC, there are different types of SCCs provided by different companies with the availability of materials and a mix of production. These types of SCCs depend on the placement of pouring concrete; therefore, the slump rate of each SCC would be mostly different [7]. Consequently, likely, the lateral pressure changed dramatically from one batch to another.
The lateral pressure could affect the formwork and geometry of the structure if properly not poured concrete while casting. This may cause an increase in the cost of formwork design and manufacturing. The exerted pressure from concrete and the thixotropy of the concrete materials with direct contact with the formwork could cause damage or break the formwork panels. Arslan et al. [8] dictated that the conventional concrete in the first meter behaves similarly such as hydrostatic pressure, however; with the increase in height, the internal resistance of the materials increases. This can be shown by how the concrete materials behaved as fresh concrete and may change the rate of shear behaviours according to the mix proportion and stressing distributions of the vibrators.
Earlier studies discussed lateral pressure such as a detailed state-of-the-art by Khayat et al. [4]. They collected the theoretical equation of lateral pressure of SCC on the formwork discussing different standards and guidelines. They stated that the detailed properties of SCC, labour and waste reduction, reducing the placing and finishing time, and removing hazardous noise and vibration. However, they mentioned that the lateral pressure of the SCC can exert high lateral pressure may be as high as the hydrostatic pressure. This is counted as a disadvantage of the SCC that required a robust formwork to be designed and well erected before pouring SCC [7].
Lateral pressure on formwork exists as long as the concrete is in a fresh state condition and the most two significant factors that affect the lateral pressure exerted on formwork are the thixotropy level and casting rate of the SCC. The higher thixotropic materials caused a sudden decrease in the lateral pressure [9]. It is important to mention that the lower yield stress and plastic viscosity of the concrete are considered high flowability and superior exerted pressure. On the other hand, a faster rate of hardening fetches a faster rate of decay of the lateral pressure. Concrete materials have a rheological behavior known as a Bingham fluid model which is different from the Newtonian fluid model such as water. The Bingham model is usually known as the following Eq. (1) below:
where
The above equation has been developed by earlier studies by Roussel et al. [10], the yield stress
The casting (placement) rate is one of the crucial parameters in measuring the lateral pressure of SCC. The higher rate of casting resulted in higher lateral pressure. On the contrary, if placement rates are reduced most probably reduces the pressure, this is also observed in the current study.
However, Brameshuber et al. [11] studied that placing concrete from the bottom of the form exhibits higher pressures than the concrete placed from the top. These effects happen to a great extent related to the shearing forces to which the plastic concrete is subjected during placement. They were being a greater one, while the concrete is pumped into the forms from the bottom to up.
An earlier study by Ren et al. [12] used the fiber Bragg grating sensor in the foundation pit to measure from three directions of the pit; however, this test was used to determine the sensitivity value of the FBG sensor rather than show how the sensor is being made in the laboratory and how can be verified with other sensors. Nevertheless, the study by Júnnyor et al. [13] predicted the soil stress under the one-directional of the agricultural machine, the results showed that the risks decreased at 0.5 m below the pressure-affected area. The risk of the operation does not only come from the vertical direction but also horizontally available as well. It also showed the soil type, and management of the cultivation system except the tyre pressure and type of the track have major factors on the stress distribution in the purpose of the reading the pressure.
There is a limited study relating to the effects of formwork dimensions regarding formwork pressure. One of the studies by Khayat et al. [14] showed that smaller cross-sections resulted in lower maximum pressure. It was explained that this occurred due to an arching activity that caused to constrain the exceeded of the lateral pressure. Having reinforcement theoretically assists in slowing down the pressure on the formwork because it can cause it to hold part of the concrete lateral forces, although this might be most time negligible. Another investigation also revealed that the type of formwork made of different types of materials affected formwork pressure [15]. Precisely, a rigid and smooth surface of formwork might result in higher lateral pressure and delay in the rate of pressure drop after casting time.
The surface roughness of the forms plays a major role in pressure due to the dynamic friction that occurs during concrete casting [15]. They have represented that applying demolding agents, such as oil on the formwork surface can cause decreased friction and lead to an increase in lateral pressure.
SCC can be formulated in various ways as a materials mix design. Many papers showed the effect of SCC materials composition on the formwork pressure, which includes the rheological properties and chemical reaction of materials. It is mentioned that the following parameters such as aggregate content and size, w/c ratio, cement type, silica fume, fly ash, slag, ground limestone filler, superplasticizer type, and VMA type highly affect the lateral pressure characteristics [16,17].
Commonly, it is revealed that increasing aggregate content and size caused a rise in a lower initial lateral pressure. On the other hand, rich concrete mixes develop greater pressure than normal and lean mixes. This is attributed to the internal friction of coarse aggregate carrying some of the hydrostatic load with fluidity and admixtures. However, if the content of the fine aggregate increases, the lateral pressure increases on the formwork due to the easy dispersal of materials, lower density of the materials, and quick detachment from coarse aggregates. This paper aims to show how effective are the FBG sensors in real-life applications in terms of accuracy and efficiency. Therefore, making FBG sensors compared with the piezoelectric is discussed in detail in the following sections.
Exerted lateral pressure from SCC on formwork causes a high risk on the construction site if it is not properly handled. Sometimes it causes damage or collapse or might cause a high risk of injury or death of a worker on site. It is developing sensors to discover the lateral pressure using an advanced technique such as fiber optic Bragg grating. The benefit of using such a sensor would be easy to install on-site, cheap, and friendly compared to electrical transducer sensors. In addition, fiber optic does not have any electrical part and does not cause mistaken readings due to an issue in the electrical part; it is dependent on the lightning signal.
FBG or fiber brag grating sensing technique is a technology that depends on the wavelength of light that passes through the core of the fiber. Fiber optics have a diameter of approximately about 8 to 12 µ. The fibers that are made for telecommunication without having any grid or collinear in the fiber are called bare fiber. Therefore, FBG is made in a vertical line pattern to refractive the index changes in the core of the single-mode fiber, forming a refractive index modulation so-called grating. Bragg wavelength can be made due to reflected light from the periodic refraction change according to the following Eq. (3) [18]:
where n is known as an effective index of the refraction and
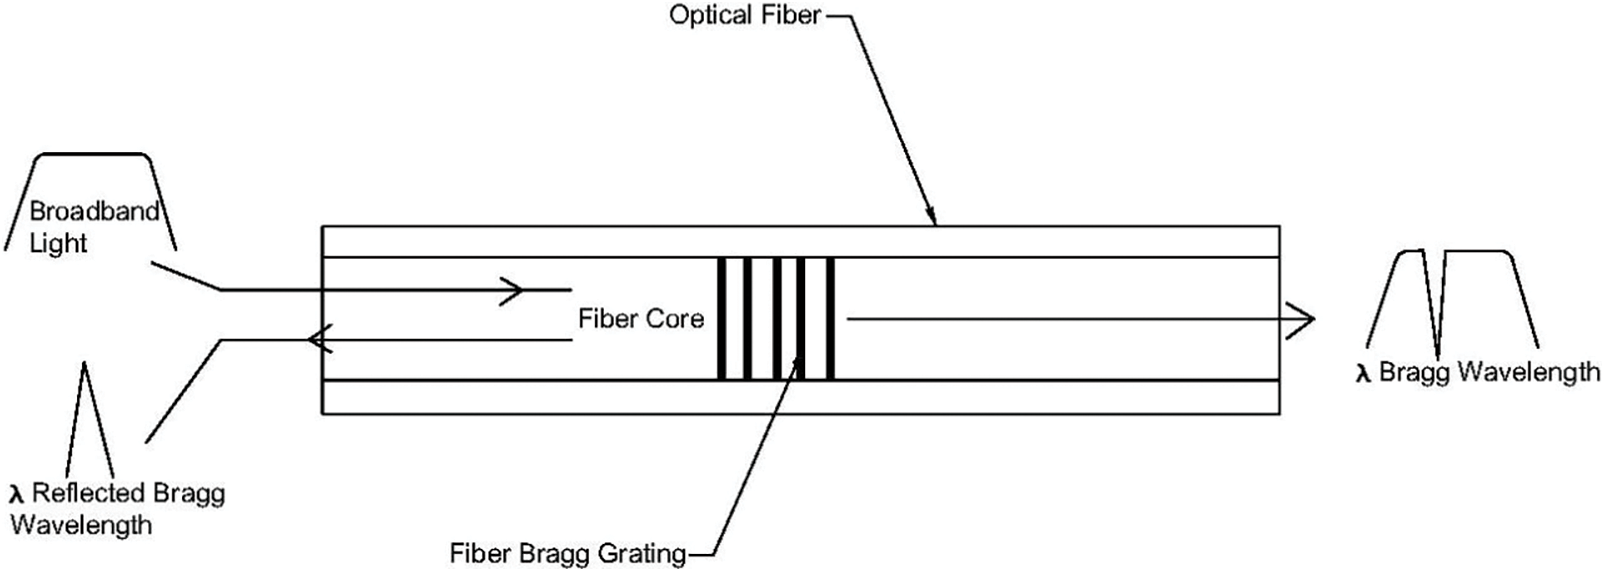
Figure 1: Optical fiber includes the Fiber Bragg grating with details of sending the signal through fiber and how to receive back the signal
There are many types of fibers in terms of resistance and design which are usually made on request. Except that fibers are available in multimode which is used for short distances less than 500 m and single mode which is the most used one in telecom works for long distances greater than 500 m. This is not the only difference but also the core size is another point where the multimode core has a larger diameter between 50 to 100 microns whereas the single mode core diameter is between 8.3 to 10 microns [19,20]. It is usually common that the single-mode fibers operate with the lowest attenuation in the range of 1310 or 1550 nm; however, the multimode operates at 850 or sometimes at 1300 nm [21,22].
Fibers have many names that can be differentiated in terms of the resistance of the bendability. Fibers such as G652D, G657A1/A2/B2, or G657B3 are fibers mostly used in the telecommunication industry; however, the most used optic fiber for communication links of more than 100 km is G652D type. This type also has a limited resistivity in bending compared to G657A1/A2/B2 or G657B3 but can also be used in long distances as shown in Fig. 2 [23]. Differences between G652D and G657A are used to separate them for the double and single jacket of coating.
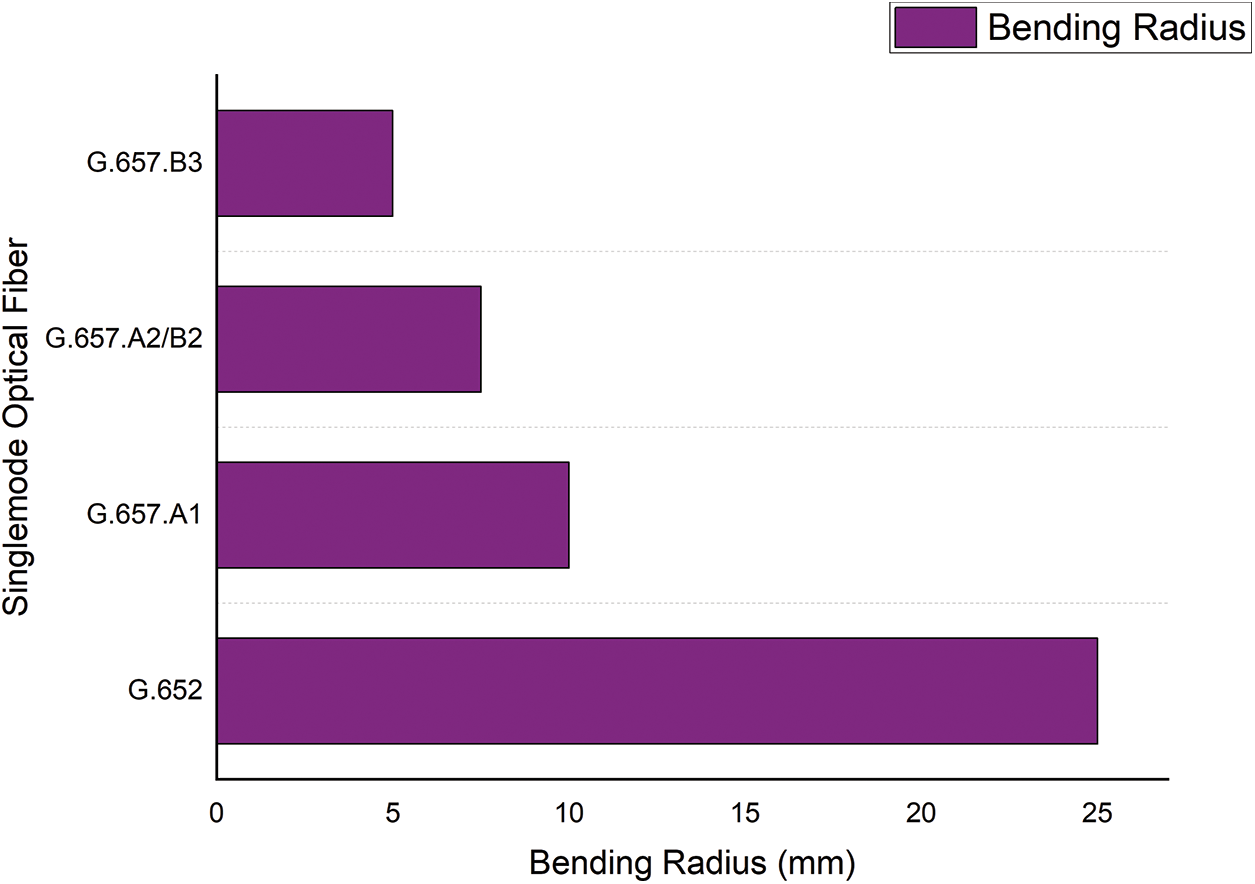
Figure 2: Relation of singlemode optical fiber between (G652 and G657) fibers in terms of bending radius
Therefore, the selection of optical fiber type for such techniques of developing a sensor device, first of all, should be based on the resistance of the bendability of the fiber in the package. Hence, it was important for us to select a type of optic fiber to resist the higher bendability while packaging it in the specific kit. Secondly, the ability of the fiber optics in terms of resistivity of the cable to transmit data over 100 kilometers without requiring loss in signal [24].
Another point, to consider in making an FBG sensor is to fusion splicing with a minimum loss. As it is obvious different diameters in the fiber core may cause a loss in receiving a signal; therefore, it is highly critical to mitigate the loss by using a satisfactory fusion system and a good process of coating on the fibers, as shown in Fig. 3. It is shown that the tiny diameter of the core may not fuse on the exact alignment with the other fiber during the splicing process, so it might cause a loss in db during the fusion process.
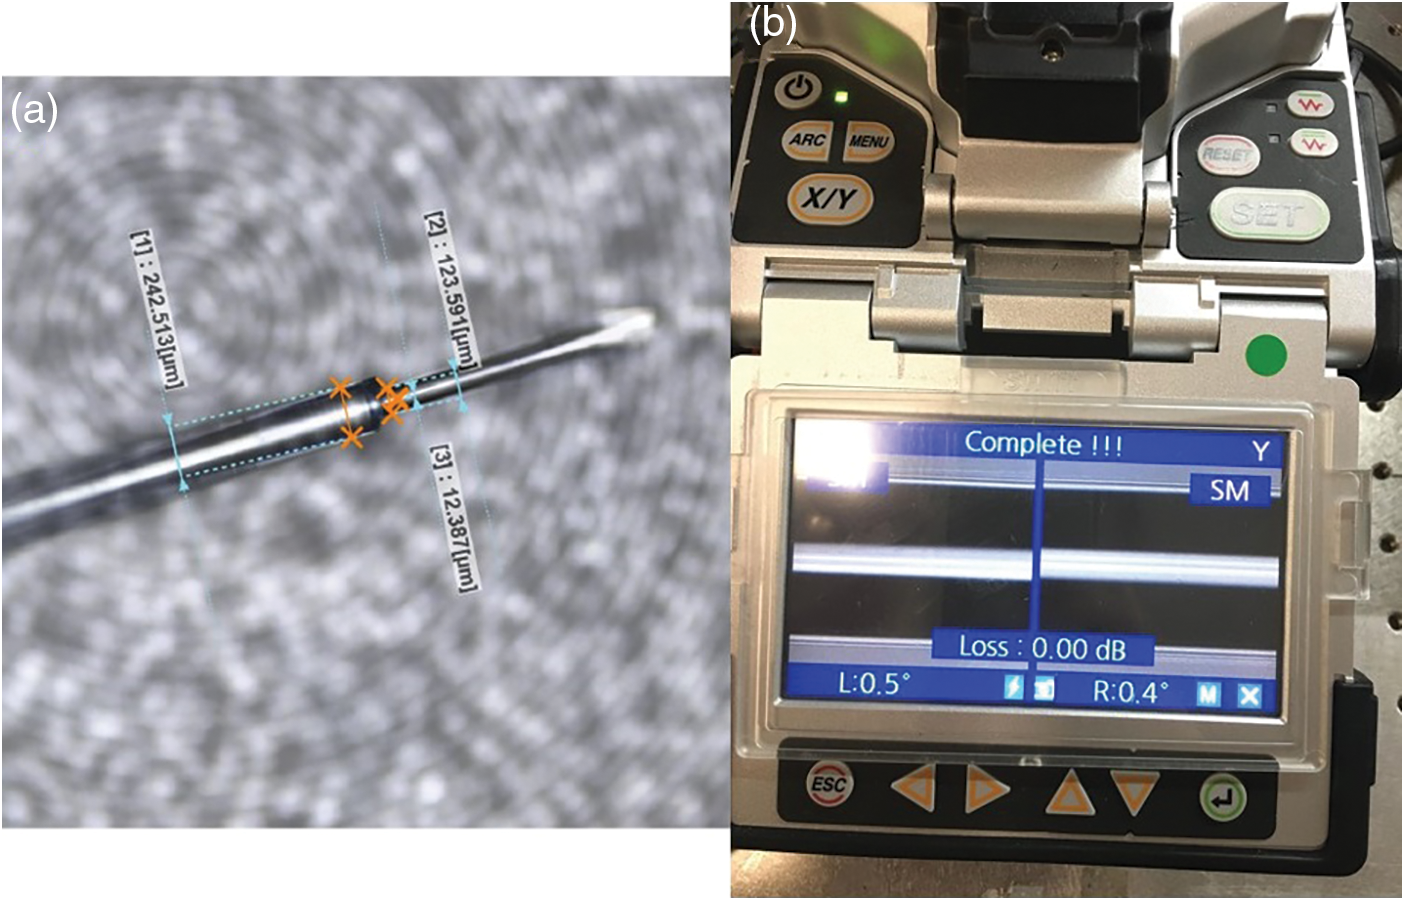
Figure 3: (a) Cladding and core of the fiber under a microscope, (b) Fusion splicing of two cores of the fiber
In fiber technology losing the signal is called attenuation, these kinds of attenuation might be due to intrinsic or extrinsic factors. The loss might happen due to splicing, patch connection, and bending of the fiber optics. Six types of optical fiber losses affect directly signal transmission and reception which come from internal and external factors, absorption loss, dispersion loss, scattering loss from internal factors, and the splicing, connector, and bending loss counted as external factors. Absorption is usually defined as a portion of the attenuation in optical fiber resulting from the conversion of optical power to heat. There are two types of absorption intrinsic and extrinsic, intrinsic absorption is very low compared to other forms of loss. The main cause of intrinsic absorption in the infrared region is the features of vibration frequency of atomic bonds in silica glass absorption is caused by the vibration of silicon-oxygen bonds the interaction between the vibrating bond and the electromagnetic field of the optical signal causes intrinsic absorption light energy is transferred from the electromagnetic to the bond causing attenuation. Extrinsic absorption is much more significant in terms of absorption losses than intrinsic absorption and it is usually caused by impurities introduced into the glass during the manufacturing process such as iron, nickel, and chromium. Nowadays, modern manufacturing techniques significantly reduce the impact of extrinsic absorption.
The experimental program has been planned in three major phases. The first phase is the preparation of the FBG packaging. The second stage, FBG is resistance calibration and temperature compensation. The third phase is to validate the custom-made FBG with the transducer sensor.
The major materials are used to measure the lateral pressure of SCC. It has an industrial name which is called Agilia vertical. The SCC has been supplied by Holcim Australia; therefore, it is a secret mix design for concrete ingredients. Table 1 shows only the basic physical properties of SCC (Agilia Vertical).

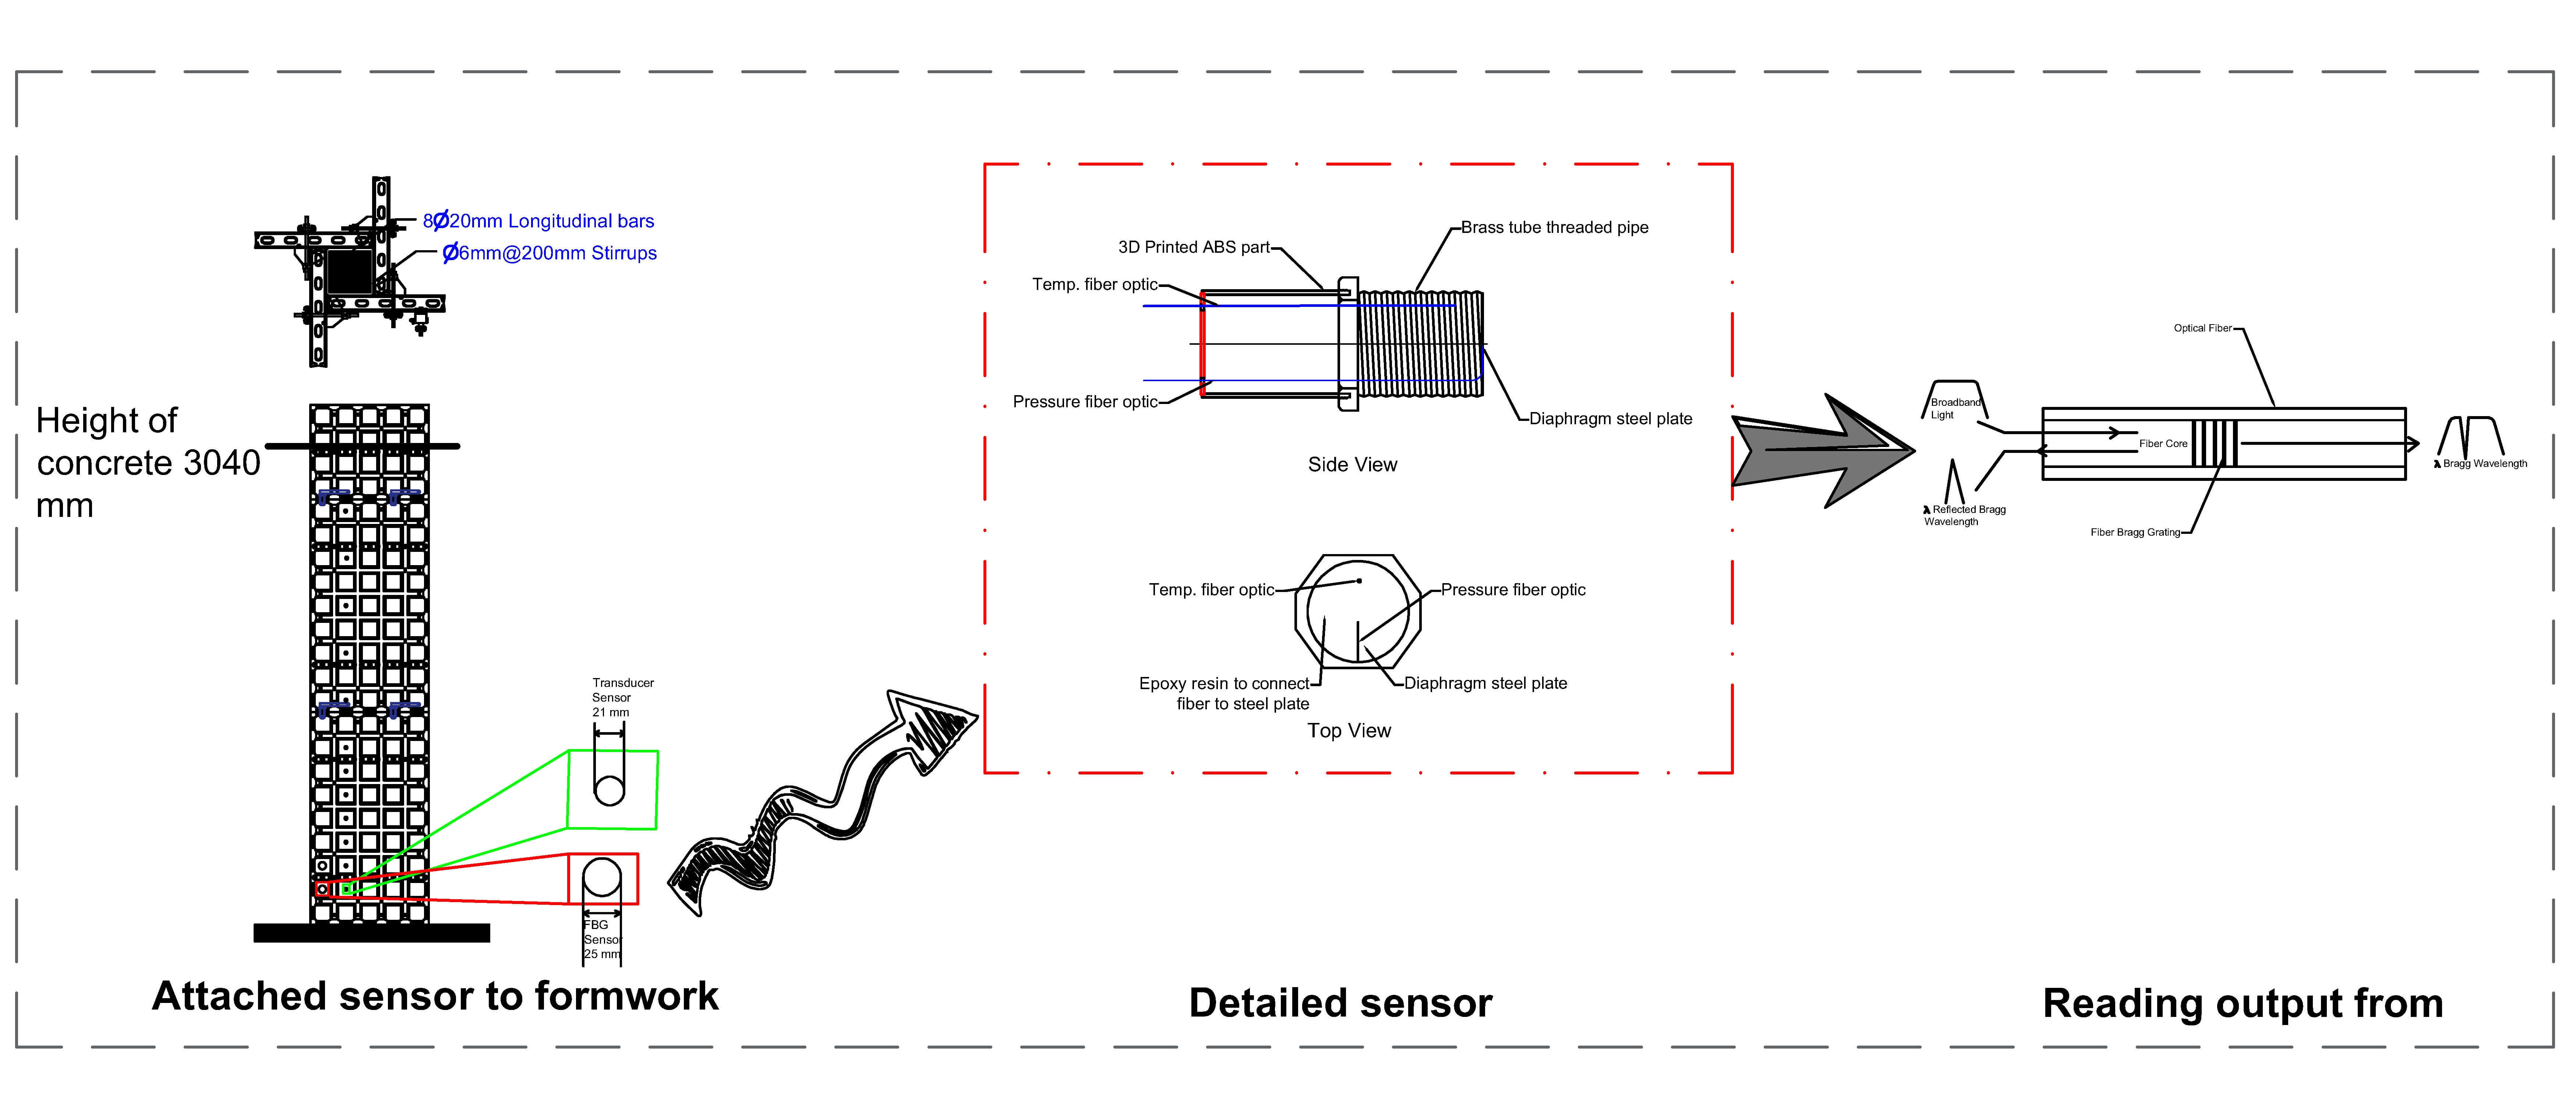
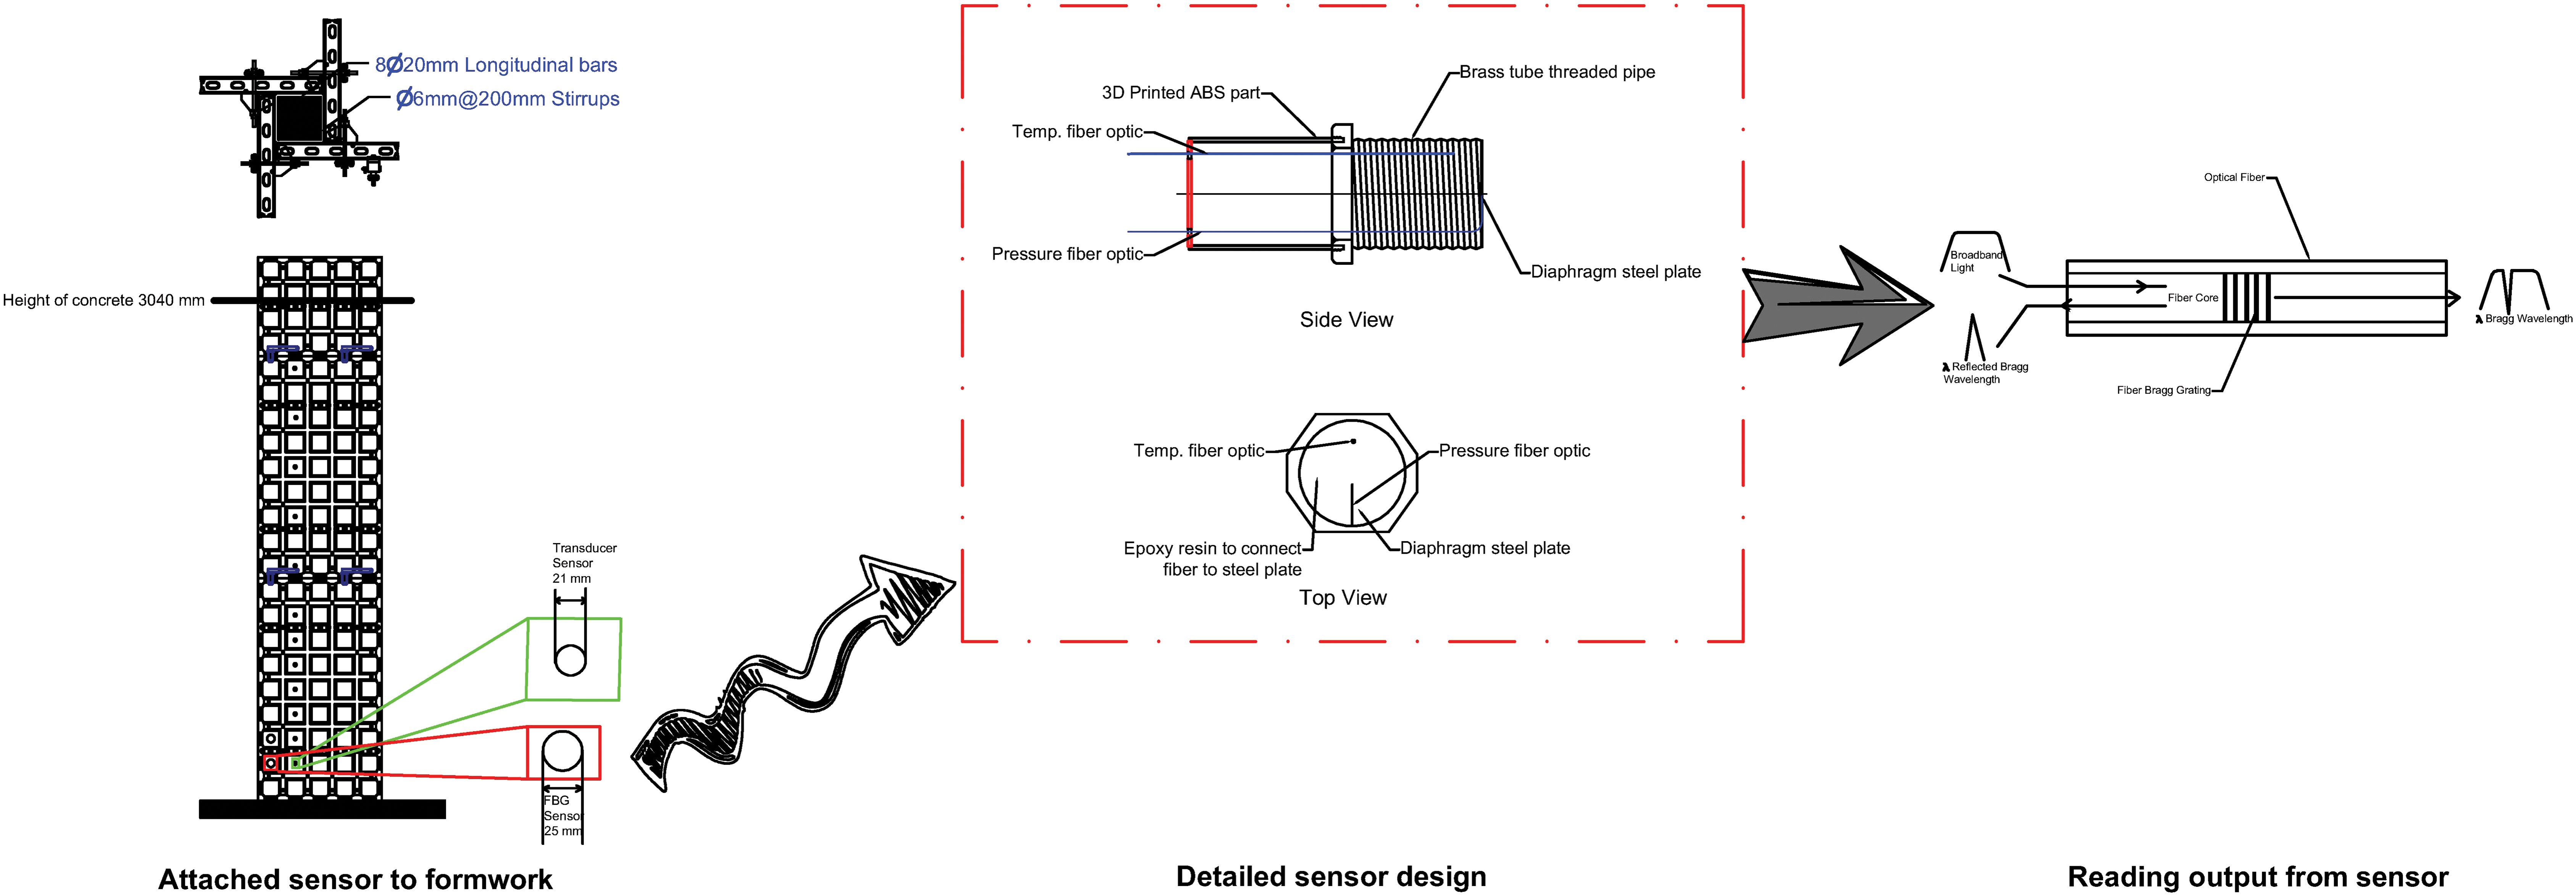
FBG sensors were made at the photonic laboratory at the University of Technology Sydney (UTS-Tech lab). The four FBG sensors were created two of them to measure temperature in each sensor and the other two to record the pressure from external force. The sensor package was made in a threaded pipe tube diameter of 25 mm and the end of the tube was covered with a threaded 3D-printed ABS part. Fig. 4 shows a real-life photo of the custom-made sensor which includes the brass pipe with the end covered by an ABS 3D-printed tube.
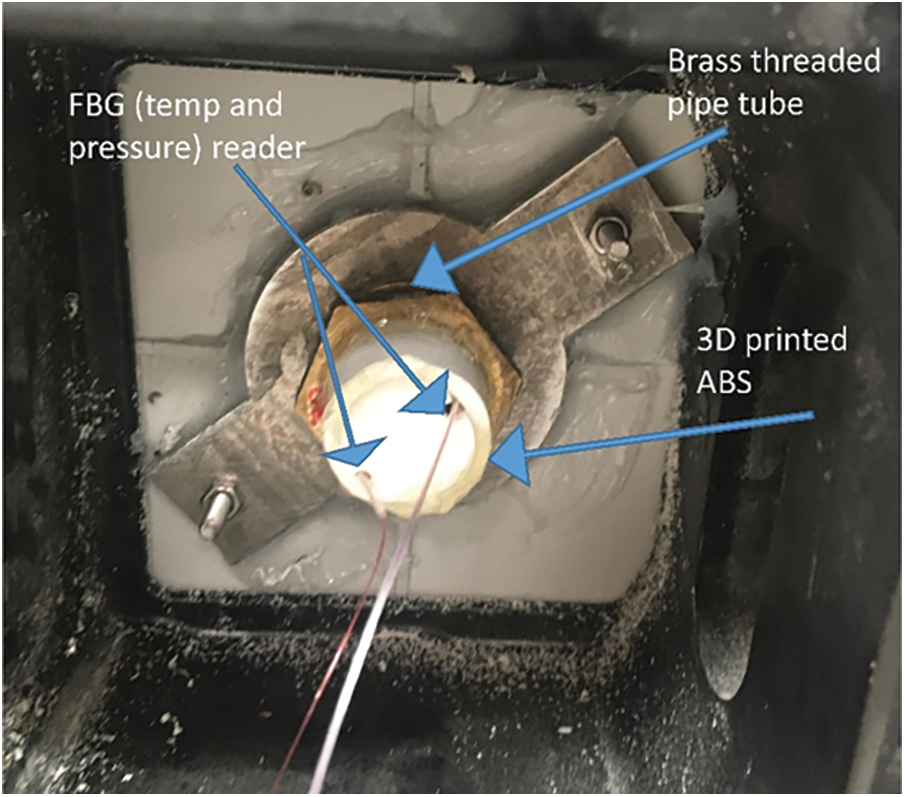
Figure 4: FBG sensor mounted on the formwork panel
Fig. 5 shows the details of the FBG packaging for the optic fiber sensor which was made in the laboratory. This figure explains the details of the materials used in making the FBG sensor which consists of the diaphragm steel plate, epoxy resin, optic fiber, 3D printed part, and brass tube pipe.
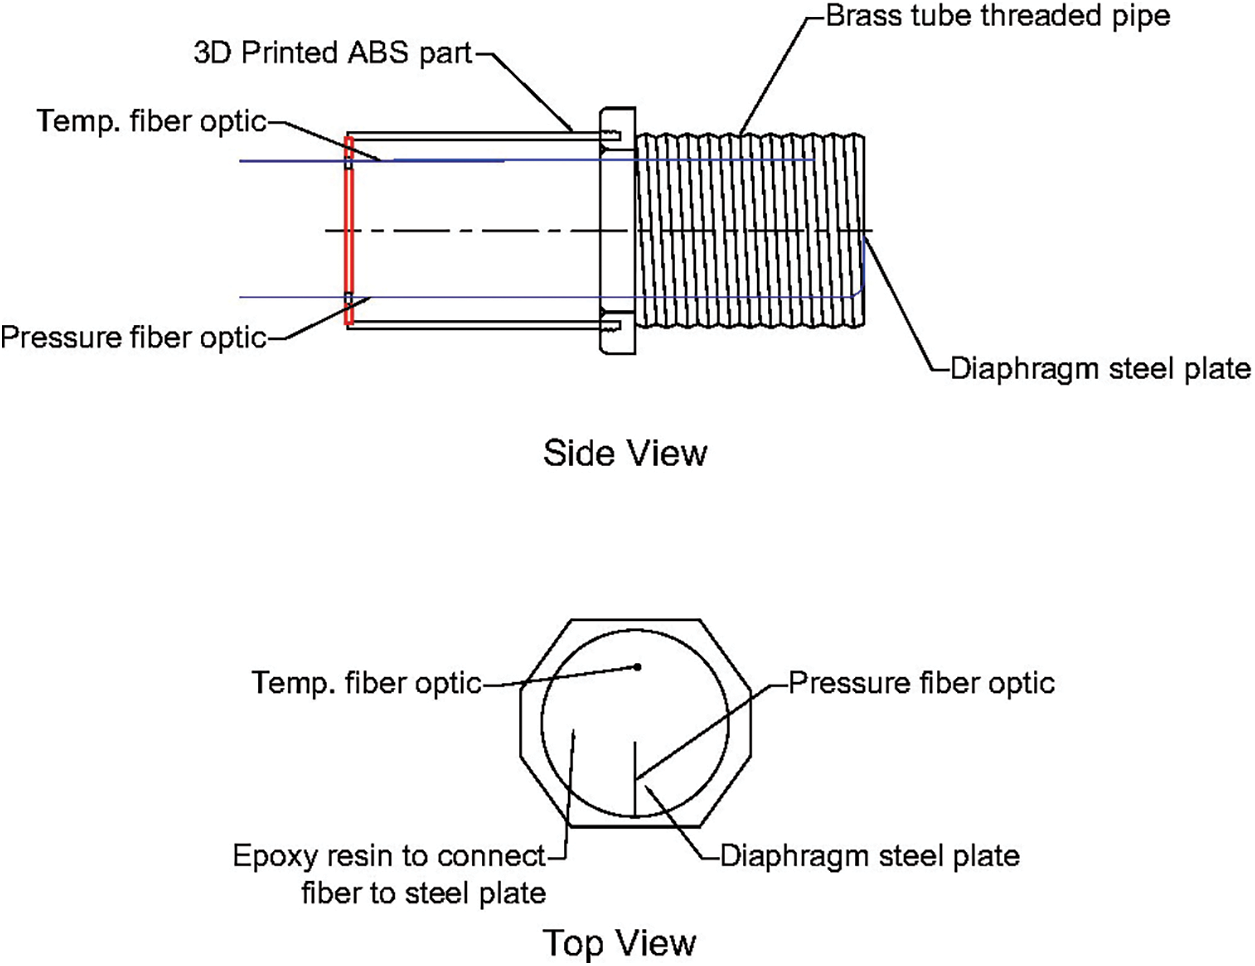
Figure 5: Schematic illustration of FBG sensor from side view and top view
To have a sensor which be able to suit with standard, it requires a proper analytical procedure. As it is obvious, a linear relationship is a statistical relation used to describe a straight-line relation among variables. A linear relationship can be shown in a graph and represented in Eq. (4):
where T is used to represent both temperatures in temperature compensation and pressure in water calibration. In comparison, λ is used to represent the wavelength shift in both procedures of temperature compensation and water calibration. Each of m and b counted as a constant in the equation.
Fresh concrete temperature is not stable, particularly once mixed water with cementitious materials. At the stage of the dormant period, the initial and final stage of setting time, concrete releases a lot of heat. Therefore, besides the FBG pressure, it is required to have an FBG temperature sensor along with FBG pressure. Therefore, in each sensor package, the FBG temperature has been allocated. Then, FBG could record the reading data of the temperature and pressure from each sensor.
In this investigation, it has been used only two FBG sensors. Besides each of FBG sensors has been allocated with the transducer sensors.
5.2.1 Temperature Compensation
After the FGB sensor is made, it is required to do the packing of the FBG into the proper package. The optic fibers are attached to the diaphragm to read the pressure. In the first step, the FBG pressure sensor is attached by a specific type of epoxy resin to the diaphragm. Similarly, the FBG temperature sensor is inserted into the pipe glued to the body of the sensor and suspended in the tube without being attached to the diaphragm, see Fig. 5. Then, each of the sensors passes through five cycles to stabilize them at different heat ranges. The temperatures were set at (25.2, 32.5, 41.8, 51.2, 61.3)°C. The maximum temperature was set at 61°C because it was obvious that the concrete temperature did not rise more than 61°C. Fig. 6 shows the FBG sensor foiled under an aluminium sheet on the heater to record the wavelength at different temperature ranges and find the relationship equation of the temperature compensation.
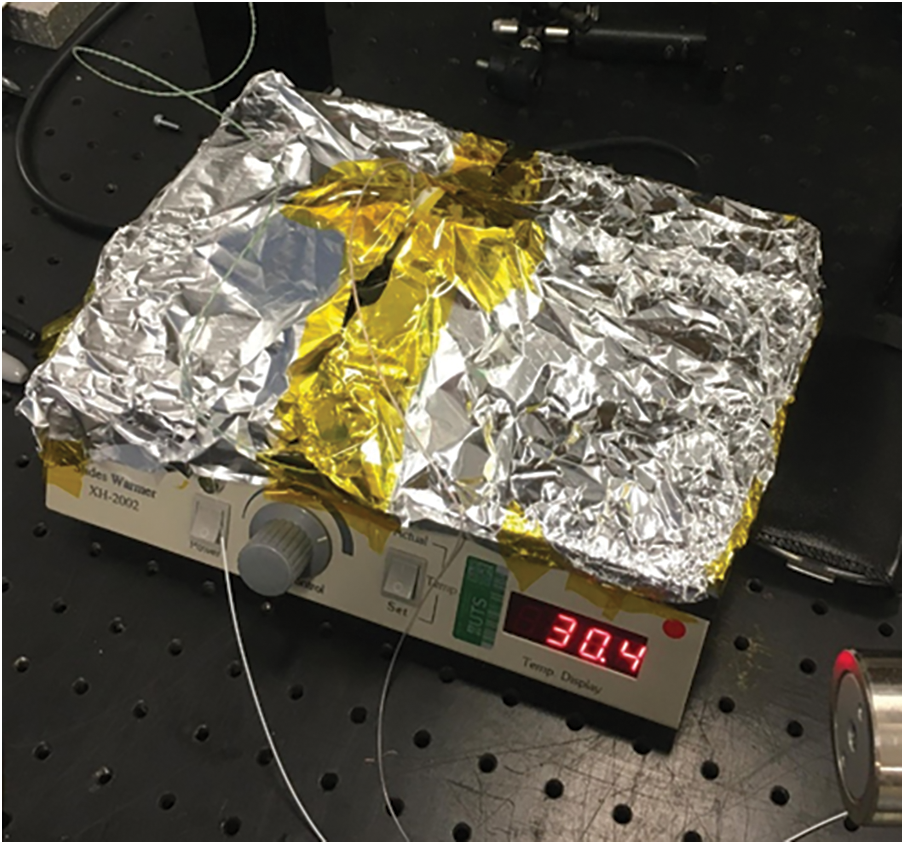
Figure 6: FBG sensor on the heater to record wavelength at different temperatures
After the FGB sensor is made and packaged in the tube. Then it is important to check the validity of the sensor and how could be used in real-life applications. Fig. 7 displays the pipe with a fill of water at different levels to record the pressure of water in wavelength and compare it with the theory of fluid mechanics for measuring pressure. As it is obvious, the pressure will be equal to the gravity multiplied by the density of the fluid multiplied by the height of the water in the tube. The recorded pressure of water at different levels was taken and this was checked with the formula of the hydrostatic pressure, then, this was used to check with the pressure of the concrete in the formwork.
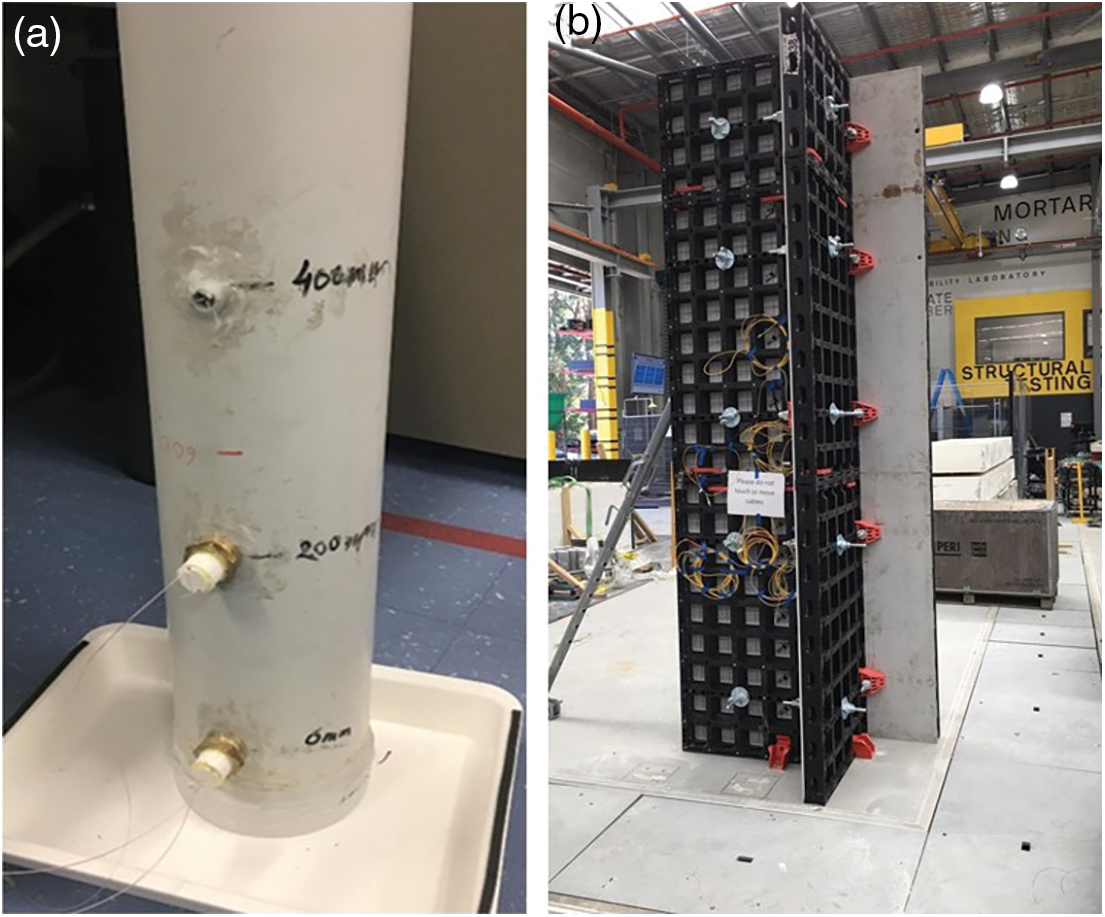
Figure 7: (a) FBG sensor mounted on the pipe to measure lateral pressure of water, (b) FBG sensor mounted to the real-application formwork to measure lateral pressure of concrete
6 Experimental Results and Discussion
The results of the FBG temperature and pressure (sensor number 2) are shown in Fig. 8 to calibrate it. Both sensors were recorded at the stabilization of the wavelength at a certain degree of temperature which took about an hour to stabilize them and give them a right wavelength. The range of temperature has been recorded at (25.2, 32.5, 41.8, 51.2, 61.3)°C. At the later stage, this will be used to compensate temperature from the lateral pressure. This can be used for different materials such as water and concrete.
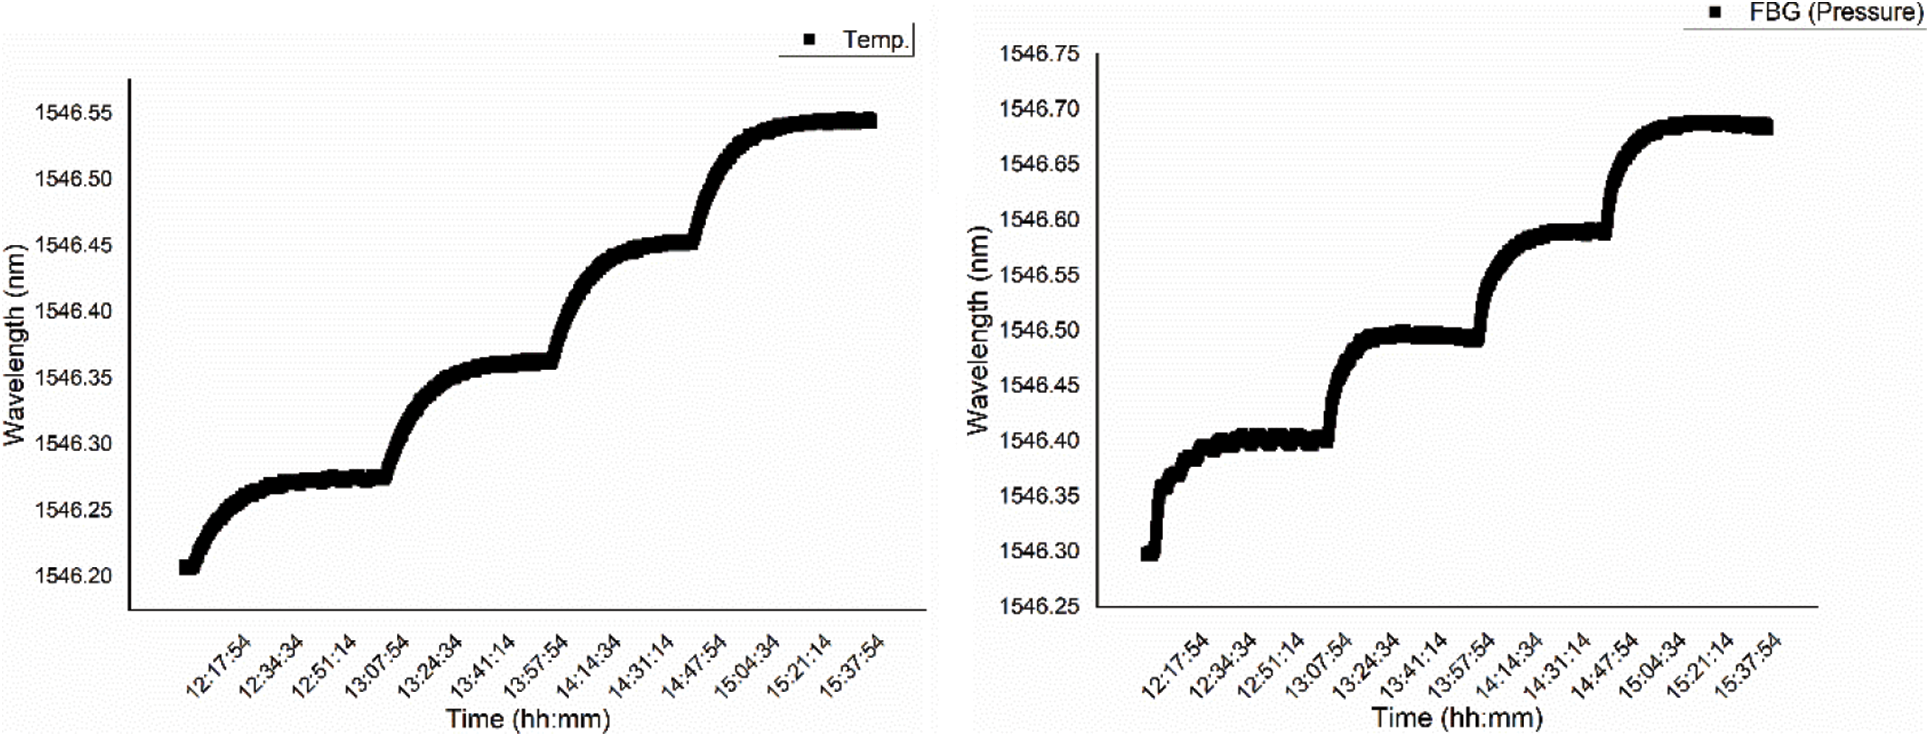
Figure 8: FBG sensors for temperature and pressure recorded wavelength fluctuation at different ranges of temperature
To achieve a stable wavelength at a certain degree of heating, it is required to wait for a certain time for the fiber optic in the package on the heater, the time is required to achieve this certainty about 1 h. It then makes the relationship between the temperature and wavelength shift at various regimes of heating until will makes a linear relationship. Fig. 9 shows the relationship in both FBG temperature and pressure sensors for sensor number 2.
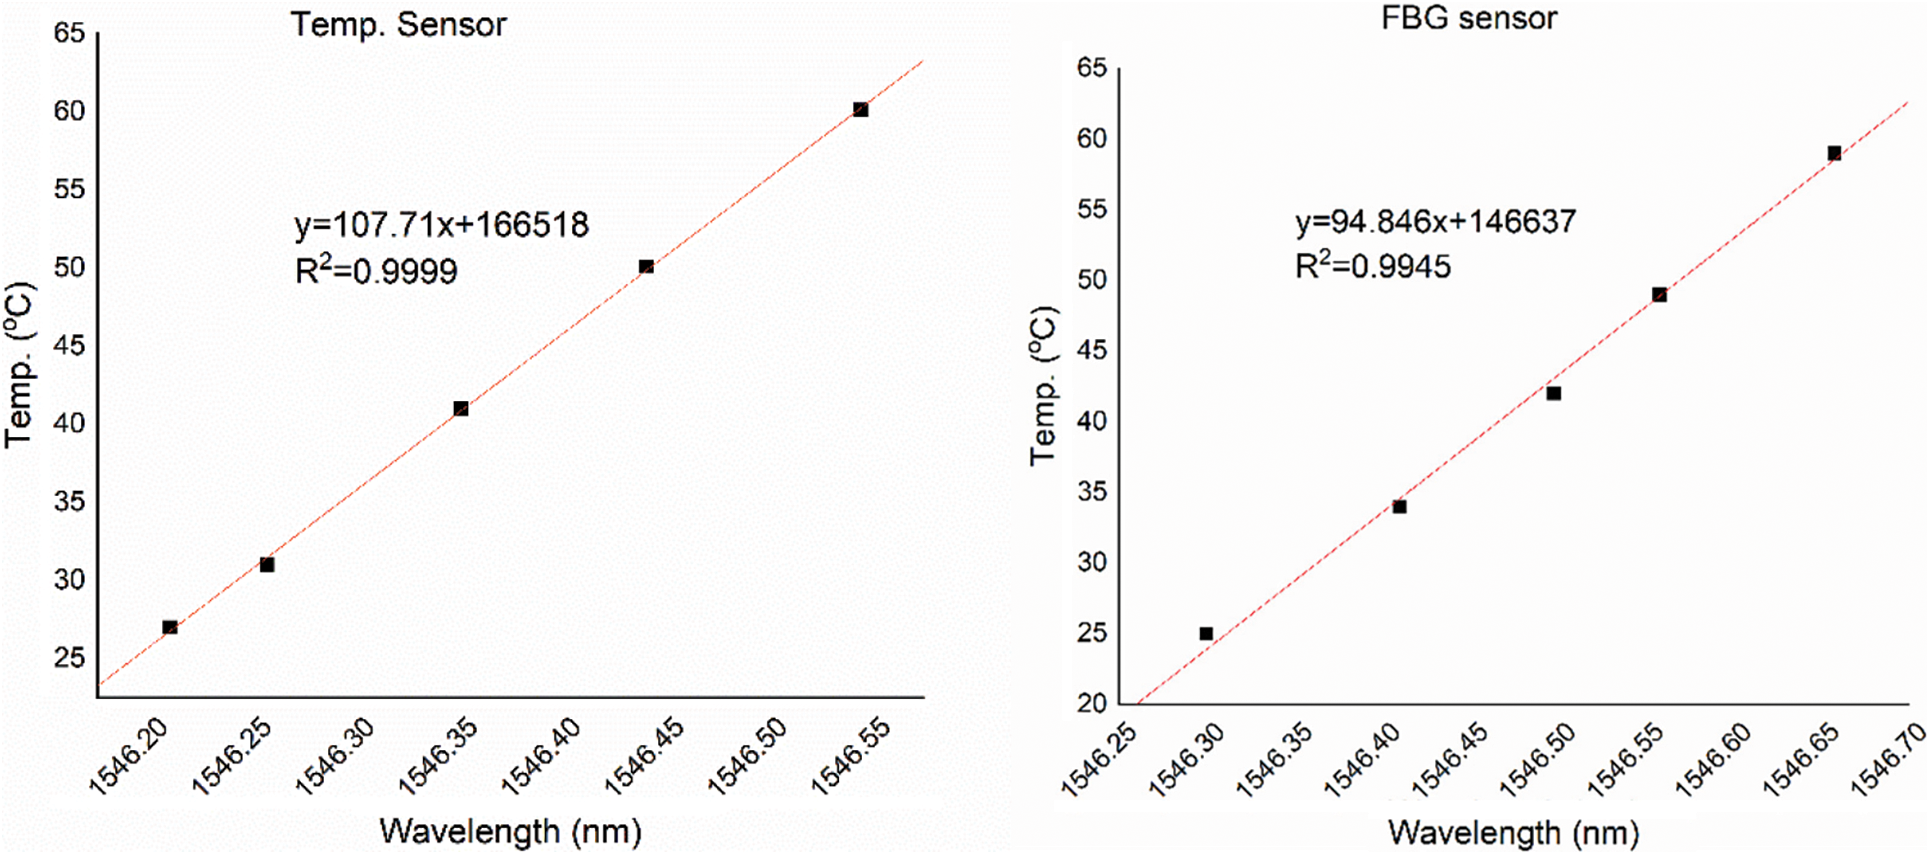
Figure 9: Relationship between temperature and wavelength shifts for FBG sensor number 2
The relationship between temperature and wavelength shifts was used to compensate for the temperature degree from the real pressure of fluid materials applied on the formwork. This happens while casting concrete in the process. To find the lateral pressure of fresh concrete not the change in the temperature degree. This can be represented in both of the following Eqs. (5) and (6):
Eq. (2) is used for the temperature sensor (T) and Eq. (3) is used for to pressure sensor (P). The recorded temperature is used to compensate for the lateral pressure and we will receive the actual pressure after substitution from the temperature. As is obvious concrete is not like other materials varies its temperature while mixing water with cement and evolves a lot of heat during mixing time and after a certain time of mixing.
In the next step, the sensor should be calibrated with a liquid known density; therefore, water as a liquid has been used to calibrate the sensor. Fig. 10 shows the calibration equation at a certain height, the height and wavelength were recorded for each of them and used in Eq. (7).
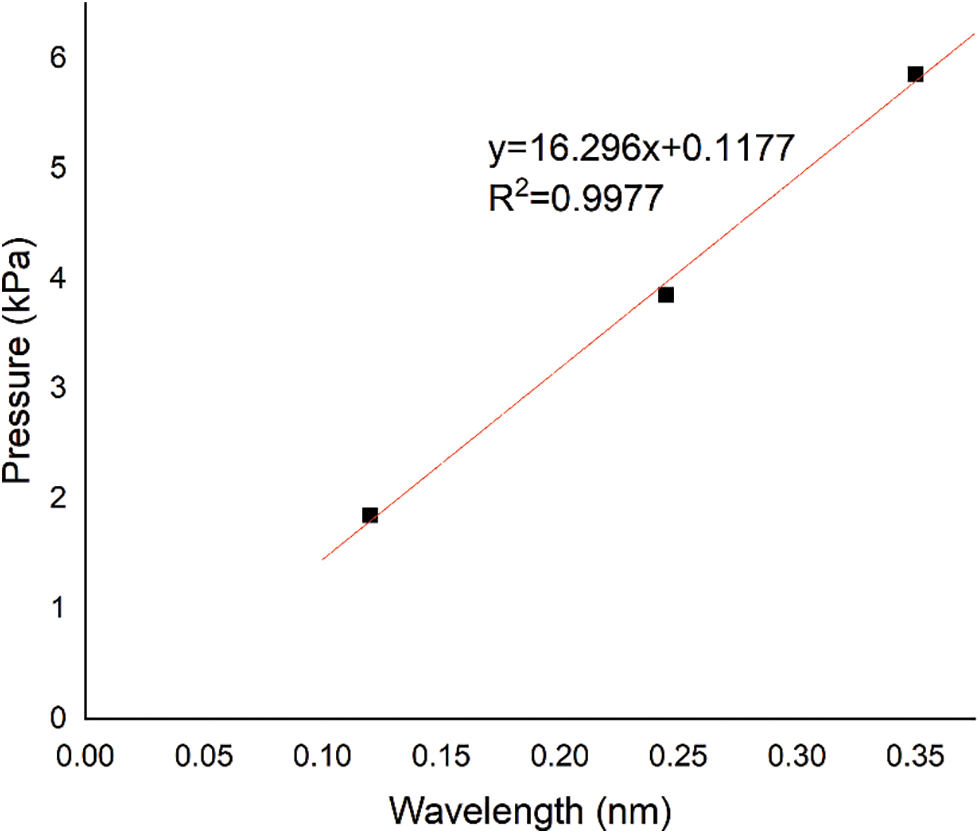
Figure 10: Relationship between pressure and wavelength in water calibration
where Pw is the pressure of the water at a certain level in the pipe. After FBG sensors were prepared and calibrated for the temperature and pressure, in the next step, the sensors were mounted into the panel of the formwork. The transducer sensor then was used beside the FBG sensors to validate the result of pressure. Fig. 11 shows the result of the transducer and FBG sensors, the result showed that both sensors are matched. FBG sensor 1 is 2.29% different from transducer sensor 1; however, FBG sensor 2 is 0.04% different from transducer sensor 2. Sensor 1 was mounted at 225 mm from the ground level and sensor 2 was mounted at 375 mm from the ground level. Sensor 1 recorded 60 kPa, and sensor 2 recorded 57 kPa.
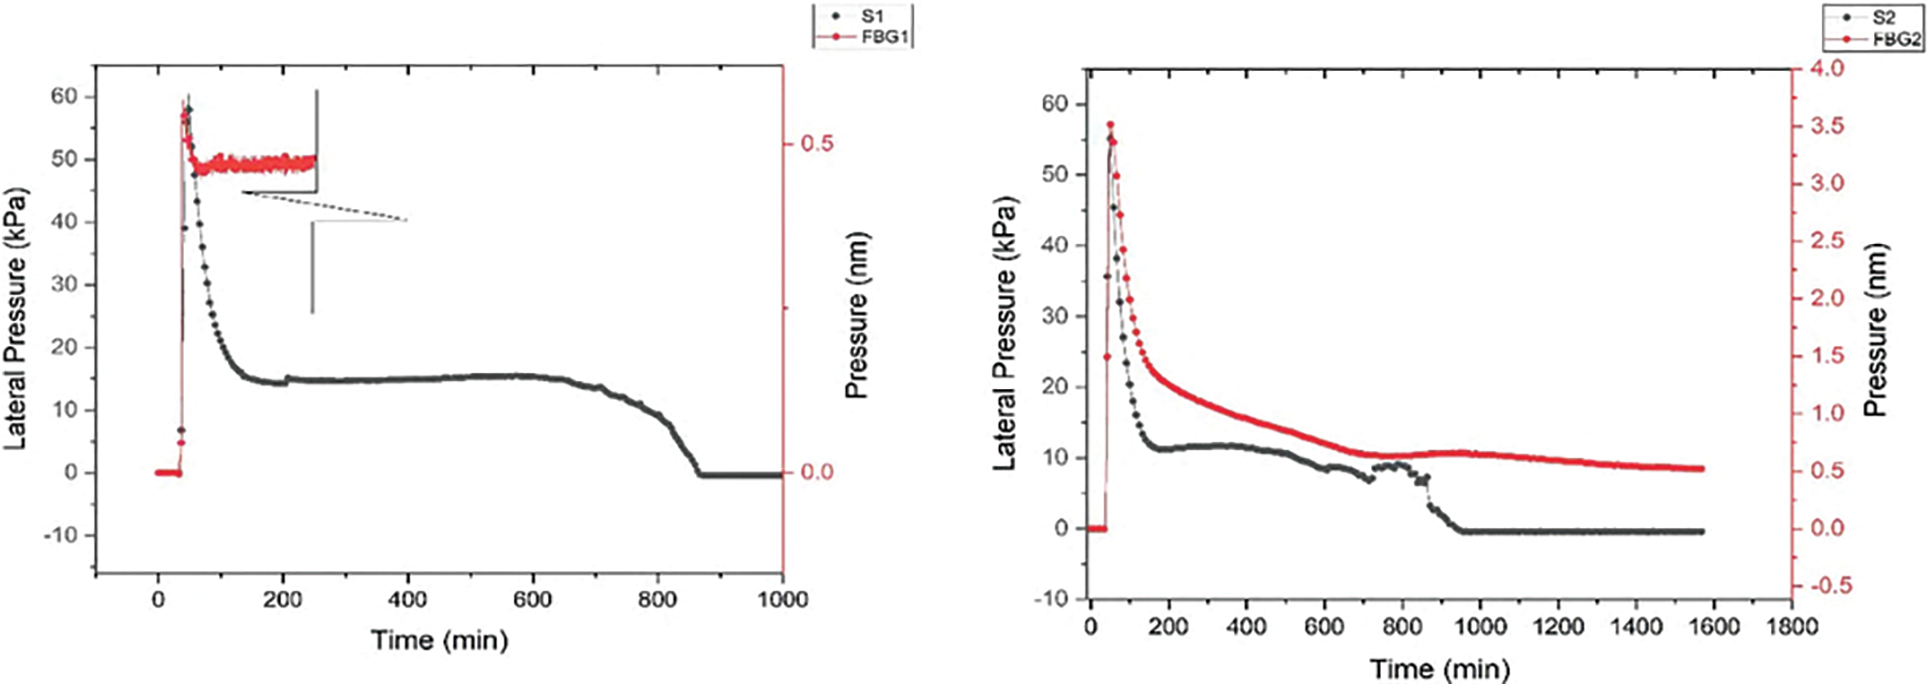
Figure 11: Results of the transducer and FBG sensors used to measure lateral pressure of SCC
The results achieved by the transducer sensor 1 at the height of 225 mm recorded 60 kPa, and similar results achieved by the FBG sensor 1 at the height of 225 mm recorded 58.626 kPa. The results achieved for the transducer sensor 2 at the height of 375 mm recorded 57 kPa and almost the same results achieved by the FBG sensor at the height of 375 mm recorded 56.9772 kPa. This can be counted as very accurate results from the FBG sensors. This percentage of the errors between the transducer and FBG sensors could happen due to the location of sensors even at the same level concrete may not have the same pressure distribution as a normal fluid. It is known that concrete behaviour like Bingham fluid does not provide the same pressure distribution as a Newtonian fluid.
Another reason might be counted in having small differences in the sensors due to the sensitivity behaviour of the FBG sensor might be more accurate than the transducer sensors in terms of the temperature compensating and less noise in the measurement in FBG.
The Fiber Bragg Grating sensor is a new model in the construction industry that can be used for monitoring and measuring the health of the structural elements. A great advantage of this sensor compared to the traditional sensor is non-metallic and does not require electronic devices to calibrate for measurement and monitoring. Based on the experimental results the following major points are concluded:
1. Fiber optic sensors were used successfully to measure lateral pressure. FBG sensors are temperature-compensated which means can measure pressure by taking out the temperature changes in the liquid or fluid. These sensors were calibrated with water to verify the theory of the hydrostatic pressure.
2. To validate the custom-made FBG sensors, the transducer sensors were used beside the FBG sensors. The transducer sensors were the most used in infrastructure applications; therefore, the FBG sensor was used to replace the transducer which can be cheaper and more advanced than transducer sensors.
3. The accuracy of the results of FBG sensors ensures that FBG could be an effective sensor that depends on laser light rather than power signals. Therefore, it can measure pressure without the need for complicated electronic parts.
4. Future focus is to use FBG as an industry sensor package to replace the electronic sensors.
The developed sensors in this study are reusable and could be used to measure pressure and temperature for different materials not only for self-compacting concrete. Therefore, FBG sensors could be a replaceable measurement instrument for the infrastructure application.
Acknowledgement: This research is funded through the ARC Research Hub for Nanoscience Based Construction Materials Manufacturing with the Support of Holcim Australia, the Industry Partner. The authors are grateful for the support of Netspot Solutions Company.
Funding Statement: This research is funded through the ARC Research Hub for Nanoscience Based Construction Materials Manufacturing (IH150100006) with the support of Holcim Australia, the Industry Partner.
Author Contributions: Conceptualization, N.G. and P.S.; methodology, P.S.; software, P.S.; validation, N.G.; formal analysis, P.S.; investigation, P.S.; resources, P.R.; data curation, P.S.; writing—original draft preparation, P.S.; project administration, N.G.; funding acquisition, N.G., P.R. All authors have read and agreed to the published version of the manuscript.
Availability of Data and Materials: The data will be available on request.
Conflicts of Interest: The authors declare that they have no conflicts of interest to report regarding the present study.
References
1. Huang K, Yan J, Zhang L, Zhang F, Jiang M, Sui Q. Reconstruction technology of flexible structure shape based on FBG sensor array and deep learning algorithm. Struct Durab Health Monitor. 2022;16(2):179–94. doi:https://doi.org/10.32604/sdhm.2022.018202. [Google Scholar] [CrossRef]
2. Shakor P, Nejadi S, Paul G, Sanjayan J. A novel methodology of powder-based cementitious materials in 3D inkjet printing for construction applications. In: Sixth International Conference on Durability of Concrete Structures, 2019; Leeds, UK. [Google Scholar]
3. Domone P. A review of the hardened mechanical properties of self-compacting concrete. Cem Concr Compos. 2007;29(1):1–12. doi:https://doi.org/10.1016/j.cemconcomp.2006.07.010. [Google Scholar] [CrossRef]
4. Khayat KH, Omran AF. State-of-the-art review of form pressure exerted by self-consolidating concrete. In: Final report Ready-Mix Concrete (RMC) research and education foundation. Sherbrooke, Canada: American Concrete Institute (ACIand Strategic Development Council (SDC); 2009. p. 1–139. [Google Scholar]
5. Najim K, Hall M. A review of the fresh/hardened properties and applications for plain-(PRC) and self-compacting rubberised concrete (SCRC). Constr Build Mater. 2010;24(11):2043–51. doi:https://doi.org/10.1016/j.conbuildmat.2010.04.056. [Google Scholar] [CrossRef]
6. Shakor P, Gowripalan N. Pressure exerted on formwork and early age shrinkage of self-compacting concrete. Concrete in Australia. 2020;46(3):30–4. [Google Scholar]
7. Gowripalan N, Shakor P, Rocker P. Pressure exerted on formwork by self-compacting concrete at early ages: a review. Case Stud Constr Mater. 2021;15:e00642. doi:https://doi.org/10.1016/j.cscm.2021.e00642. [Google Scholar] [CrossRef]
8. Arslan M, Şimşek O, Subaşı S. Effects of formwork surface materials on concrete lateral pressure. Constr Build Mater. 2005;19(4):319–25. doi:https://doi.org/10.1016/S0950-0618(02)00025-9. [Google Scholar] [CrossRef]
9. Khayat KH, Omran AF. Field validation of SCC formwork pressure prediction models. Concr Int. 2011;33(6):33–9. [Google Scholar]
10. Roussel N, Cussigh F. Distinct-layer casting of SCC: the mechanical consequences of thixotropy. Cem Concr Res. 2008;38(5):624–32. doi:https://doi.org/10.1016/j.cemconres.2007.09.023. [Google Scholar] [CrossRef]
11. Brameshuber W, Uebachs S. Investigations on the formwork pressure using self-compacting concrete. In: Proceedings of the 3rd International RILEM Symposium on Self-Compacting Concrete, 2003; Reykjavik, Iceland. [Google Scholar]
12. Ren G, Li T, Hu Z, Zhang C. Research on new FBG soil pressure sensor and its application in engineering. Optik. 2019;185:759–71. doi:https://doi.org/10.1016/j.ijleo.2019.03.019. [Google Scholar] [CrossRef]
13. Júnnyor WDSG, Diserens E, de Maria IC, Araujo-Junior CF, Farhate CVV, de Souza ZM. Prediction of soil stresses and compaction due to agricultural machines in sugarcane cultivation systems with and without crop rotation. Sci Total Environ. 2019;681:424–34. doi:https://doi.org/10.1016/j.scitotenv.2019.05.009 [Google Scholar] [PubMed] [CrossRef]
14. Khayat K, Assaad J, Mesbah H, Lessard M. Effect of section width and casting rate on variations of formwork pressure of self-consolidating concrete. Mater Struct. 2005;38:73–8. [Google Scholar]
15. Megid WA, Khayat KH. Variations in surface quality of self-consolidation and highly workable concretes with formwork material. Constr Build Mater. 2020;238:117638. doi:https://doi.org/10.1016/j.conbuildmat.2019.117638. [Google Scholar] [CrossRef]
16. Omran AF, Khayat KH. Portable pressure device to evaluate lateral formwork pressure exerted by fresh concrete. J Mater Civ Eng. 2013;25(6):731–40. doi:https://doi.org/10.1061/(ASCE)MT.1943-5533.0000537. [Google Scholar] [CrossRef]
17. Varela H, Barluenga G, Puentes J, Palomar I, Rodriguez A. Lateral pressure of nano-engineered SCC combining nanoclays, nanosilica and viscosity modifying admixtures. Constr Build Mater. 2023;388(7):131683. doi:https://doi.org/10.1016/j.conbuildmat.2023.131683. [Google Scholar] [CrossRef]
18. Al-Tarawneh MA. In-pavement fiber Bragg grating sensors for weight-in-motion measurements (Master Thesis). North Dakota State University: USA; 2016. [Google Scholar]
19. Soma K, Ishigure T. Fabrication of a graded-index circular-core polymer parallel optical waveguide using a microdispenser for a high-density optical printed circuit board. IEEE J Sel Top Quantum Electron. 2012;19(2):3600310. doi:https://doi.org/10.1109/JSTQE.2012.2227688. [Google Scholar] [CrossRef]
20. Yu C, Qiu J, Xia H, Dou X, Zhang J, Pan JW. Compact and lightweight 1.5 μm lidar with a multi-mode fiber coupling free-running InGaAs/InP single-photon detector. Rev Sci Instrum. 2018;89(10):305. doi:https://doi.org/10.1063/1.5047472 [Google Scholar] [PubMed] [CrossRef]
21. Thai LT. New development in fiber technologies (Master Thesis). Norwegian University of Science and Technology: Norway; 2013. [Google Scholar]
22. Polley A. High performance multimode fiber systems: a comprehensive approach (Ph.D. Thesis). Georgia Institute of Technology: USA; 2008. [Google Scholar]
23. Warren BN. G652D Vs G657A2 Singlemode optical fibre differences and advantages. Available from: https://wbnetworks.com.au/blog?p=2. [Accessed 2024]. [Google Scholar]
24. Wilkins G. Fiber optic telemetry in ocean cable systems. Nova Scotia, Canada: CRC Press; 2000. [Google Scholar]
Cite This Article
 Copyright © 2024 The Author(s). Published by Tech Science Press.
This work is licensed under a Creative Commons Attribution 4.0 International License , which permits unrestricted use, distribution, and reproduction in any medium, provided the original work is properly cited.
 Downloads
 Citation Tools