
 Submit a Paper
 Propose a Special lssue
 Open Access
ARTICLE

Enhanced Transmission Tower Foundation Reliability Assessment: A Fuzzy Comprehensive Evaluation Framework
1 School of Civil Engineering and Architecture, Hubei University of Technology, Wuhan, 430068, China
2 Department of Civil, Environmental and Architectural Engineering (DICEA), University of Padova, Padova, 35131, Italy
* Corresponding Author: Zikang Zheng. Email:
(This article belongs to the Special Issue: Health Monitoring and Rapid Evaluation of Infrastructures)
Structural Durability & Health Monitoring 2024, 18(4), 425-444. https://doi.org/10.32604/sdhm.2024.046584
Received 08 October 2023; Accepted 11 December 2023; Issue published 05 June 2024
 View Full Text
 Download PDF
Abstract
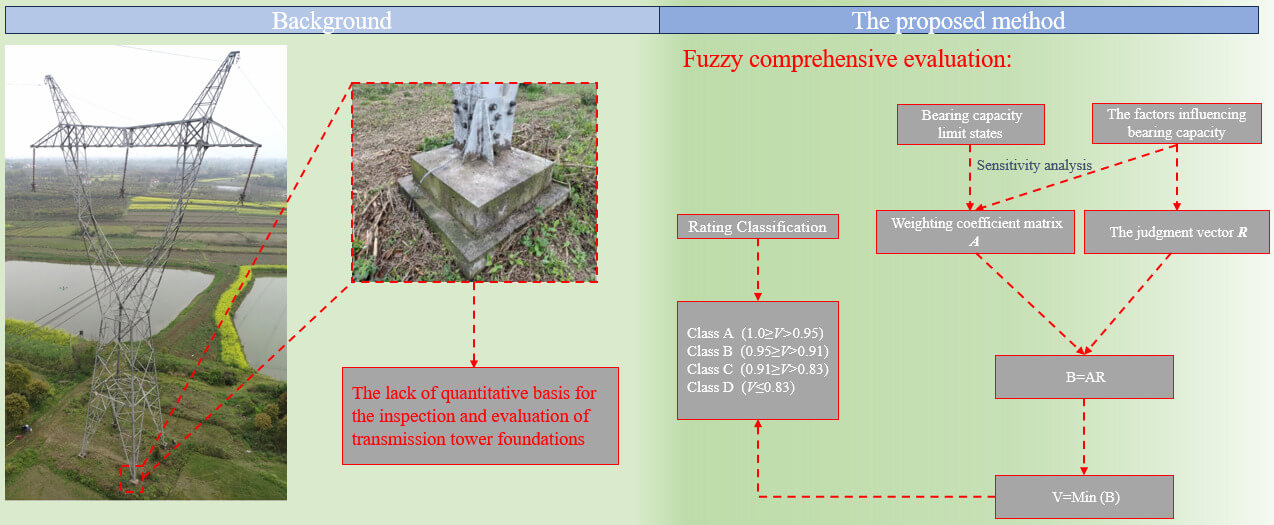
Due to the lack of a quantitative basis for the inspection, evaluation, and identification of existing transmission tower foundations, a new fuzzy comprehensive evaluation method is proposed to assess the reliability of transmission tower foundation bearing capacity. This method is based on the reliability analysis of the transmission tower foundation bearing capacity by analyzing the sensitivity of degradation of detection indexes on the reliability of transmission tower foundation bearing capacity, the weighting coefficient matrix is established about the influencing factors in the evaluation model. Through the correlation analysis between the bearing capacity degradation of the transmission tower foundation and its corresponding reliability degradation, the reliability evaluation grading standard for transmission tower foundation bearing capacity is established. The proposed fuzzy comprehensive evaluation method is used to evaluate the reliability of a 500 kV transmission tower foundation bearing capacity and to verify the rationality of the new evaluation method. The research results can provide a foundational framework for the detection and evaluation of transmission tower foundations and can serve as a reference for the development of structural reliability evaluation methods.Graphic Abstract
Keywords
As a widely used and important engineering, transmission lines are one of the lifelines of national economic construction and development [1,2], the safe operation ability of transmission lines has always been a matter of high concern for all sectors of society [3]. In the process of using transmission tower foundations, the influence of environmental factors can often lead to issues [4] such as concrete carbonation and cracking [5–7], damage to the steel bar section area [8], as well as other material deterioration phenomena. These problems result in a decrease in the foundation’s load-bearing capacity and have a significant impact on the structural safety of the tower. Therefore, it is imperative to address the topic of promptly assessing the extent of load-bearing capacity reduction in the tower foundation using common inspection elements and evaluating foundation reliability.
In the field of engineering applications, the inspection and assessment of the existing transmission tower foundation primarily reference the Chinese standard GB50144-2019 [9]. However, the relevant provisions within this standard are rather broad and lack a quantitative rating basis for transmission tower foundations. As a result, subjective and experiential judgment is the main approach for the detection and assessment of transmission tower foundations by most relevant institutions in China. In the field of research, in 2010, Xia et al. [10] introduced a tower structure safety state evaluation method based on the Analytic Hierarchy Process (AHP), which established a comprehensive evaluation system for transmission tower structures. Skrzypczak et al. [11] first demonstrated a concrete foundation reliability assessment method based on failure probability analysis in 2017. In 2018, Yang et al. [12] publicly demonstrated a “transmission tower foundation safety assessment system” based on the fuzzy comprehensive evaluation method. In 2020, Ma et al. [13] made an initial attempt to construct a safety evaluation model for transmission tower foundations by combining the fuzzy comprehensive evaluation method with the analytic hierarchy process. This innovative approach serves as a valuable reference for assessing the reliability of transmission tower foundations. In 2019, Szafran et al. [14] evaluated the stochastic time-independent reliability of steel lattice tower and presented a reliability estimation procedure for steel lattice telecommunication towers based on tensioned joint reliability. In 2023, Zhu et al. [15] conducted a comparative study on the operational modal analysis (OMA) of two typical ultra-high-voltage transmission towers under environmental test conditions using the fast Bayesian FFT method, providing a reference for wind resistance design and structural health monitoring of ultra-high voltage transmission towers. Zhao et al. [16] proposed a coherent clustering enhanced semi-automatic Bayesian modal identification method. This method can be utilized for modal updating and dynamic reliability assessment of ultra-high voltage transmission towers. It is evident that research in the field of safety assessment for transmission projects predominantly centers on the upper tower, whereas comprehensive safety assessment of transmission tower foundations receives comparatively less attention. The existing fuzzy reliability evaluation system for foundation structures has its limitations. The influence weighting coefficients of relevant indexes primarily rely on expert experience, lacking an objective basis. The quantitative relationship between inspection results and the reliability of the foundation’s load-bearing capacity is not substantial and does not align with the reliability-based inspection and evaluation method of the upper tower.
This article adopts the concept of correlating parameter degradation with the reliability degradation of load-bearing capacity in the upper tower structure [17]. Extending from the reliability index of transmission tower foundation load-bearing capacity, a fuzzy comprehensive evaluation method is developed for assessing the reliability of transmission tower foundation load-bearing capacity. This innovative method is constructed based on commonly employed detection indexes. It facilitates a rapid determination of the extent to which the reliability of the transmission tower foundation’s load-bearing capacity has diminished. Additionally, it offers valuable insights for both research and practical applications in the realm of foundation reliability assessment.
2 Reliability Evaluation Model of Transmission Tower Foundation Bearing Capacity
Referring to the previous fuzzy evaluation methods for structural reliability [18–20], it is preliminarily suggested that the evaluation of the foundation’s bearing capacity reliability be divided into four levels: Class A, Class B, Class C, and Class D. These levels are determined based on whether the foundation structure components meet the required reliability criteria and are represented by the state variable V within the state space I = {I1, I2, I3}. The classification is described as follows:
1. Class A foundation: 1 ≥ V > I1, the foundation’s bearing capacity and its ability to support the upper tower meet the design specifications, requiring only routine maintenance;
2. Class B foundation: I1 ≥ V > I2, the foundation’s bearing capacity is 0%~10% lower than the design specifications, necessitating minor repair and maintenance;
3. Class C foundation: I2 ≥ V > I3, the foundation’s bearing capacity is 10%~17% lower than the design specification, the ability of the foundation to support the upper tower is problematic and needs medium repair;
4. Class D foundation: V ≤ I3, the foundation’s bearing capacity is diminished by more than 17% compared to the design specifications. In this case, a comprehensive inspection is required to determine the need for a major overhaul. Special measures for reinforcement and repair must be undertaken.
2.2 Fuzzy Evaluation Factor Set for Reliability Degradation of Foundation Bearing Capacity
2.2.1 First-Level Evaluation Model
Based on the reliability rating of the foundation’s bearing capacity, different potential bearing capacity limit states corresponding to each foundation type are established as the first-level evaluation model, denoted as U1. Taking the excavation foundation as an example, it can be divided into the tensile bearing capacity of normal section R1, the uplift bearing capacity R2, the shear-bearing capacity of diagonal section R3, and the compressive bearing capacity R4 of the main column of reinforced concrete foundation, that is U1 = {R1, R2, R3, R4}.
The weighting coefficients for each limit state within the first-level evaluation model U1 should be determined based on the severity of the consequences caused by the components or systems in the first-level evaluation model U1 reaching or exceeding the respective bearing capacity limit state. Two methods are proposed: ① Determine the weighting coefficient of the target reliability index based on the relative magnitude of the target reliability index under various bearing capacity limit states. In this approach, the weight corresponding to the larger target reliability index should also be larger. This method needs to calibrate and calculate the reliability of a large number of similar foundation engineering projects in different limit states. ② Considering that as any limit state of carrying capacity is exceeded, it will have an adverse impact on the basic security [21], so the minimum index value of the first-level evaluation model U1 can be adopted as the value of the state variable V. This method is both conservative and straightforward. In this study, the second method is employed.
2.2.2 Second-Level Evaluation Model
According to the factors influencing bearing capacity, the fuzzy evaluation factor set of the second-level evaluation model U2 is established. The reliability evaluation of the foundation bearing capacity considers the conventional detection indexes, including foundation size, concrete strength grade, concrete carbonation depth, thickness of protective layer, crack width, and foundation burial depth. These indexes together constitute the fuzzy foundation evaluation factor set for second-level evaluation model U2, denoted as U2 = {foundation size, concrete strength grade, concrete carbonation depth, thickness of protective layer, crack width, foundation burial depth}.
Combined with each factor of the second-level evaluation model U2, the influence weight of the corresponding limit state to determine the factor weighting coefficient of second-level evaluation model U2, and the weighting coefficient matrix is determined as:
where, ‘wij’ represents the influence weighting coefficient of the jth detection parameter on the reliability of its bearing capacity limit state under the ith limit state system. For example, in the case of an excavation foundation ‘w21’ represents the influence weight of foundation size degradation on the reliability of uplift bearing capacity. Traditionally, the value of the weighting coefficient was primarily determined by aggregating insights from a large number of experts, which could introduce errors due to differences in understanding and experience. In response to this issue, this study proposed an alternative approach: determining the relevant weights by analyzing the sensitivity of degradation in different detection indexes to the degradation degree of reliability in their corresponding bearing capacity limit state. The specific methodology is explained in Chapter 3.
Once the fuzzy evaluation set, fuzzy evaluation factor set, and fuzzy evaluation factor weight set, the fuzzy evaluation score can be obtained by constructing a judgment matrix. The judgment vector of the index layer is as follows:
where, R represents the judgment matrix of the corresponding foundation; rj is the evaluation result provided for the jth second-level evaluation index. To objectively represent the degradation of detection indexes directly related to the foundation bearing capacity, such as foundation size and concrete strength grade, it is recommended to describe the loss ratio of detection results. For example, in the case of foundation column size, if the original design size is 500mm and the detection size is 480 mm, the corresponding r1 can be calculated as r1 = 480/500. For the detection indexes not directly related to the bearing capacity of the tower foundation, such as the thickness of the protective layer, the carbonation depth of concrete, and the crack width, etc., it is necessary to combine the weighting coefficient value method of the second-level evaluation model U2 to determine them specifically. The detailed determination process is provided in Chapter 4.
The reliability distribution vector for fuzzy evaluation of foundation defect condition is represented as follows:
Using the reliability distribution vector for different bearing capacity limit states in the foundation, the minimum value is selected as the fuzzy evaluation result for the state variable V:
where, V represents the state variable and serves as the final score in the fuzzy evaluation of the foundation defect condition; By comparing the value of V with the state space I, it is possible to ascertain the security level to which the foundation belongs. The specific determination of state space I is detailed in Chapter 5 of this paper.
3 Sensitivity Analysis of Detection Index Influence on Foundation Bearing Capacity Reliability
In order to determine the weighting coefficient of foundation size, concrete strength grade, foundation buried depth, and other detection indexes to the corresponding limit state, the analysis approach is as follows:
1. Establish the reliability limit state model in the corresponding limit state;
2. Analyze how the reliability of the foundation’s bearing capacity limit state degrades when a specific detection index deteriorates;
3. By calculating the gradient of the reliability degradation function, the trend of reliability variation with the degradation of detection indexes can be obtained, and the sensitivity coefficient of the corresponding detection variables on the reliability of the foundation bearing capacity is determined;
4. Based on the sensitivity coefficient of different detection indexes on the reliability of foundation bearing capacity, the weighting coefficient of factors is summarized.
Taking the excavated foundation as an example, the sensitivity analysis process about the influence of the detection index on the reliability of foundation bearing capacity is explained as follows:
1. The initial design parameters for the excavated foundation have been established. The main column section of the foundation is circular with a diameter of 1000 mm. The bottom section of the foundation is 2000 mm in diameter, 1000 mm in height, and 500 mm in height of the bottom plate, as illustrated in Fig. 1. The concrete strength grade is C30 (compressive strength design value fc = 14.3 N/mm2, tensile strength design value ft = 1.43 N/mm2). The column stirrup adopts HPB300 steel bars (yield strength design value of stirrups fyv = 270 N/mm2) with a diameter of 10mm and spacing of 120 mm. The column longitudinal rebar adopts 8 HRB335 steel bars (yield strength design value fy = 300 N/mm2) with a diameter of 25 mm. In reliability analysis, the load effect ratio is usually more sensitive to the reliability of structural bearing capacity than other factors, such as component size and material performance. Given that variable load on the transmission tower foundation primarily originates from wind load [22,23], the load effect ratio in this paper is the ratio of wind load to permanent load, and it is assumed to be 0, 0.1, 0.5, 1.0, and 2.0. The choice of these specific ratios aims to provide a comprehensive evaluation of the tower foundation’s behavior under varying wind load conditions.
2. Determining the statistical distribution of relevant parameters. According to relevant literature [24–26], the relevant statistical parameters in reliability calculation are shown in Table 1.
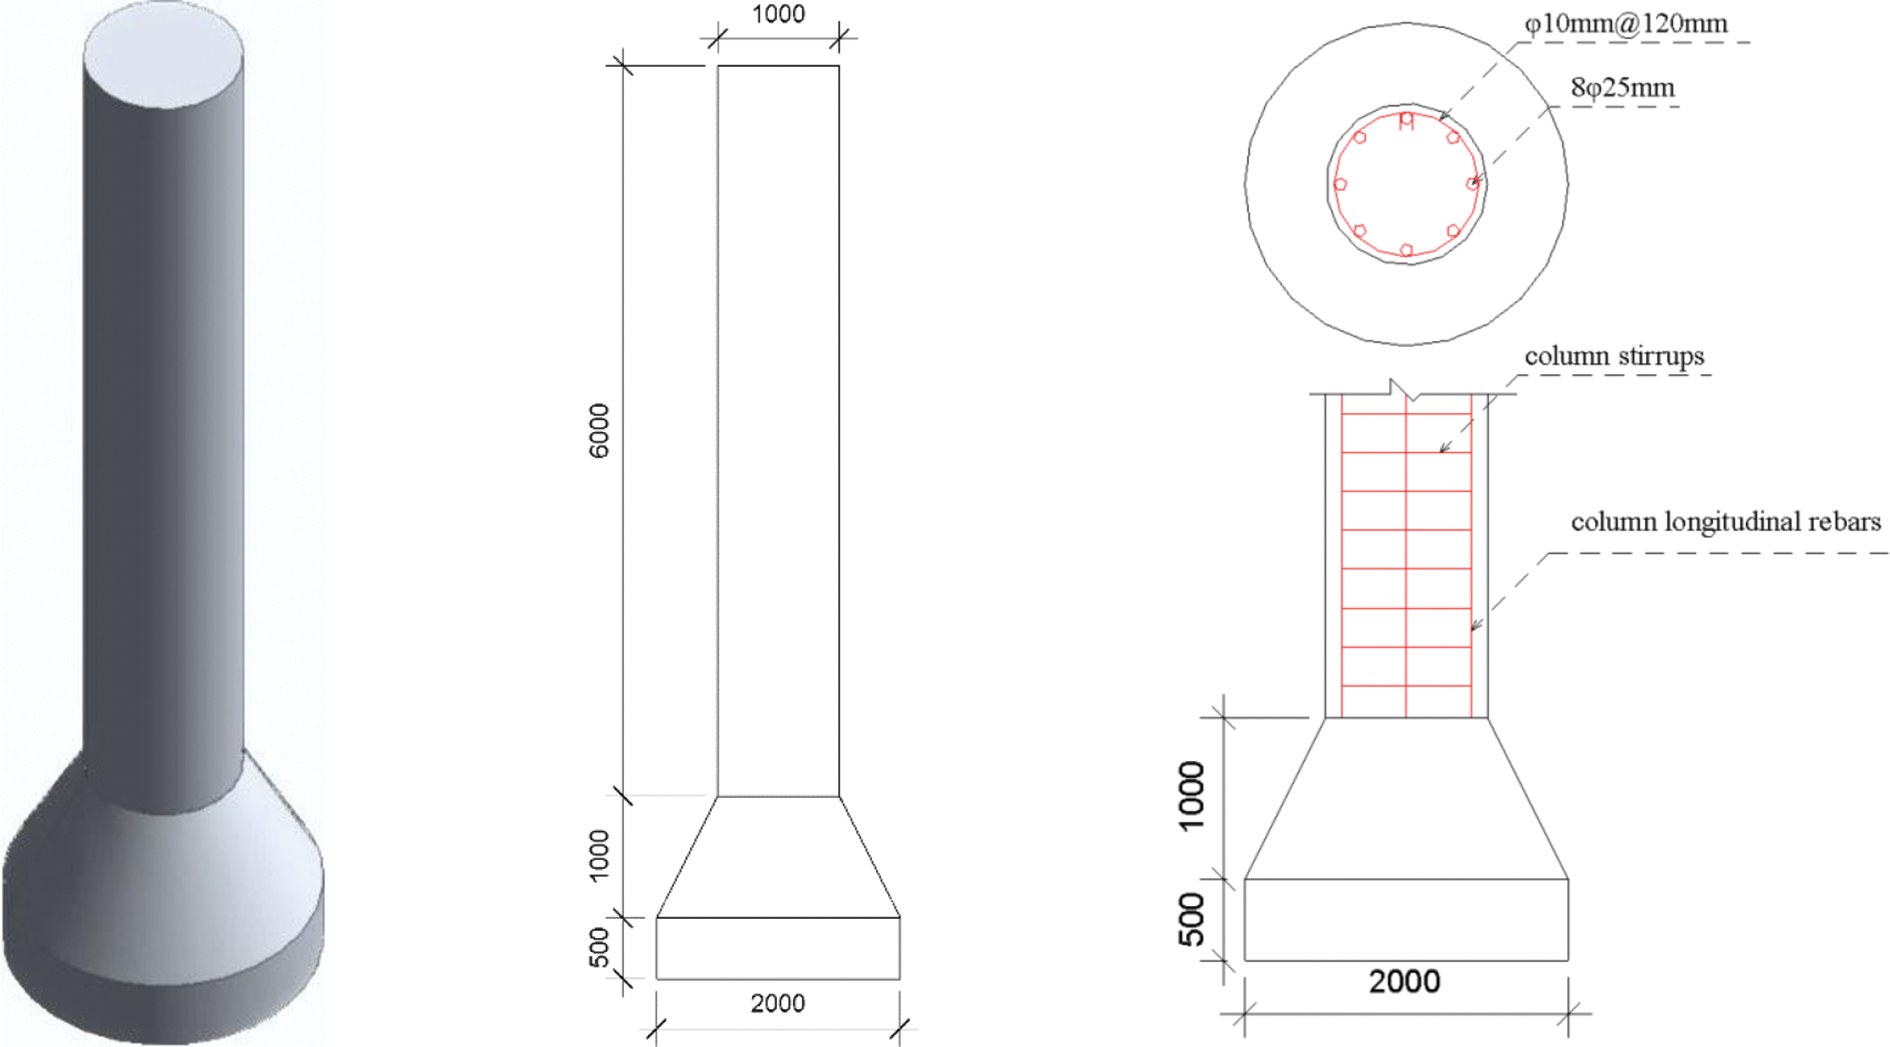
Figure 1: The basic form and reinforcement diagram of excavation foundation

3.3 Analysis of Degradation Law of Reliability with Detection Index
Based on the specified design parameters, the bearing capacity of the transmission tower foundation is calculated by employing the corresponding limit state equation. For the excavated foundation, there is the tensile bearing capacity of the normal section, the uplift bearing capacity, the shear-bearing capacity of the diagonal section, and the compressive bearing capacity of the main column of the reinforced concrete foundation. The expression of the bearing capacity limit state can be referenced from the Chinese standard DL/T 5219-2014 [27]. The approach to reliability calculation and analysis is depicted in Fig. 2.
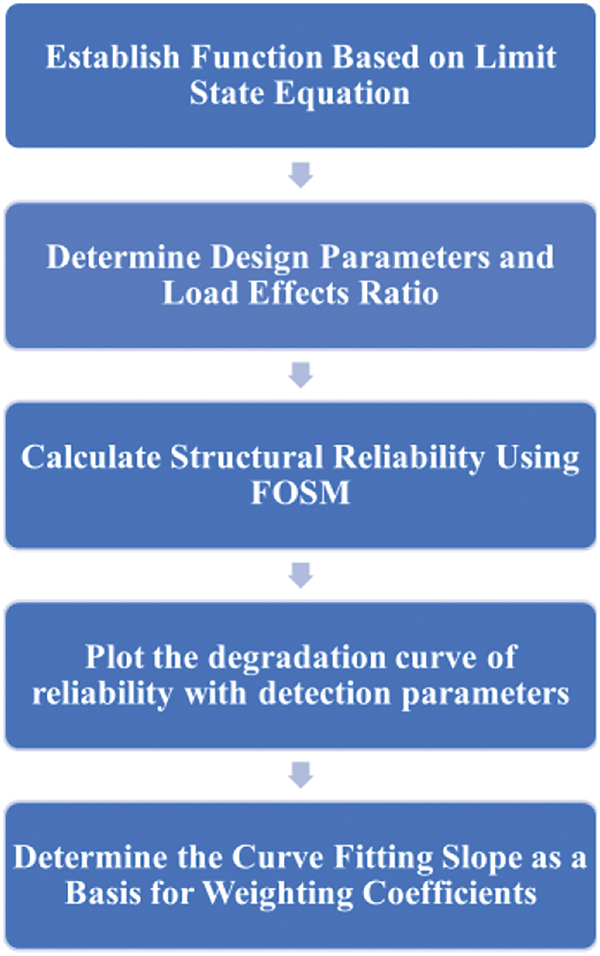
Figure 2: Flow chart of reliability calculation of transmission tower foundation
Taking the bearing capacity of the normal section of the excavated foundation as an example:
① Determine the limit state equation for the bearing capacity of the normal section of the excavated foundation:
② Construct the functional function Z:
③ Use the first-order second-moment method (FOSM) to calculate the reliability index:
④ Implement reliability index degradation for a single-parameter decay using MATLAB programming.
In formulas (5)–(7), TE represents the design value of the uplift bearing capacity on the foundation, As denotes the sectional area of all longitudinal reinforcement in the normal section, fy is the design value of the tensile strength of reinforcement, e0 stands for eccentricity, and rg is the distance from the section center to the longitudinal section reinforcement. S denotes the load effect. β signifies the reliability index, μz is the mean value of the functional function Z, and σz represents the standard deviation of the functional function Z.
Based on this, the impact of degradation of various detection indexes on different bearing capacity reliability indexes can be obtained. As an illustration, Fig. 3 shows the influence of variations in rebar section area on the calculated results of reliability degradation for the bearing capacity of the normal section. Fig. 4 shows the influence of degradation in various detection indexes on the calculated results of reliability degradation for uplift bearing capacity. Fig. 5 shows the influence of degradation in different detection indexes on the calculated results of reliability degradation for shear bearing capacity of the inclined section. Fig. 6 shows the influence of degradation in different detection indexes on the calculated results of reliability degradation for compressive bearing capacity. The horizontal axis on these figures represents the ratio of the relevant detection indexes after degradation to those before degradation, and its value ranges from 0 to 1.0. The vertical axis represents the ratio of reliability of each bearing capacity after degradation to that before degradation, and its value also ranges from 0 to 1.0. To ensure an objective and fair comparison, when the influence of degradation in one detection index on the reliability index is analyzed, the other indexes maintain the initial design parameters mentioned earlier.
1. In the above figures, βd represents the reliability index degradation ratio; ρr represents the rebar area degradation; ρd represents the dimensional degradation ratio; ρf represents the foundation depth deterioration; ρd represents the concrete strength deterioration ratio.
2. As the tensile bearing capacity of the normal section is primarily influenced by the tensile steel bars, and other relevant detection indexes have no direct impact on the bearing capacity limit state, a weighting coefficient of 1 is assigned to the rebar area’s influence on the reliability of the tensile bearing capacity of the normal section.
3. It can be seen that the reliability index of the bearing capacity of the foundation main column is degraded with the degradation of relevant detection indexes. The ratio of reliability degradation generally follows a linear pattern with the degradation of the detection indexes. Therefore, a relatively stable slope value is discernible, indicating that it is both feasible and rational to employ the changing slope to represent the influence of relevant indexes on the weighting coefficient of reliability degradation.
4. During the degradation process of the same detection index, as the load effect ratio increases, the corresponding degradation slope of the reliable index gradually decreases. However, this slope changes within a limited range. Given that the primary goal of this study is to ascertain the sensitivity of different detection indexes degradation to the degradation of the reliability index, the slope of the reliability degradation curve corresponding to the load effect ratio of 1.0 is selected as the basis for determining the weighting coefficient.
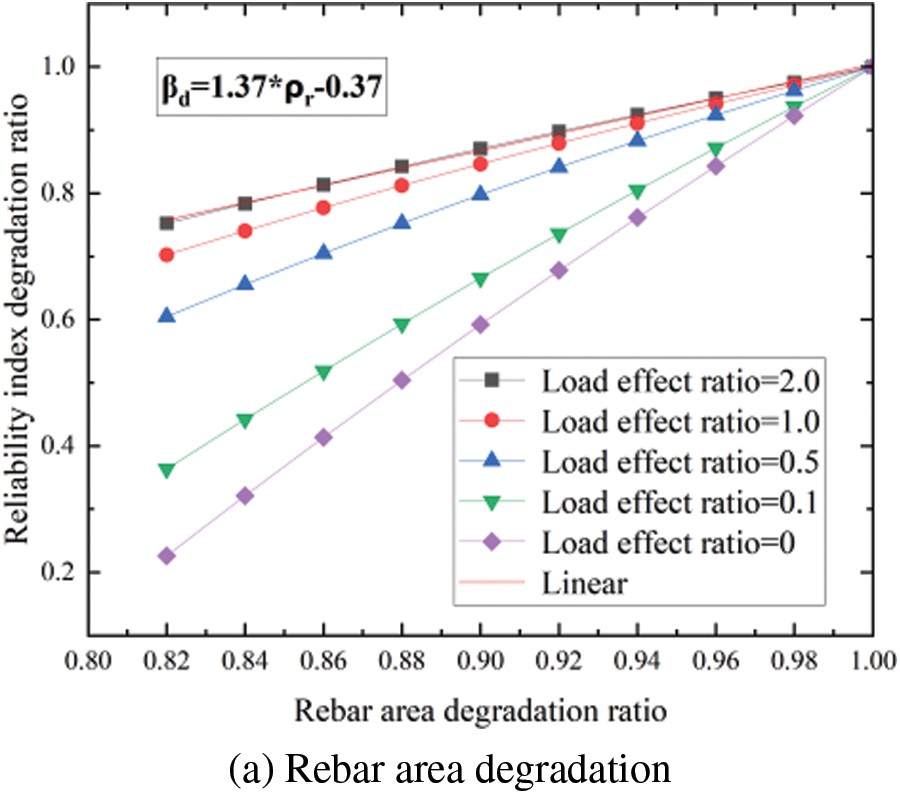
Figure 3: The influence of the degradation of rebar section area on the bearing capacity of the normal section
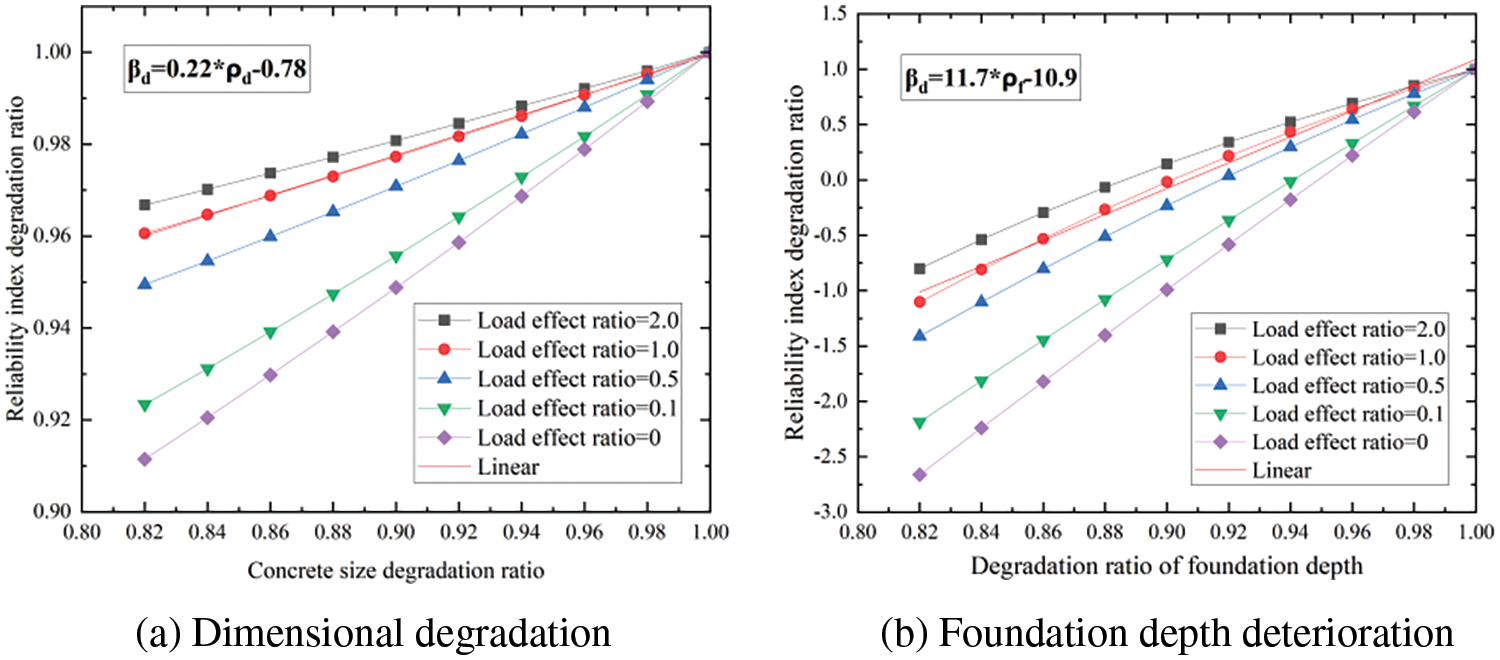
Figure 4: The influence of degradation of different detection indexes on the reliability of uplift bearing capacity
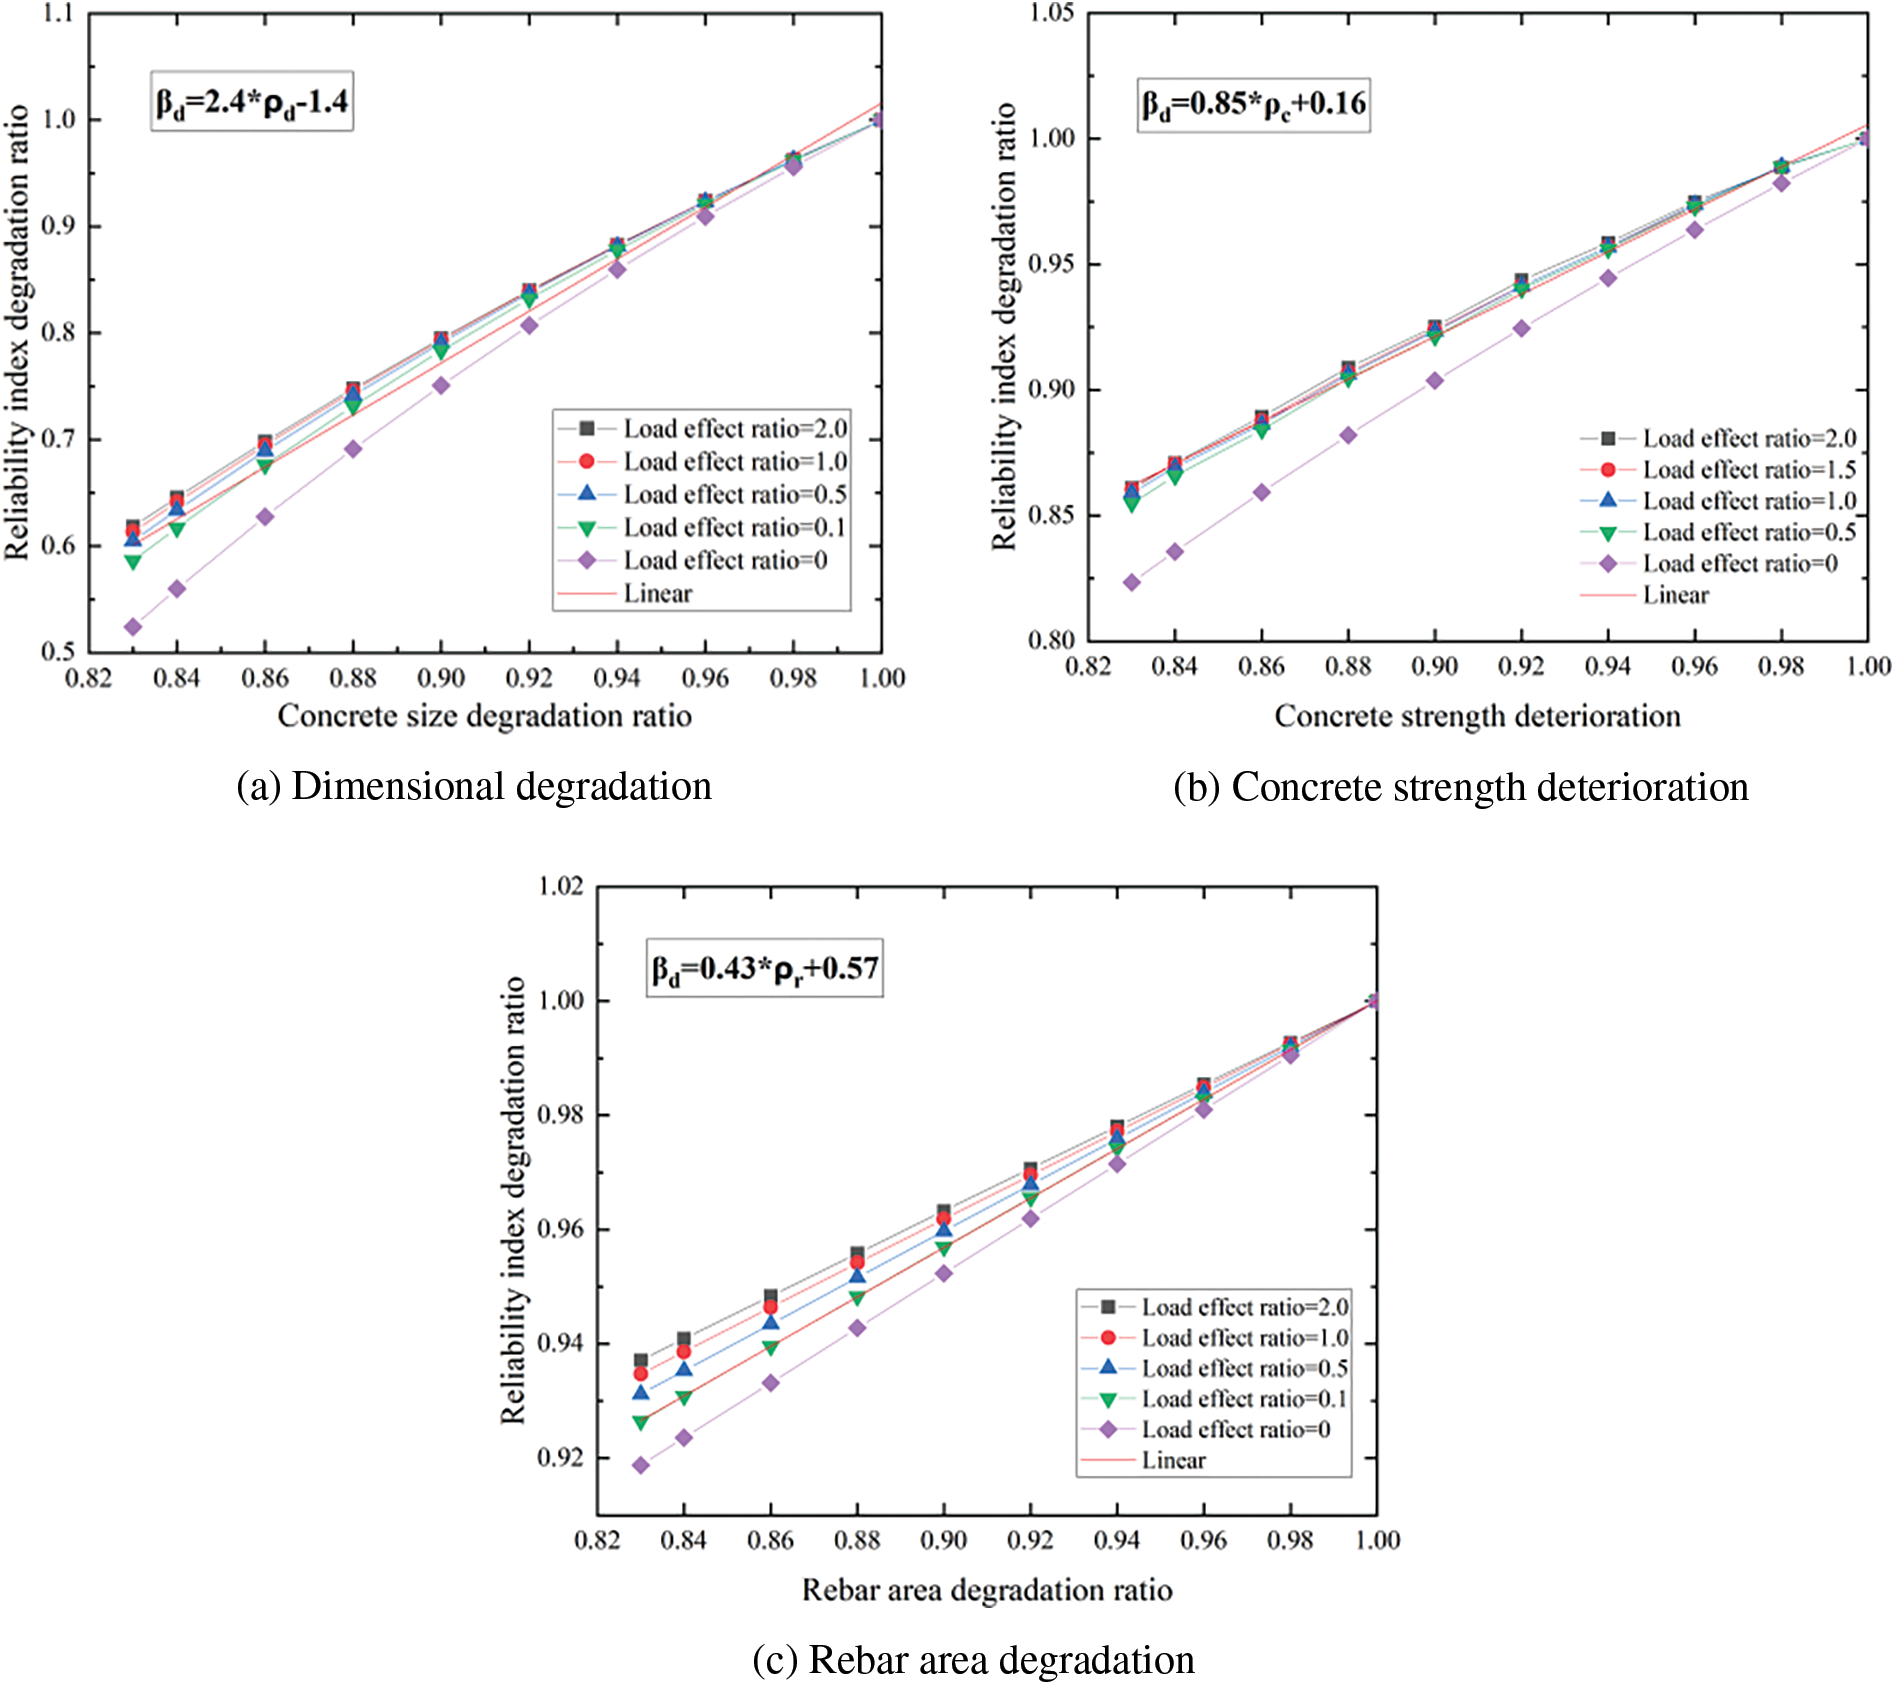
Figure 5: The influence of degradation of different detection indexes on the reliability of shear bearing capacity of inclined section
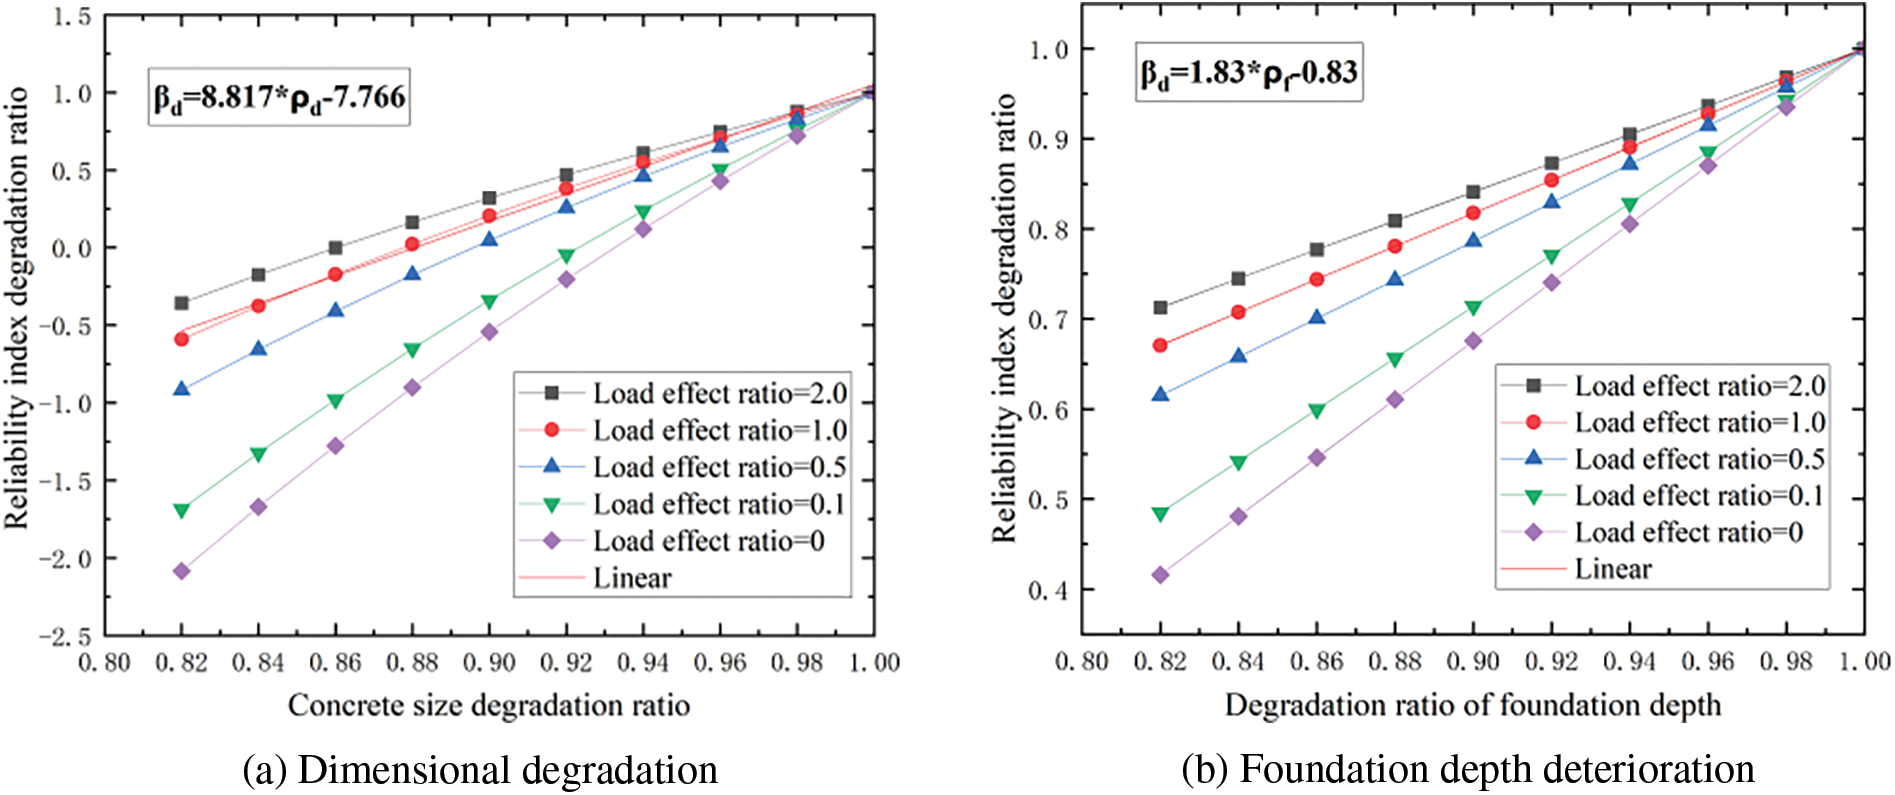
Figure 6: The influence of degradation of different detection indexes on the reliability of compressive bearing capacity
4 Research on Weighting Coefficient of Secondary Evaluation Model
In Figs. 4a and 4b, the slope of the curves is 0.219 and 11.675, respectively, when the corresponding load effect ratio is 1.0. Similarly, in Figs. 5a–5c, the slope of the curves is 2.4, 0.85, and 0.43, respectively, when the corresponding load effect ratio is 1.0. In Figs. 6a and 6b, the slope of the curves is 8.817 and 1.83, respectively, when the corresponding load effect ratio is 1.0. Based on these results, it can be concluded that the influence weighting coefficients of foundation size and foundation depth on the reliability of uplift bearing capacity are 0.219/(0.219 + 11.675) = 0.02 and 11.675/(0.219 + 11.675) = 0.98. The influence weighting coefficients of foundation size, concrete strength grade, and rebar section area degradation on the reliability of shear bearing capacity of the inclined section are 2.4/(2.4 + 0.85 + 0.43) = 0.65, 0.85/(2.4 + 0.85 + 0.43) = 0.23 and 0.43/(2.4 + 0.85 + 0.43) = 0.12. The influence weighting coefficients of foundation size and foundation depth on the reliability of compressive bearing capacity are 8.817/(8.817 + 1.83) = 0.83 and 1.83/(8.817 + 1.83) = 0.17.
It should be noted that non-destructive testing is commonly carried out for reinforced concrete foundation [28,29], which makes it hard to directly detect damage to the steel bar section area. In such case, it becomes necessary to consider the influence of detection indexes on steel corrosion, including factors such as concrete protective layer thickness, concrete carbonation depth, and crack width. This approach helps to reflect the impact of these variables on the reliability of foundation bearing capacity. Current research indicates that the corrosion depth of rebar is related to the thickness of the protective layer, crack width, and other factors [30]. The following is an expression to describe the corrosion depth δ of rebar.
where, fcu represents the compressive strength of the concrete cube (N/mm2), and c represents the thickness of the protective layer (mm); d represents the rebar diameter (mm), s represents the stirrup spacing (mm); w represents the crack width (mm).
According to [31], the formula of steel corrosion depth and steel section area damage can be further provided as follows:
where, α represents the uneven corrosion coefficient, which has an average of 1.5. The meaning of other symbols is the same as formula (8).
The purpose of this study is to explore the influence of protective layer thickness and crack width on the damage to the steel bar section area. Five common concrete strength grades C25, C30, C35, C40, C45 are considered. The rebar diameter is set as 10 mm, and the rebar spacing is 120 mm. The relationship between crack width, thickness of protective layer, and damage to steel bar section area is shown in Fig. 7.
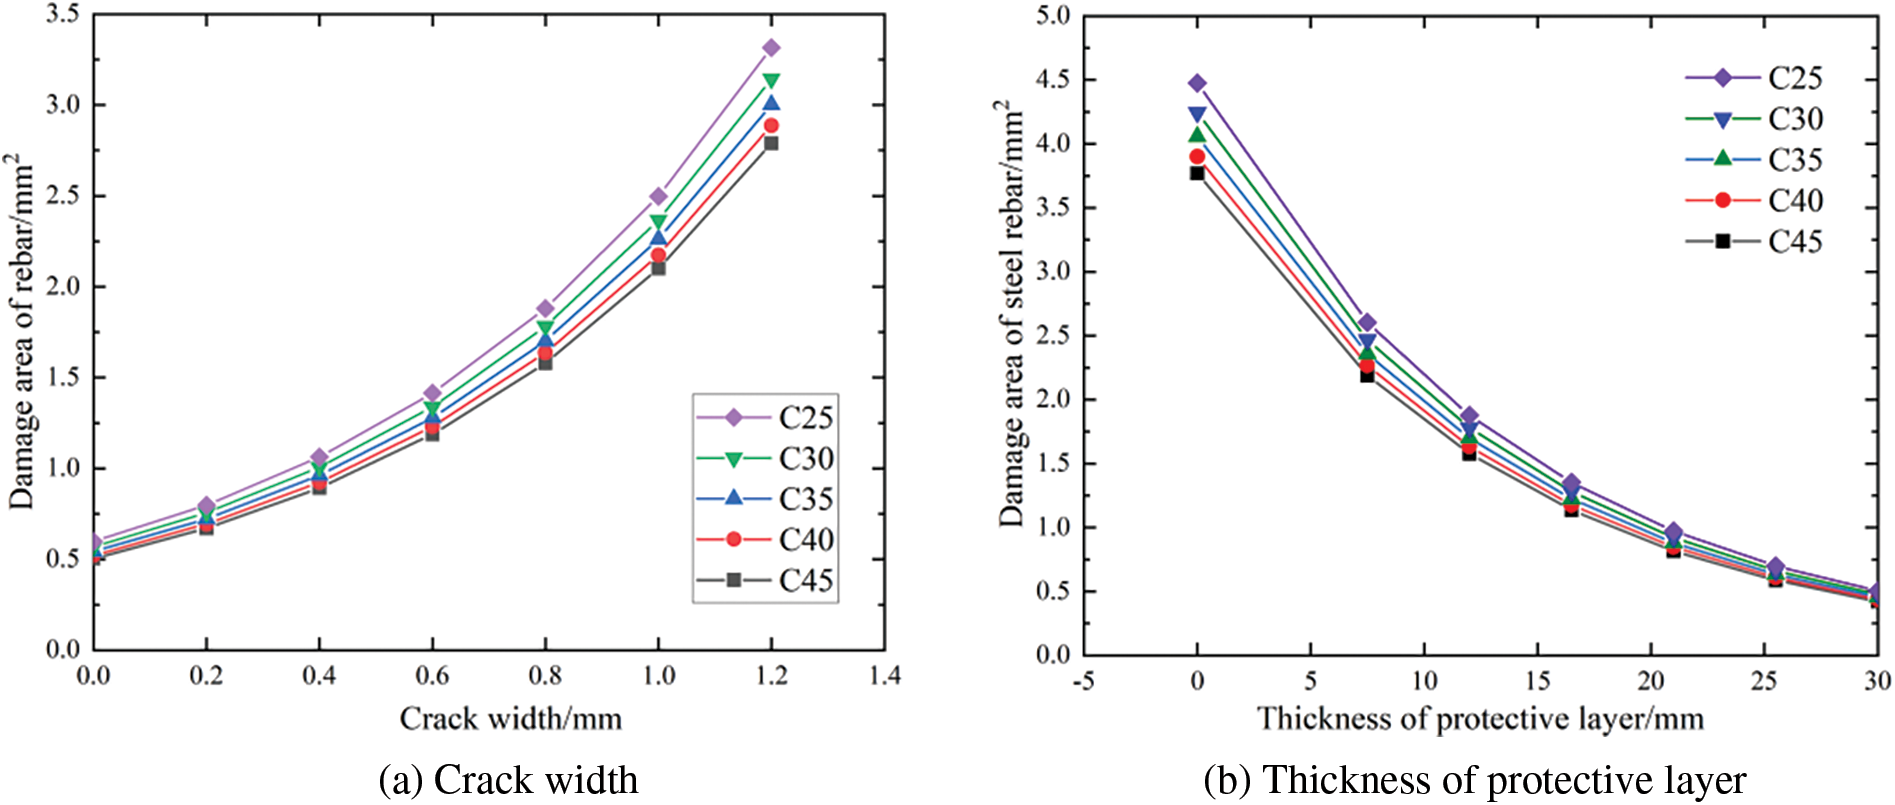
Figure 7: Influence of different detection indicators on the damage area of steel bars
To sum up, it can be observed that the slope of the curve, representing the relationship between crack width or protective layer thickness and the variation in rebar section area damage, varies with different concrete strength grades, varies with different concrete strength grades. This implies that the change in the concrete strength grade does not have a significant impact on the slope of the curve. According to this, the slope of crack width-rebar section area damage curve and protective layer thickness-reinforced section area damage curve corresponding to specific concrete strength grade can be selected for comparison. This can serve as the weight basis for evaluating the influence of these two factors on the damage to the rebar section area.
The crack width-rebar section area damage curve and protective layer thickness-rebar section area damage curve of the C35 concrete strength grade are selected for comparative study. To ensure fairness, the indexes representing the thickness of the protective layer and crack width are normalized. For the thickness of the protective layer, the ratio between the measured thickness of the protective layer and the maximum thickness of the protective layer (The reference [30] is taken as 30 mm) is used to represent the changes. When the thickness of the protective layer is 30 mm, the corresponding index is 1.0, and when the thickness of the protective layer is 0, the corresponding index is 0; For crack width, it is represented as 1 minus the ratio of the measured crack width to the maximum crack width. For corrosion cracks, according to the actual measurement in reference [30], the maximum width of the detected longitudinal corrosion expansion crack along the rebar is 1.2 mm. Therefore, when the actual crack width is 0, the corresponding index is 1, and when the crack width reaches or exceeds 1.2 mm, the corresponding index is 0.
Therefore, relationship curves between crack width and damage of the rebar section area, as well as protective layer thickness and damage of the rebar section area, are established in the same coordinate system, as shown in Fig. 8. In the figure, yr represents the damage area of rebar, nt represents the normalized detection index of protective layer thickness, and nc represents the normalized detection index of crack width.
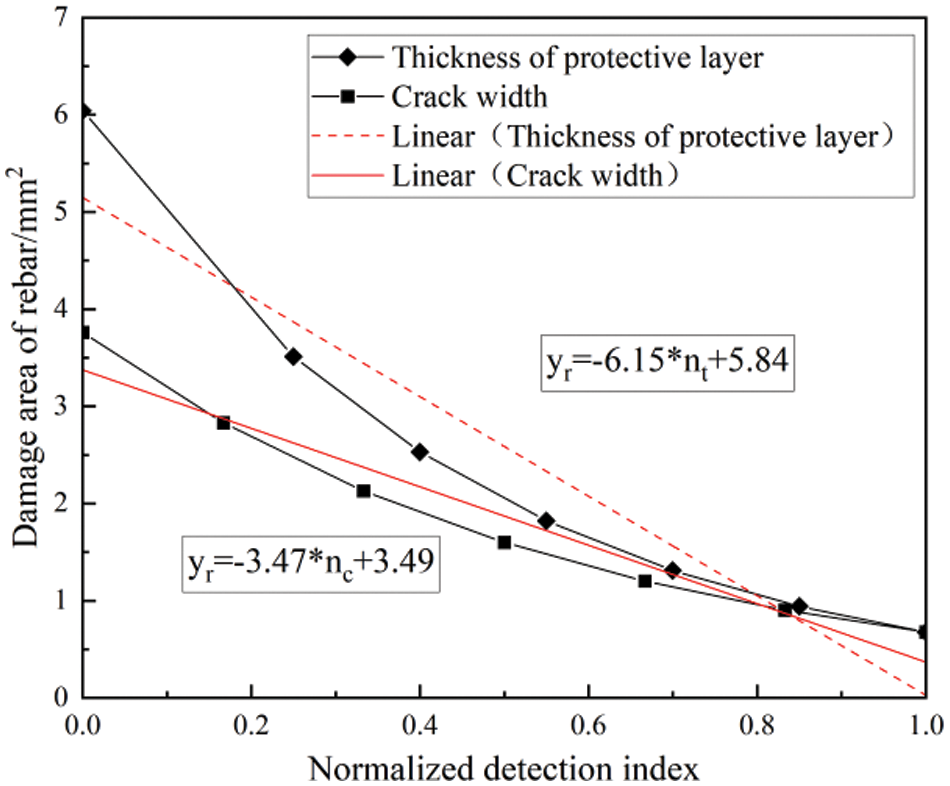
Figure 8: Influence of normalized detection index on damage area of steel bar section
According to Fig. 8, the protective layer thickness exhibits higher sensitivity to the damage of the rebar section area compared to crack width. Considering the carbonation depth of concrete is intertwined with the influence of protective layer thickness on rebar corrosion. Specifically, the effective thickness of the protective layer decreases as the carbonation depth of concrete increases, which, in turn, raises the likelihood of rebar corrosion. Therefore, the carbonation depth and the thickness of the protective layer are combined into a single index within the judgment vector, with the value calculated as (measured value of protective layer thickness-concrete carbonation depth) divided by the design value of protective layer thickness. When the carbonation depth of concrete equals the thickness of the protective layer, it indicates a failure of the protective layer, and the corresponding index in the judgment vector is assigned a value of 0.
The crack width detection index is considered an independent index within the judgment vector, and its value is calculated as 1 minus the ratio of the measured crack width to the maximum crack width. It should be noted that this study focuses on the impact of longitudinal cracks along the rebar as a detection index on the reliability of foundation bearing capacity. In fact, the shape and depth of cracks in concrete structures can also affect the structural durability, and then affect the long-term development of its bearing capacity [32]. Therefore, future research should explore the influence of different types of cracks on the reliability of foundation bearing capacity to improve the existing detection and evaluation system.
In summary, the influence weight of protective layer thickness (concrete carbonation depth) and crack width on the reliability of the tensile bearing capacity of the normal section can be determined as: 1.0 × 6.15/[(6.15 + 3.47)] = 0.64, 1.0 × 3.47/[(6.15 + 3.47)] = 0.36, the influence weight of the thickness of protective layer (concrete carbonation depth) and crack width on the reliability of shear bearing capacity of inclined section can be determined as: 0.12 × 6.15/[(6.15 + 3.47)] = 0.08, 0.12 × 3.47/[(6.15+3.47)] = 0.04.
Based on this, the weighting coefficients for the factors of the second-level evaluation model (U2) of the excavation foundation can be obtained, as shown in Table 2.

The factor weighting coefficient matrix of the second-level evaluation model (U2) of the excavated foundation can be obtained:
In the formula, the coefficient is 0, indicating that the relevant detection indexes have no direct influence on the bearing capacity limit state.
By using this method, the factor weighting coefficient matrix of the second-level evaluation model (U2) for the stepped foundation and the large plate foundation can also be derived.
The stepped foundation:
The first-level evaluation model (U1) includes five items: The tensile capacity of the main column of the reinforced concrete foundation, the flexural capacity of the normal section of the reinforced concrete foundation floor, the uplift capacity, the anti-overturning stability capacity, and the compressive capacity.
The large plate foundation:
The first-level evaluation model (U1) includes six items: The tensile capacity of the main column of the reinforced concrete foundation, the flexural capacity of the normal section of the reinforced concrete foundation floor, the uplift capacity, the anti-overturning stability capacity, shear bearing capacity of the oblique section of the main column of reinforced concrete foundation and the compressive capacity.
5 Reliability Evaluation Grade of Foundation Bearing Capacity
Based on the determination of state space I and relevant literature, this section introduces the concepts of target reliability and allowable failure as the basis for determining relevant parameters I1, I2, and I3 in state space I.
As a foundation component, the corresponding component type should be an important component. The bearing capacity of important components in concrete structures is stipulated in the Chinese standard GB50144-2019 [9], as shown in Table 3.
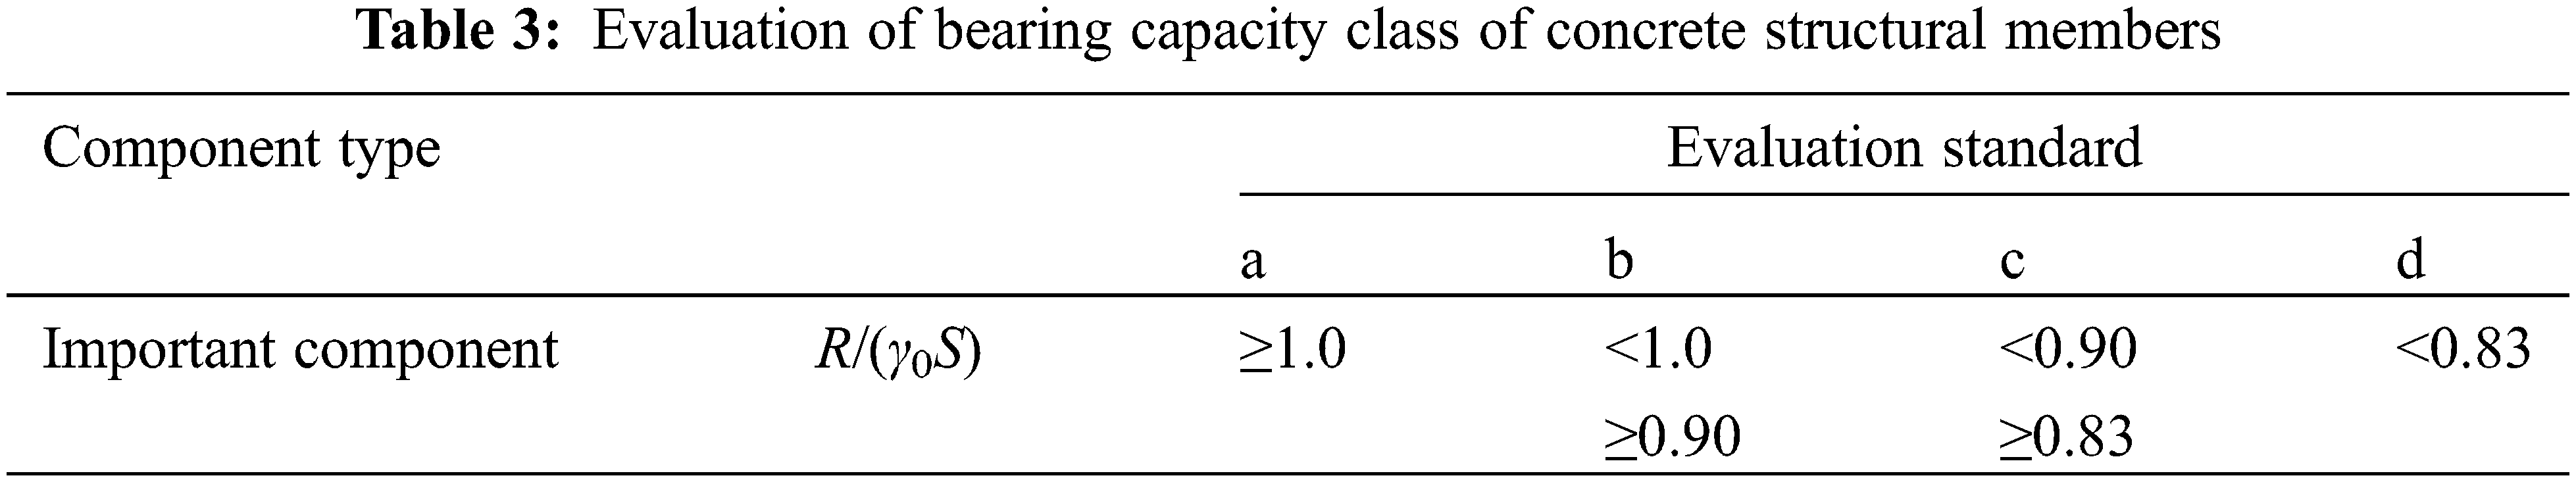
To maintain consistency with the reliability evaluation of the upper structure, the evaluation standard presented in Table 3 is used as the primary basis for determining the range of reliability evaluation grade of the foundation bearing capacity. It is important to note that V objectively reflects the degree of degradation in the reliability of foundation bearing capacity, When V equals 1.0, it signifies that the reliability of the foundation bearing capacity does not decline. When V is at 0.9, the reliability of foundation bearing capacity can be approximately considered to have reduced to 90% of the original. Accordingly, the state space I can be correlated with the degradation level of the reliability index of foundation bearing capacity. Referring to Table 3, when the design value of the foundation bearing capacity decreases by 17%, the relative ratio between the reliability when the bearing capacity of different foundations is reduced to 0.83R and the reliability when the original bearing capacity is 1.0R serves as the basis for determining the value of I3. Similarly, the relative ratio between the reliability when the bearing capacity of different foundations is reduced to 0.9R and the reliability when the original bearing capacity is 1.0R is used as the basis for determining the value of I2. Fig. 9 shows the average value of the relative ratio of reliability for different foundation types. From a conservative perspective, it is suggested to select the relatively larger ratio among the four types of foundations as the boundary for the corresponding grading. Therefore, I2 is selected as 0.91 and I3 is selected as 0.83.
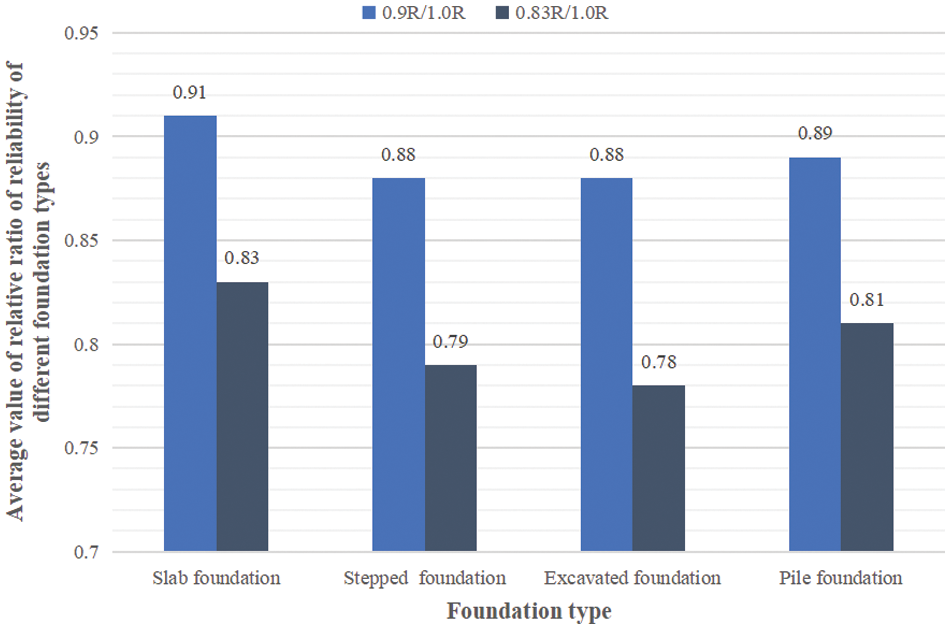
Figure 9: Average value of relative ratio of reliability of different foundation types
To establish the boundary value I1 between Class A foundation and Class B foundation, It is important to note that the limit state design method with a certain safety margin is commonly applied for designing engineering structures, including foundations, in China. This approach dictates that during the initial design and construction phases, the minimum target reliability index for the relevant bearing capacity reliability must be met, and additional measures can be taken to further improve the reliability index. Therefore, the value of I1 in the state space I should represent the state where the reliability of the foundation bearing capacity has just degenerated to the corresponding state of the target reliability index, and I1 should be between 0.91 and 1.0. In the absence of further research data, adopting a conservative approach, I1 is set at 0.95.
To sum up, the reliability evaluation grade boundaries of foundation bearing capacity are divided as follows: A(1.0 ≥ V > 0.95), B(0.95 ≥ V > 0.91), C(0.91 ≥ V > 0.83), D(V ≤ 0.83).
1) Field detection results
Table 4 presents the inspection results of an actual excavated foundation for a 500 kV transmission tower, which includes data regarding the foundation size, concrete strength grade, concrete carbonation depth, and the thickness of the protective layer of foundation rebar. In addition, actual photos of the foundations are shown in Fig. 10.

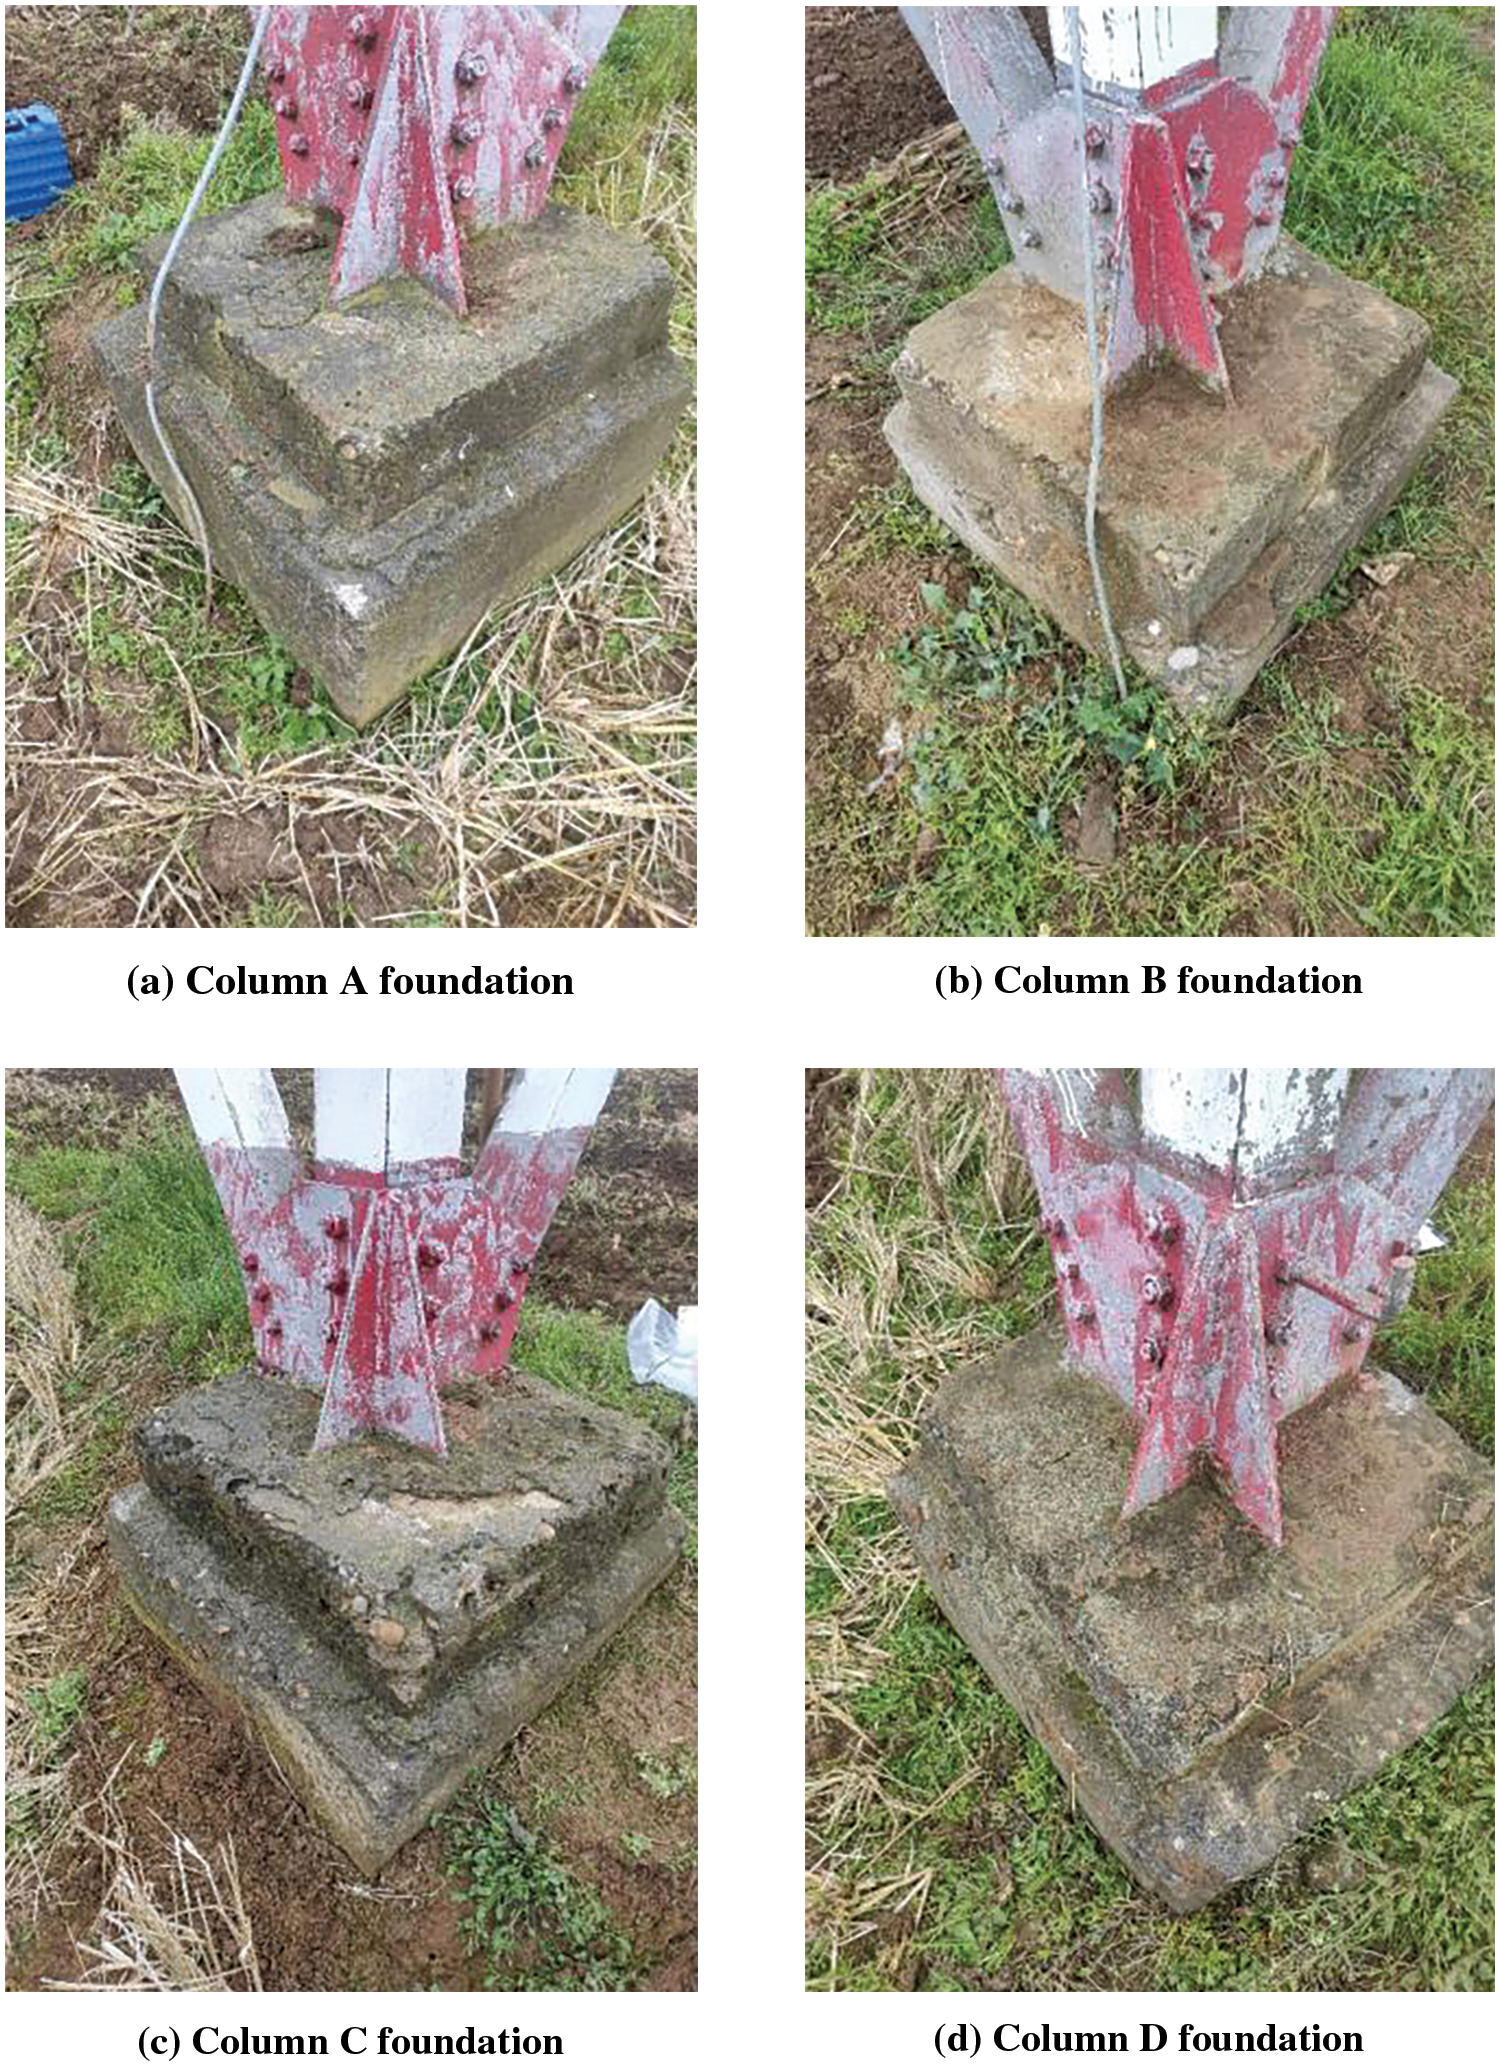
Figure 10: The 500 kV transmission tower foundations
2) Judgment vector analysis
Column A and column C, which exhibit relatively unfavorable detection results, have been selected for analysis. The corresponding judgment vector is as follows:
Column A:
① The size is qualified, so r1 = 1 − 0.02 = 0.98;
② The concrete strength grade is 28.1 MPa, and the design concrete strength grade is C30, so r2 = 27.3/30 = 0.91;
③ Take (measured value of protective layer thickness − concrete carbonation depth)/design value of protective layer thickness as the detection index, r3 = (34 − 3)/35 = 0.89;
④ It is determined that there is no longitudinal rust expansion crack and no deviation of foundation buried depth, so r4 = r5 = 1.0;
Therefore, the judgment vector R = [0.9812 0.91 0.886 1.0 1.0]T.
Column C:
① The size is qualified, so r1 = 1 − 0.05 = 0.95;
② The concrete strength grade is 27.4 MPa, r2 = 26.4/30 = 0.88;
③ Take (measured value of protective layer thickness − concrete carbonation depth)/design value of protective layer thickness as the detection index, r3 = (34 − 2.5)/35 = 0.84;
④ It is determined that there is no longitudinal rust expansion crack and no deviation of foundation buried depth, so r4 = r5 = 1.0;
Therefore, the judgment vector R = [0.955 0.88 0.84 1.0 1.0]T.
1) Column A:
Calculate the corresponding judgment index V according to formulas (3) and (10):
According to formula (4), V = min (B) = 0.93. This value falls within the range of 0.95 ≥ V > 0.91, indicating that the reliability evaluation result of the foundation is Class B.
2) Column C:
Calculate the corresponding judgment index V according to formulas (3) and (10):
According to formula (4), V = min (B) = 0.9. This value falls within the range of 0.91 ≥ V > 0.83, indicating that the reliability evaluation result of the foundation is Class C.
It is important to note that the primary objective of this study is to establish a quantitative evaluation method capable of capturing the reduction in reliability of the tower foundation’s bearing capacity based on the values of detection indexes. This method is developed through a sensitivity analysis between the relevant detection indexes and the bearing reliability of the tower foundation. The impact of soil and other conditions on the corrosion of the foundation has not been specifically addressed in this study. As detection technology continues to improve and detection indexes become more diverse, the proposed method can be further enriched and optimized. It should also be emphasized that this method is not limited to transmission tower foundation alone, the fundamental concept can be applied to the reliability assessment of various building structures. Furthermore, if it becomes possible to effectively predict the degradation trend of the relevant detection indexes over time, the judgment vector of the index layer can be formulated as a function that evolves with time. This approach can further quantitatively assess the future reliability degradation of the structure, thereby providing a more scientific basis for predicting the remaining service life of the structure.
Based on the reliability of transmission tower foundation bearing capacity, this study has investigated the application of a fuzzy comprehensive evaluation method to assess the reliability of transmission tower foundation bearing capacity The findings of this research provide a reference for the reliability detection, evaluation, and reinforcement of foundation bearing capacity. Additionally, it serves as a theoretical basis for a unified reliability assessment from the upper tower to the lower foundation. The specific conclusions of this study are as follows:
1. The sensitivity analysis of common detection indexes, including concrete strength grade, on the reliability of transmission tower foundation bearing capacity, and based on this, the factor weighting coefficient matrix of the second-level evaluation model (U2) for the bearing capacity of transmission tower foundation is established.
2. The correlation between the bearing capacity degradation of the transmission tower foundation and the corresponding reliability degradation is analyzed, and the reliability evaluation grade of the transmission tower foundation bearing capacity is established.
3. The comprehensive evaluation method of transmission tower foundation is established, and the reliability of the bearing capacity of a transmission tower foundation in an actual project is rated. This practical application confirmed the validity and rationality of the proposed evaluation method.
Acknowledgement: None.
Funding Statement: This research was financial supported by Innovation Demonstration Base of Ecological Environment Geotechnical and Ecological Restoration of Rivers and Lakes (No. 2020EJB004), National Science Foundation of China (No. 51508171), Natural Science Foundation of Hubei Province (No. 2020CFB860).
Author Contributions: The authors confirm contribution to the paper as follows: study conception and design: Yang Li, Zikang Zheng, Jiangkun Zhang, data curation: Yang Li, Zikang Zheng, methodology: Yang Li, formal analysis: Yang Li, writing–original draft: Yang Li, writing–original draft & editing: Zikang Zheng, writing–review & editing: Jiangkun Zhang, validation: Zikang Zheng, Jiangkun Zhang. All authors reviewed the results and approved the final version of the manuscript.
Availability of Data and Materials: The data and materials are available upon request.
Conflicts of Interest: The authors declare that they have no conflicts of interest to report regarding the present study.
References
1. Zhang, Z. Q., Li, H. N., Li, S. F., Ren, Z. D., Zhang, P. et al. (2016). Disaster analysis and safety assessment on transmission tower-line system: An overview. China Civil Engineering Journal, 49(12), 75–88 (In Chinese). [Google Scholar]
2. Wang, H. X., Tu, Z. B., Yao, J. F., Ding, M. J., Lu, B. et al. (2021). Comprehensive evaluation system of transmission tower foundation safety. IOP Conference Series: Earth and Environmental Science, 787(1), 012025. [Google Scholar]
3. Zhou, Y. B., Chen, H., Zhou, Q., Duan, Z. Q., Gao, X. J. (2020). Determination of ultimate load and stability evaluation of transmission tower foundation during operation period. Journal of Physics: Conference Series, 1654(1), 012122. [Google Scholar]
4. Zhou, Y. Q., Sheng, Q., Chen, J., Li, N. N., Fu, X. D. et al. (2022). The failure mode of transmission tower foundation on the landslide under heavy rainfall: A case study on a 500-kV transmission tower foundation on the Yanzi landslide in Badong. China Bulletin of Engineering Geology and the Environment, 81(3), 125. [Google Scholar]
5. Wang, X. P., Peng, S. M., Jiang, C. R., Hu, C. Y. (2001). Detection and analysis of concrete cracking of high voltage transmission line tower foundation. Concrete, 2001(7), 41–44 (In Chinese). [Google Scholar]
6. Johnson, C. S., Thirugnanam, G. S. (2010). Experimental study on corrosion of transmission line tower foundation and its rehabilitation. International Journal of Civil and Structural Engineering, 1, 27–34. [Google Scholar]
7. Johnson, C. S., Thirugnanam, G. S. (2016). Structural integrity assessment of transmission line tower foundations—a comprehensive approach. Power Engineer Journal, 18(1), 4–11. [Google Scholar]
8. Yang, Q., Jiang, L., Zhang, Y. J., Su, P., Yin, H. et al. (2016). Evaluation of concrete cracking of transmission tower foundation based on analytic hierarchy process. Journal of Three Gorges University (Natural Science Edition), 38(6), 64–69 (In Chinese). [Google Scholar]
9. GB 50144-2019 (2019). Standard for appraisal of reliability of industrial buildings and structures. Beijing, China: China Architecture & Building Press(In Chinese) [Google Scholar]
10. Xia, K. Q., Liu, S. Y., Yu, W. J., Lu, X. J. (2010). Research on safety status evaluation method of overhead transmission line tower. Industrial Architecture, 40(S1), 423–426 (In Chinese). [Google Scholar]
11. Skrzypczak, I., Słowik, M., Buda-Ożóg, L. (2017). The application of reliability analysis in engineering practice – reinforced concrete foundation. Procedia Engineering, 193, 144–151. [Google Scholar]
12. Yang, Y., Wang, G. Y., Zhang, F. Z., Hu, Y. S., Liang, Y. J. (2018). Safety assessment system for power transmission tower foundations. Soil Engineering and Foundation, 32(6), 655–657+664 (In Chinese). [Google Scholar]
13. Ma, J., Yang, M. S., Wang, H. N., Guo, Z. H., Zheng, X. L. (2020). Innovated safety evaluation system for the foundation construction of power transmission line towers. Journal of Safety and Environment, 20(1), 25–30 (In Chinese). [Google Scholar]
14. Szafran, J., Juszczyk, K., Kamiński, M. (2019). Experiment-based reliability analysis of structural joints in a steel lattice tower. Journal of Constructional Steel Research, 154, 278–292. [Google Scholar]
15. Zhu, Y. M., Sun, Q., Zhao, C., Wei, S. T., Yin, Y. et al. (2023). Operational modal analysis of two typical UHV transmission towers: A comparative study by fast Bayesian FFT method. Engineering Structures, 277, 115425. [Google Scholar]
16. Zhao, C., Su, Y. H., Zhu, Y. M., Sun, Q., Wei, S. T. et al. (2023). Enhanced semi-automated Bayesian modal identification approach for Ultra-high voltage transmission towers. Structures, 57, 105247. [Google Scholar]
17. Shan, K. Y., Li, T., Yan, C. B., Hu, J. Y., Xia, J. (2021). Influence of tower feet corrosion on safety performance of power transmission tower. Corrosion & Protection, 42(3), 28–33, 63 (In Chinese). [Google Scholar]
18. Lv, Y. Z., He, S. H. (2005). Fuzzy reliability evaluation of defective RC beam bridge. Journal of Traffic and Transportation Engineering, 2005(4), 58–62 (In Chinese). [Google Scholar]
19. Chang, H. R., Li, C., Li, Y. N. (2021). Research on safety assessment of transmission tower line system under wind and ice load. Electric Power Science and Engineering, 37(1), 53–61 (In Chinese). [Google Scholar]
20. Qi, W. Y., Ye, F., Qi, W. Y., Li, T., Guan, S. S. et al. (2020). Stability evaluation of transmission tower above the goaf by fuzzy comprehensive evaluation method and analytic hierarchy process. Journal of Physics: Conference Series, 1633, 012058. [Google Scholar]
21. Natarajan, K., Santhakumar, A. R. (1995). Reliability-based optimization of transmission line towers. Computers and Structures, 55(3), 387–403. [Google Scholar]
22. Edgar, T., Sordo, E. (2017). Structural behaviour of lattice transmission towers subjected to wind load. Structure and Infrastructure Engineering, 13, 1462–1475. [Google Scholar]
23. Gajan, S., McNames, C. (2010). Improved design of embedment depths for transmission pole foundations subject to lateral loading. Practice Periodical on Structural Design and Construction, 15, 73–81. [Google Scholar]
24. Tong, X. L., Fang, Z. (2020). Reliability analysis of shear capacity of concrete shear walls. Journal of Hunan University (Natural Sciences), 47(5), 14–22 (In Chinese). [Google Scholar]
25. Shao, Y. J. (2006). Calculation formula and its reliability analysis of shear capacity of lightweight aggregate concrete beams. Building Structure, 2006(9), 58–60+96 (In Chinese). [Google Scholar]
26. Xiong, T. H., Hou, J. G., An, X. W., Li, F. (2010). System reliability of a transmission tower under ice load. China Civil Engineering Journal, 43(10), 8–13 (In Chinese). [Google Scholar]
27. DL/T 5219-2014 (2014). Technical code for design of foundation of overhead transmission line (In Chinese). Beijing, China: China Planning Press. [Google Scholar]
28. Shi, M. X., Gao, Q., Liu, J. J., Zhang, J. G. (2014). Study on the mechanism of detecting flaws in the transmission tower foundation by the finite element method. Applied Mechanics and Materials, 3335, 596–596. [Google Scholar]
29. Wang, L. L., Wang, H., Wu, C. X., Xi, P. (2020). Research on a non-destructive testing technology for the foundation of transmission tower based on Rayleigh wave method. IOP Conference Series: Earth and Environmental Science, 558(3), 032037. [Google Scholar]
30. Xu, G., Fei, H. F., Liu, D. F., Wang, Q., Wei, J. (2011). Prediction model on the rebar corrosion depth in concrete. Journal of Building Materials, 14(6), 844–849 (In Chinese). [Google Scholar]
31. Vidal, T., Castel, A., François, R. (2004). Analyzing crack width to predict corrosion in reinforced concrete. Cement and Concrete Research, 34, 165–174. [Google Scholar]
32. Pidgurskyi, I., Stashkiv, M., Pidgurskyi, M., Rudyak, R., Ripetskyi, Y. et al. (2022). Prediction of residual durability of structural elements with identical surface cracks taking into account the stage of their coalescence. Procedia Structural Integrity, 36, 190–196. [Google Scholar]
Cite This Article
 Copyright © 2024 The Author(s). Published by Tech Science Press.
This work is licensed under a Creative Commons Attribution 4.0 International License , which permits unrestricted use, distribution, and reproduction in any medium, provided the original work is properly cited.
 Downloads
 Citation Tools