
 Submit a Paper
 Propose a Special lssue
 Open Access
ARTICLE

Influence of Confined Concrete Models on the Seismic Response of RC Frames
Department of Civil Engineering, EPOKA University, Tirana, 1039, Albania
* Corresponding Author: Hüseyin Bilgin. Email:
Structural Durability & Health Monitoring 2024, 18(3), 197-222. https://doi.org/10.32604/sdhm.2024.048645
Received 13 December 2023; Accepted 13 March 2024; Issue published 15 May 2024
 View Full Text
 Download PDF
Abstract
In this study, the influence of confined concrete models on the response of reinforced concrete structures is investigated at member and global system levels. The commonly encountered concrete models such as Modified Kent-Park, Saatçioğlu-Razvi, and Mander are considered. Two moment-resisting frames designed according to the pre-modern code are taken into consideration to reflect the example of an RC moment-resisting frame in the current building stock. The building is in an earthquake-prone zone located on Z3 Soil Type. The inelastic response of the building frame is modelled by considering the plastic hinges formed on each beam and column element for different concrete classes and stirrups spacings. The models are subjected to non-linear static analyses. The differences between confined concrete models are comparatively investigated at both reinforced concrete member and system levels. Based on the results of the comparative analysis, it is revealed that the column behaviour is mostly influenced by the choice of model, due to axial loads and confinement effects, while the beams are less affected, and also it is observed that the differences exhibited in the moment-curvature response of column cross-sections do not significantly affect the overall behaviour of the global system. This highlights the critical role of model selection relative to the concrete strength and stirrup spacing of the member.Keywords
Concrete is the most used material in construction due to its strength, durability, and versatility. It possesses excellent compressive strength, but it also has limited resistance to tensile forces.
To better understand and predict the behaviour of concrete, researchers have developed various concrete models that attempt to capture the complex interactions between the concrete, reinforcement, and external confining pressures. They are mathematical representations of the behaviour of concrete under different loading conditions used to simulate the stress-strain relationship, the failure criteria, and the post-failure behaviour of concrete elements in structural analysis. Some proposed concrete models are by Richart et al. [1], Roy et al. [2], Kent et al. [3], Scott et al. [4], Sheikh et al. [5], Fafitis et al. [6], Yong et al. [7], Mander et al. [8], Saatçioğlu et al. [9], Cusson et al. [10], El-Dash et al. [11], Hoshikuma et al. [12], Mansur et al. [13], and Assa et al. [14].
There has been a notable trend in recent decades, particularly in the assessment of seismic behaviour of existing structures, towards displacement-based analysis methods instead of force-based methods. These methods consider the non-linear behaviour of structures, enabling more realistic results to be obtained. The structural elements, and consequently the non-linear behaviour of the structure, are modelled using plastic hinges determined according to the element properties [15]. Therefore, determining the behaviour of plastic hinges is a crucial part of the analysis for estimating the structure’s behaviour.
Reinforced concrete is a composite material that combines the compressive strength of concrete with the tensile strength of steel reinforcement. When a beam is subjected to vertical loads or a column is subjected to eccentric axial and lateral loads, it experiences flexural stresses that cause cracks to the region in tension [16] and shear stresses that cause cracks near the supports.
By incorporating longitudinal reinforcement at the regions with high tensile stress concentration, the capacity to withstand tensile forces is significantly enhanced, thus preventing the formation of cracks. Unconfined concrete is mostly used in foundations, pavements, and walls, where the shear stresses are minimal; and confined concrete is used in structural members that are subject to bending and shear stresses.
Similarly, by confining the longitudinal reinforcement using transverse reinforcement, the resistance to shear forces is increased. In contrast to unconfined concrete, confined concrete exhibits a ductile failure due to the presence of lateral reinforcement [17].
The stress-strain relationship is the fundamental concept in the mechanics of a material. It describes the deformation of a material when a load is applied to it. Fig. 1 demonstrates the stress-strain relationship of brittle, ductile, and plastic materials. Strain is the ratio of change in the length of the body.
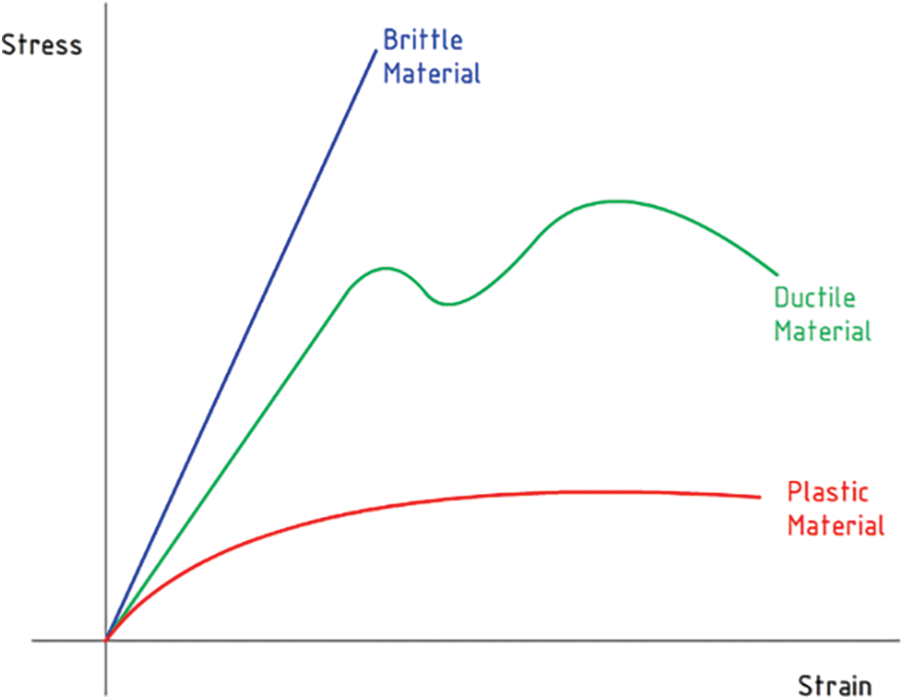
Figure 1: The relationship for different types of materials
The stress-strain relationship for concrete is obtained by the Concrete Compression Test. The test is conducted 28 days after the concrete is set, due to it reaching 99% of its strength. A cylindrical (150 mm × 300 mm) or cubic (150 mm × 150 mm × 150 mm) sample is placed inside the Compression Test Machine and is placed under a constantly increasing load until it fails [18]. Due to the ease of drilling on-site and flexibility, the cylindrical shape is the most widely used for the specimen. The cylindrical specimen’s strength is usually 10%–20% less than the equivalent cube specimen.
The stress-strain curve for unconfined concrete has three regions, the linear ascending curve that represents the elastic phase, the peak point, the non-linear descending curve that represents the plastic phase, and the descending curve that represents failure [19].
Additionally, the stress-strain curve for confined concrete exhibits a higher strain value before failure, indicating greater ductility. This means that confined concrete can undergo more significant deformation before reaching its ultimate failure point. The curve for confined concrete shows a more gradual descent after the peak stress, unlike the sharp drop observed in the unconfined concrete section.
4 Global and Local System Levels
To analyse the safety of a structure, we need to consider the Local to Global levels relationship of the structure. Starting with the first level of the hierarchy, material, we need to understand and predict the behaviour of concrete from its stress-strain relationship. From the curve, the elastic limit where concrete transitions from elastic to plastic phases can be determined. The plastic phase is non-linear and involves cracking and crushing of concrete.
Moving to the next section level, the moment-curvature relationship describes how the cross-section deforms in response to applied moments. It determines the location and rotation of plastic hinges, which are the regions where concrete has cracked (determined from the stress-strain relationship) and steel has yielded. The plastic hinges indicate the loss of stiffness and strength of the section.
The next level is the member/connection level. As previously stated, concrete will undergo elastic deformation, reach its elastic limit, and then go to plastic deformation. This plastic deformation is concentrated in plastic hinges, which are critical points of failure. The plastic hinges affect the ductility and stability of the member and connection, as well as their energy dissipation capacity.
Finally, at the system level, the non-linear static pushover analysis of roof displacement vs. base shear is performed. This displacement-based method considers the non-linear behaviour of the material for more realistic results. It helps evaluate the global performance of the system under different load levels and patterns and locate the plastic hinges [15].
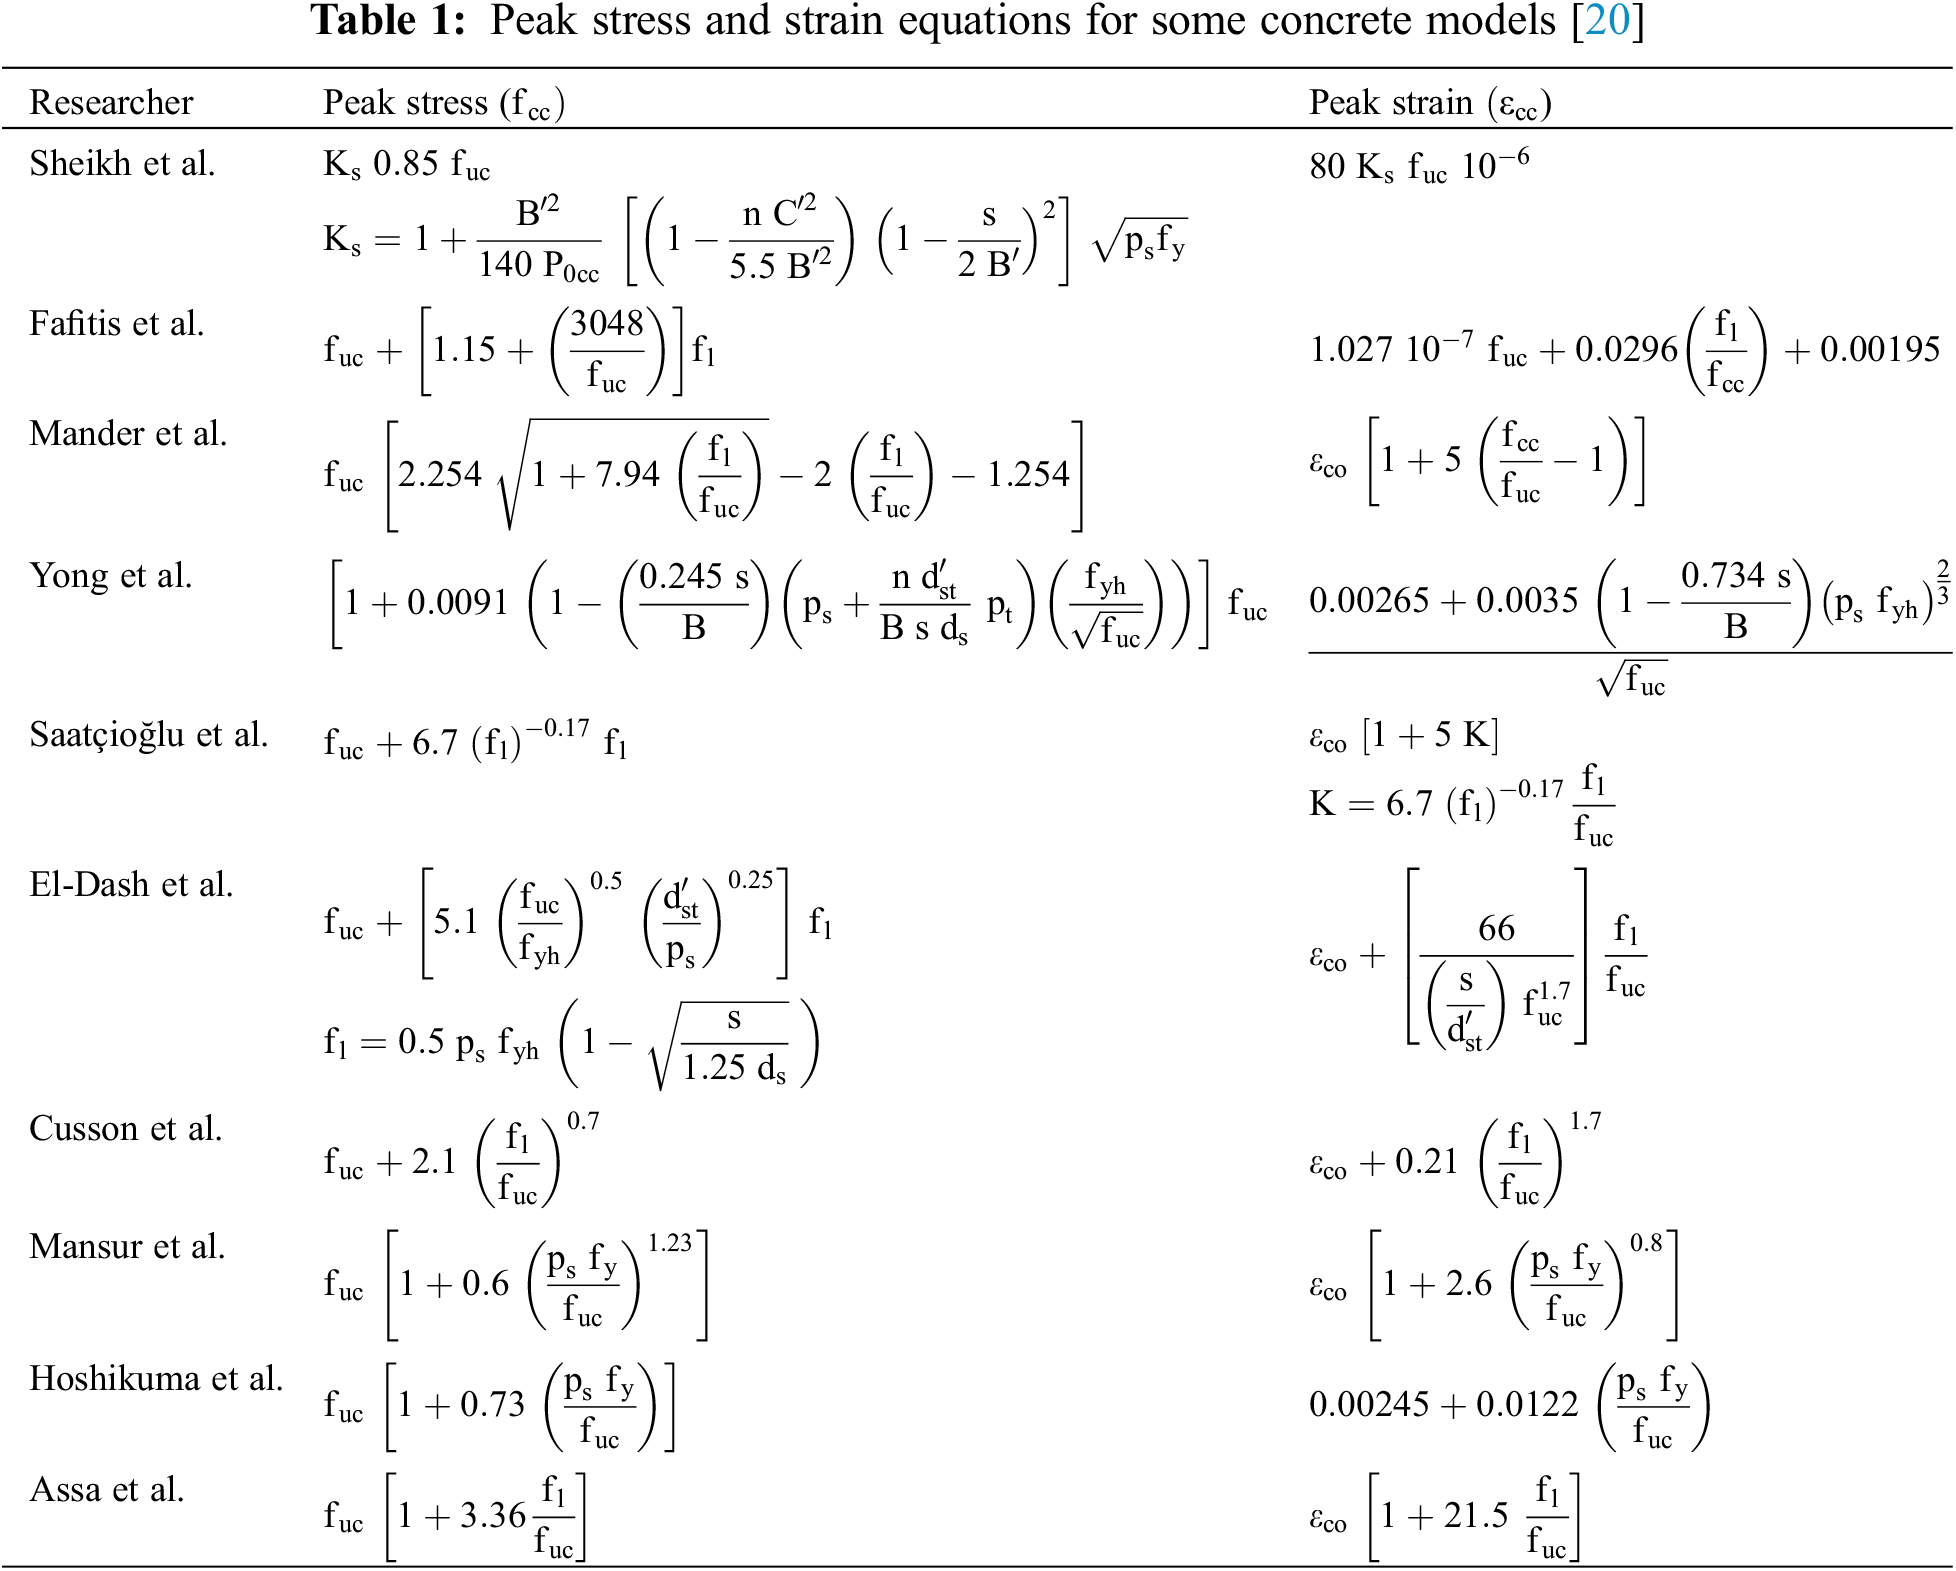
The stress-strain curve of concrete is influenced by numerous components, making it impossible to define a single curve for each case, especially for the non-linear phase. Thus, researchers have proposed different concrete models that describe the behaviour of concrete using empirical equations. The stress-strain relationship for some concrete models is shown in Table 1.
The Modified Kent-Park Model is based on the original Kent-Park Model by taking into consideration the change in concrete strength due to the confinement, as shown in Fig. 2. The maximum stress and strain are at point B [21,22].
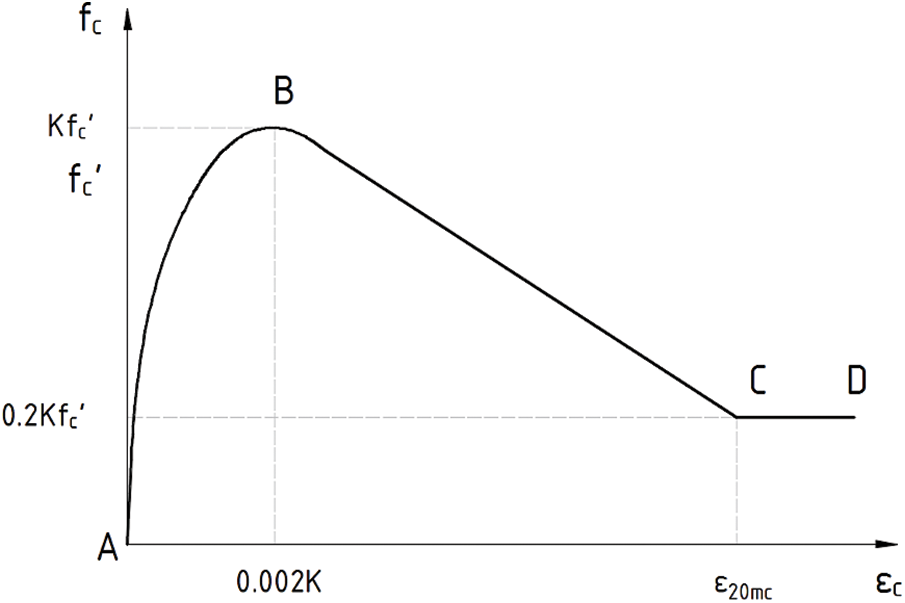
Figure 2: Stress-strain relationship for concrete proposed by Kent and Park
where
• Region AB, where
• Region BC, where
where
• Region CD, where
The stress–strain relationship will change due to the hysteresis behaviour of concrete when it experiences repeated load cycles.
Saatçioğlu and Razvi proposed a model based on uniform confinement pressure caused by transverse reinforcement. This model can be applied to both circular and rectangular sections [23]. This model consists of a parabolic rising curve and a linear decreasing curve up to 20% of the concrete’s strength, as shown in Fig. 3.
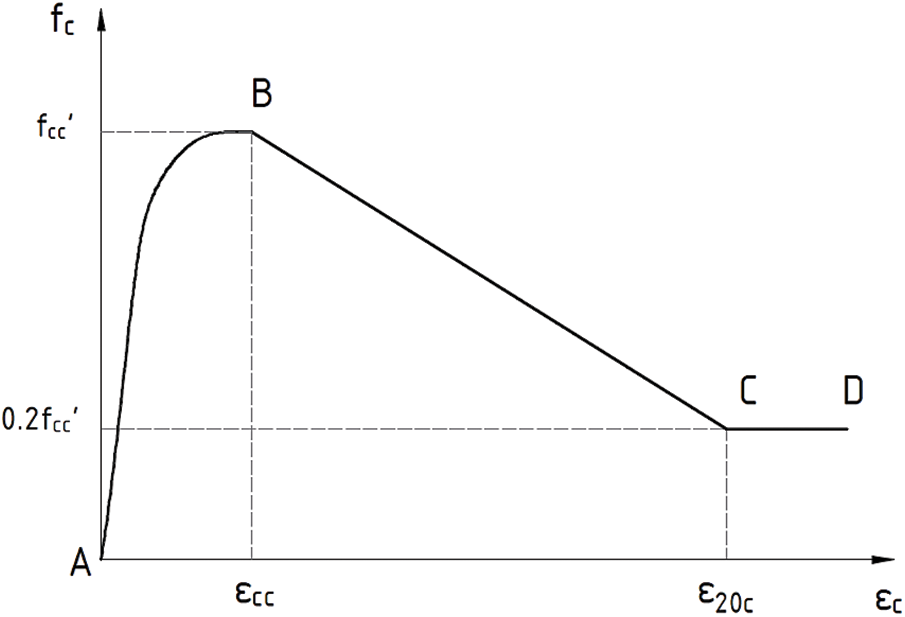
Figure 3: Stress-strain relationship of confined concrete proposed by Saatçioğlu and Razvi [9]
The parabolic curve can be expressed by Eqs. (15) and (16):
For circular sections:
For rectangular sections:
For square sections:
where
The descending linear curve can be expressed from the strain corresponding to 85% of the concrete’s strength:
where
One of the most widely used confined concrete models is the Mander model. It is used as the default model in a lot of structural engineering software, such as SAP2000 [24]. Mander proposed a unified stress-strain model that includes both circular and rectangular confined concrete sections. The stress-strain curve is derived from Popovics’ Equation [25], while the confinement coefficient is like the approach of Sheikh et al. [5]. This model incorporates the effect of arching pressure as the source of confining stress, as shown in Fig. 4.
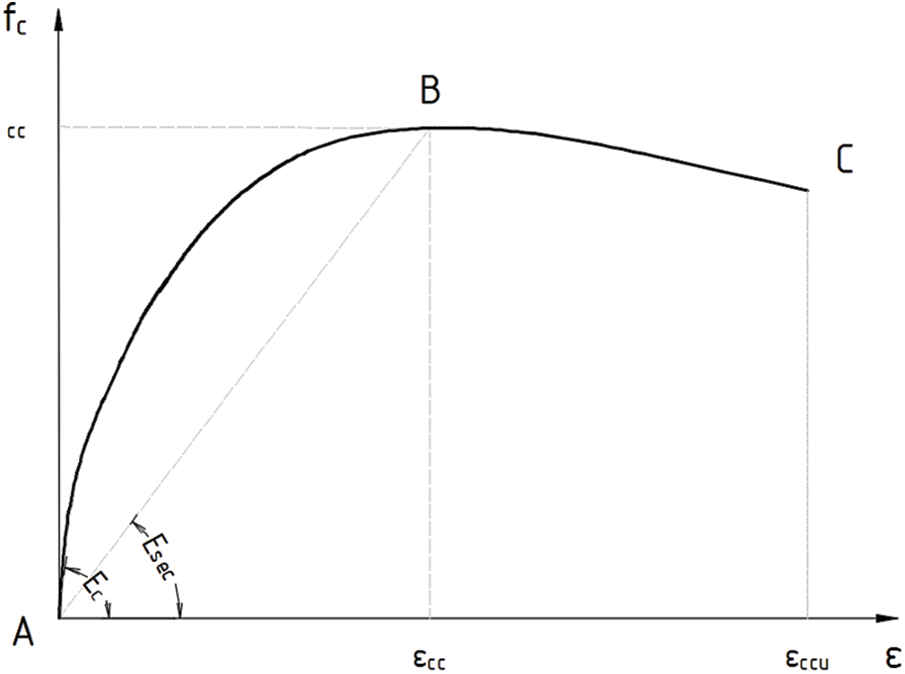
Figure 4: Stress-strain relationship of concrete proposed by Mander
The effective cylinder compressive strength of confined concrete is 0.8 times the cube compressive strength of confined concrete. The thickness and spacing of the transverse reinforcement affect the confining stress and the effective lateral pressure determines the peak cylinder strength [26]. When
where
When experiencing repeated load cycles, the unloading curves follow the same pattern as the monotonic curve until the maximum stress, but the unloading modulus is modified by the stress,
6 Moment-Curvature Relationship
In the analysis of reinforced concrete structures, the deformation of its members is an important factor to consider. The displacement of a member reflects its ability to resist stresses caused by external loads. Therefore, the displacement must be determined accurately and efficiently. Moment-curvature relationship describes how the cross-section deforms in response to applied forces.
Depending on the beam and loading conditions, the equation of the elastic curve can be derived and take various forms. Some examples are shown in Table 2.
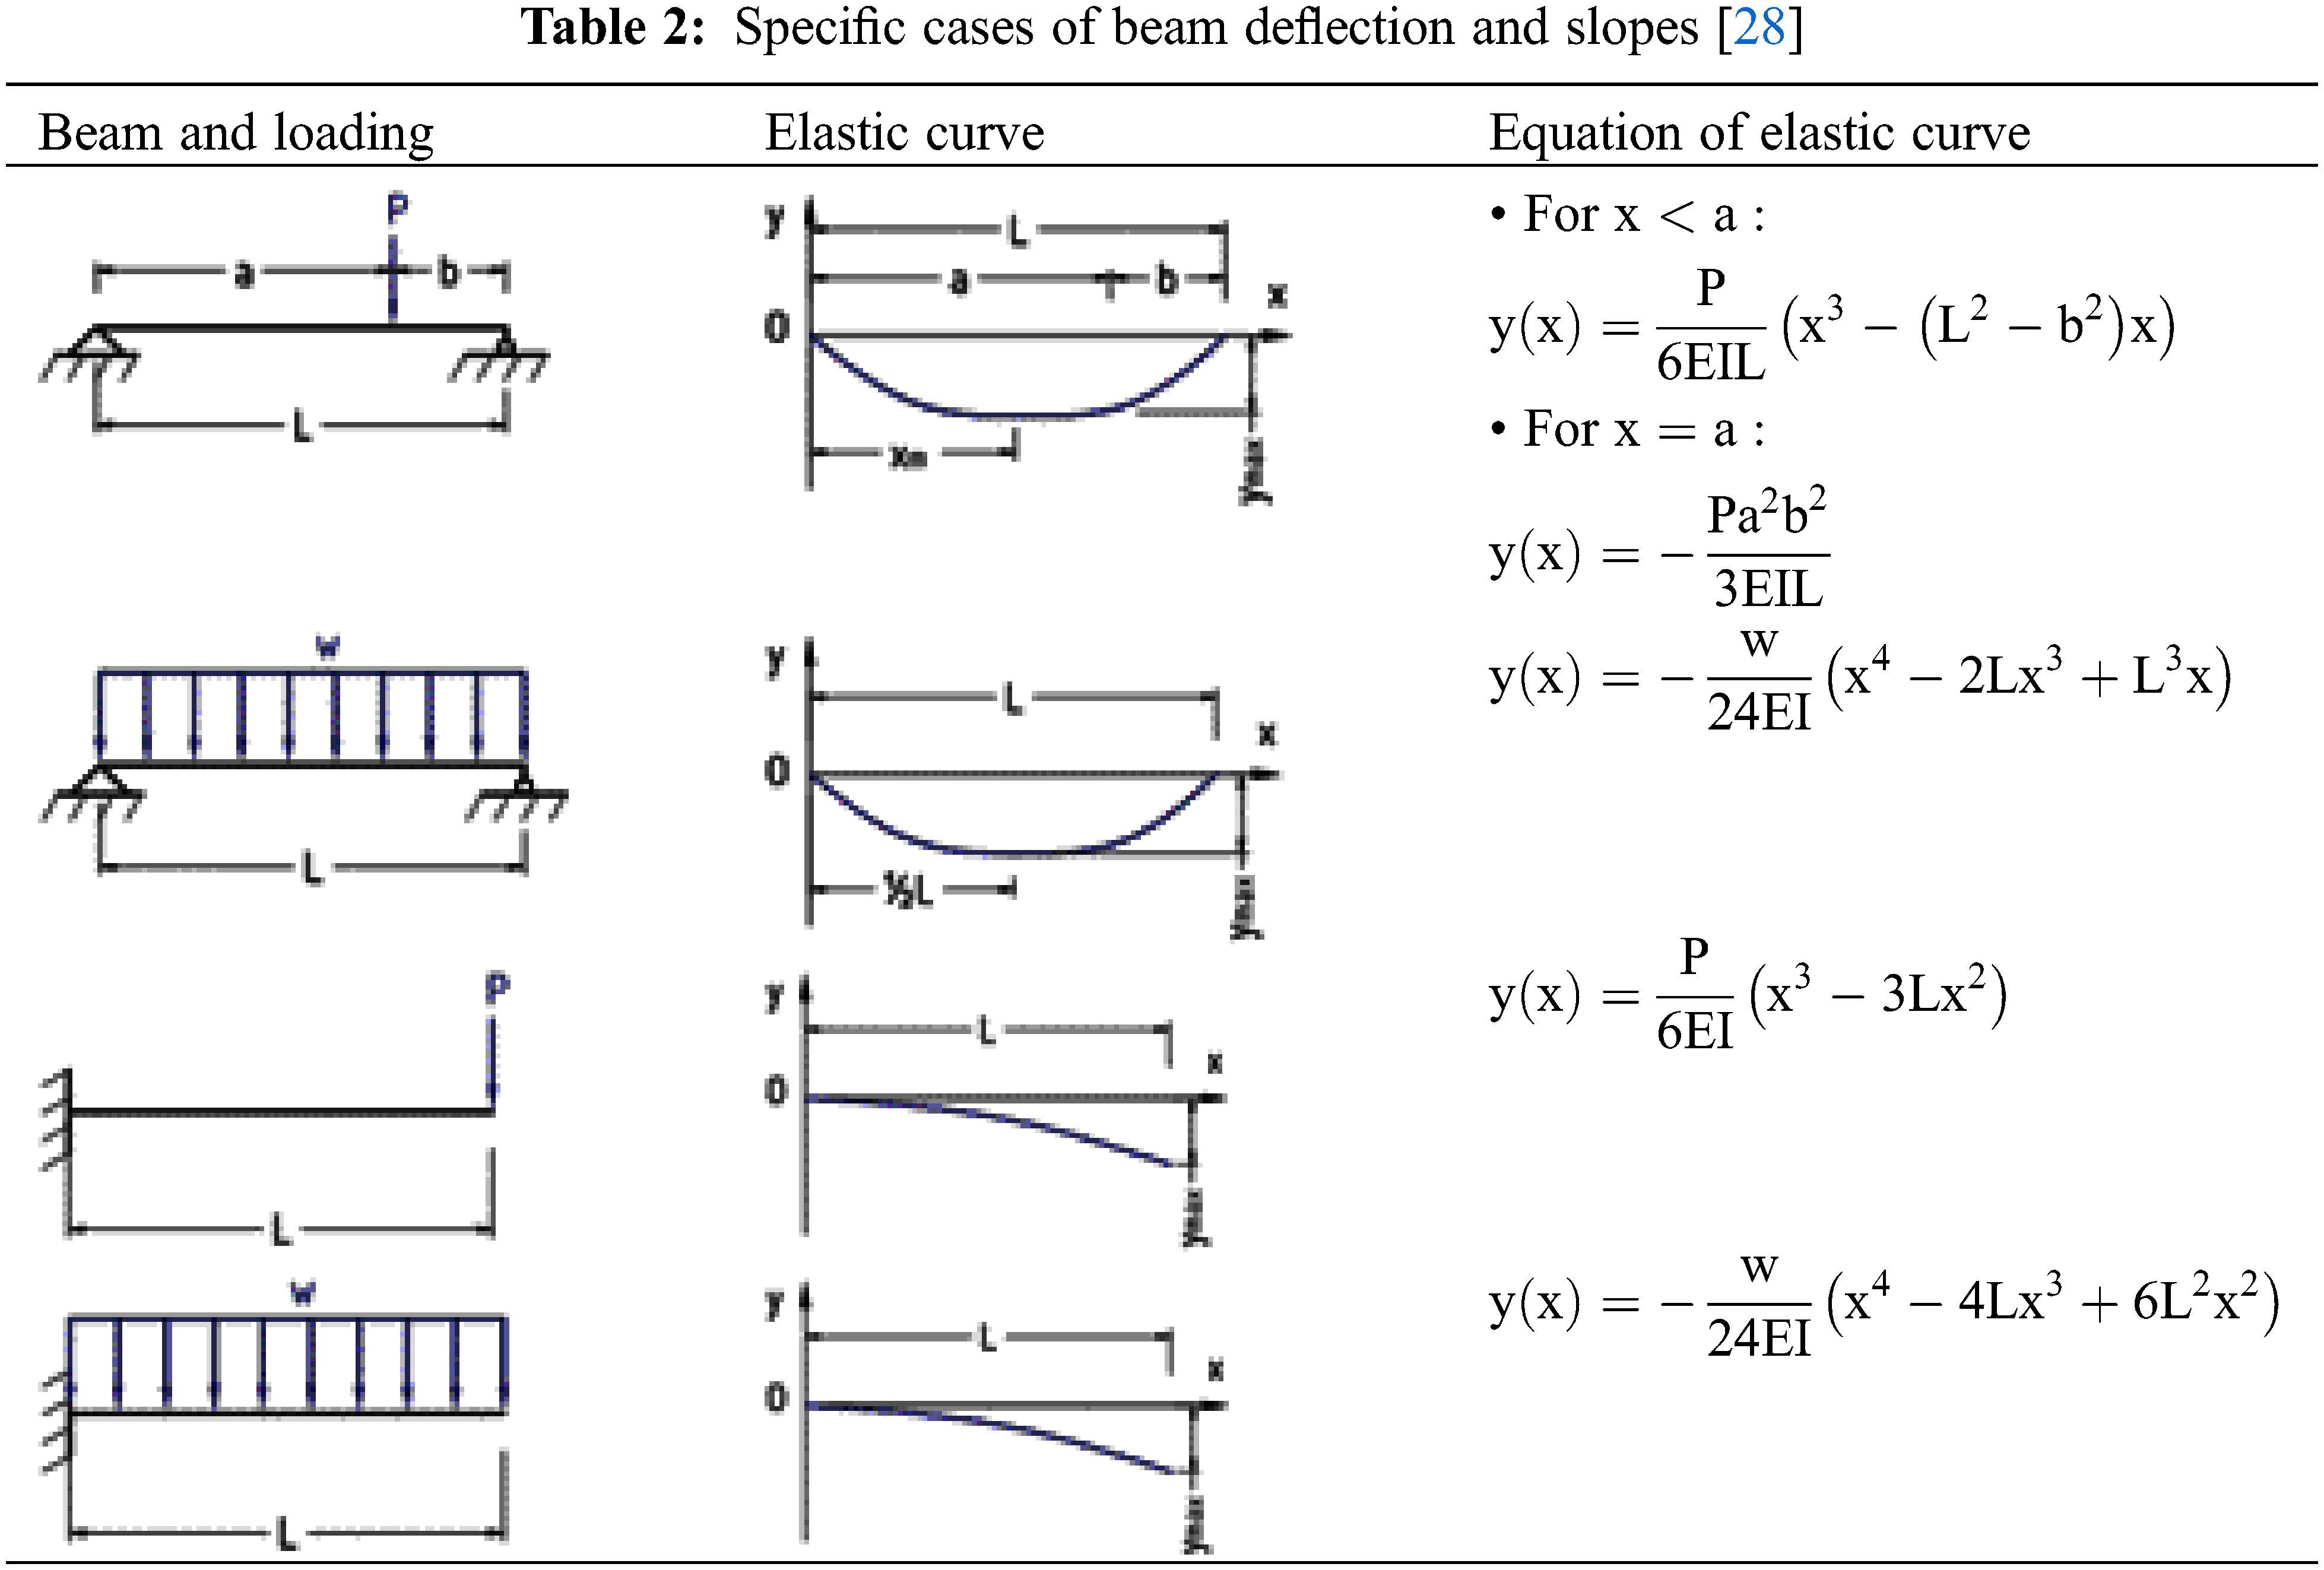
By integrating the equation of the elastic curve successively, the Shear
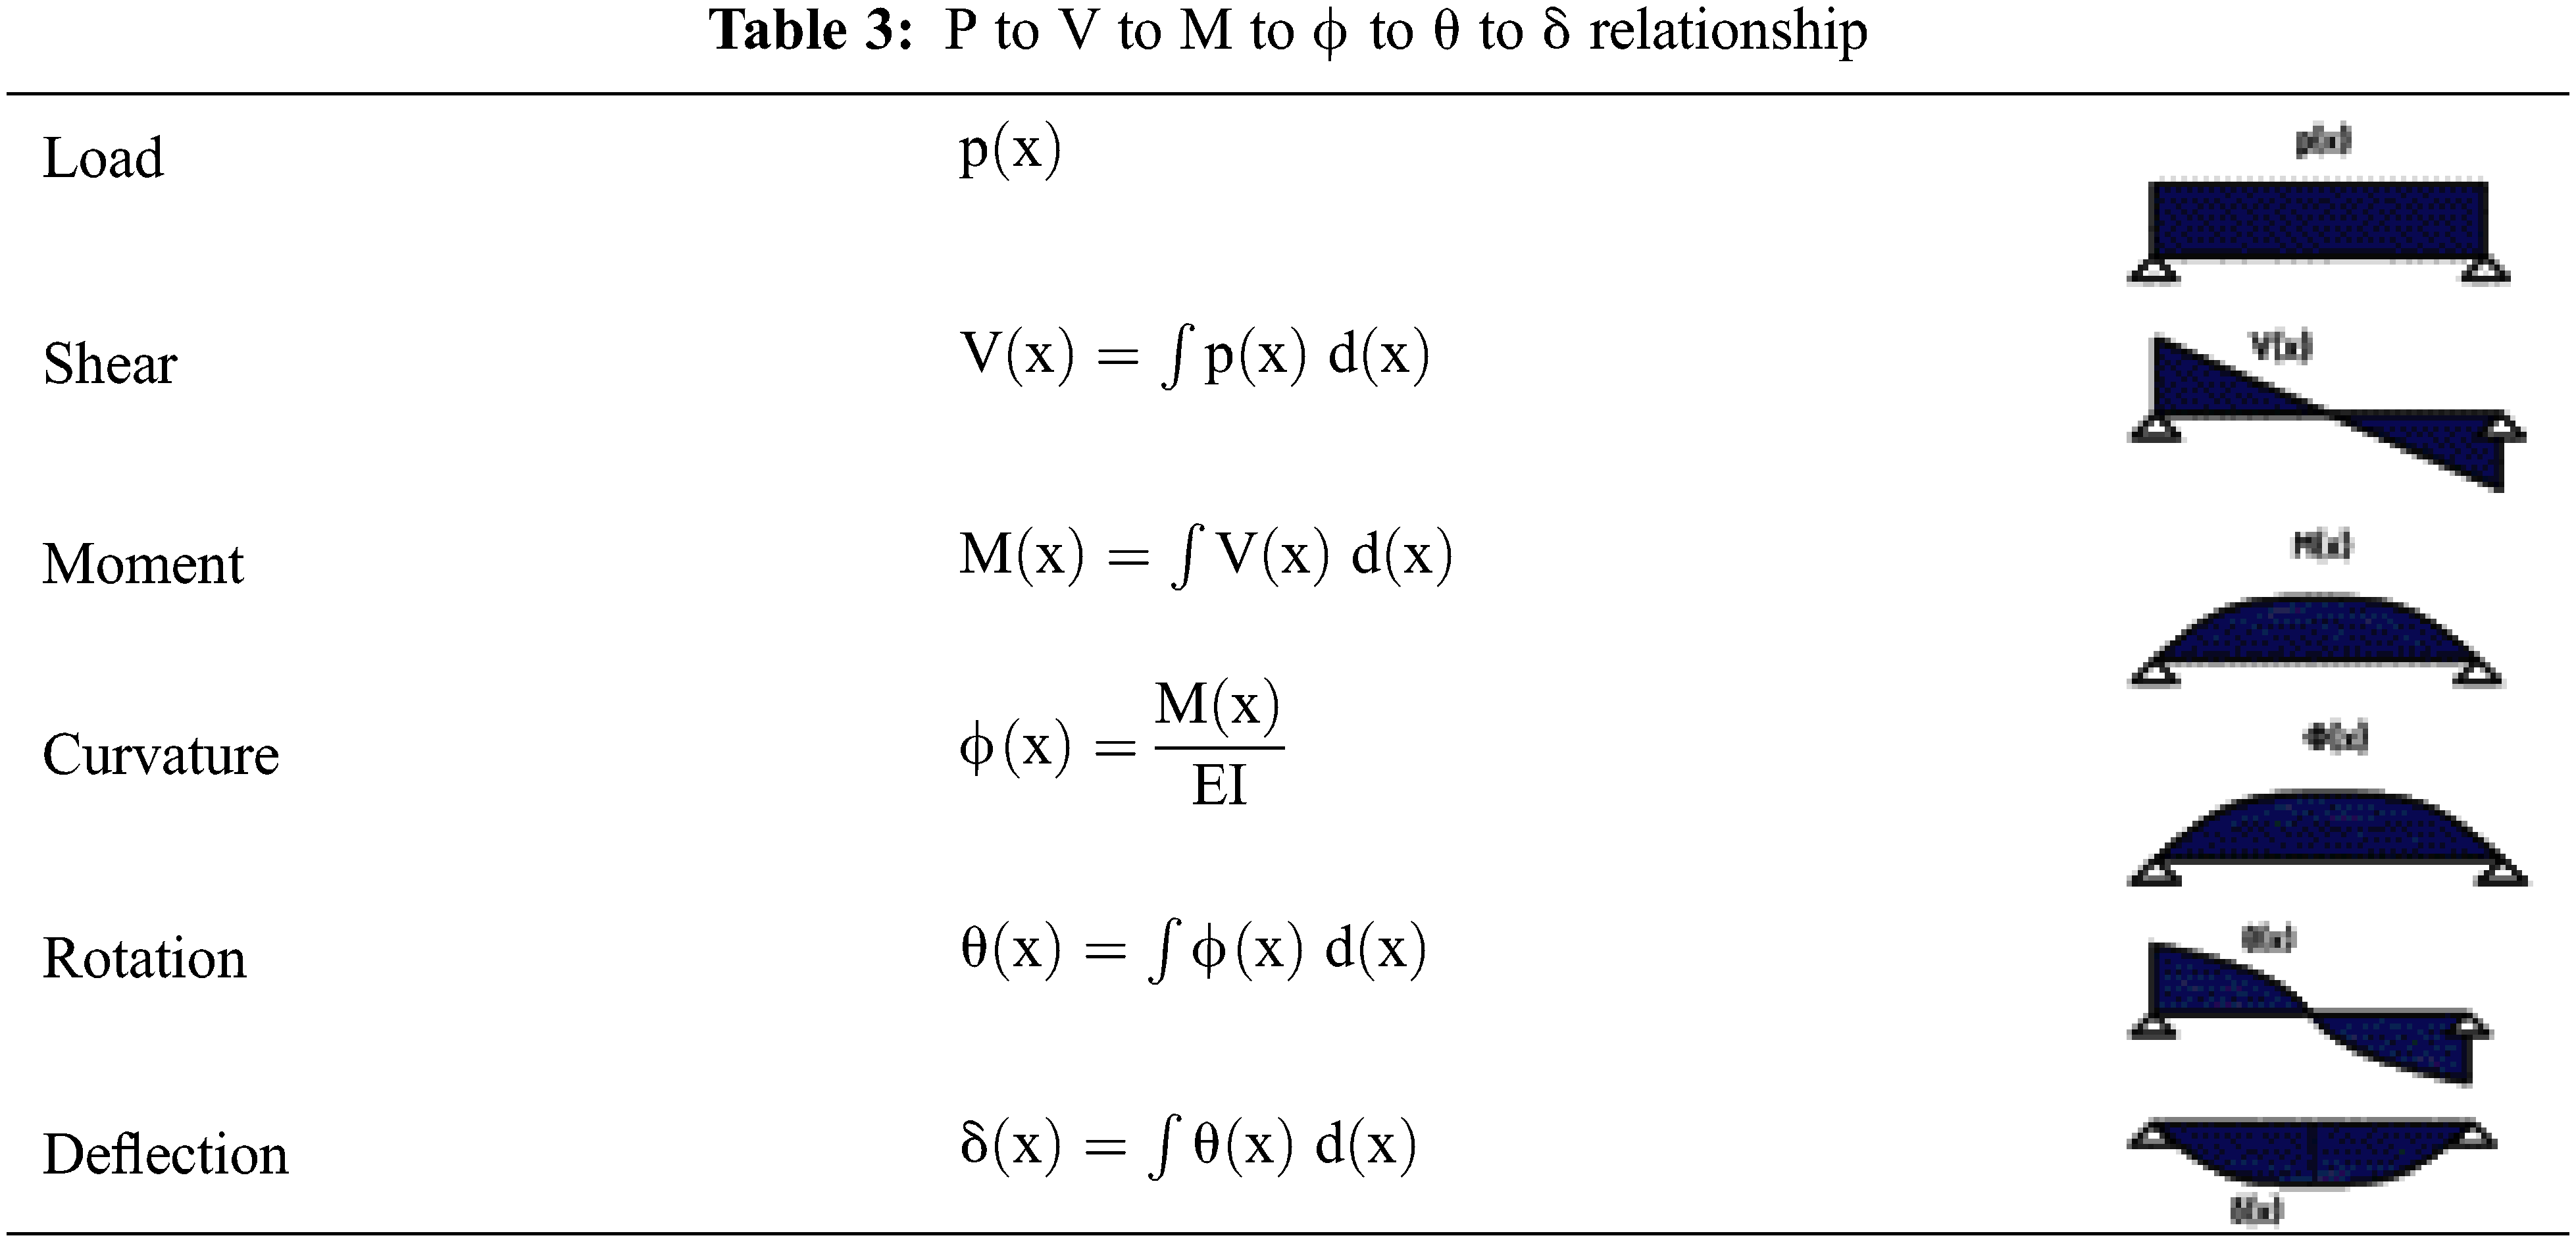
The Moment-Curvature relationship is analysed at the section system level, which means that only the section properties, such as the geometry, material, and reinforcement, are required to be known to perform the analysis.
6.1 The Presence of Compressive Reinforcement
Let us consider the following cross-section and calculate the moment-curvature according to the Kent-Park model when compressive reinforcement is absent and present. The data is given in Fig. 5.
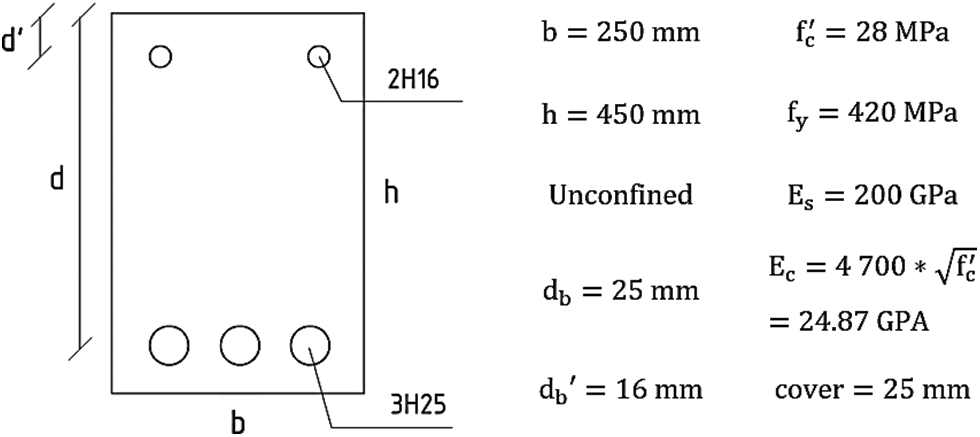
Figure 5: Example of an unconfined concrete section
The moment and curvature values for each critical point are calculated and demonstrated in Table 4.
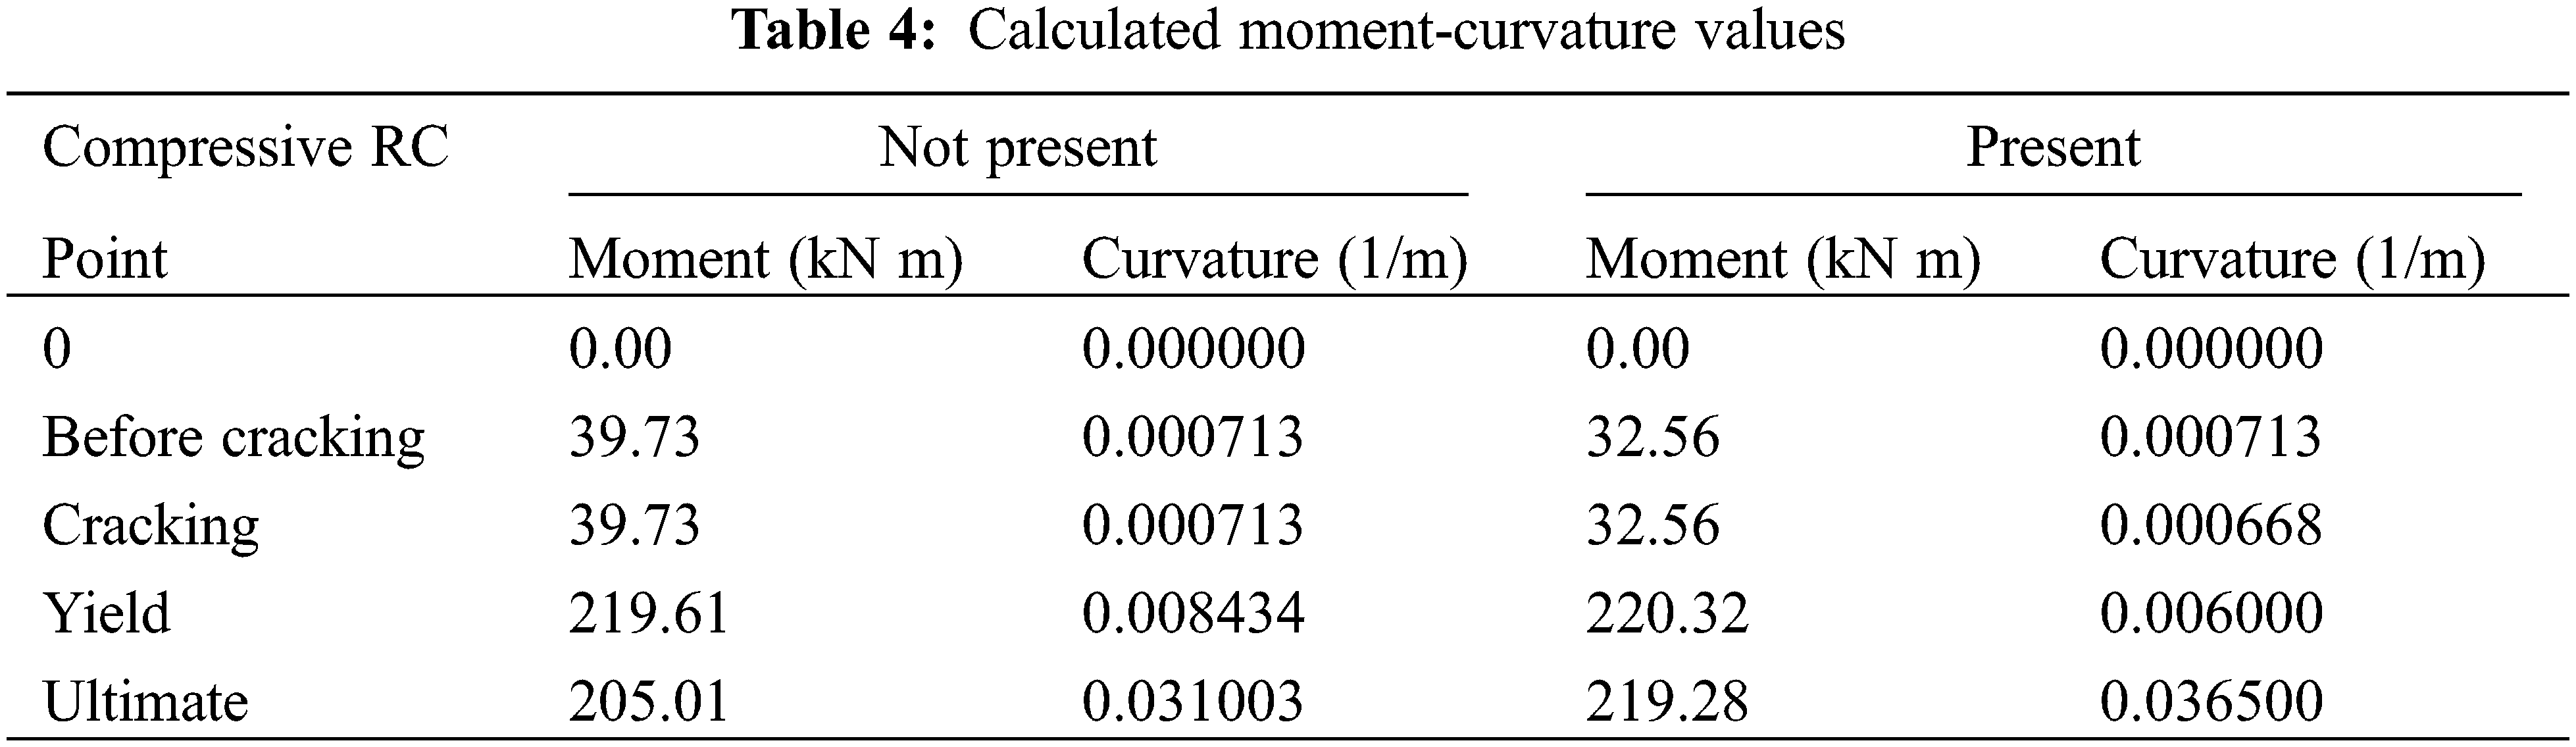
The shape of the moment-curvature curve can be observed from Fig. 6. The presence of compressive longitudinal reinforcement increases the moment capacity slightly compared to the case without compressive reinforcement, as stated earlier.
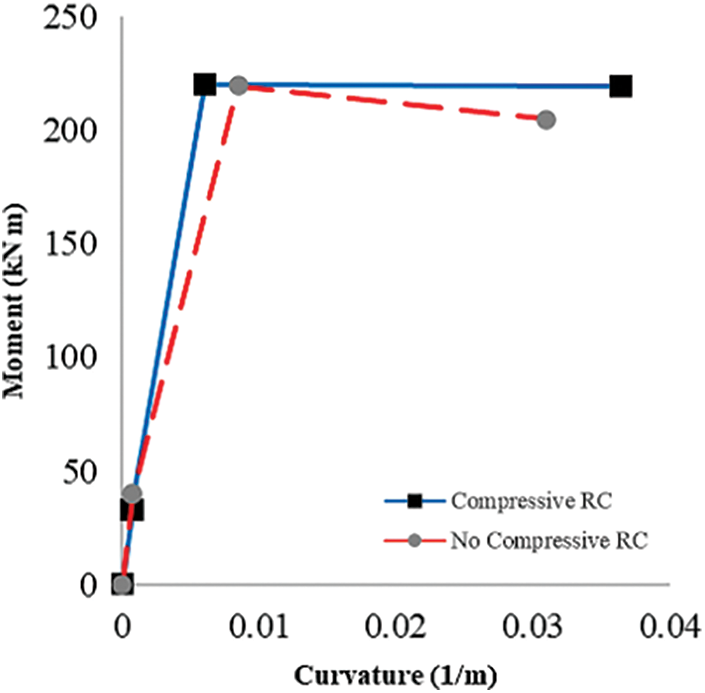
Figure 6: Graphic representation of the moment-curvature data
6.2 The Presence of Transverse Reinforcement
To improve the ductility and shear performance of the member the longitudinal reinforcement is confined with transverse reinforcement, such as steel stirrups. A confinement zone will be formed in the cross-section, as shown in Fig. 7. The role of confinement is especially evident in enhancing the shear strength of columns [29].
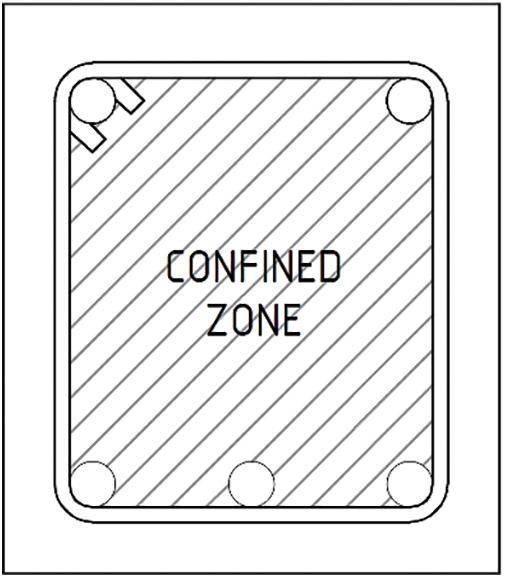
Figure 7: Confined beam section
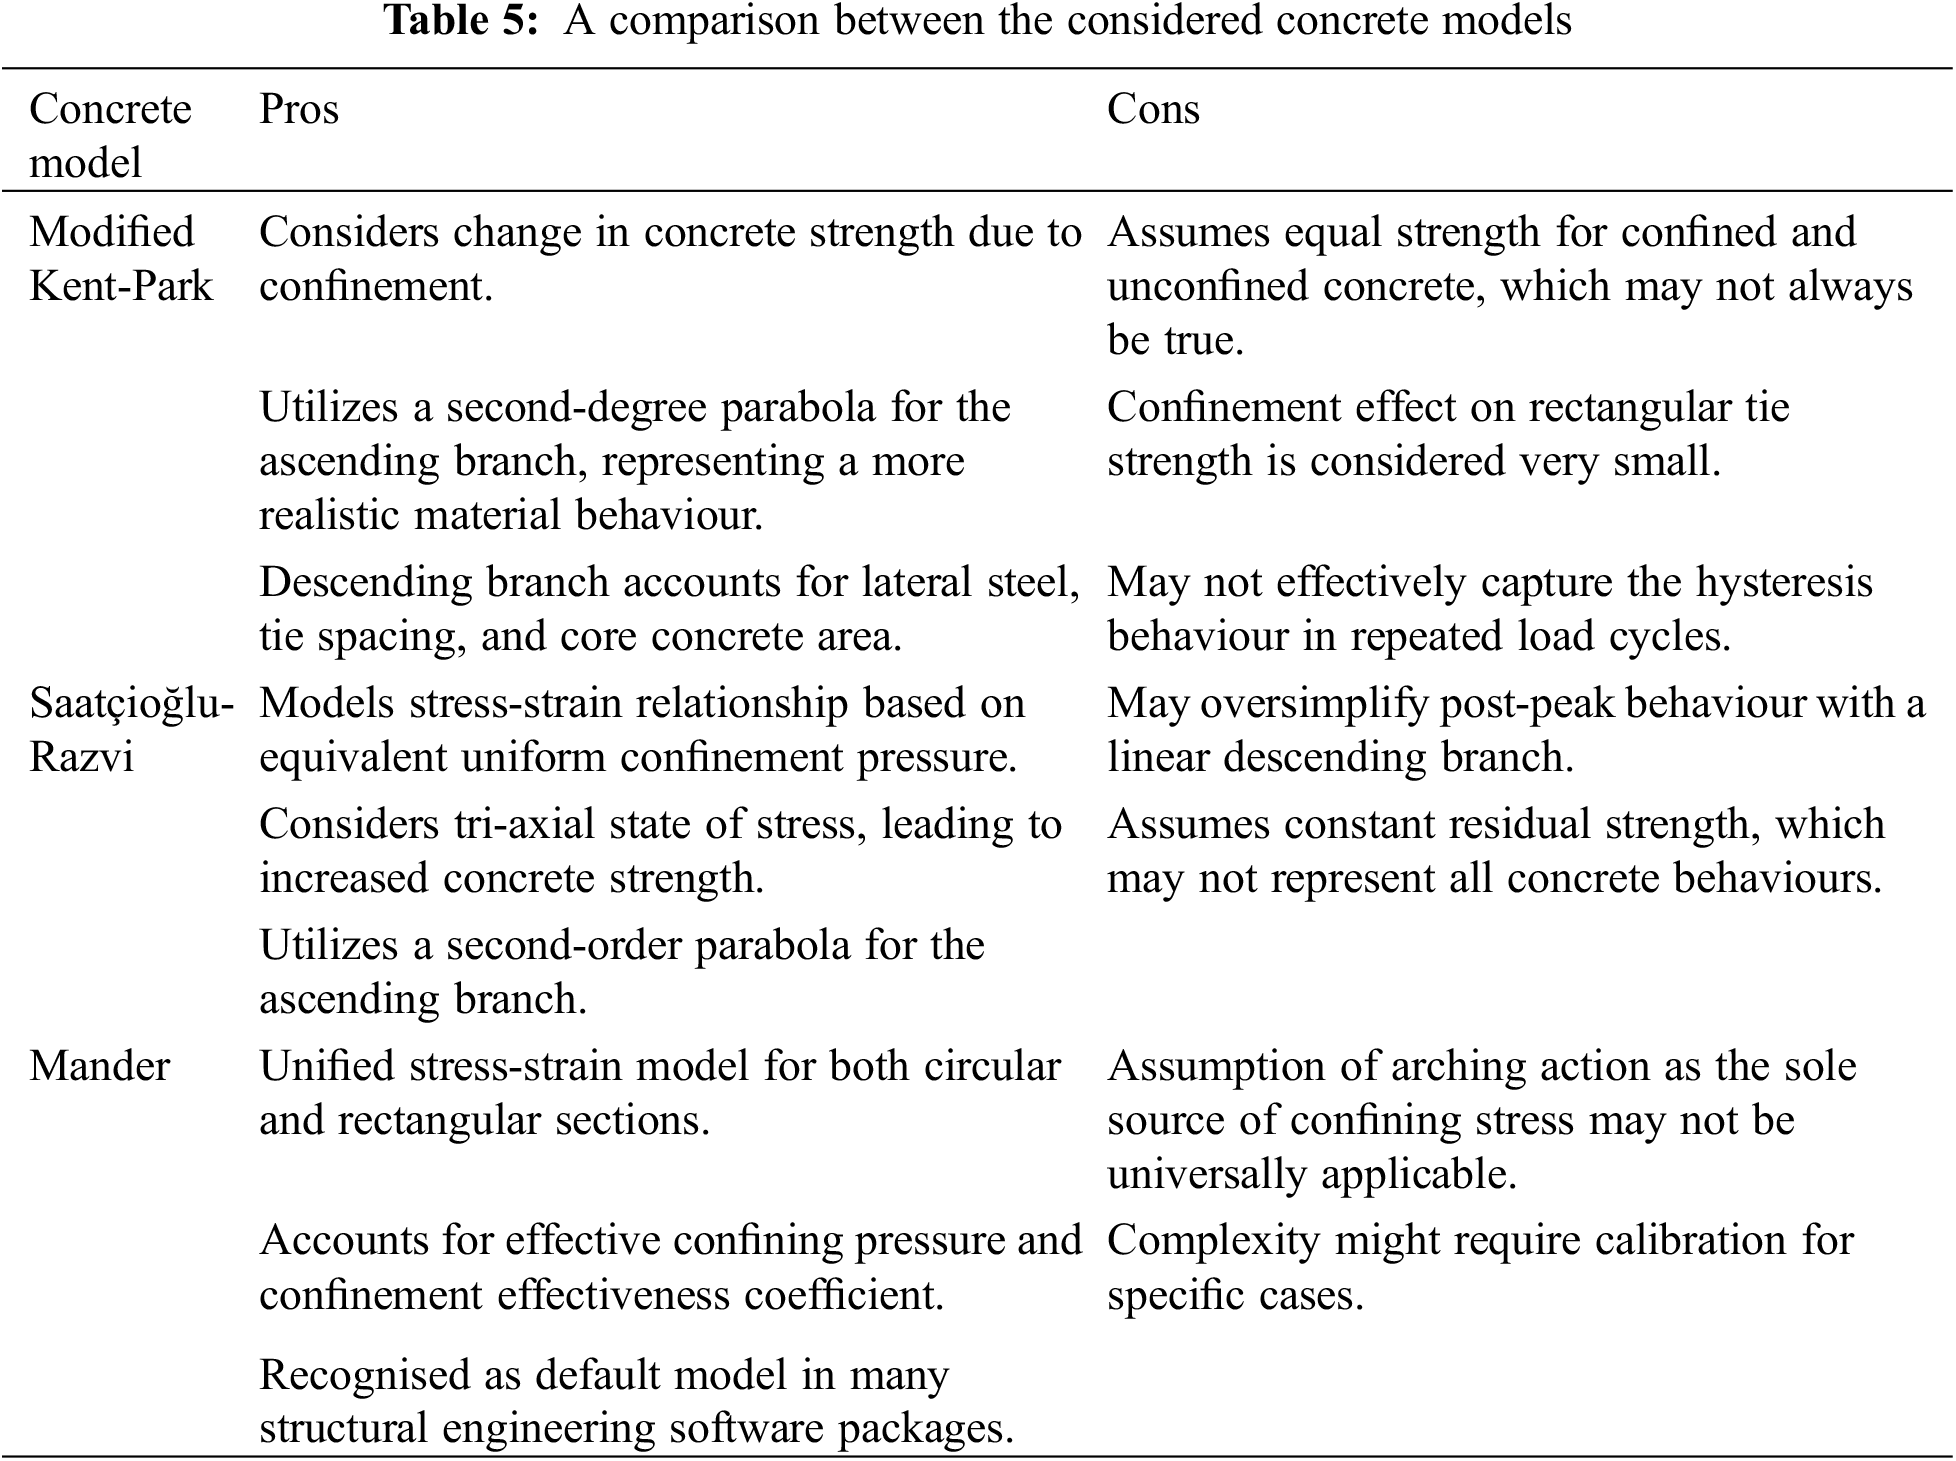
The procedure for determining the moment-curvature relationship of confined concrete sections depends on the stress-strain relationship, which is determined by the selection of the proposed concrete models. The geometry, confinement of the section, time when the structure was built, the software package used and more as shown in Table 5, can be some of the factors affecting this choice.
7 Moment-Rotation Relationship
Plastic hinges are lumped masses where the concentration of the plastic deformation is accumulated due to bending. These regions are formed when steel reaches its yield point, and their location is determined by the moment-curvature relationship of the cross-section. The moment-rotation relationship describes the behaviour of the member due to bending.
The rotation of the member is determined by the integration of the curvature along the length of the member, including the elastic and plastic regions.
where θ is the rotation angle; φ is the curvature length;
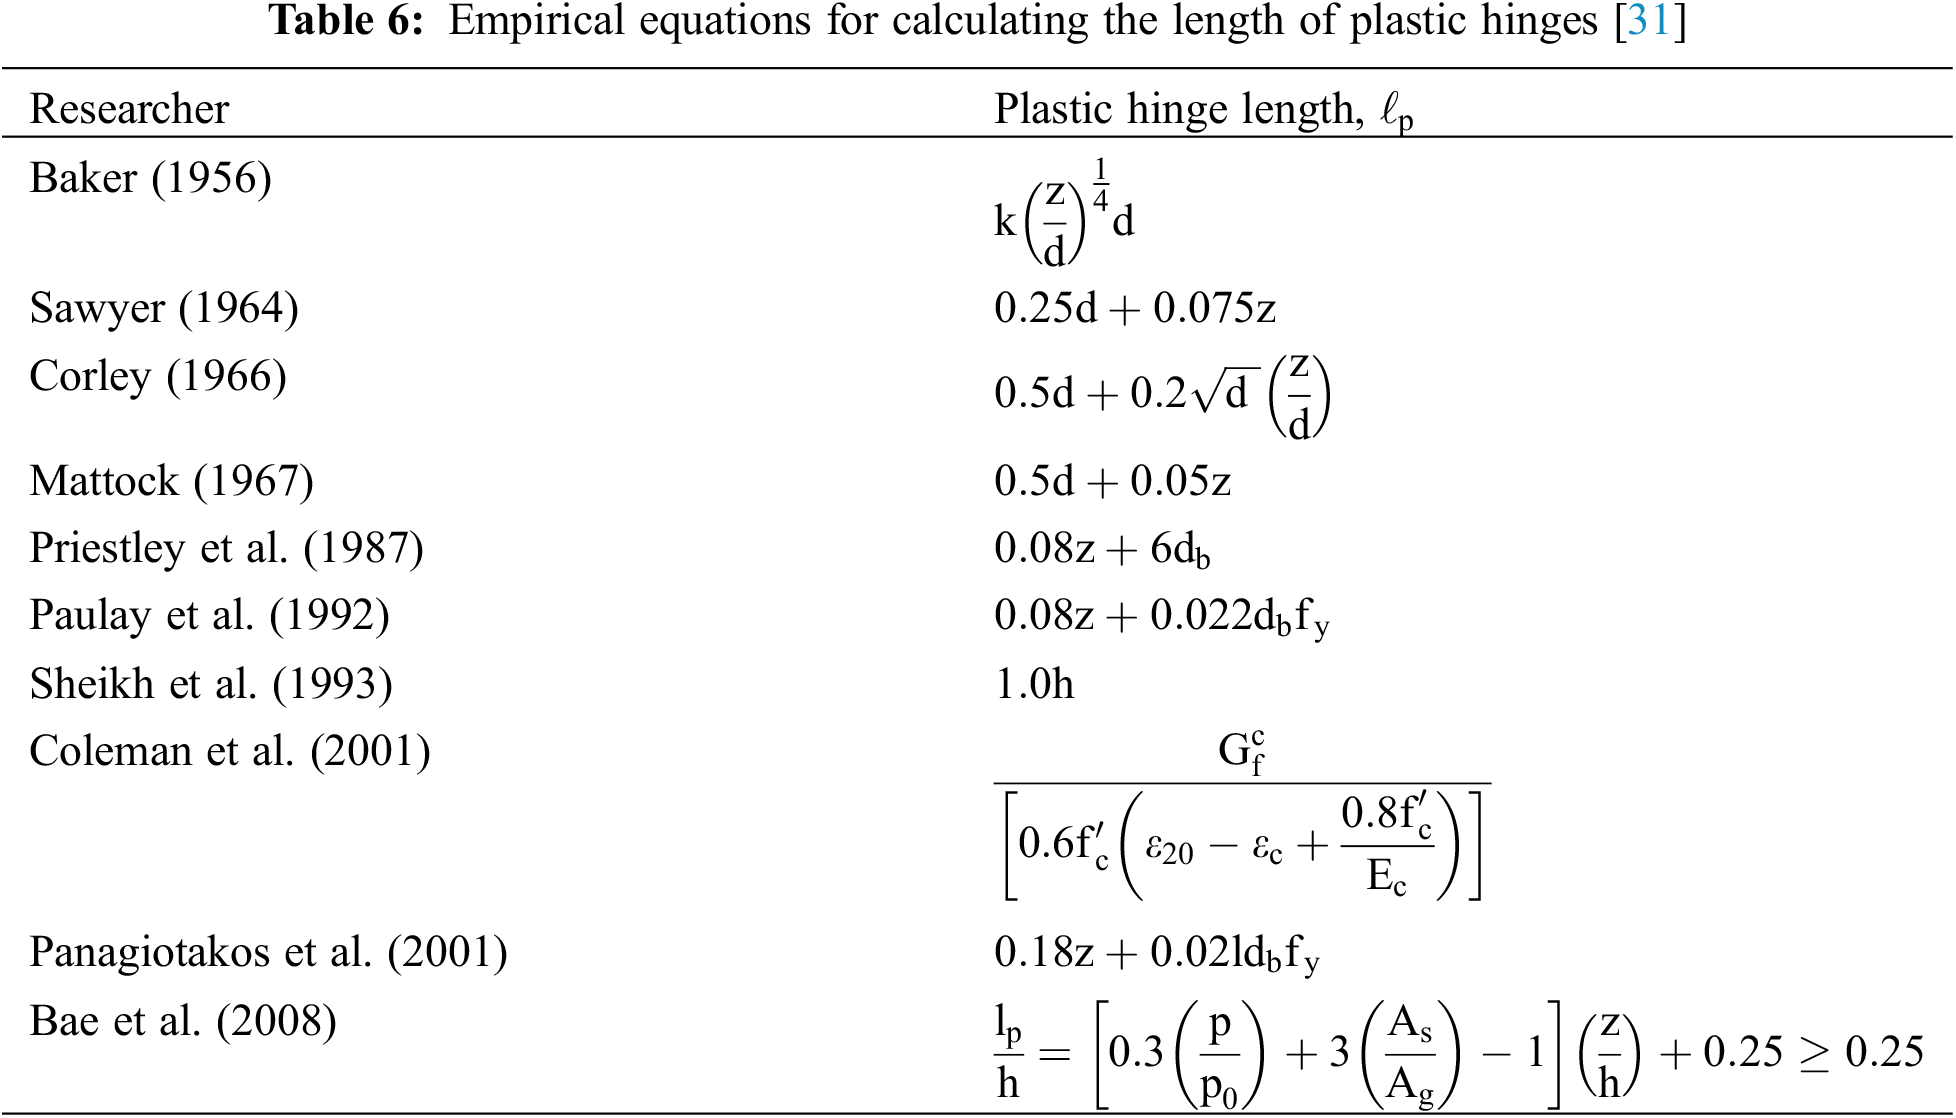
There is still no compromise on the best way to estimate the length of plastic hinges, thus researchers have proposed empirical formulas for different types of reinforced concrete beams and columns, as shown in Table 6. The variables that affect the plastic hinge length include the degree of confinement, amount of shear stresses across the supports, support to point of contraflexure distance, longitudinal reinforcement, axial forces at the section, and the maximum acceptable strain of concrete [21]. Considering the axial load performance in vertical members, it is imperative to acknowledge the effect of the cross-sectional size in the load-carrying capacity, which affects the moment-curvature relationship and consequently the moment-rotation of the member [30].
Where
where
8.1 Four-Storey Residential Building
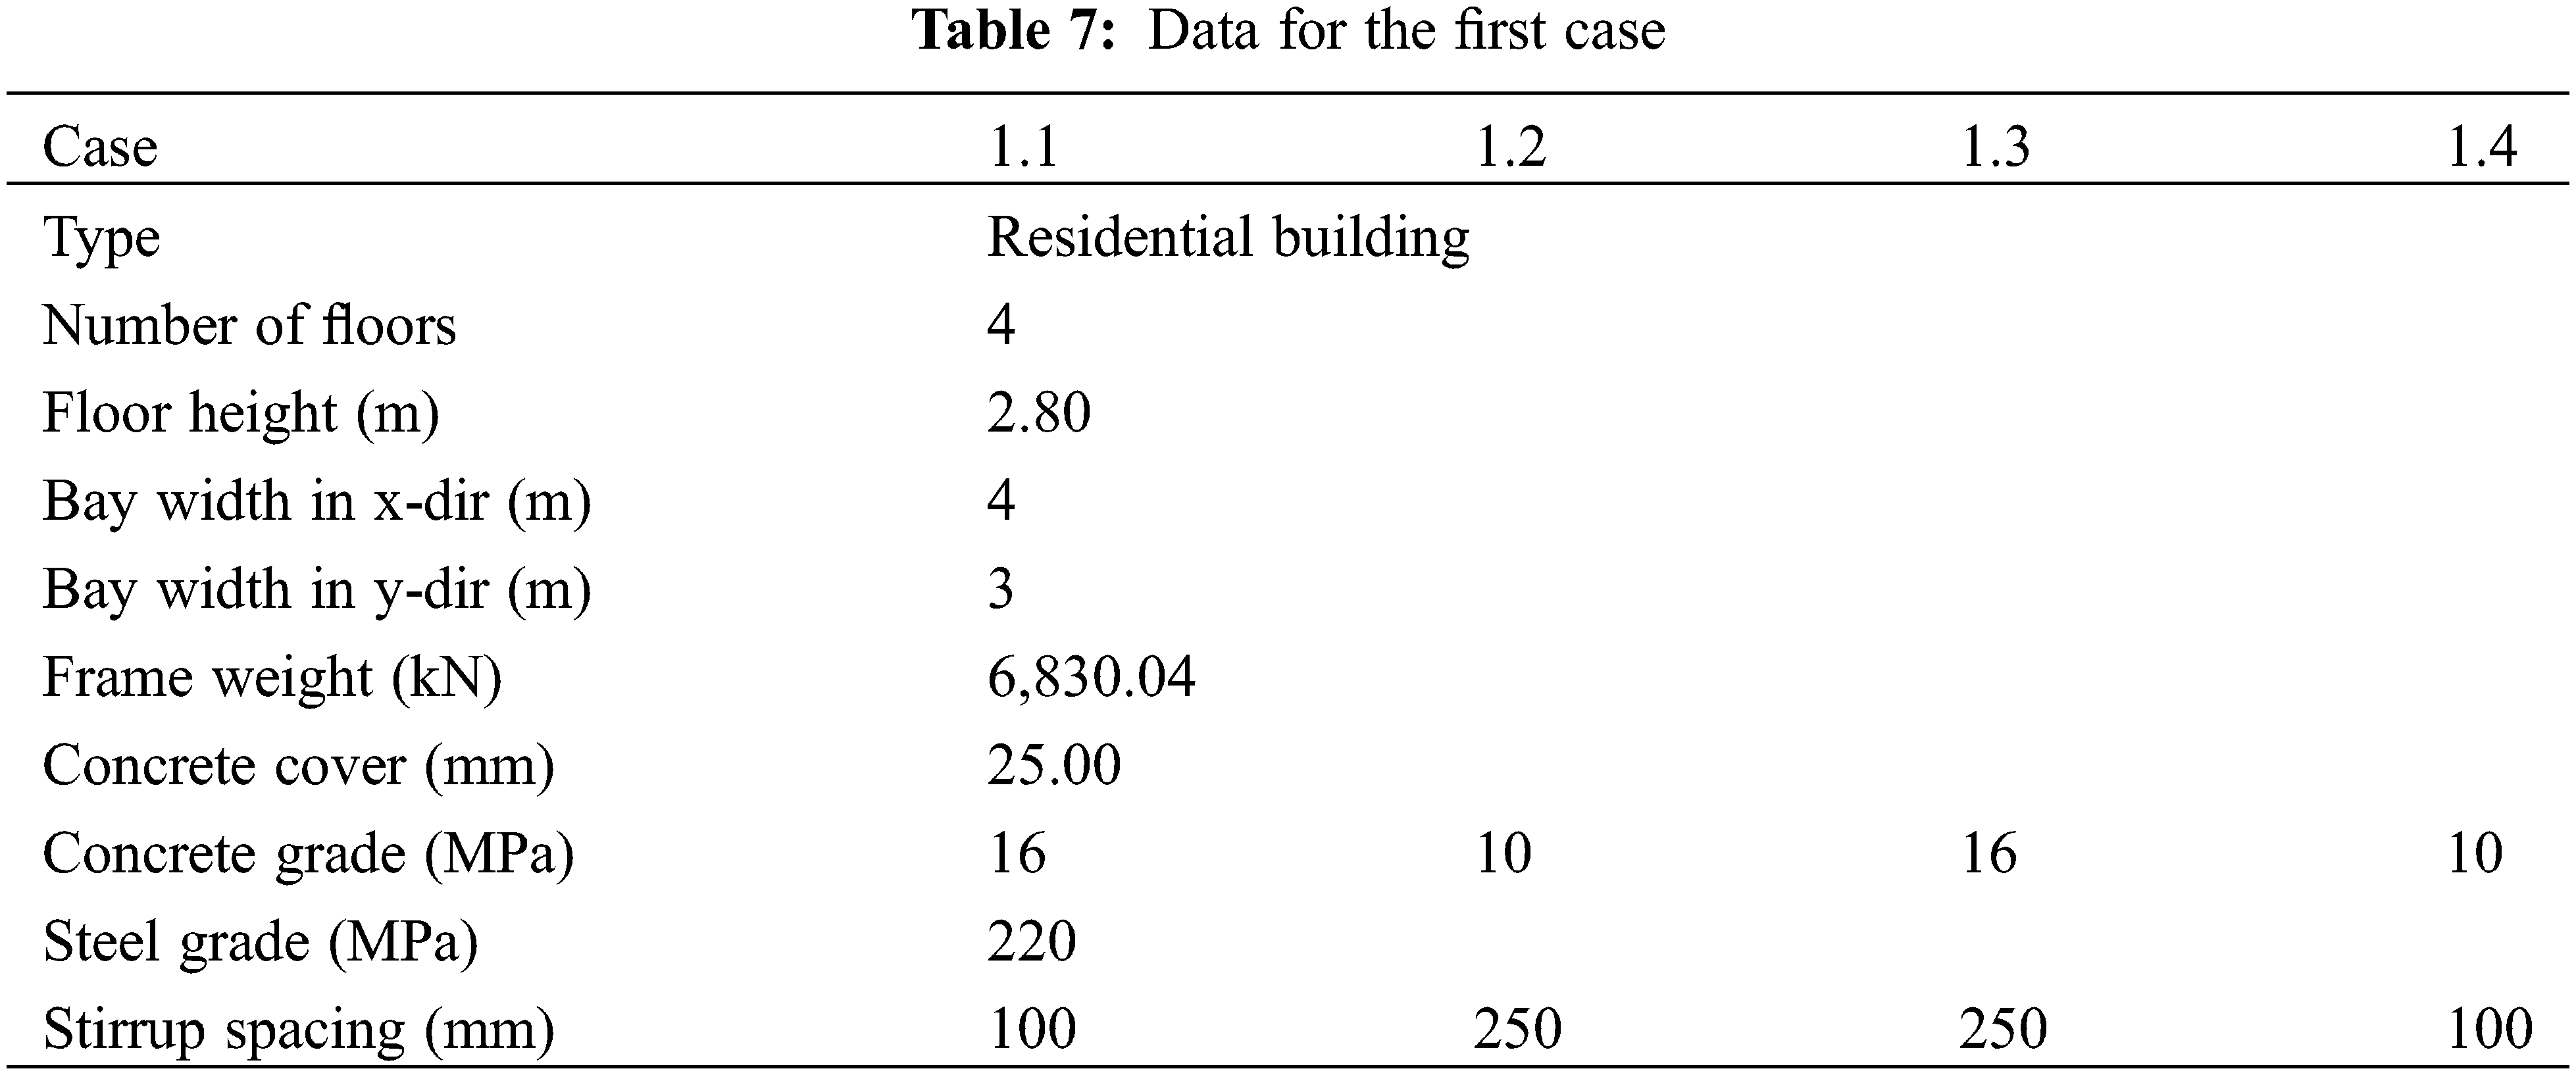
The first case study involves the non-linear analysis of a 3D frame of a four-storey residential building located in a seismic zone. It has four bays in both directions with a width of 4 m in the x-direction and 3 m in the y-direction, as shown in Figs. 8 and 9. The frame is modelled using the three concrete models to compare their performance under earthquake loading. The layout of the frame is based on pre-modern building design. The nominal concrete strength is 16 MPa and the steel reinforcement grade is 220 MPa. However, due to the age and quality of construction, the actual concrete strength and stirrup spacing vary throughout the building. Therefore, four scenarios are considered: 16 MPa concrete and 100 mm stirrup spacing; 10 MPa concrete and 250 mm stirrup spacing; 16 MPa concrete and 250 mm stirrup spacing; 10 MPa concrete and 100 mm stirrup spacing. These values are obtained from the site surveys conducted on such buildings [33]. The additional information is shown in Table 7.
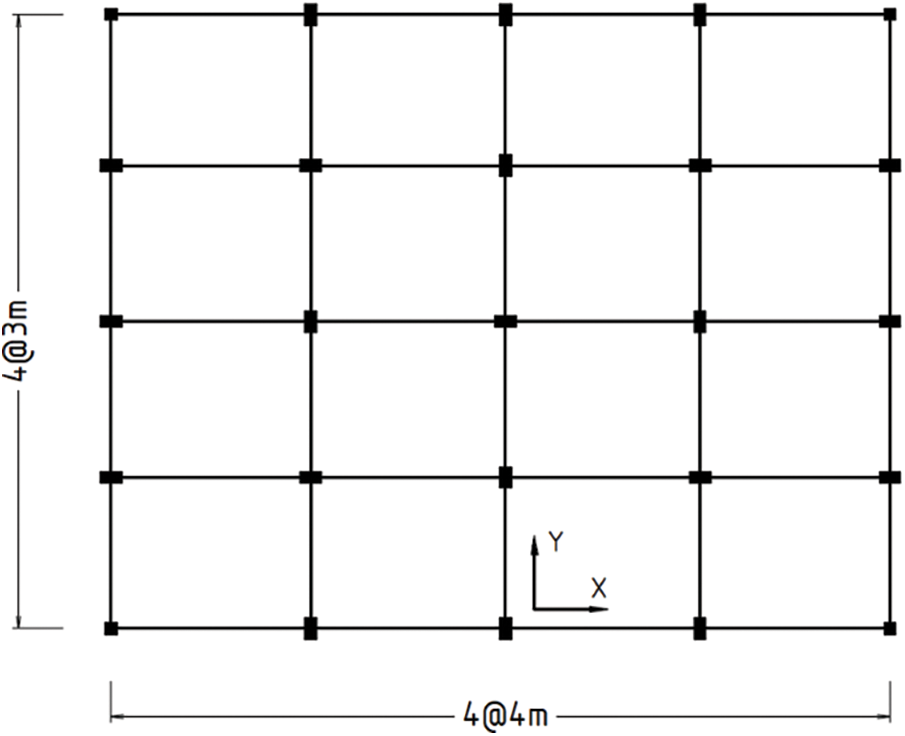
Figure 8: Top view of the frame in xy plan
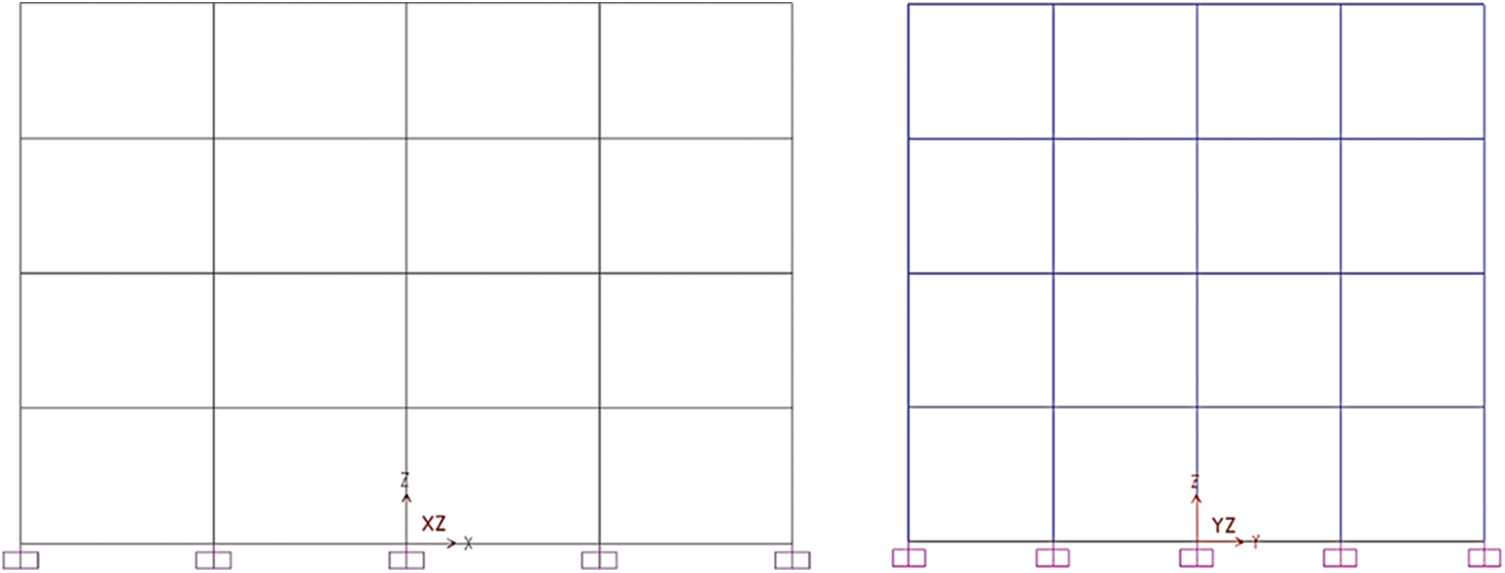
Figure 9: Side views of the frame in xz and yz plans respectively
The longitudinal reinforcement shown in Fig. 10 is:
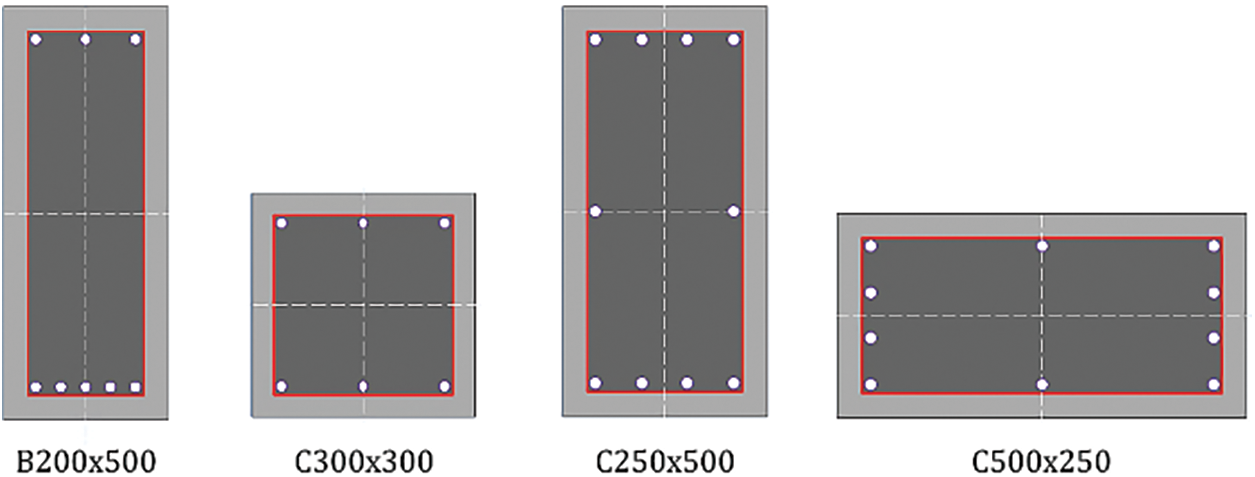
Figure 10: Member cross-sections for the four-storey frame
• 8ϕ12 for the 200 × 500 beams
• 6ϕ14 for the 300 × 300 side columns
• 10ϕ14 for the 250 × 500/500 × 250 columns
To evaluate the non-linear behaviour of the structural members, the moment-curvature relationship of each member is calculated using the SEMAp section analysis tool, by the Scientific and Technical Research Council of Türkiye (TÜBİTAK) under Project No. 105M024 [34]. This section analysis tool can calculate the strength-deformation relationships, including stress-strain, force-deformation, and moment-curvature, and generate diagrams for a given reinforced concrete section. It does this by utilising the Hognestad model for unconfined concrete [35], and the Modified Kent-Park, Saatçioğlu-Razvi, and Mander models for confined concrete. The section properties are inserted into SEMAp as shown in Fig. 11, and then the plastic hinge properties are calculated according to concrete compressive strength, section moment capacity and reinforcement capacity in accordance with FEMA-356 [36], depending on whether the section is a column or a beam. This plastic hinge properties can then be transferred to SAP2000.
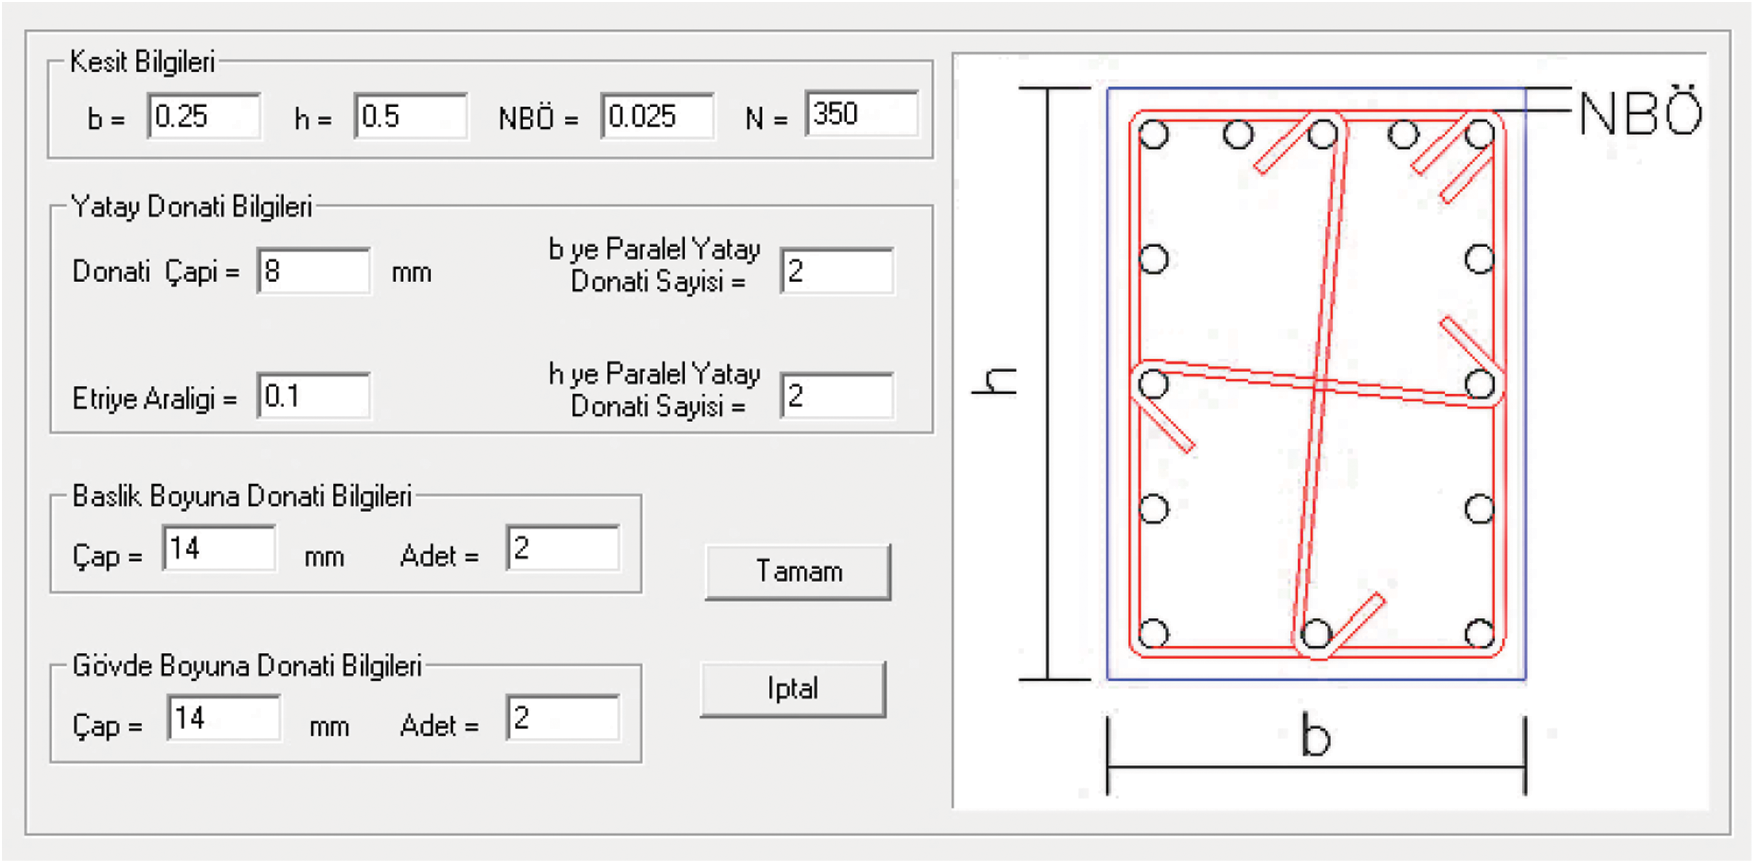
Figure 11: Configuring the section in SEMAp
The initial data for the structural analysis of the building is obtained by running SAP2000 linear analysis with only the dead and live loads (DL + 0.3LL) applied to the model. The results show that the average shear span of the beams in the xz-direction is 0.85 m, and the beams in the yz-direction have an average shear span of 0.70 m. The columns have different shear spans for each floor, 1.91 m for the ground floor, 1.44 m for the first and second floors, and 1.50 m for the third floor.
For this study, two representative members are selected for detailed analysis: one of the middle beams in the xz plan (both are symmetric) on the second floor, and the middle column in the xy plan on the ground floor, both belonging to the middle frame of the building, as demonstrated. These members have been chosen because they are the most critical in terms of their demand and their influence on the global response of the building. The curves of stress-strain and moment-curvature for each model are generated as shown in Figs. 12 and 13 and the location of the critical members is shown in Fig. 14.
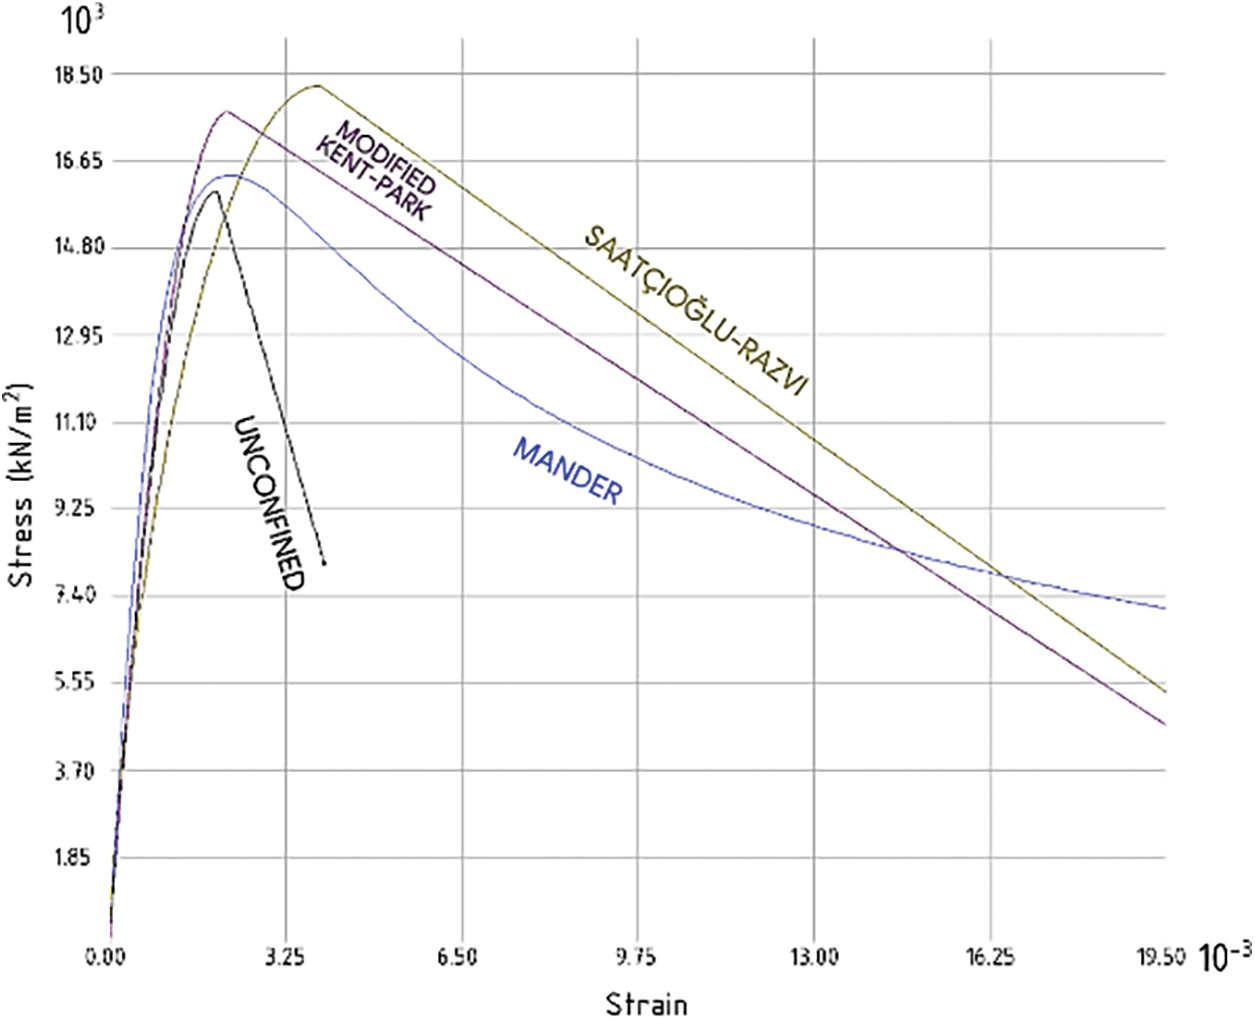
Figure 12: Generated stress-strain curves for the C250 × 500 column in Case 1.1
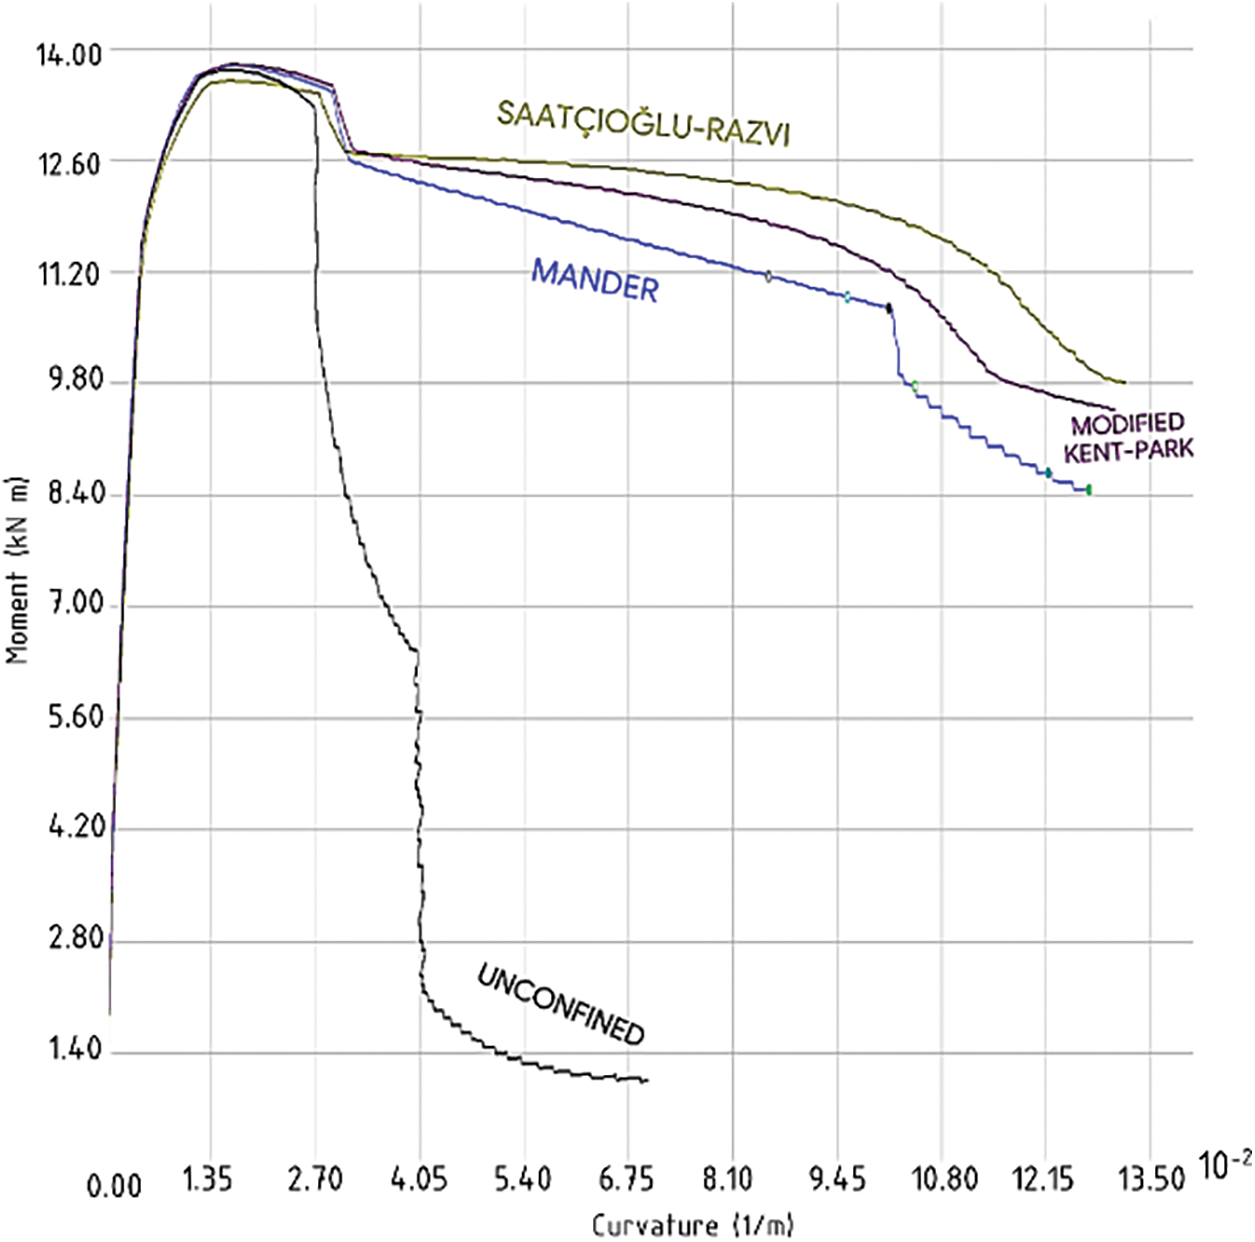
Figure 13: Generated moment-curvature curves for the C250 × 500 column in Case 1.1
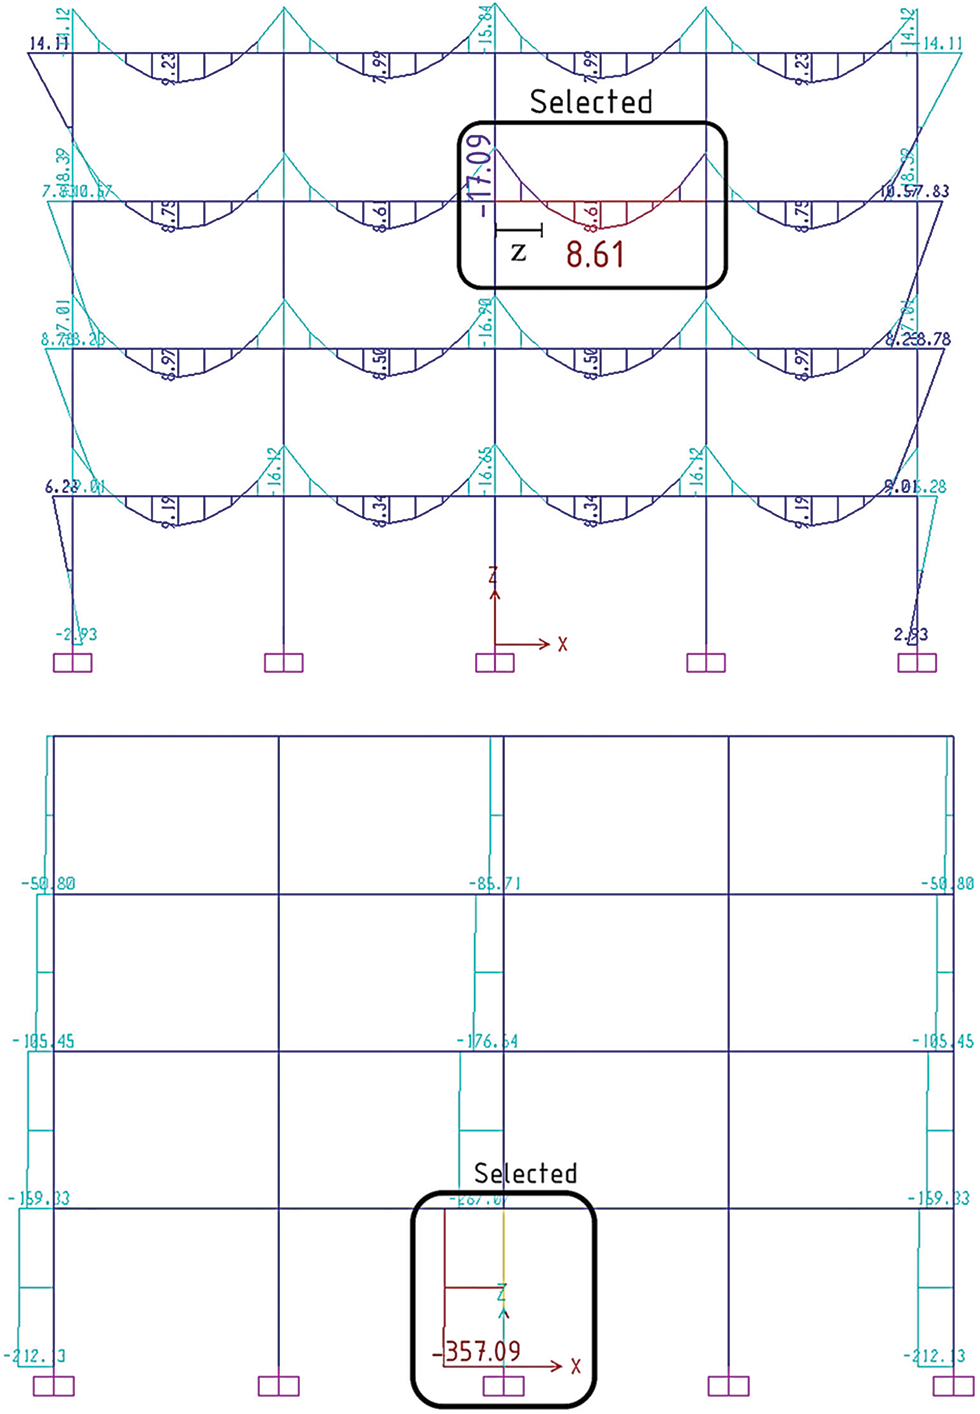
Figure 14: The most critical beam and column
The main difference between the beam and column members in this analysis is the axial force applied to the cross-section. The beam is assumed to have zero axial force, while the column has an axial force of 358 kN, which corresponds to the gravity load on the ground floor.
The moment-rotation relationship of all members is obtained from the moment-curvature relationship using Eq. (38). The software provides you the option on which equation to use, as shown in Fig. 15, for the plastic hinge length. In these case studies, it has been calculated for each member using Paulay and Priestley’s equation from Table 6.
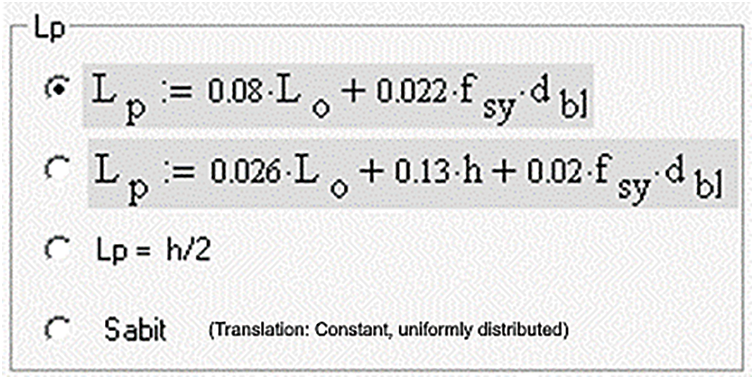
Figure 15: Plastic hinge equations provided in SEMAp
The force-deformation and moment-rotation data that is generated for each member is manually assigned to the hinges of the corresponding member in SAP2000, as demonstrated in Figs. 16 and 17. The beams have two degrees of freedom: shear (V2) and moment (M3). The columns have five degrees of freedom: axial (P), shear (V2 and V3), and moment (M2 and M3). The suffixes 1, 2, and 3 denote the local axis of the cross-section of the member, which determines the direction and orientation of the forces and moments acting on the member.
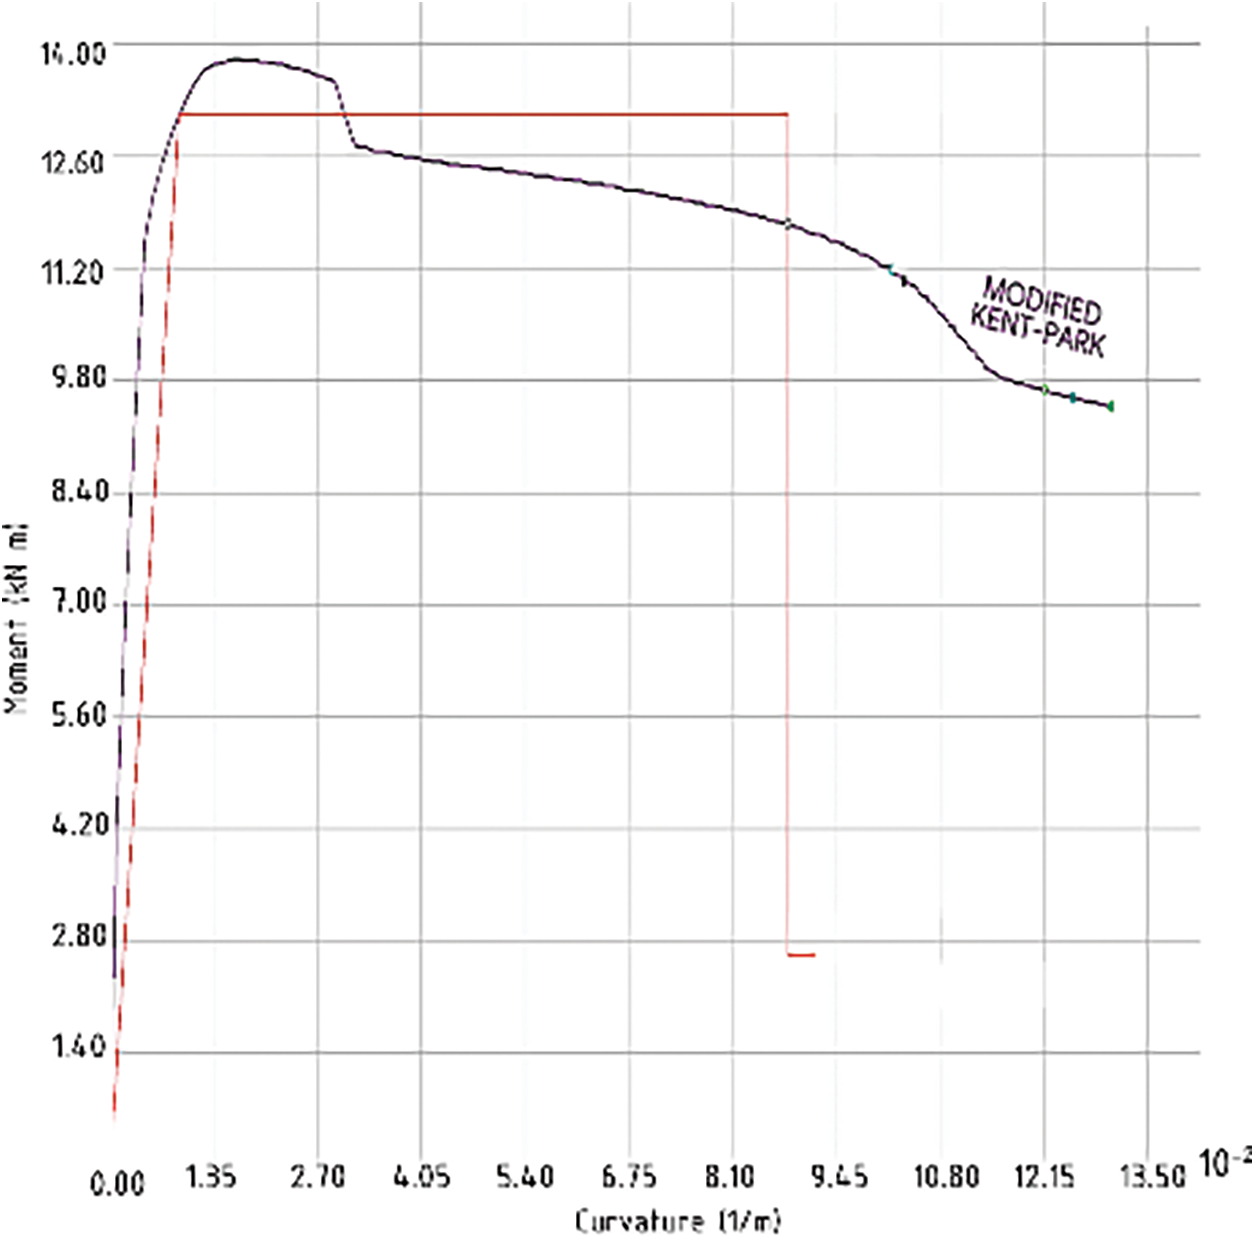
Figure 16: Generated moment-rotation curve for the Modified Kent-Park model of the C250 × 500 column in Case 1.1
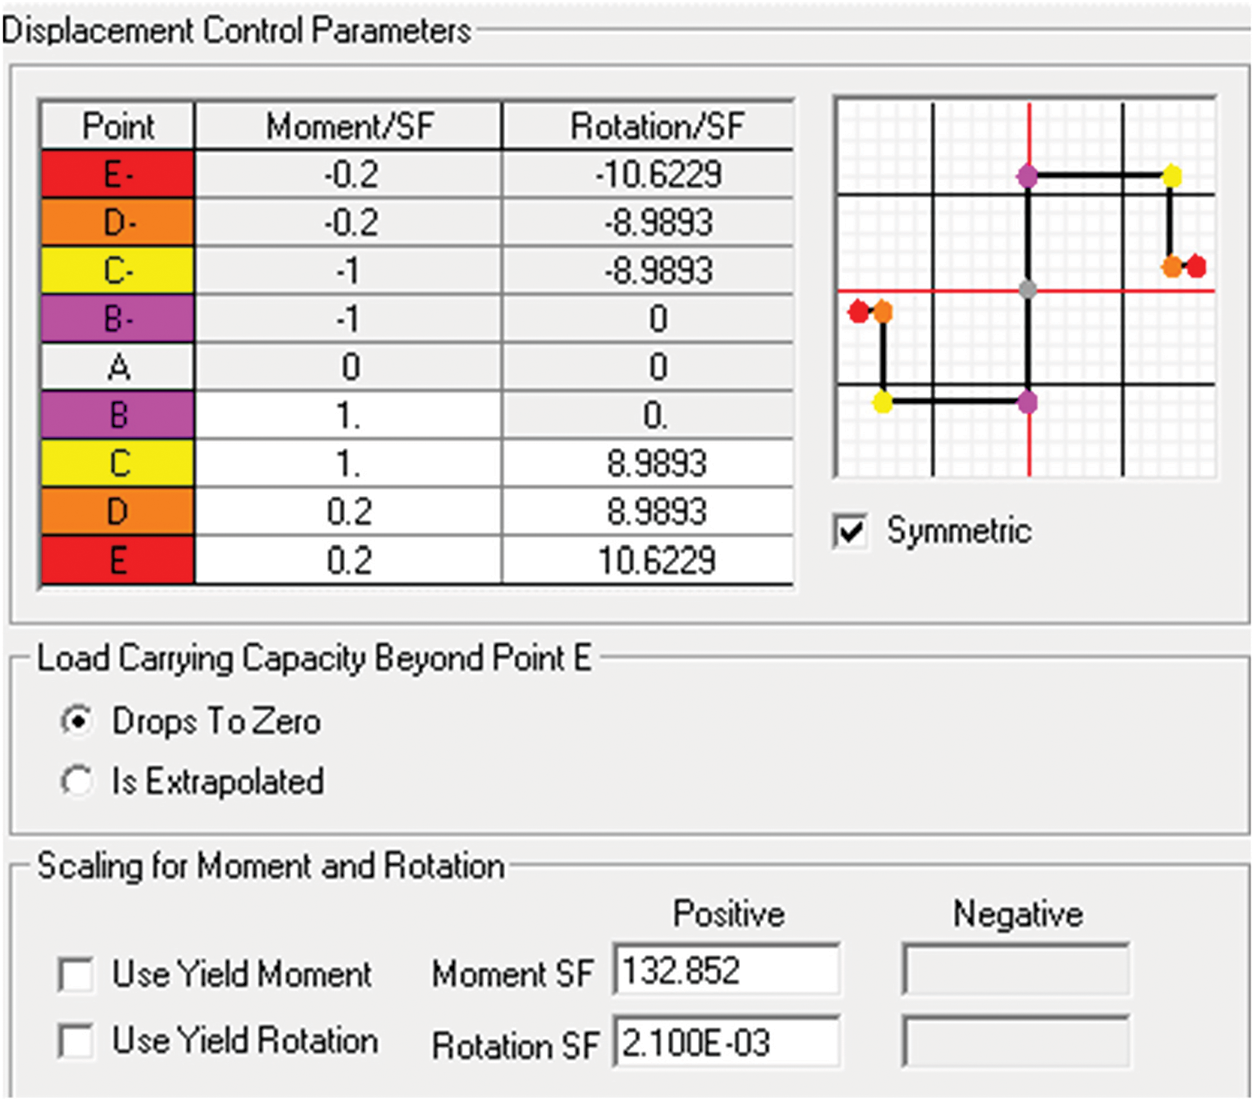
Figure 17: Defining the moment-rotation parameters for moment, M2, of column
The force-displacement and moment-rotation values can be either entered directly into the sheet or divided by safety factors for a clearer presentation.
The next step is performing the non-linear pushover analysis at the global system level, after assigning all the hinges to the frame members. The frame has a natural period of 0.55409 s in the x-direction and 0.54321 s in the y-direction, which reflects its dynamic characteristics and stiffness. The modal load case, which applies a proportional load distribution based on the mode shapes of the frame, is used for conducting the pushover analysis in both directions. The load application control is displacement-controlled, meaning that the load is increased until the target displacement is reached. The target displacement is set to 4% of the frame’s height, which is equivalent to 448.0 mm.
8.2 Seven-Storey Residential Building
The second case study involves the non-linear analysis of a 7-storey frame. The top view of the plan in the xy direction is the same as in Fig. 8 and the side views are as shown in Fig. 18. The additional information is shown in Table 8.
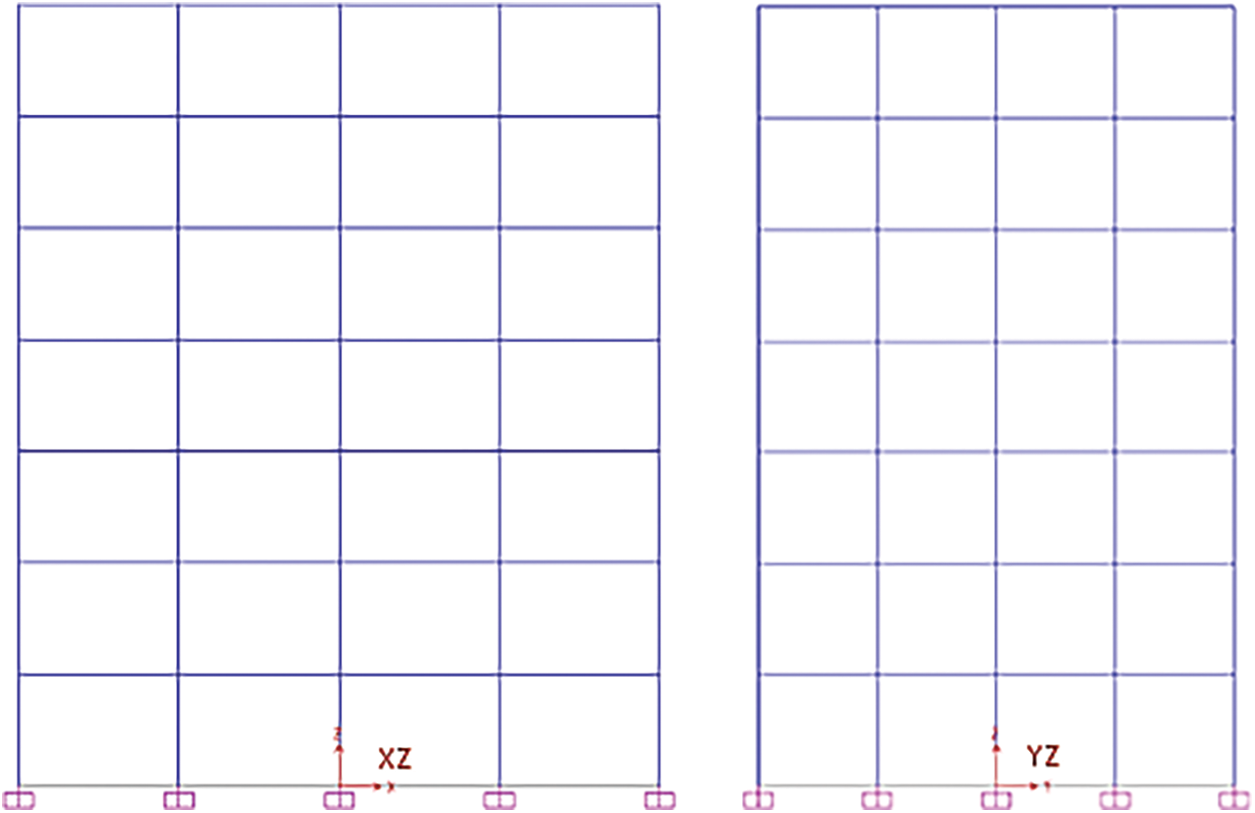
Figure 18: Side views of the frame in xz and yz plans respectively
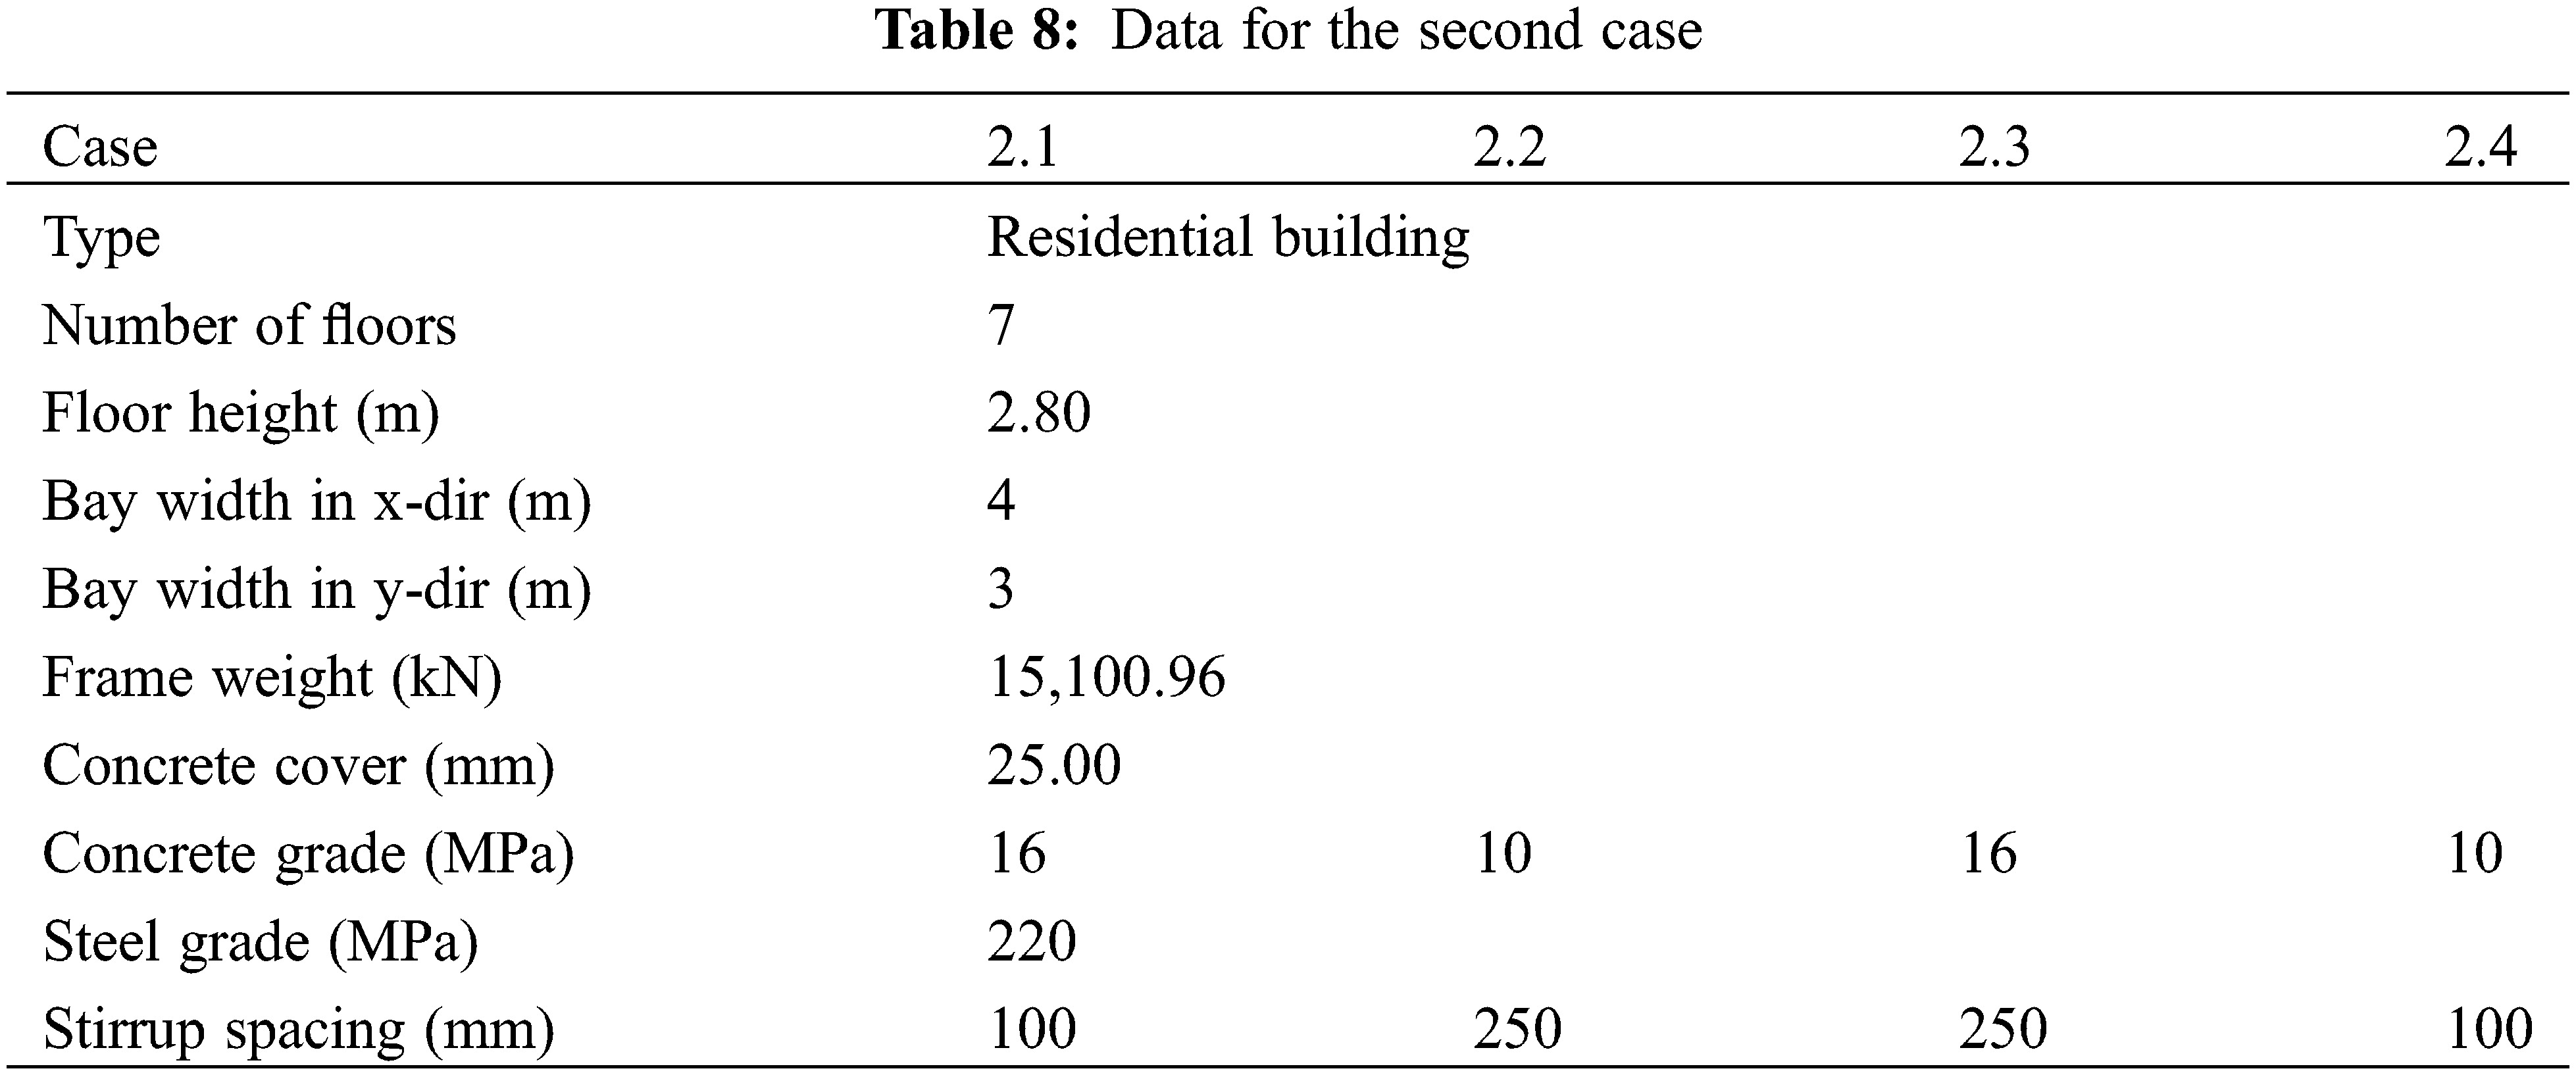
The longitudinal reinforcement shown in Fig. 19 is:
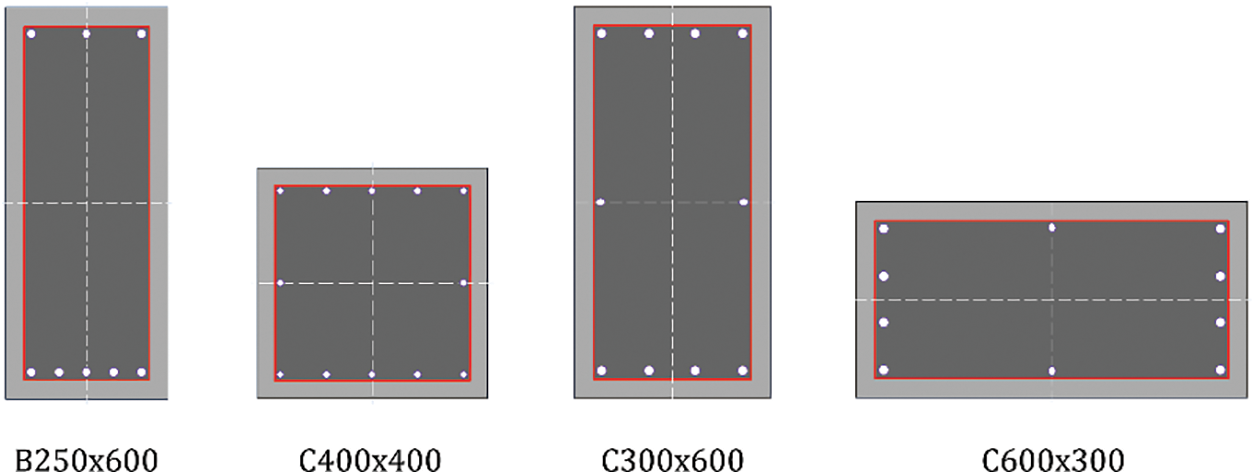
Figure 19: Member cross-sections for the seven-storey frame
• 8ϕ14 for the 250 × 600 beams
• 12ϕ14 for the 400 × 400 side columns
• 8ϕ16 for the 300 × 600/600 × 300 columns
For this case, two representative members are selected as shown in Fig. 20: one of the side beams in the xz plan (both are symmetric) on the sixth floor, and the middle column in the xy plan on the ground floor, both belonging to the middle frame of the building.
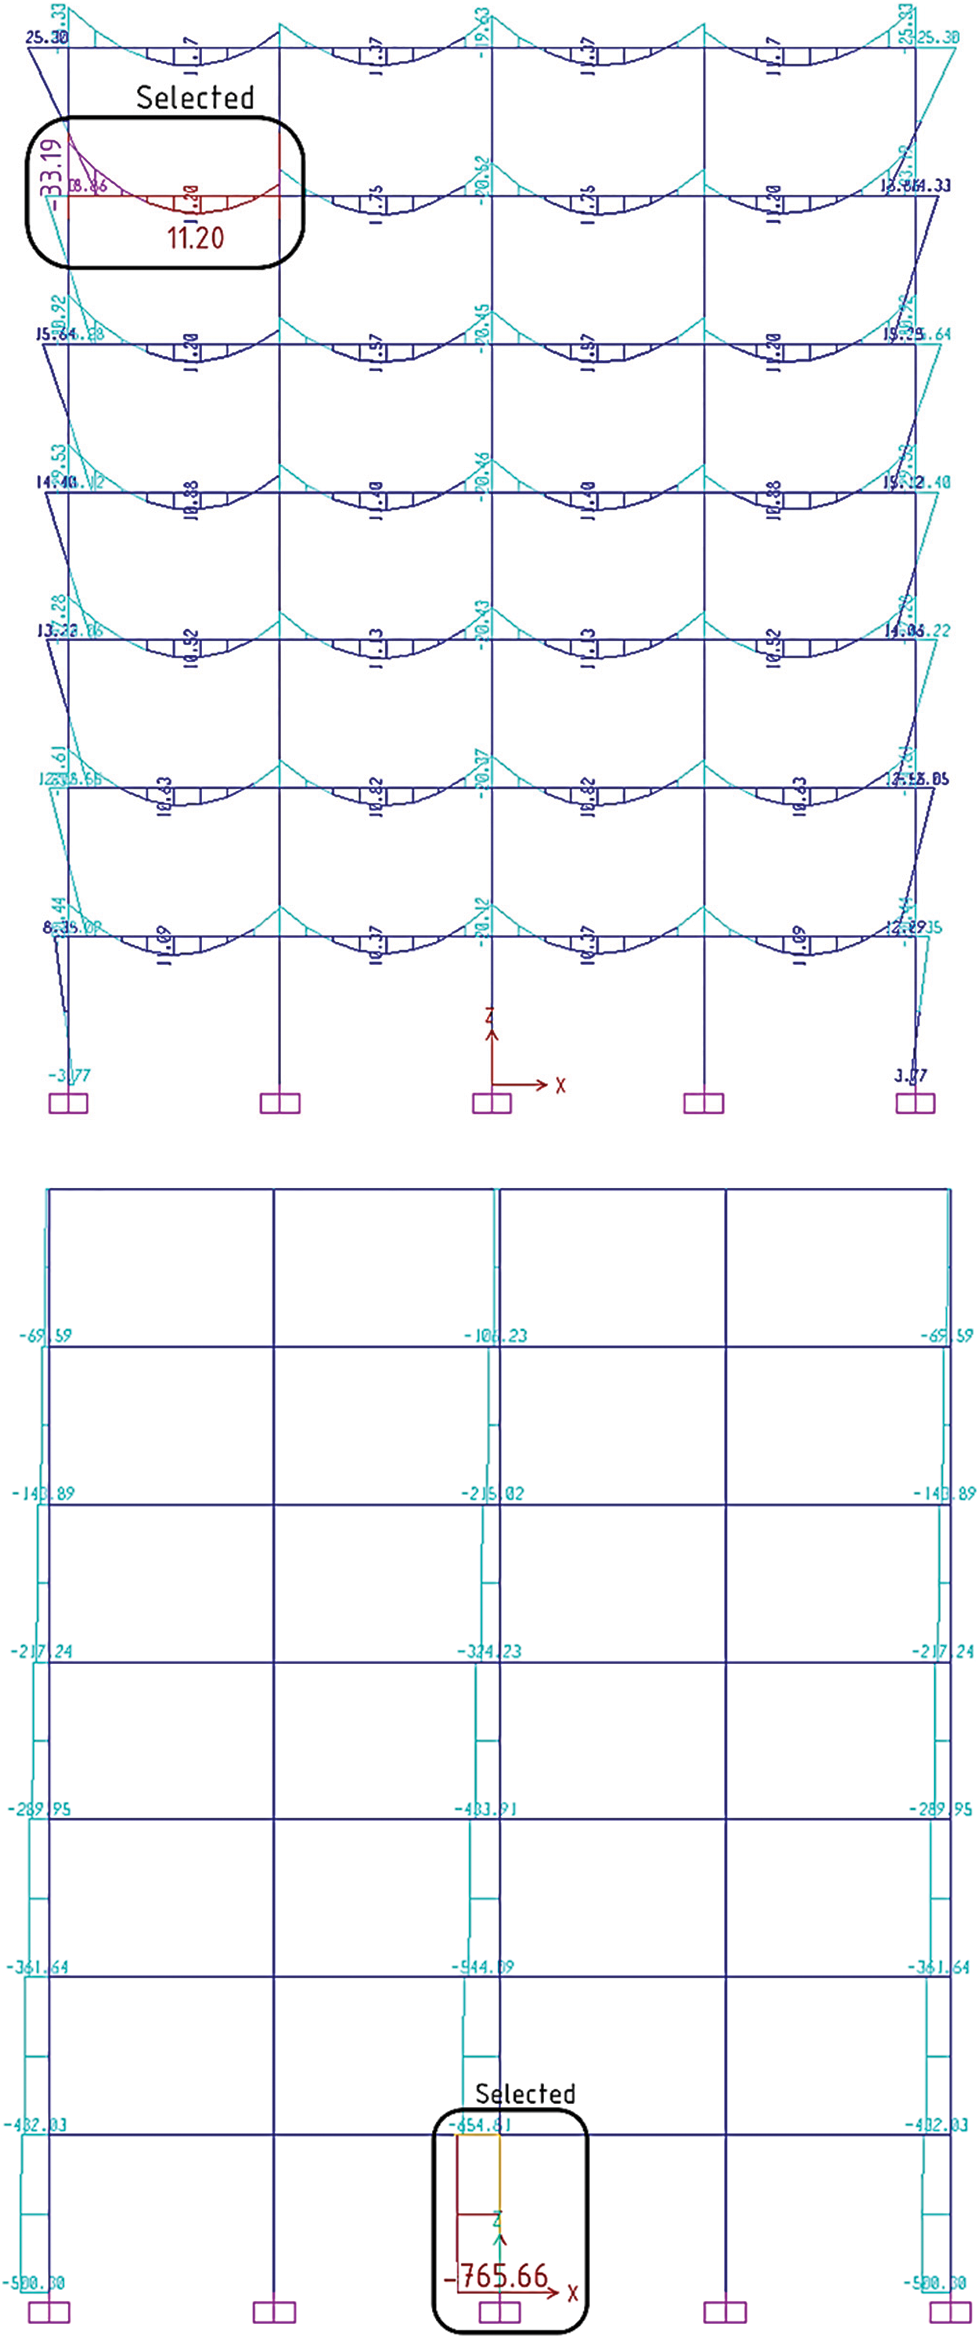
Figure 20: The most critical beam and column in the 7-storey frame
The frame has a natural period of 0.76456 s in the x-direction and 0.75352 s in the y-direction. The target displacement is set to 4% of the frame’s height, which is equivalent to 784.0 mm.
9.1 Influence of Concrete Models
A comparison of the moment-curvature relationships of the beam and column sections for different concrete models reveals that the concrete behaviour in the beam case, in Fig. 21, is less sensitive to the choice of the model than in the column case, in Fig. 22. This happens due to the presence of axial loads and confinement effects of the column, which affect the concrete behaviour and strength. The axial load reduces the curvature and increases the ultimate moment capacity of the column, while the confinement effect enhances the concrete strength and ductility by preventing lateral expansion and cracking.
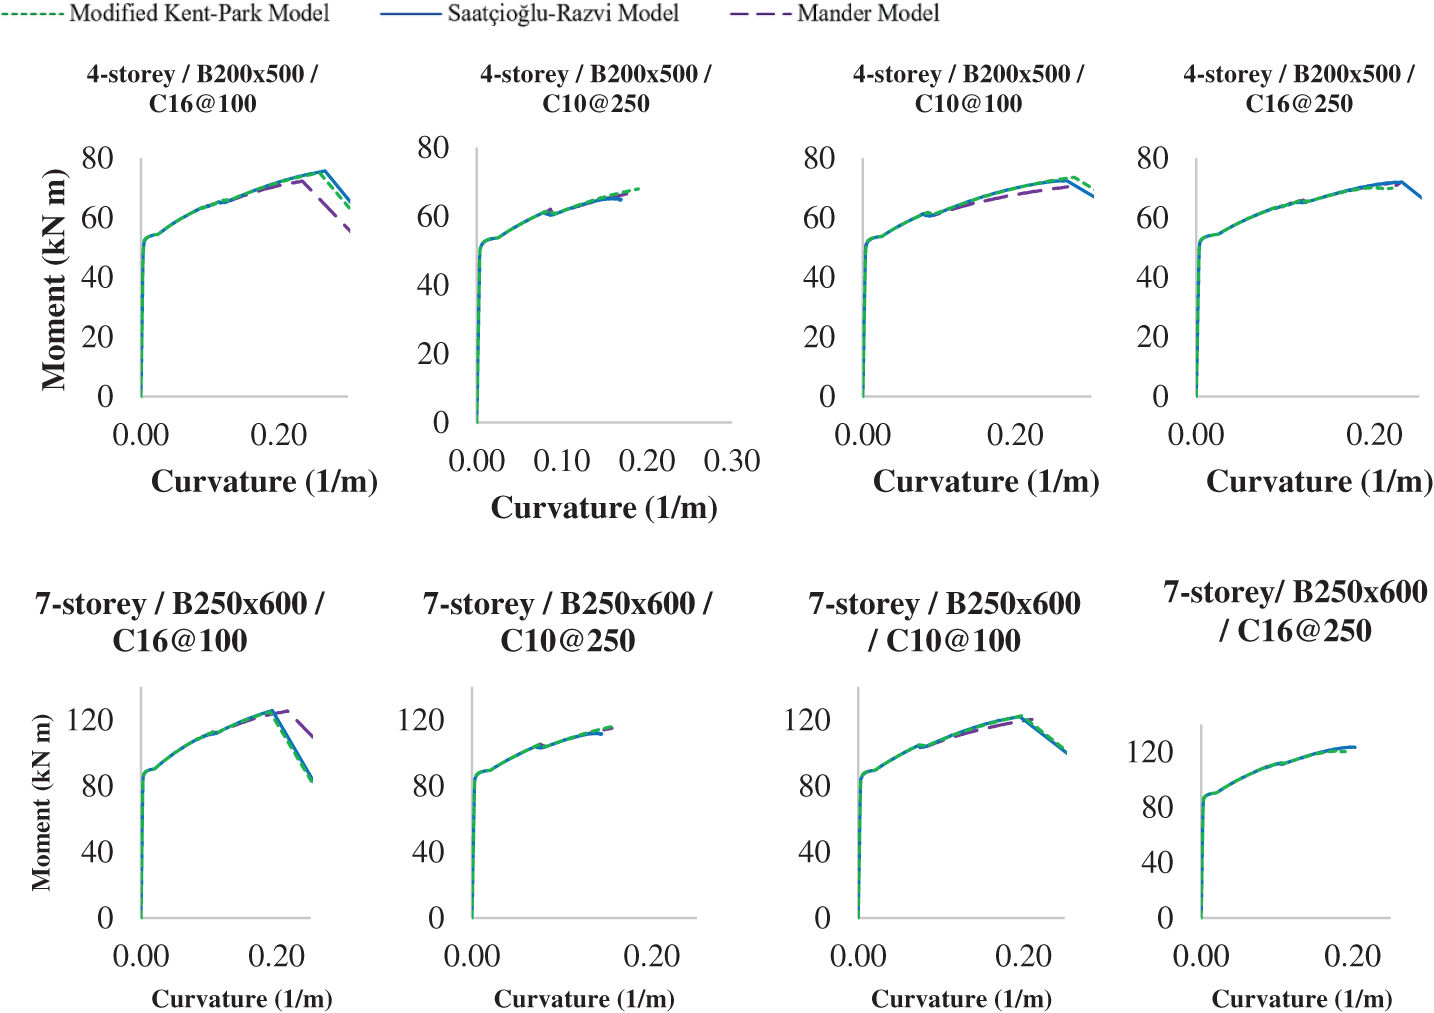
Figure 21: Moment-curvature data for the selected beam sections
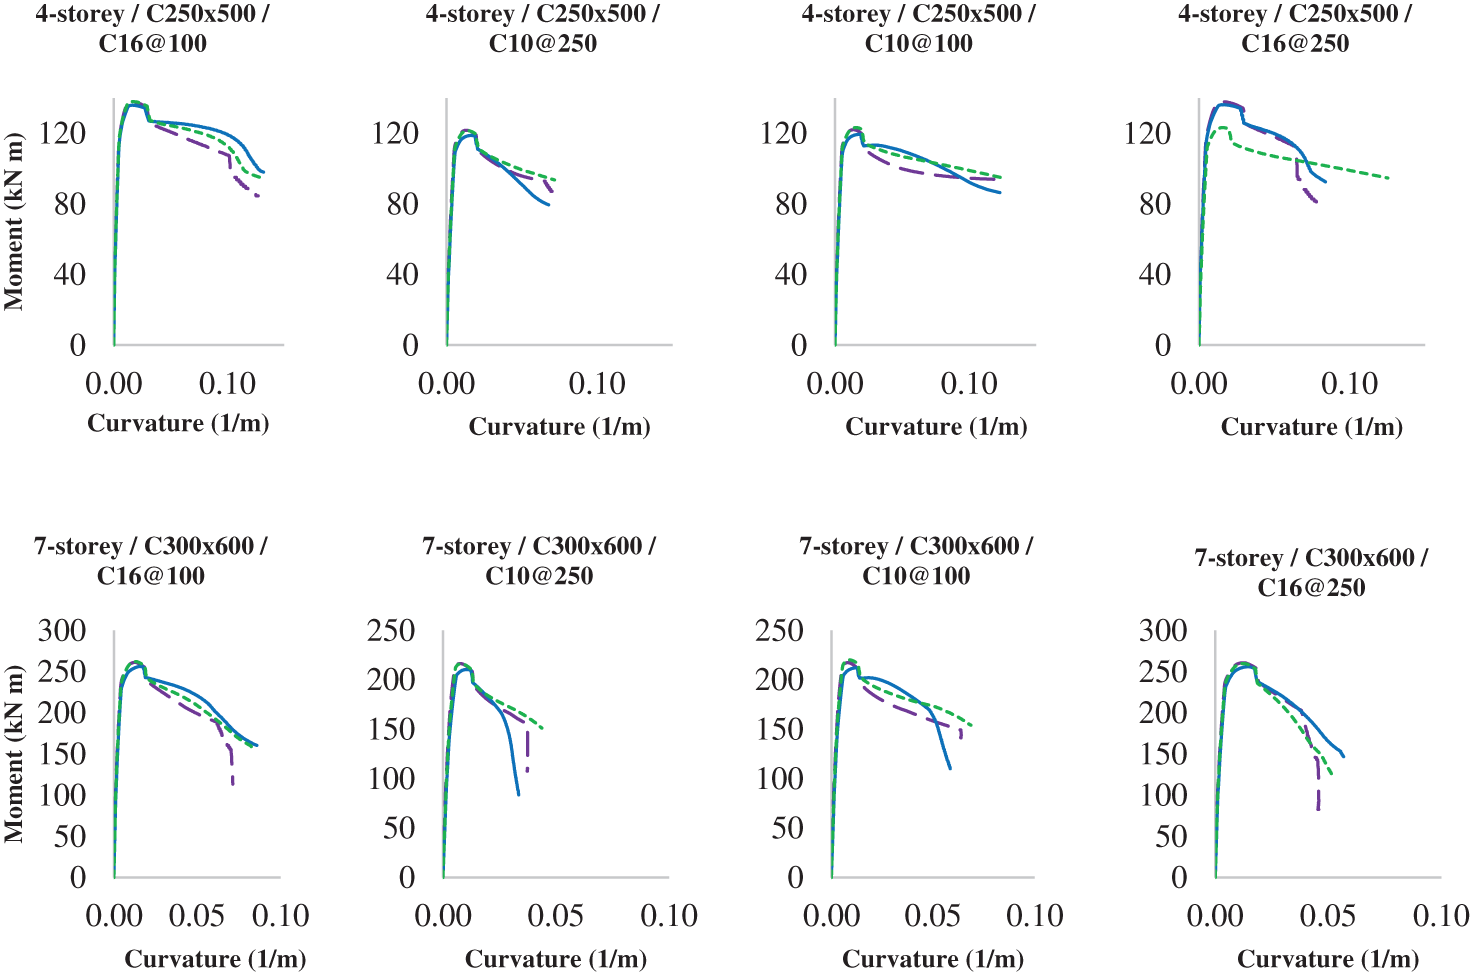
Figure 22: Moment-curvature data for the selected column sections
The observation made on the capacity curve of the frames, which is obtained from the non-linear pushover analysis, shows the base shear vs. the roof displacement of the frame under lateral loads. The results show that the capacity curve is not sensitive to the choice of the concrete model, as all the models produce similar curves for both frames.
9.2 Influence of Concrete Quality and Stirrup Spacing
Another factor that influences the moment-curvature of the members is the stirrup spacing and concrete quality. As expected, the members with smaller stirrup spacing and better concrete quality have higher moment capacity than the members with larger stirrup spacing and poor concrete quality. This is because the stirrups provide confinement and shear resistance to the concrete, while the concrete quality affects the compressive strength and stiffness of the material. Moreover, the strain capacity of the members, which represents their ductility and deformation ability, is lower when the concrete quality is poor and the stirrup spacing is large, especially in the seven-story case. This indicates that these members are more prone to brittle failure and less able to dissipate energy under seismic loads.
At the global level, as shown in Figs. 23 and 24, the concrete grade and the stirrup spacing of the members influence the capacity curve as well. The frames with better concrete grade and smaller stirrup spacing have a higher base shear and roof displacement than the frames with poor concrete grade and larger stirrup spacing. This means that these frames have higher strength and deformation capacity. The effect of the concrete grade and stirrup spacing is more evident in the seven-story frame than in the four-story frame, as the seven-story frame has more members and more gravity load than the four-story frame. Therefore, these factors are important for designing and evaluating the seismic performance of reinforced concrete frames.
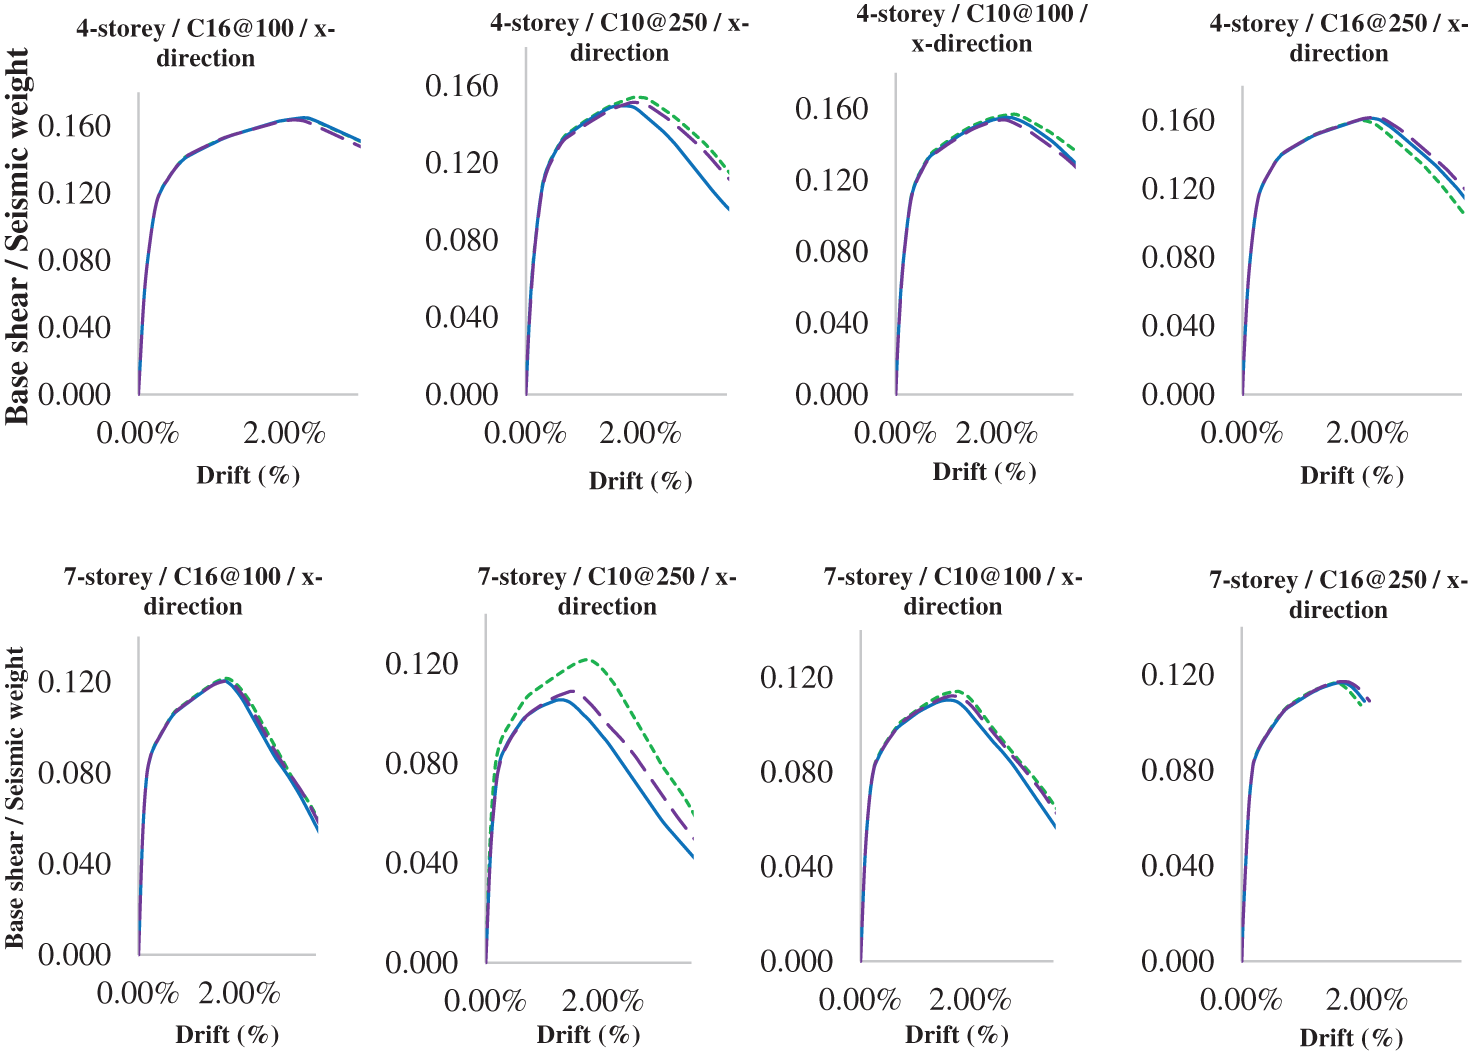
Figure 23: Capacity curves for the x-direction span
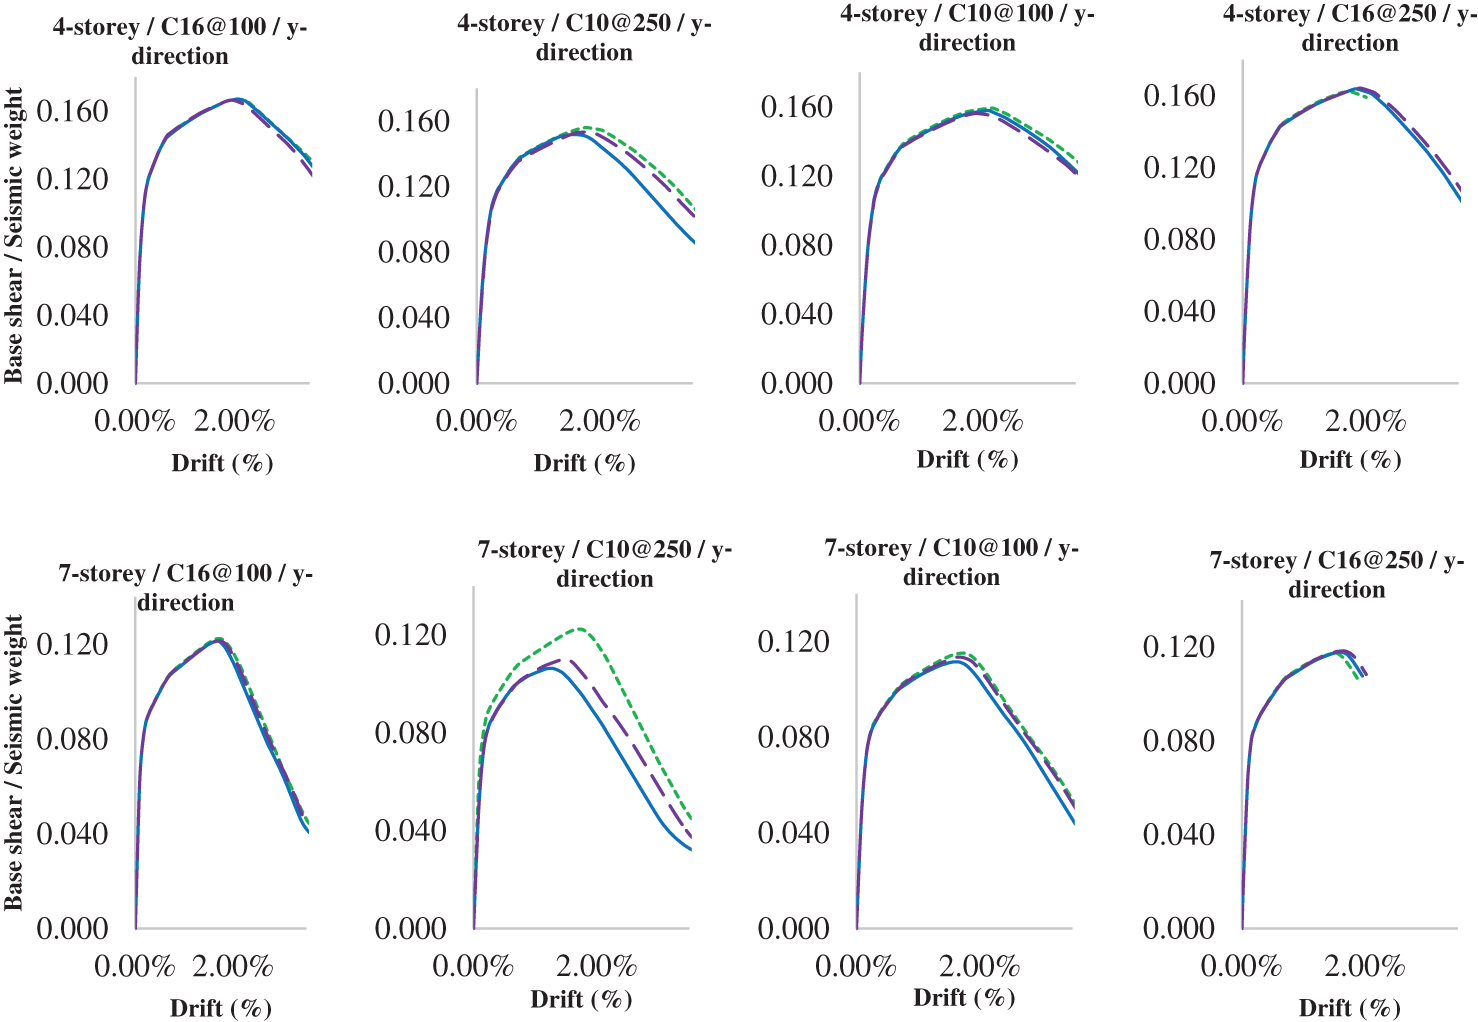
Figure 24: Capacity curves for the y-direction span
The main objective of this study was to compare the different concrete models in SAP2000 for the non-linear analysis of reinforced concrete frames under seismic loads. The concrete models were applied to the cross-sections of the beam and column members of two frames: a four-story frame and a seven-story frame. The moment-curvature and moment-rotation relationships of the members were calculated using the SEMAp section analysis tool, which was developed by the Scientific and Technical Research Council of Türkiye (TÜBİTAK) under Project No. 105M024. The force-deformation and moment-rotation data were then manually assigned to the hinges of the corresponding members in SAP2000. The non-linear pushover analysis was performed on the frames using the modal load case and the displacement-controlled load application.
• The moment-curvature relationships of column sections show distinct behaviours across the concrete models. The column’s response is significantly sensitive to the choice of the model, due to the effects of axial load and confinement.
• The axial load notably reduces the curvature and increases the ultimate moment capacity, especially in the Modified Kent-Park and Saatçioğlu-Razvi concrete models. The confinement effect enhances the strength and ductility of the columns by limiting lateral expansion and preventing cracking.
• The cases with smaller stirrup spacing and higher concrete quality show increased moment capacity of the members, indicating the effect and importance of confinement in shear resistance, and the role of concrete quality in the compressive strength of the members.
• The capacity curves of both buildings are not sensitive to the choice of concrete model, due to them producing similar base shear, seismic weight, and drift values. This underlines that while the choice of a concrete model is crucial for localized member behaviour, the global system behaviour is mostly influenced by the concrete strength and stirrup spacing, crucial for the strength and deformation capacity of the frames.
• The impact of concrete quality and stirrup spacing is more pronounced in the seven-storey building, due to the greater number of members and the higher gravity loads, suggesting a more significant role of them in the seismic assessment of taller structures.
For future research, more concrete models can be investigated and validated using experimental data and other software packages. Additionally, more frames with different geometries, heights, and boundary conditions, and more concrete grades and stirrup spacings can be considered for further research. These aspects can provide more insight into understanding the non-linear behaviour and performance of reinforced concrete structures under seismic loads to help improve the design and assessment of these structures.
Acknowledgement: None.
Funding Statement: The authors received no specific funding for this study.
Author Contributions: The authors confirm contribution to the paper as follows: study conception and design: Prof. Hüseyin Bilgin; data collection: Bredli Plaku; analysis and interpretation of results: Prof. Hüseyin Bilgin and Bredli Plaku; draft manuscript preparation: Bredli Plaku. All authors reviewed the results and approved the final version of the manuscript.
Availability of Data and Materials: The data generated and analysed during this study are available from the corresponding author upon reasonable request.
Conflicts of Interest: The authors declare that they have no conflicts of interest to report regarding the present study.
References
1. Richart, F. E., Brandtzaeg, A., Brown, R. L. (1929). The failure of concrete of plain and spirally reinforced concrete in compression. University of Illinois, Bulletin. [Google Scholar]
2. Roy, H. E. H., Sozen, M. A. (1965). Ductility of concrete. ACI Special Publication, 12, 213–235. [Google Scholar]
3. Kent, D. C., Park, R. (1971). Flexural members with confined concrete. Journal of the Structural Division, 97(7), 1969–1990. https://doi.org/10.1061/JSDEAG.0002957 [Google Scholar] [CrossRef]
4. Scott, B. D., Park, R., Priestley, M. J. N. (1982). Stress-strain behavior of concrete confined by overlapping hoops at low and high strain rates. ACI Special Publication, 79(1), 13–27. https://doi.org/10.14359/10875 [Google Scholar] [CrossRef]
5. Sheikh, S. A., Uzumeri, S. M. (1982). Analytical model for concrete confinement in tied columns. Journal of the Structural Division, 108(12), 2703–2722. https://doi.org/10.1061/JSDEAG.0006100 [Google Scholar] [CrossRef]
6. Fafitis, A., Shah, S. P. (1985). Lateral reinforcement for high-strength concrete columns. ACI Special Publication, 87, 213–232. [Google Scholar]
7. Yong, Y. K., Nour, M. G., Nawy, E. G. (1988). Behavior of laterally confined high-strength concrete under axial loads. Journal of Structural Engineering, 114(2), 332–351. https://doi.org/10.1061/(ASCE)0733-9445(1988)114:2(332) [Google Scholar] [CrossRef]
8. Mander, J. B., Priestley, M. J. N., Park, R. (1988). Theoretical stress-strain model for confined concrete. Journal of Structural Engineering, 114(8), 1804–1826. https://doi.org/10.1061/(ASCE)0733-9445(1988)114:8(1804) [Google Scholar] [CrossRef]
9. Saatçioğlu, M., Razvi, S. R. (1992). Strength and ductility of confined concrete. Journal of Structural Engineering, 118(6), 1590–1607. https://doi.org/10.1061/(ASCE)0733-9445(1992)118:6(1590) [Google Scholar] [CrossRef]
10. Cusson, D., Paultre, P. (1994). High-strength concrete columns confined by rectangular ties. Journal of Structural Engineering, 120(3), 783–804. https://doi.org/10.1061/(ASCE)0733-9445(1994)120:3(783) [Google Scholar] [CrossRef]
11. El-Dash, K. M., Ahmad, S. H. (1995). A model for stress—strain relationship of spirally confined normal and high-strength concrete columns. Magazine of Concrete Research, 47(171), 177–184. https://doi.org/10.1680/macr.1995.47.171.177 [Google Scholar] [CrossRef]
12. Hoshikuma, J., Kawashima, K., Nagaya, K., Taylor, A. W. (1997). Stress-strain model for confined reinforced concrete in bridge piers. Journal of Structural Engineering, 123(5), 624–633. https://doi.org/10.1061/(ASCE)0733-9445(1997)123:5(624) [Google Scholar] [CrossRef]
13. Mansur, M. A., Chin, M. S., Wee, T. H. (1997). Stress-strain relationship of confined high-strength plain and fiber concrete. Journal of Materials in Civil Engineering, 9(4), 171–179. https://doi.org/10.1061/(ASCE)0899-1561(1997)9:4(171) [Google Scholar] [CrossRef]
14. Assa, B., Nishiyama, M., Watanabe, F. (2001). New approach for modeling confined concrete. I: Circular columns. Journal of Structural Engineering, 127(7), 743–750. https://doi.org/10.1061/(ASCE)0733-9445(2001)127:7(743) [Google Scholar] [CrossRef]
15. Elnashai, A. S., Sarno, L. D. (2015). Fundamentals of earthquake engineering: From source to fragility, 2nd edition. New Jersey, USA: John Wiley & Sons Inc. [Google Scholar]
16. Committee E-701 (2006). Reinforcement for concrete-materials and applications. Michigan, USA: American Concrete Institute. [Google Scholar]
17. Farghal, O. A., Diab, H. M. A. (2013). Prediction of axial compressive strength of reinforced concrete circular short columns confined with carbon fiber reinforced polymer wrapping sheets. Journal of Reinforced Plastics and Composites, 32(19), 1406–1418. https://doi.org/10.1177/0731684413499830 [Google Scholar] [CrossRef]
18. Hamad, A. J. (2017). Size and shape effect of specimen on the compressive strength of HPLWFC reinforced with glass fibres. Journal of King Saud University-Engineering Sciences, 29(4), 373–380. https://doi.org/10.1016/j.jksues.2015.09.003 [Google Scholar] [CrossRef]
19. Samani, A. K., Attard, M. M. (2012). A stress-strain model for uniaxial and confined concrete under compression. Engineering Structures, 41, 335–349. https://doi.org/10.1016/j.engstruct.2012.03.027 [Google Scholar] [CrossRef]
20. Perumal, V., Kothandaraman, S., Ashok, K. B. (2020). Comparative study of stress-strain confined concrete models. International Journal of Scientific & Engineering Research, 11(12), 926–932. [Google Scholar]
21. Sözen, M. A. (2001). Stiffness of R/C members. Indiana, USA: Purdue University. [Google Scholar]
22. Sharma, A., Reddy, G. R., Vaze, K. K., Eligehausen, R., Hofmann, J. (2012). Nonlinear seismic analysis of reinforced concrete framed structures considering joint distortion. Mumbai, India: Bhabha Atomic Research Centre. [Google Scholar]
23. Kaltakci, M. Y., Köken, A., Yimaz, Ü. S. (2006). Experimentally and analytical investigation of axially loaded tied columns with and without steel fibers. Dokuz Eylül University Faculty of Engineering Journal of Science and Engineering, 8(1), 65–85 (In Turkish). [Google Scholar]
24. CSI (2022). SAP2000 structural analysis and design. wiki.csiamerica.com/display/SAP2000 (accessed on 03/12/2022). [Google Scholar]
25. Popovics, S. (1973). A numerical approach to the complete stress-strain curve of concrete. Cement and Concrete Research, 3(5), 583–599. https://doi.org/10.1016/0008-8846(73)90096-3 [Google Scholar] [CrossRef]
26. Feng, D. C., Ding, Z. D. (2018). A new confined concrete model considering the strain gradient effect for RC columns under eccentric loading. Magazine of Concrete Research, 70(23), 1189–1204. https://doi.org/10.1680/jmacr.18.00040 [Google Scholar] [CrossRef]
27. Cao, V. V., Ronagh, H. R. (2013). A model for damage analysis of concrete. Advances in Concrete Construction, 1(2), 187–200. https://doi.org/10.12989/acc.2013.01.2.187 [Google Scholar] [CrossRef]
28. Beer, F. P., JohnstonJr, E. R., DeWolf, J. T., Mazurek, D. F. (2019). Mechanics of materials, 8th edition. New York, USA: McGraw Hill. [Google Scholar]
29. Wang, G., Wei, Y., Shen, C., Huang, Z., Zheng, K. (2023). Compression performance of FRP-steel composite tube-confined ultrahigh-performance concrete (UHPC) columns. Thin-Walled Structures, 192(4), 111152. https://doi.org/10.1016/j.tws.2023.111152 [Google Scholar] [CrossRef]
30. Zhao, Z., Wei, Y., Yue, P., Li, S., Wang, G. (2024). Axial compression and load-carrying performance of rectangular UHPC-filled stainless-steel tubular short columns. Journal of Constructional Steel Research, 213, 108397. https://doi.org/10.1016/j.jcsr.2023.108397 [Google Scholar] [CrossRef]
31. Zhao, X., Wu, Y. F., Leung, A. Y., Lam, H. F. (2011). Plastic hinge length in reinforced concrete flexural members. Procedia Engineering, 14(11), 1266–1274. https://doi.org/10.1016/j.proeng.2011.07.159 [Google Scholar] [CrossRef]
32. Committee 318 (2005). Building code requirements for structural concrete and commentary. Michigan, USA: American Concrete Institute. [Google Scholar]
33. Inel, M., Özmen, H. B., Bilgin, H. (2008). Re-evaluation of building damage during recent earthquakes in Turkey. Engineering Structures, 30(2), 412–427. https://doi.org/10.1016/j.engstruct.2007.04.012 [Google Scholar] [CrossRef]
34. TÜBITAK (2008). Modelling non-linear behaviour of reinforced concrete sections with the aid of computers (SEMAp) (In Turkish). Pamukkale, Türkiye: Scientific and Technological Research Council of Türkiye. [Google Scholar]
35. Hognestad, E. (1951). A study of combined bending and axial load in reinforced concrete members. Illinois, USA: University of Illinois. [Google Scholar]
36. ASCE (2000). Prestandard and commentary for the seismic rehabilitation of buildings. Washington DC, USA: American Society of Civil Engineers. [Google Scholar]
Cite This Article
 Copyright © 2024 The Author(s). Published by Tech Science Press.
This work is licensed under a Creative Commons Attribution 4.0 International License , which permits unrestricted use, distribution, and reproduction in any medium, provided the original work is properly cited.
 Downloads
 Citation Tools