
 Submit a Paper
 Propose a Special lssue
 Open Access
ARTICLE

Field Load Test Based SHM System Safety Standard Determination for Rigid Frame Bridge
School of Civil and Architectural Engineering, Harbin University, Harbin, 150076, China
* Corresponding Author: Xilong Zheng. Email:
Structural Durability & Health Monitoring 2024, 18(3), 361-376. https://doi.org/10.32604/sdhm.2024.048473
Received 08 December 2023; Accepted 07 March 2024; Issue published 15 May 2024
 View Full Text
 Download PDF
Abstract
The deteriorated continuous rigid frame bridge is strengthened by external prestressing. Static loading tests were conducted before and after the bridge rehabilitation to verify the effectiveness of the rehabilitation process. The stiffness of the repaired bridge is improved, and the maximum deflection of the load test is reduced from 37.9 to 27.6 mm. A bridge health monitoring system is installed after the bridge is reinforced. To achieve an easy assessment of the bridge’s safety status by directly using transferred data, a real-time safety warning system is created based on a five-level safety standard. The threshold for each safety level will be determined by theoretical calculations and the outcomes of static loading tests. The highest risk threshold will be set at the ultimate limit state value. The remaining levels, namely middle risk, low risk, and very low risk, will be determined using reduction coefficients of 0.95, 0.9, and 0.8, respectively.Keywords
Bridges, amid different types of civil infrastructure, play a key role in the transportation infrastructure that has a considerable impact on long-term economic growth and productivity [1–3]. Frequent health inspection and evaluation at a regular time period are mandatory for maintaining the ultimate purpose of bridges, to provide passage over obstacles and other otherwise inconvenient structures [4–6].
At present, some important long-span bridges have been instrumented with high-precision health monitoring systems that is designed specifically according to the structural and environmental behavior of the bridge [7,8]. But numerous small and medium-sized bridges lack the financial support for this kind of high-precision system. One-to-one design of structural health monitoring systems for small and medium bridges with similar structural behavior is time-consuming and not cost-effective [9–11]. However, the research of structural health monitoring system that has universal adaptability for small and medium size bridges in our country is still in its preliminary stages [12,13]. A practical bridge health monitoring system needs to balance cost, efficiency, accuracy, stability, and sustainability. The most important role of the structural health monitoring system is to alarm over-threshold damages, whether globally or locally, on a timely basis. Moreover, the interface of the monitoring system needs to be easily visually comprehensible, so that technicians, civil engineers, and other management personnels can retrieve the necessary and relevant data for bridge condition assessment [14–17].
The goal of this dissertation is to use the structural health monitoring system as a tool for rehabilitated bridge evaluation. Also, determine the reliability of the selected continuous rigid frame bridge rehabilitation method and the bridge’s serviceability. In order to fulfill these objectives, static and dynamic loading test results combined with SHM data were analyzed based on structural responses such as mid-span deflection, strain, and external prestressing tendon tension.
General view of the rehabilitated highway bridge is shown in Fig. 1. The highway bridge, which is the subject of interest in this thesis, is located in the northeast region of China. It was originally opened to traffic in December 2010. The bridge spans a total length of 549,356 mm and has a width of 24.5 m. However, the focus of the rehabilitation efforts was from north to south, specifically from Xing Mountain to the provincial border. The width of the bridge is 12 m, accommodating two traffic lanes. The span arrangement is 75 m + 3 × 130 m + 75 m, as shown in Fig. 2.
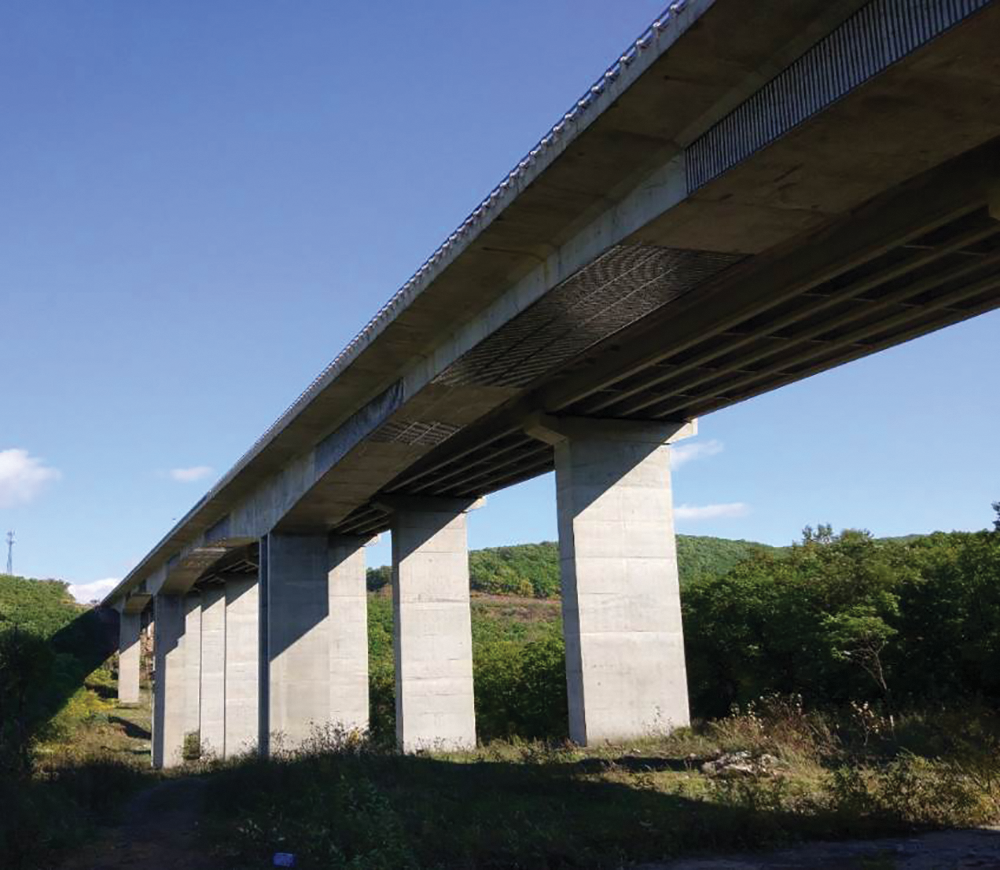
Figure 1: General view of the rehabilated highway bridge
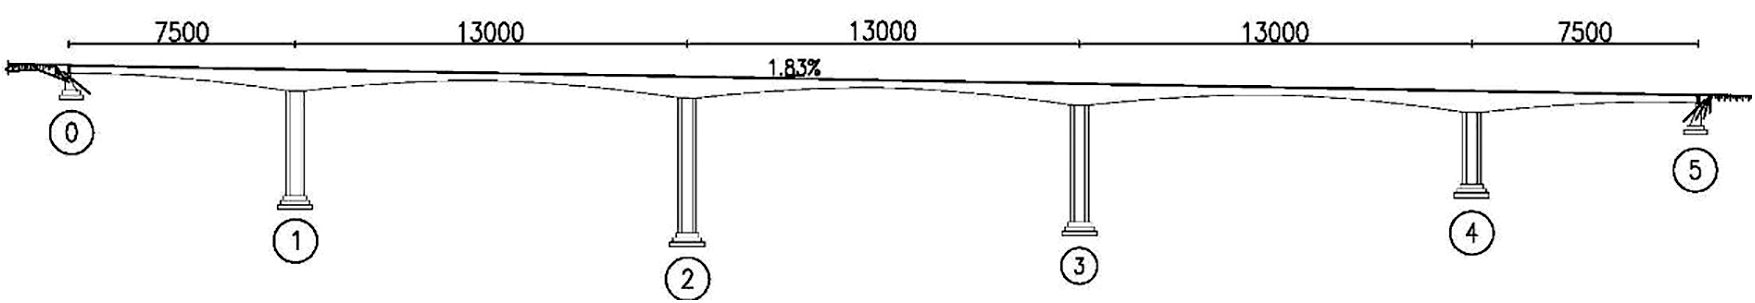
Figure 2: General view of the rehabilitated highway bridge (unit: cm)
The superstructure is made up of a 5-span continuous prestressed concrete rigid frame, which includes a prominent large box girder. The box girder is single-walled; 7.0 m in height being the tallest cross-section on top of a pier, whereas 2.5 m in height at mid-span. The bottom plate of the box girder has a width of 5.6 meters, while the bridge flange is 3.2 meters wide.
The top layer of the box girder is 0.25 m in thickness, and 0.50 m in thickness for cross-sections near a pier. The thickness of the web is 0.8 m around a pier, 0.40 m for the 81.4 m range in the middle of the span, and 0.6 m for the rest of the webs. The thickness of the bottom plate on top of a pier is 1.2 m, 1.0 m at the pier junction, and 0.25 m at mid-span.
An illustration of typical cross-sections is shown in Figs. 3a and 3b.
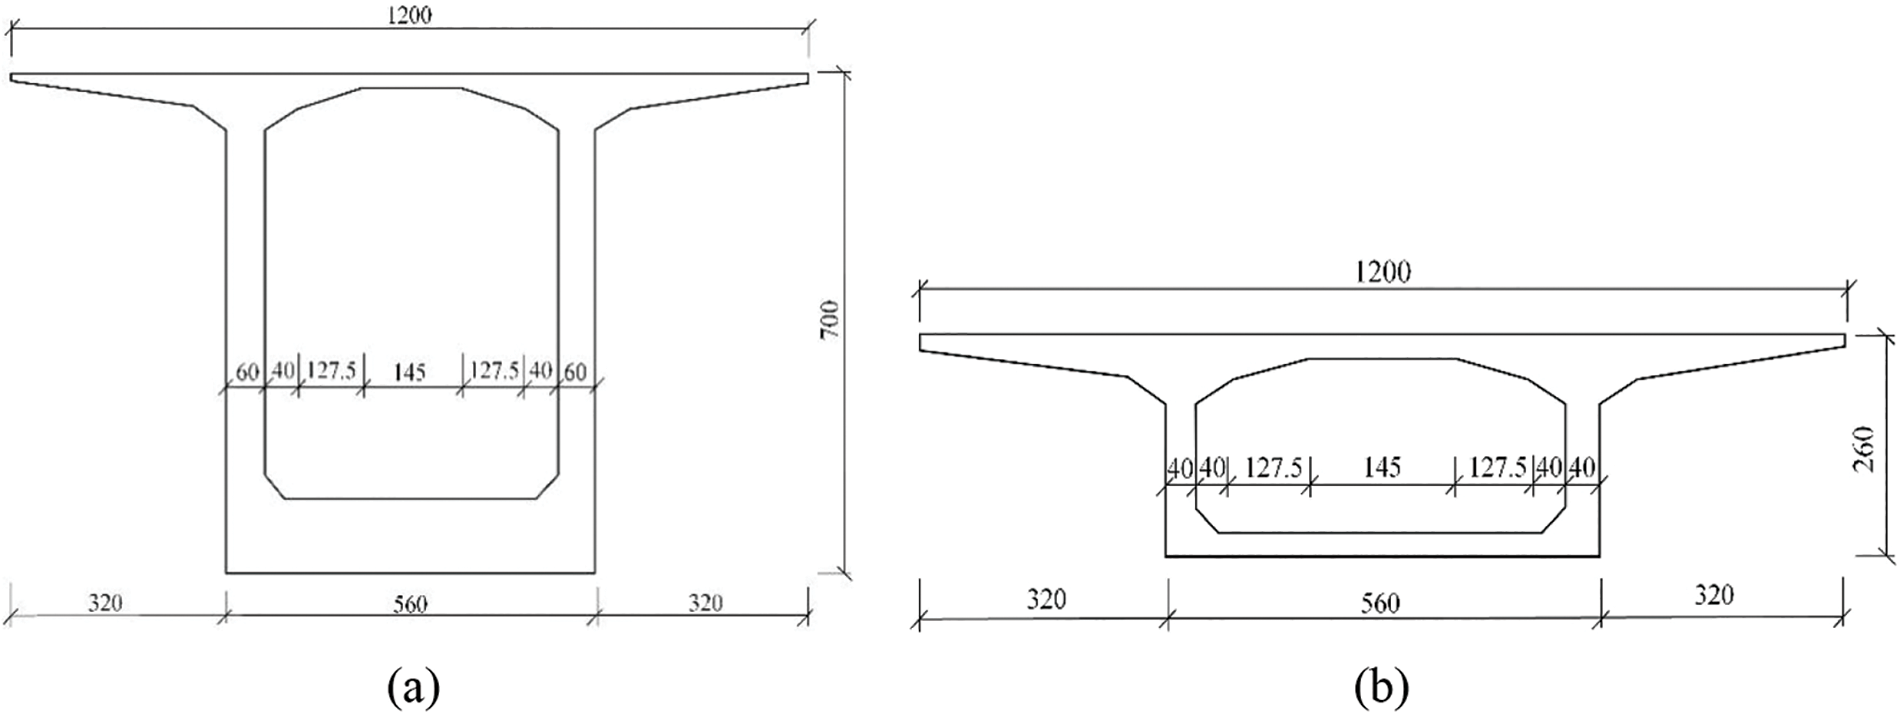
Figure 3: Cross-section view for (a) top of a pier (b) mid-span (unit: mm)
2.2 Bridge Damages and Deteriorations
The specific continuous rigid frame box girder bridge that has been examined in this study was initially put into service for vehicular traffic in the year 2006. Nevertheless, after a mere six years of service, the bridge started to display indications of deterioration and a decrease in its ability to bear loads. Cracks were identified on the upper slab, web, and lower slab of the bridge during routine inspections conducted in 2012, 2013, and 2015, with a greater prevalence noted on the external surfaces compared to the internal surfaces. Over the passage of time, there was a noticeable increase in the length, width, and quantity of cracks. Most of the cracks measured between 0.15 to 0.4 mm in width and 0.3 to 7 m in length. In compliance with the specified codes and standards, the presence of transverse cracks in prestressed concrete beams is considered undesirable, while longitudinal cracks are permissible as long as their width does not exceed 0.2 mm. Despite this, multiple vertical cracks on the box girder were found to surpass the specified allowable limit. The distribution pattern of these cracks on the web of the box girder is illustrated in Fig. 4.
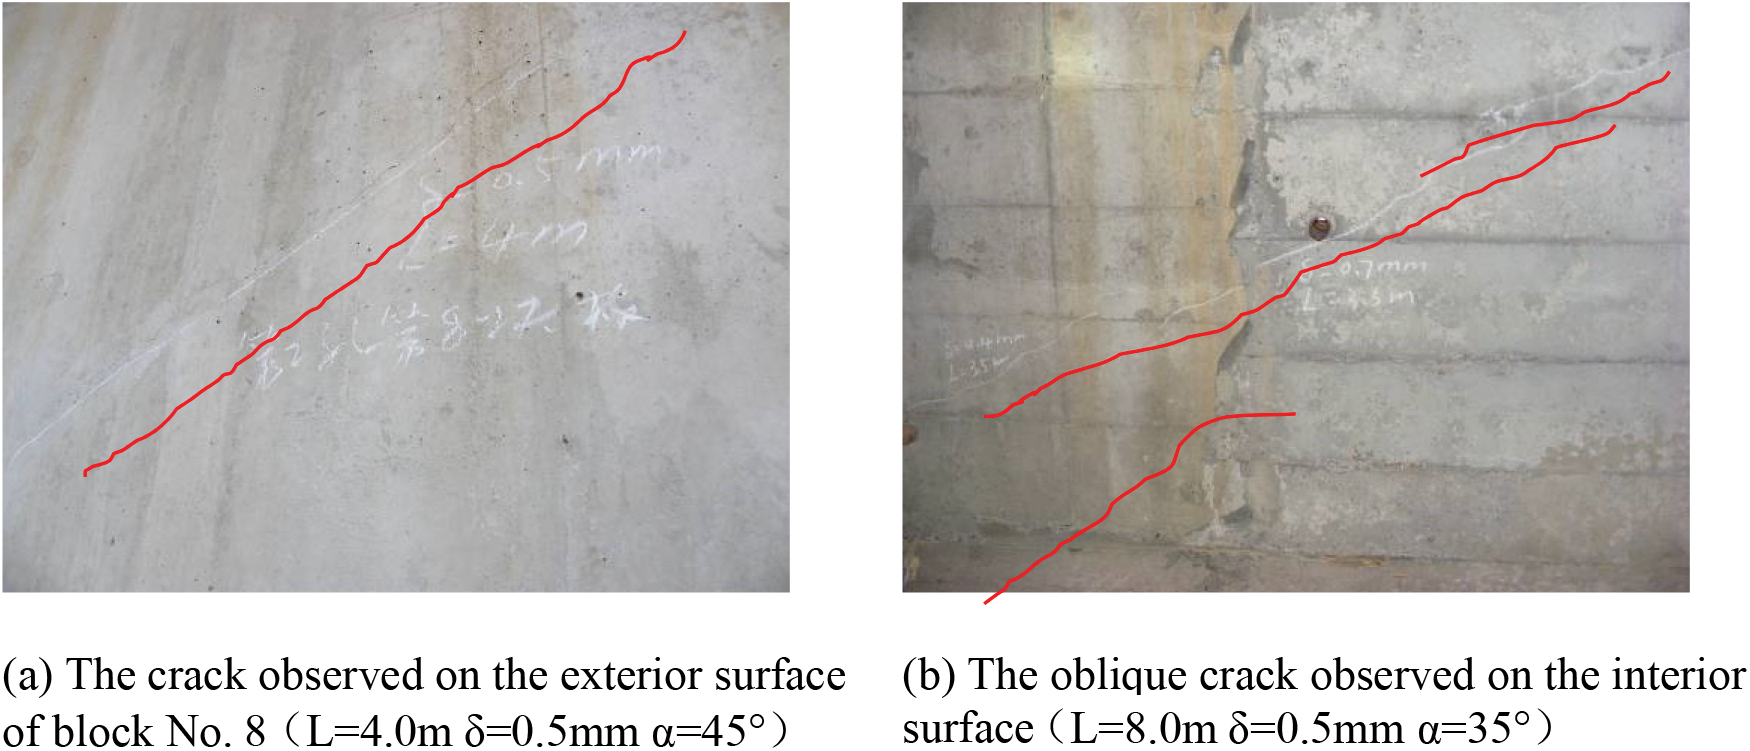
Figure 4: Cracks distribution on the web
During the 2013 inspection, on the exterior surface of the bottom slab of span No. 2 in the fold section, five longitudinal cracks were detected. These cracks had lengths ranging from 2 to 7 m and widths ranging from 0.6 to 4 mm. During the 2015 inspection, a total of nine longitudinal cracks were identified on the bottom slab of the fold section. Out of these, four cracks were observed on the bottom slab of span No. 3, while seven cracks were found in span No. 2. The bottom slab of span No. 2 exhibited the most severe condition, with cracks reaching a maximum width of 4 mm and a depth of 3 mm, leading to concrete separation. After removing loose concrete around the cracks, it was discovered that the affected area had become hollow and the corrugated pipe had suffered minor damage. Damages are shown in Fig. 5.
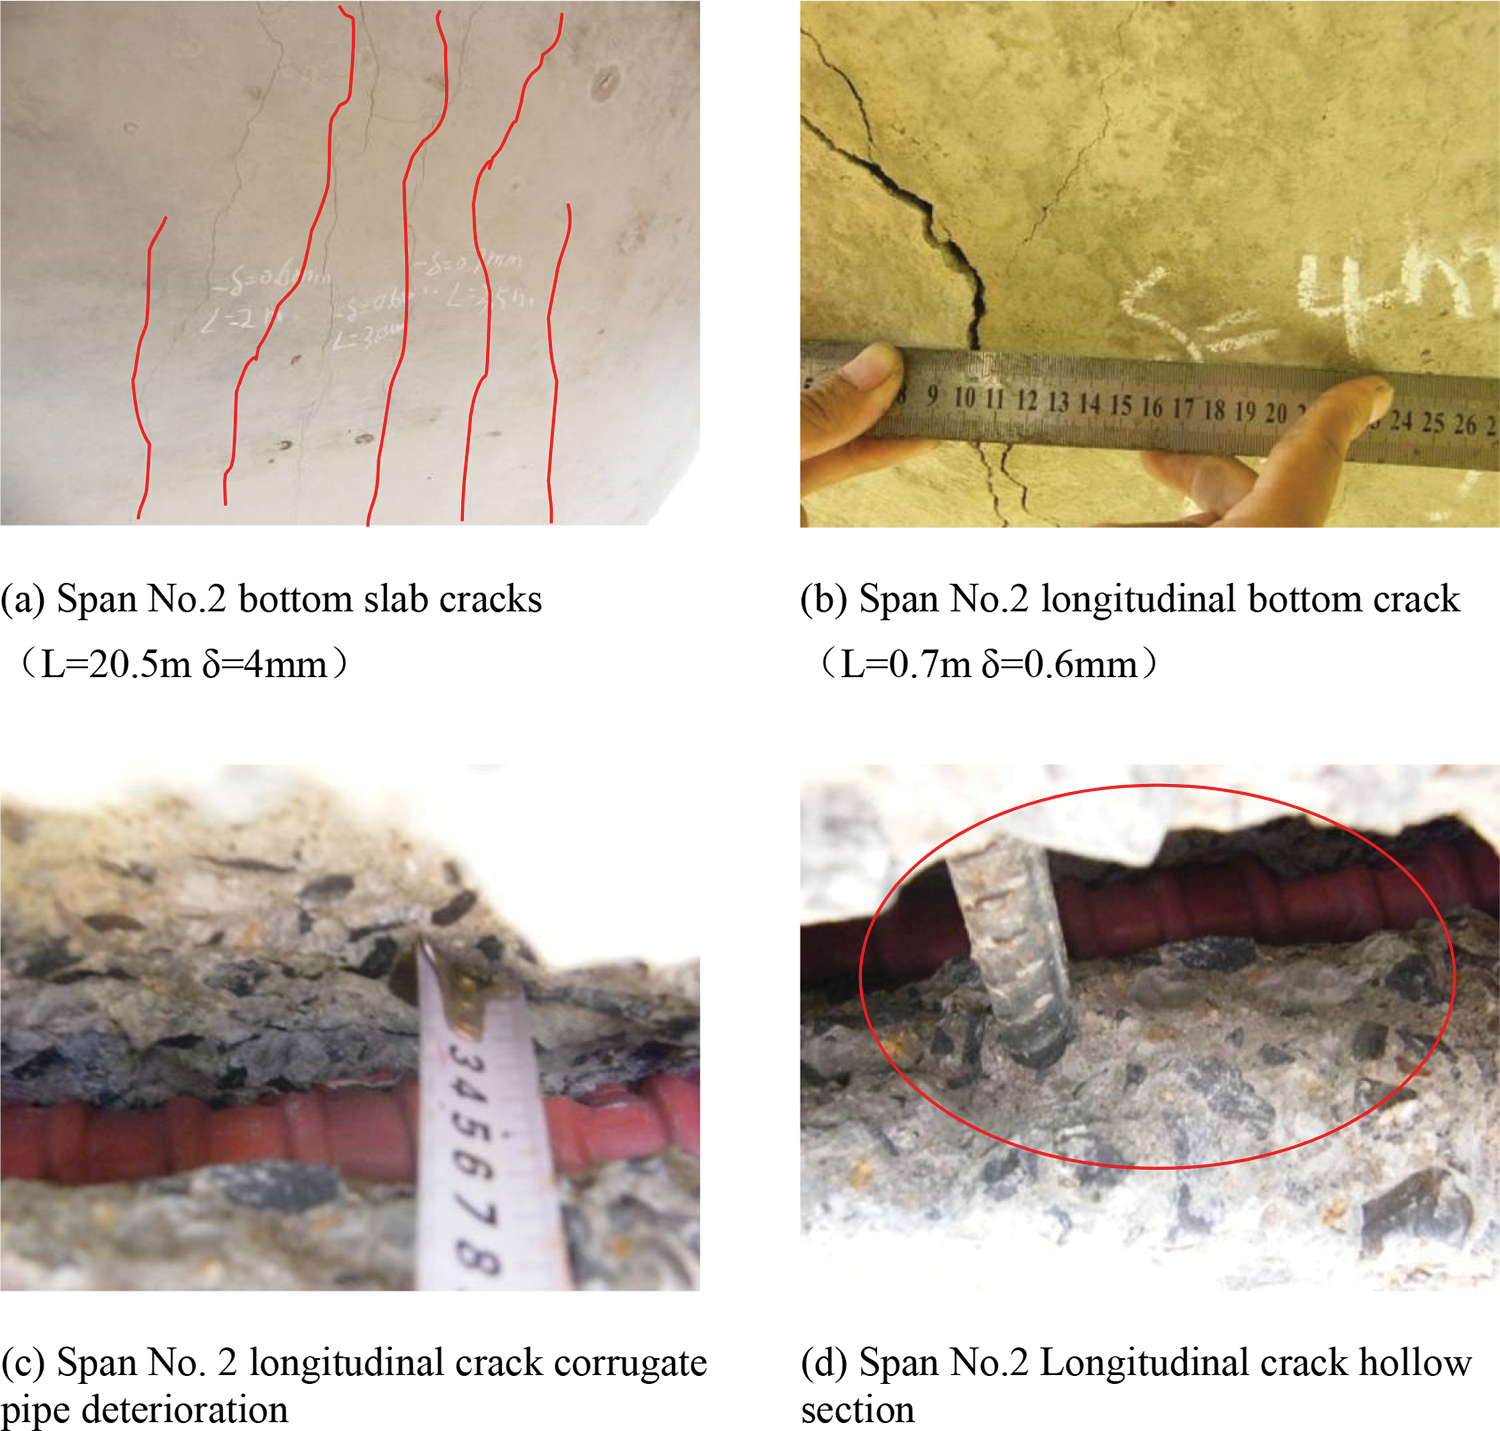
Figure 5: The cracks detected on the underside of the box girder’s slab
2.3 Rehabilitation with External Prestressing and Steel Plates
1. External Prestressing Strengthening
The inner surface of the box girder serves as the anchor point for the external prestressing strands, with a total of 8 external tendons for each span. Detailed arrangements are shown in Figs. 6 and 7.
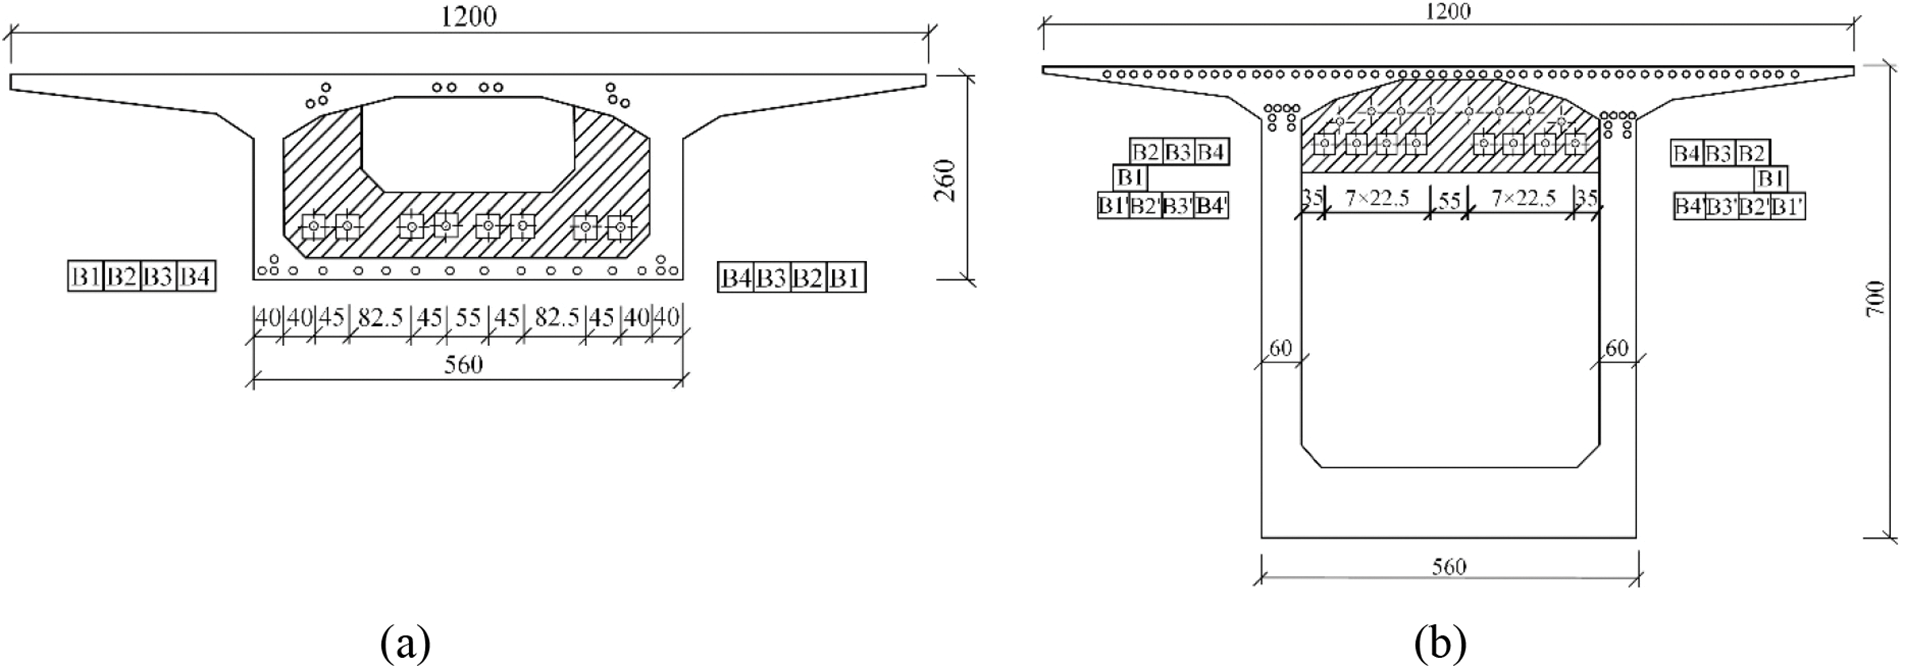
Figure 6: Cross section view of external prestressing
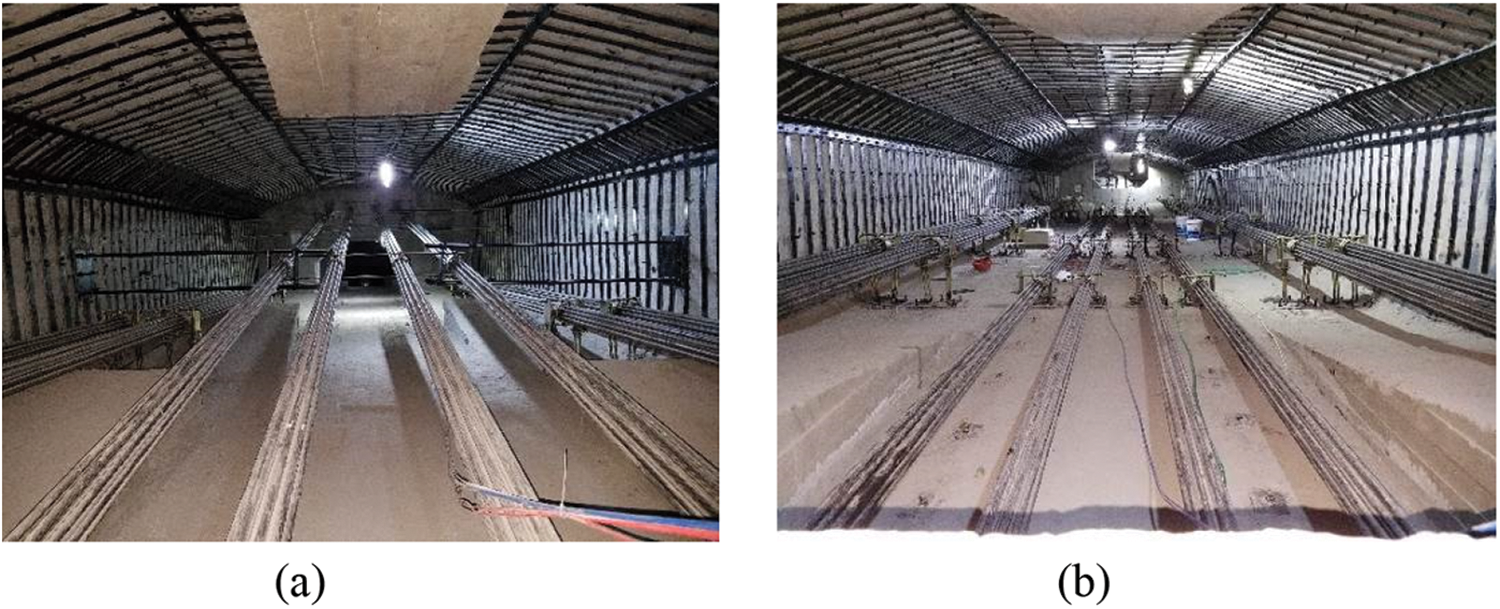
Figure 7: On-site installation of external prestressing tendon
2. Diagonal Cracks Strengthening
Reinforcement stirrups of the diaphrams are of diameter Φ10, which are not sufficient in restricting crack growth. To restrict the diagonal cross-section strength, steel plates of grade Q235C were affixed to sections 6~14 within the girder and sections 6~10 on the exterior of the girder. These steel plates measure 60 mm in width and 6 mm in thickness, with the length determined by the height of the web. The plates are spaced at 150 mm intervals on the inside and 200 mm intervals on the outside. The anti-corrosive coating used zinc-rich primer plus coal tar epoxy coating. Two layers of zinc-rich primer, each of 35 μm, and two layers of coal tar epoxy coating, 80 and 120 μm. The total thickness of the steel plate is 200 μm as shown in Fig. 8. For severe diagonal cracks that existed, they should be gluded before the steel plates pasting.
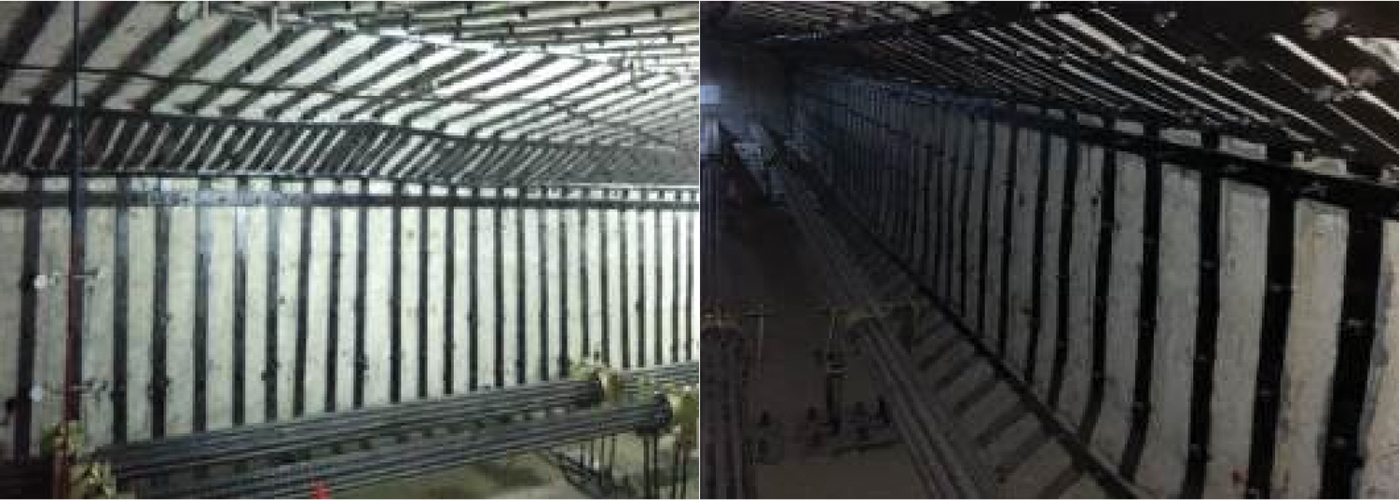
Figure 8: Steel plates on the interior of the girder web
Midas/Civil is a spatial finite element modeling and analysis software, which can be used for the design and analysis of bridge structures, industrial plant structures, airports, dams, harbors, underground structures, as well as other comprehensive civil engineering structures.
Midas/Civil software was utilized for finite element modeling of the entire bridge structure. The element type is beam element. The model comprises the structure consists of 300 elements and has a total of 325 nodes. Specifically, the bridge deck is characterized by 154 elements and 155 nodes, whereas the piers feature 146 elements and 170 nodes. The boundary condition of the bottom of the flexible pier is consolidation, and the boundary condition of the two ends of the beam is horizontal sliding. The main beam and pier share a joint. The model is established according to the construction stage, and the effect of shrinkage and creep in 12 years after construction is considered. On this basis, the post-tensioning prestressing model is established. The piers and bridge deck are firmly interconnected. The bridge abutments are vertically supported, providing vertical stability. For the calculation, design parameters based on grade A prestressing structure standards were employed. The safety standard adhered to is level 1, which is the highest safety level. The structural components of the bridge are cast in-situ. The bridge itself is a prestressed concrete continuous rigid frame box girder, comprising spans of 75 m, followed by three spans of 130 m each, and another 75 m span. The depicted Fig. 9 demonstrates the Finite Element model, which consists of 61 construction stages and enables the simulation of various important rehabilitation procedures, such as on-site cantilever concrete casting.
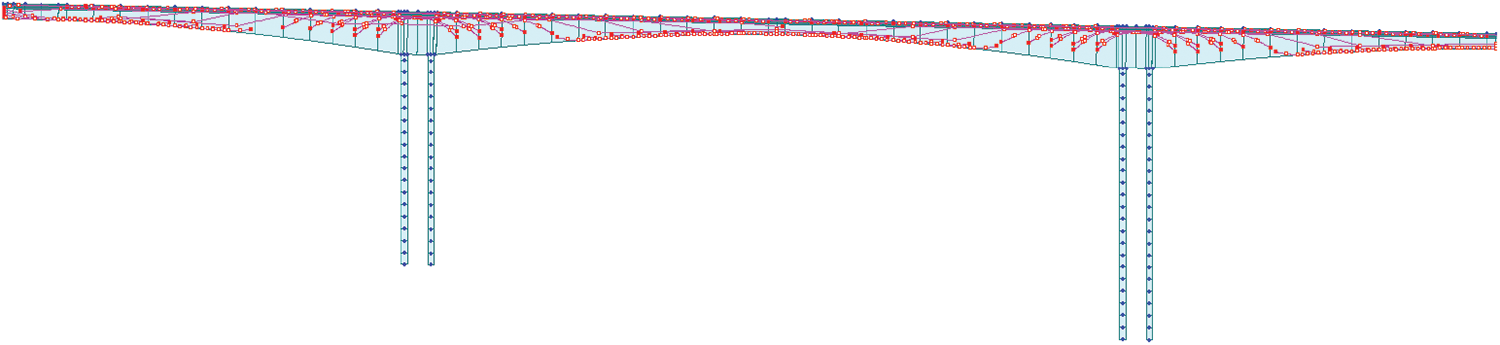
Figure 9: MIDAS external tendon model
In order to accurately capture deflection and stress in the girder across different operating conditions, the model has identified specific critical sections for thorough calculation and analysis. A total of 21 significant sections have been designated along the travel direction from Xing Mountain to the provincial border. These sections encompass key features such as the bridge abutment, the upper portions of the piers, positions at quarter-span, half-span, and three-quarter span intervals. For ease of reference, these key sections are named as Sec1, Sec2, Sec3, and so on up to Sec21. However, since the bridge structure exhibits global symmetry, the analysis will focus solely on Sec1 to Sec11, as they encompass the necessary representative sections. Key sections are shown in Fig. 10.
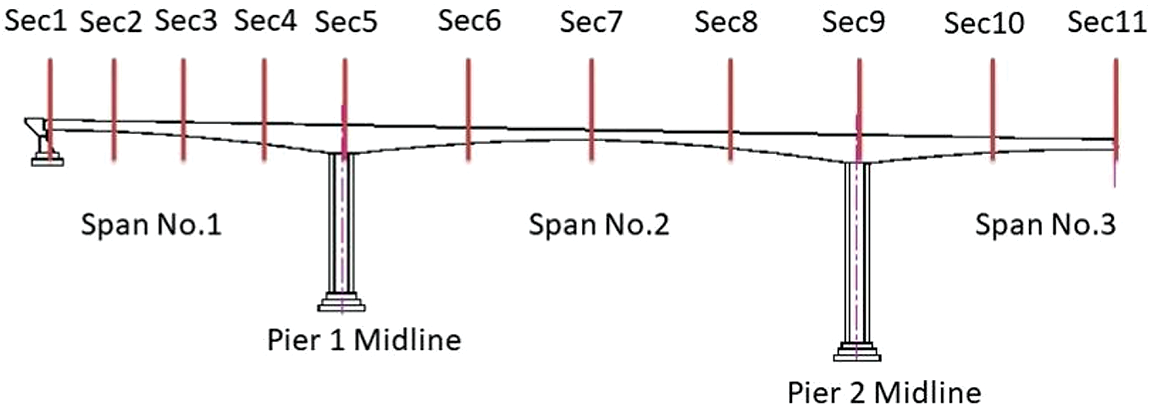
Figure 10: Key sections of the analytical model
According to the specifications outlined in code JTGD62-2004, the upper plate and lower plate of the bridge structure were evaluated for normal stress and principal compressive stress under standard combinations. For calculating principal tensile stress, short-term combinations were used, taking into account the long-term growth factor ηθ = 1.475. Additionally, the deflection values were determined for all key sections after subtracting the influence of the dead weight. Results are shown in Table 1.
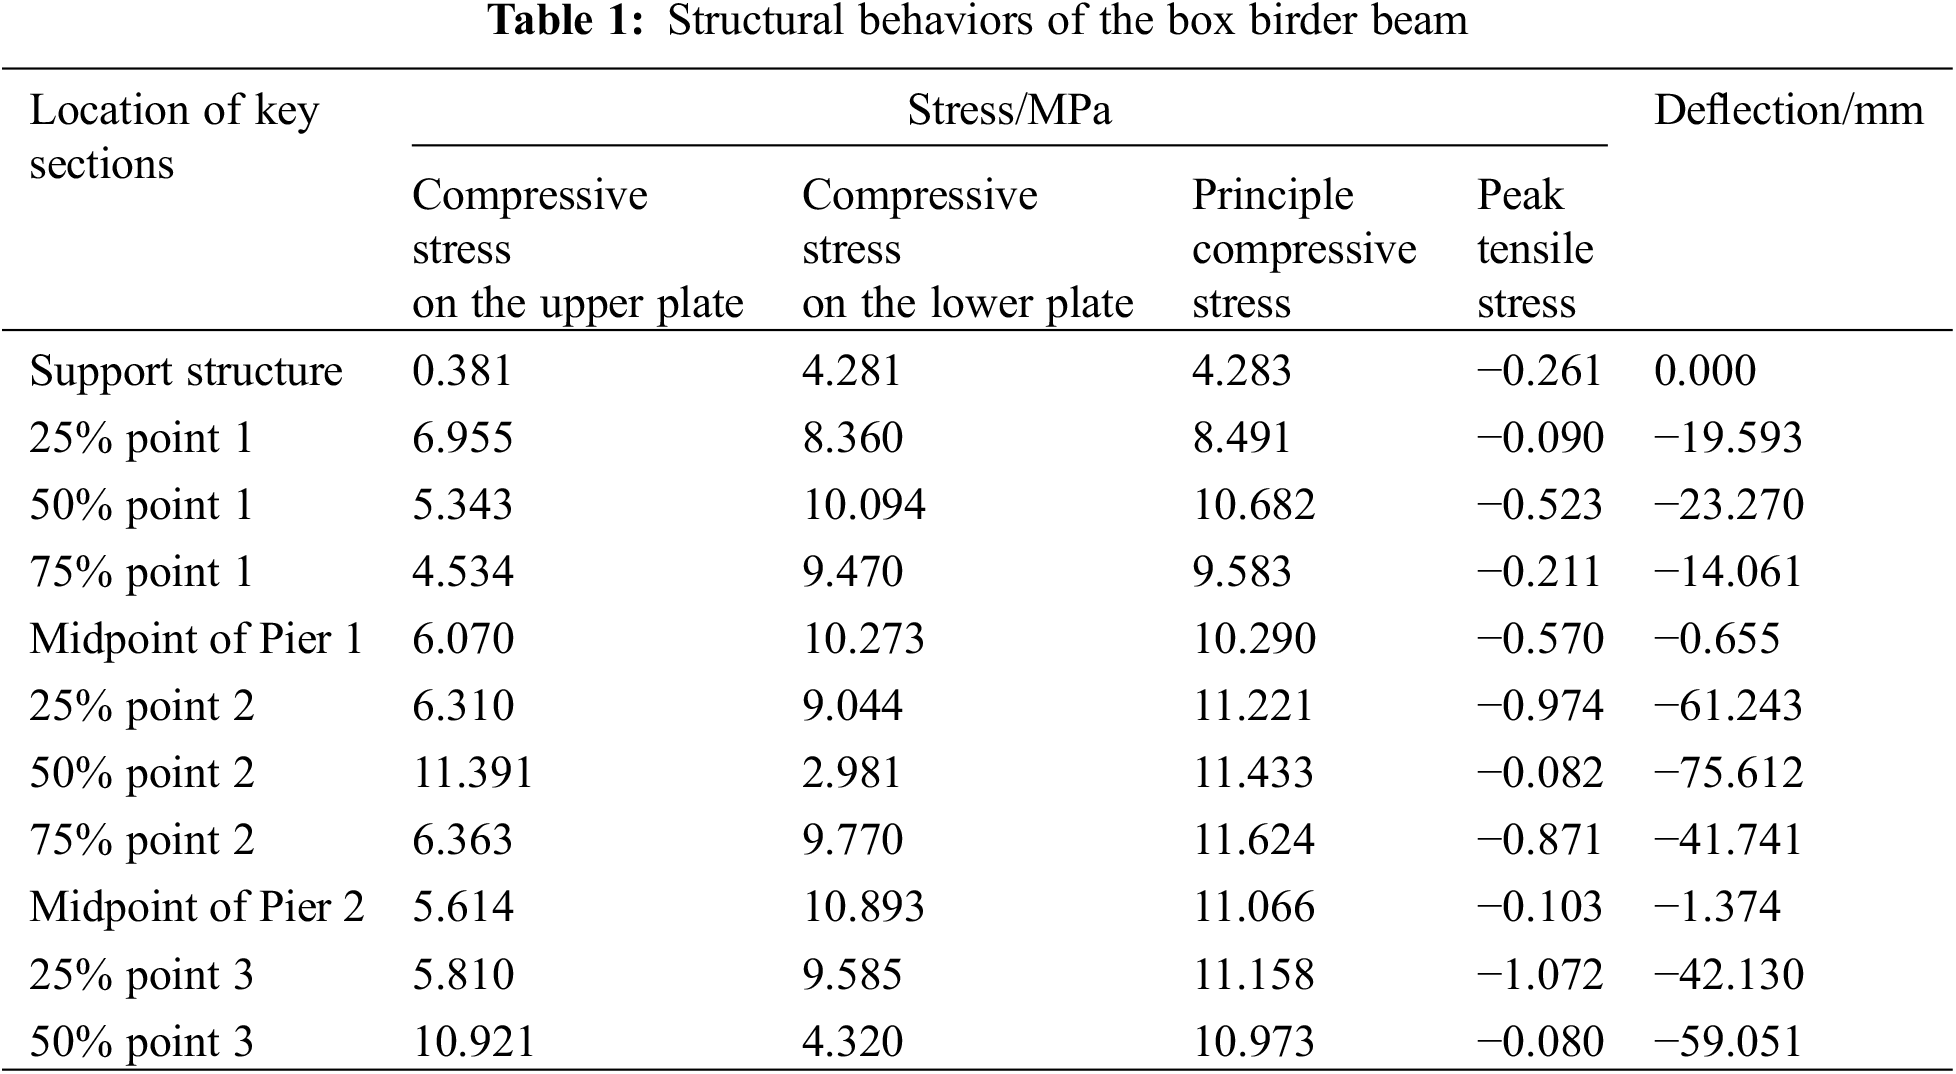
Based on Table 1 and Figs. 11–13, all cross-sections of the bridge structure were found to be under a compressive state. The maximum compressive stress in each span is concentrated near the mid-spans, and the maximum compressive stress in the lower bound occurs within the quarter-span to the pier region. Alternatively, the highest tensile stress in each span is found at or close to the quarter or three-quarter cross-sections.
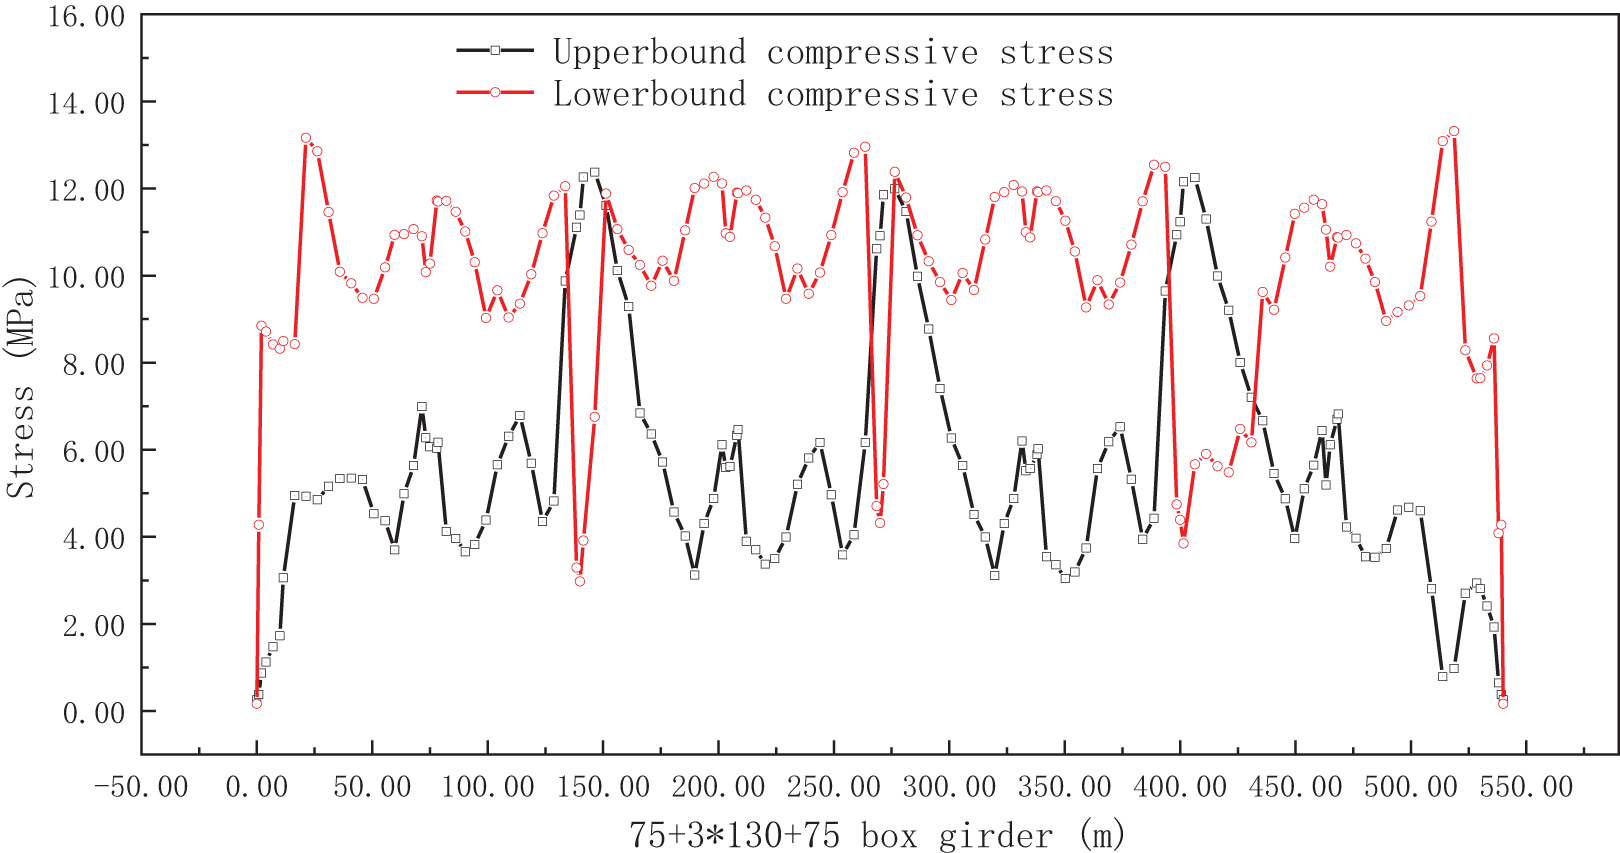
Figure 11: Maximum and minimum compressive stress
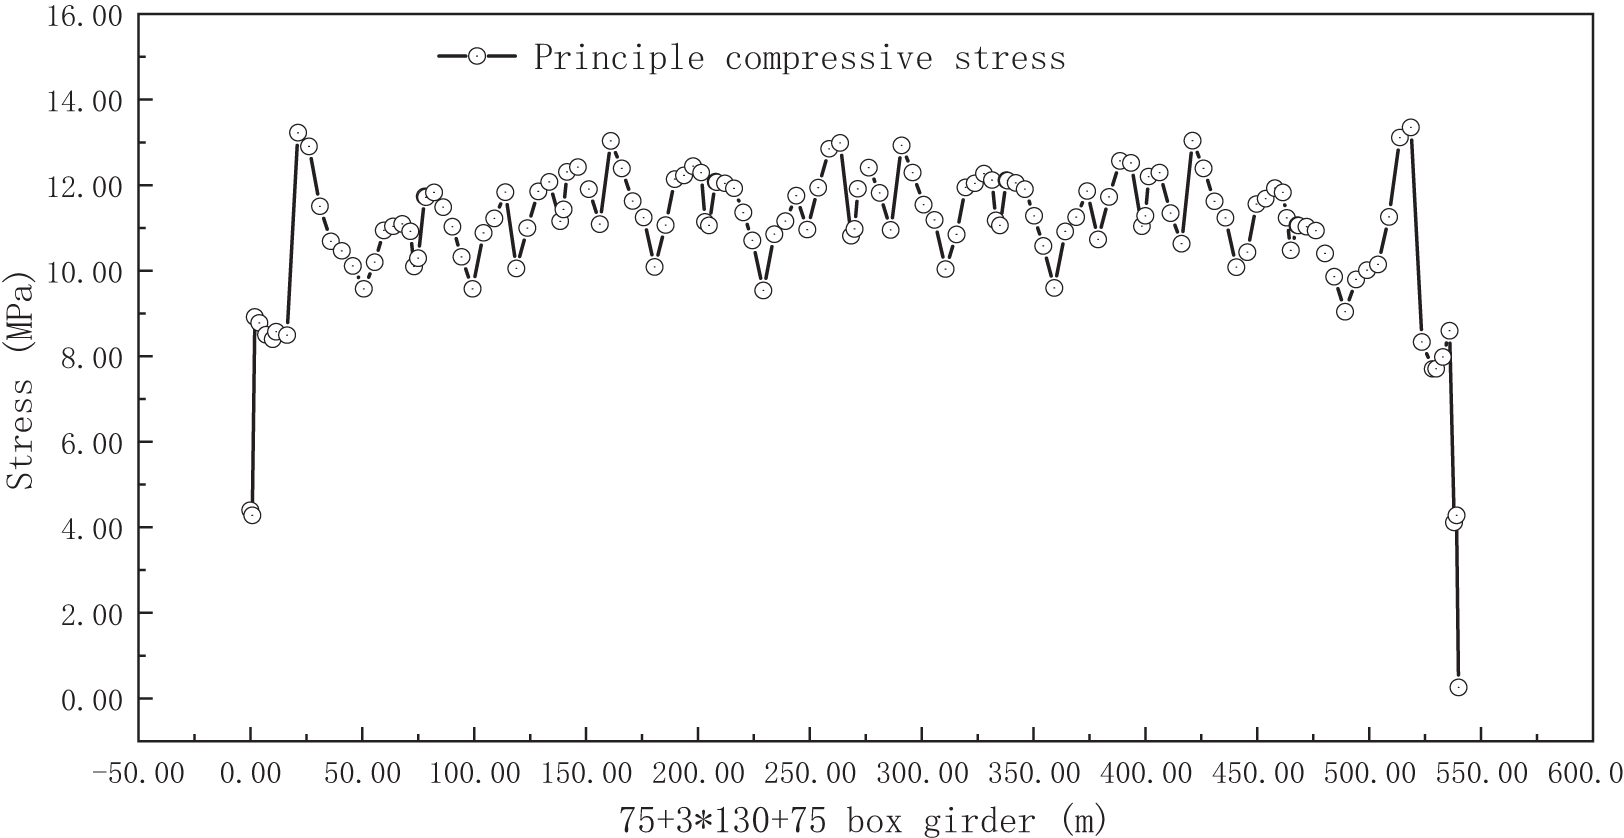
Figure 12: Compressive stress derived from the box girder principle
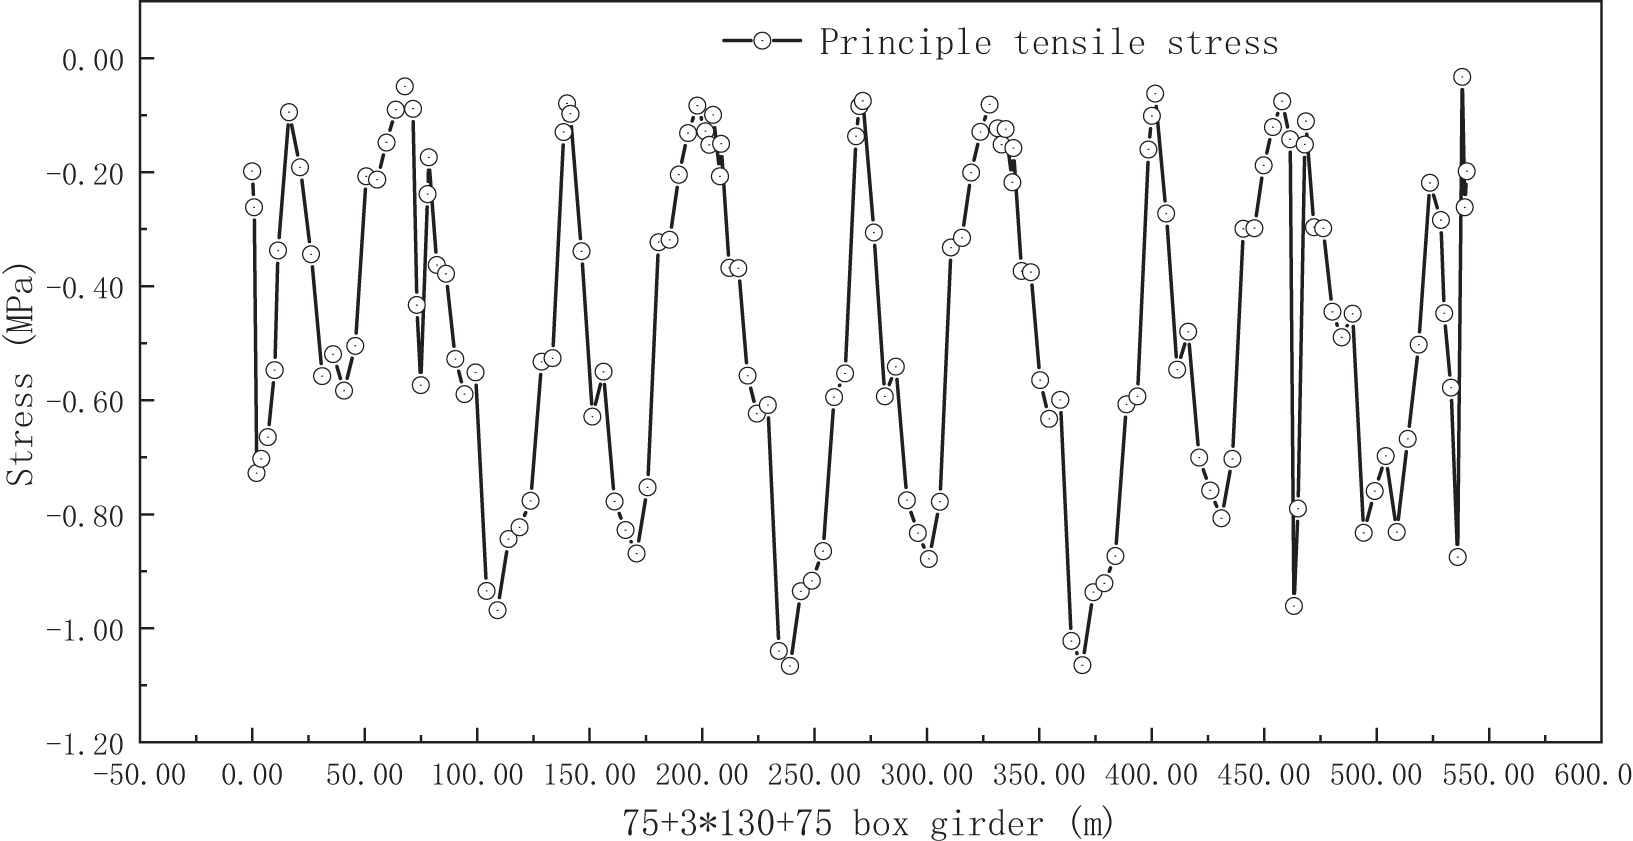
Figure 13: Tensile stress derived from the box girder principle
The maximum compressive stresses observed in the key section at the midspan are 11.39 MPa for the upper bound and 10.89 MPa for the lower bound. These values are lower than the threshold requirement of 0.5 fck = 16.2 MPa stipulated in the JTGD62-2004 code for structural components of type A. Furthermore, the maximum principal compressive stress observed in the key section at the midspan is 11.62 MPa, which is less than the 0.6 fck = 19.44 MPa prescribed by the JTGD62-2004 code. Regarding tensile stress, the maximum value observed near the quarter span is −1.07 MPa, which is also lower than the 0.5 fck = 1.33 MPa specified in the JTGD62-2004 code.
During the process of pouring concrete, the central section of both the side spans and end spans was fully sealed. As a result, the maximum deflection values at half of the span length were considered as the maximum deflection values for the crucial sections. In the case of the end spans, the maximum deflection value was determined to be 19.59 mm, which falls below the threshold deflection value of L/600 = 125 mm specified in the JTGD62-2004 code. Similarly, for the side spans and midspans, the maximum deflection values were found to be 75.61 and 59.05 mm, respectively. Both values are below the L/600 = 216.7 mm threshold specified in the code. Based on these findings, it can be inferred that the reconstructed bridge meets the Grade-I load design criteria specified in the JTGD62-2004 code. Moreover, the successful implementation of the strengthening technique is also affirmed by these results.
The 5-span bridge, with spans measuring 75 m + 3 × 130 m + 75 m, was originally designed to accommodate a live load of 360 kN. The design specification was developed in accordance with the Chinese design code JTG 021-1985, which corresponds to the AASHTO HS15 loading requirement stipulated in the American bridge design code. To evaluate the structural performance of the bridge, static loading tests were carried out before and after the reinforcement measures were implemented. Fig. 14 presents a visual depiction of these tests. In order to simulate the maximum bending moment effect and ensure the effectiveness of the test, 8 heavy vehicles are determined to be used as the test load. The test loads are 352.2, 362.0, 334.5, 371.6, 342.8, 330.1, 351.4, and 371.3 kN, respectively. The grade I load of the highway is simulated by changing the longitudinal position on the bridge floor to ensure the test load efficiency. The diagram of medium load and off-load loading is shown in Fig. 15.
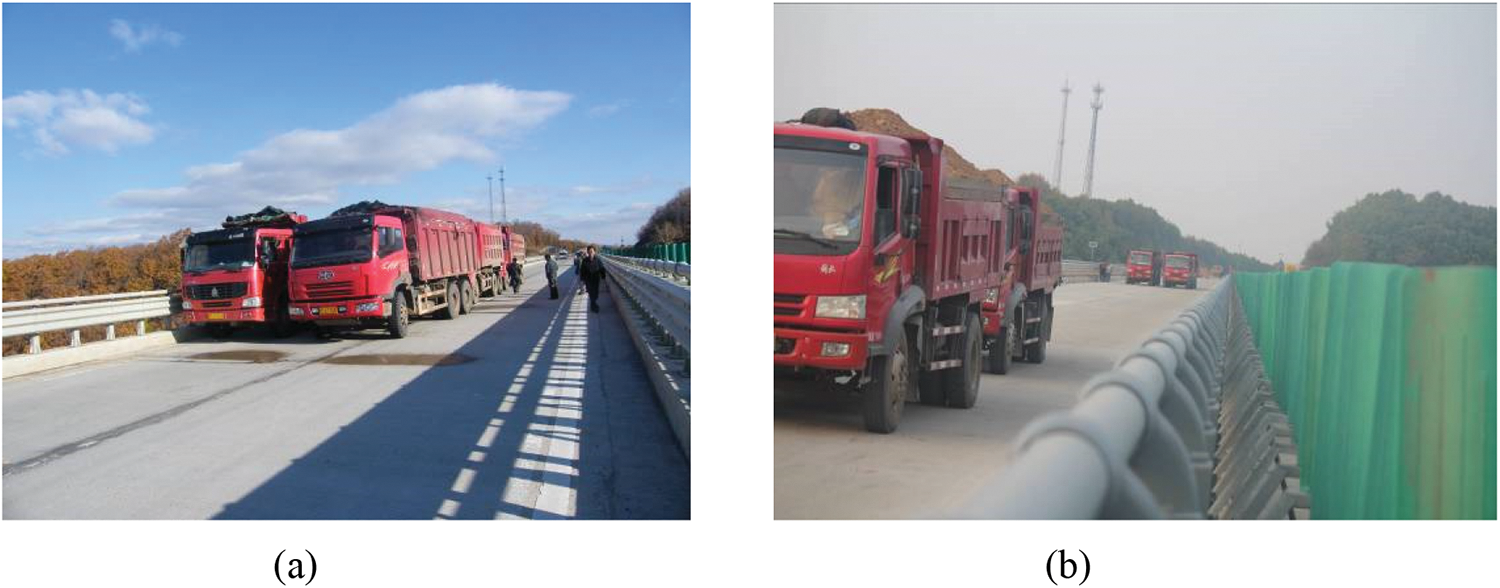
Figure 14: Eccentric loading of load test: (a) before strengthening; (b) after strengthening
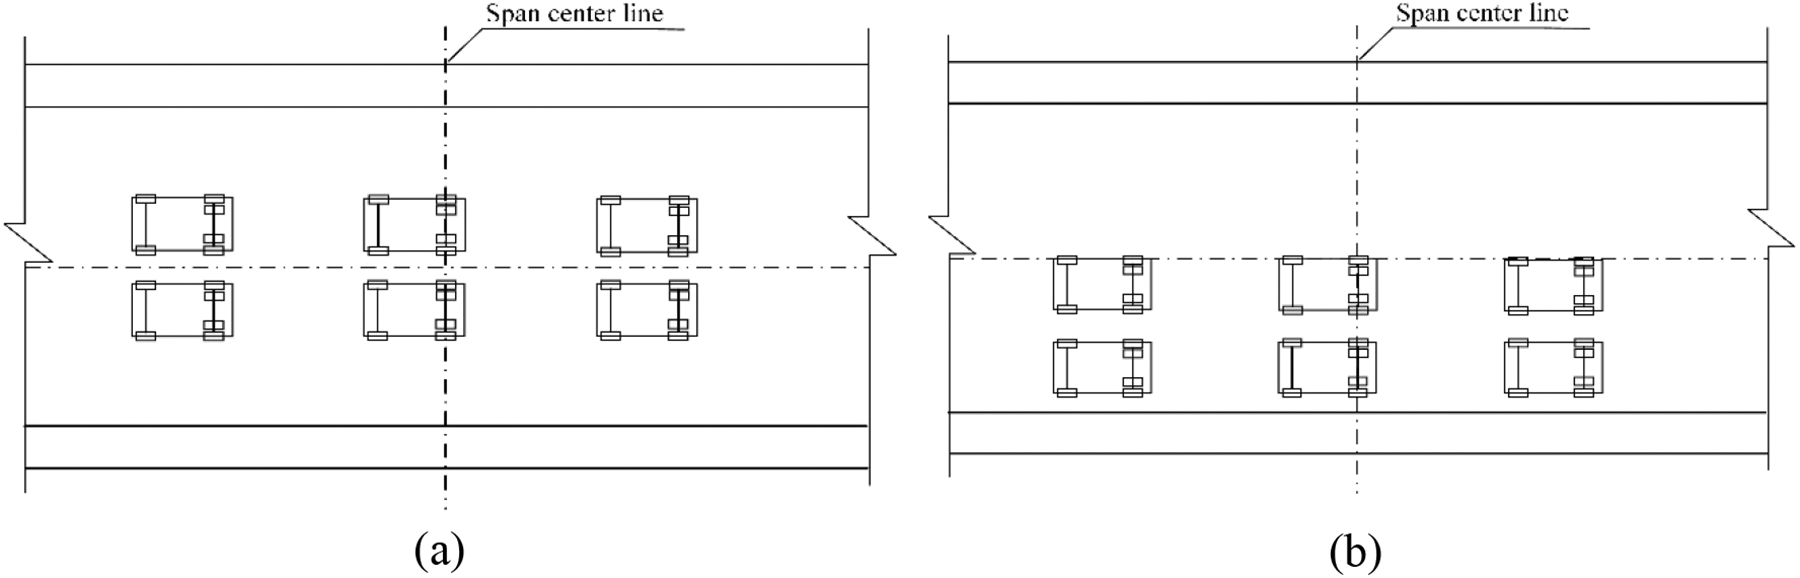
Figure 15: Loading diagram: (a) symmetric loading; (b) eccentric loading
4.1 Deflection under Static Loading
The deflection value serves as an indicator of the structural integrity and resilience of a bridge. It is an essential parameter that is carefully monitored during load testing. To accurately capture the deflection behavior, measurement points are strategically located at positions where the theoretical maximum bending moment is expected to occur. Fig. 16 illustrates the placement of deflection measurement points, labeled as 1, 2, and 3, on the upper surface of the girders.
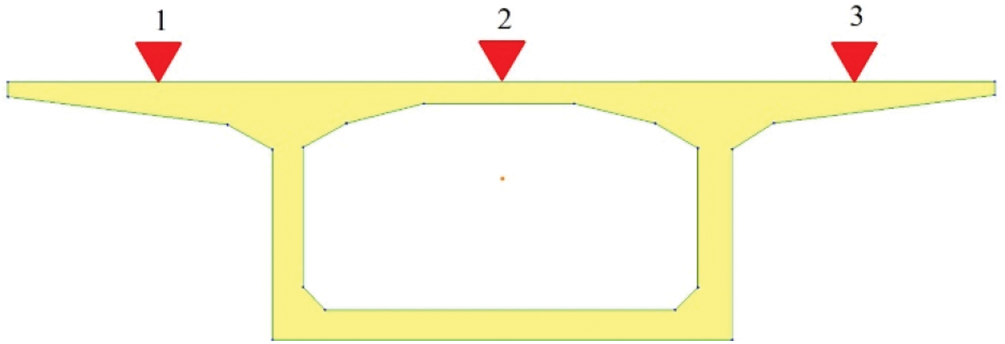
Figure 16: A cross-sectional perspective illustrating the positions of deflection measurements
The findings regarding vertical shift, obtained through measurements, are presented in Fig. 17, depicting the conditions before and after the strengthening process. The measured deflection values after the rehabilitation of the bridge are all lower compared to the values recorded before the strengthening. In particular, the maximum displacement has decreased to 27.6 mm, a significant improvement from the initial value of 37.9 mm, representing a 27% reduction. The bearing capacity of each span has also shown improvement. Span No. 1 has experienced an 18.2% increase in its bearing capacity, while span No. 2 has seen a 17.5% increase, and span No. 3 has shown a 19.7% improvement. These results highlight the effectiveness of external prestressing in enhancing structural performance. However, it is important to note that the actual progress achieved is slightly lower than the theoretical calculated progress due to prestress loss that occurred during the construction process.
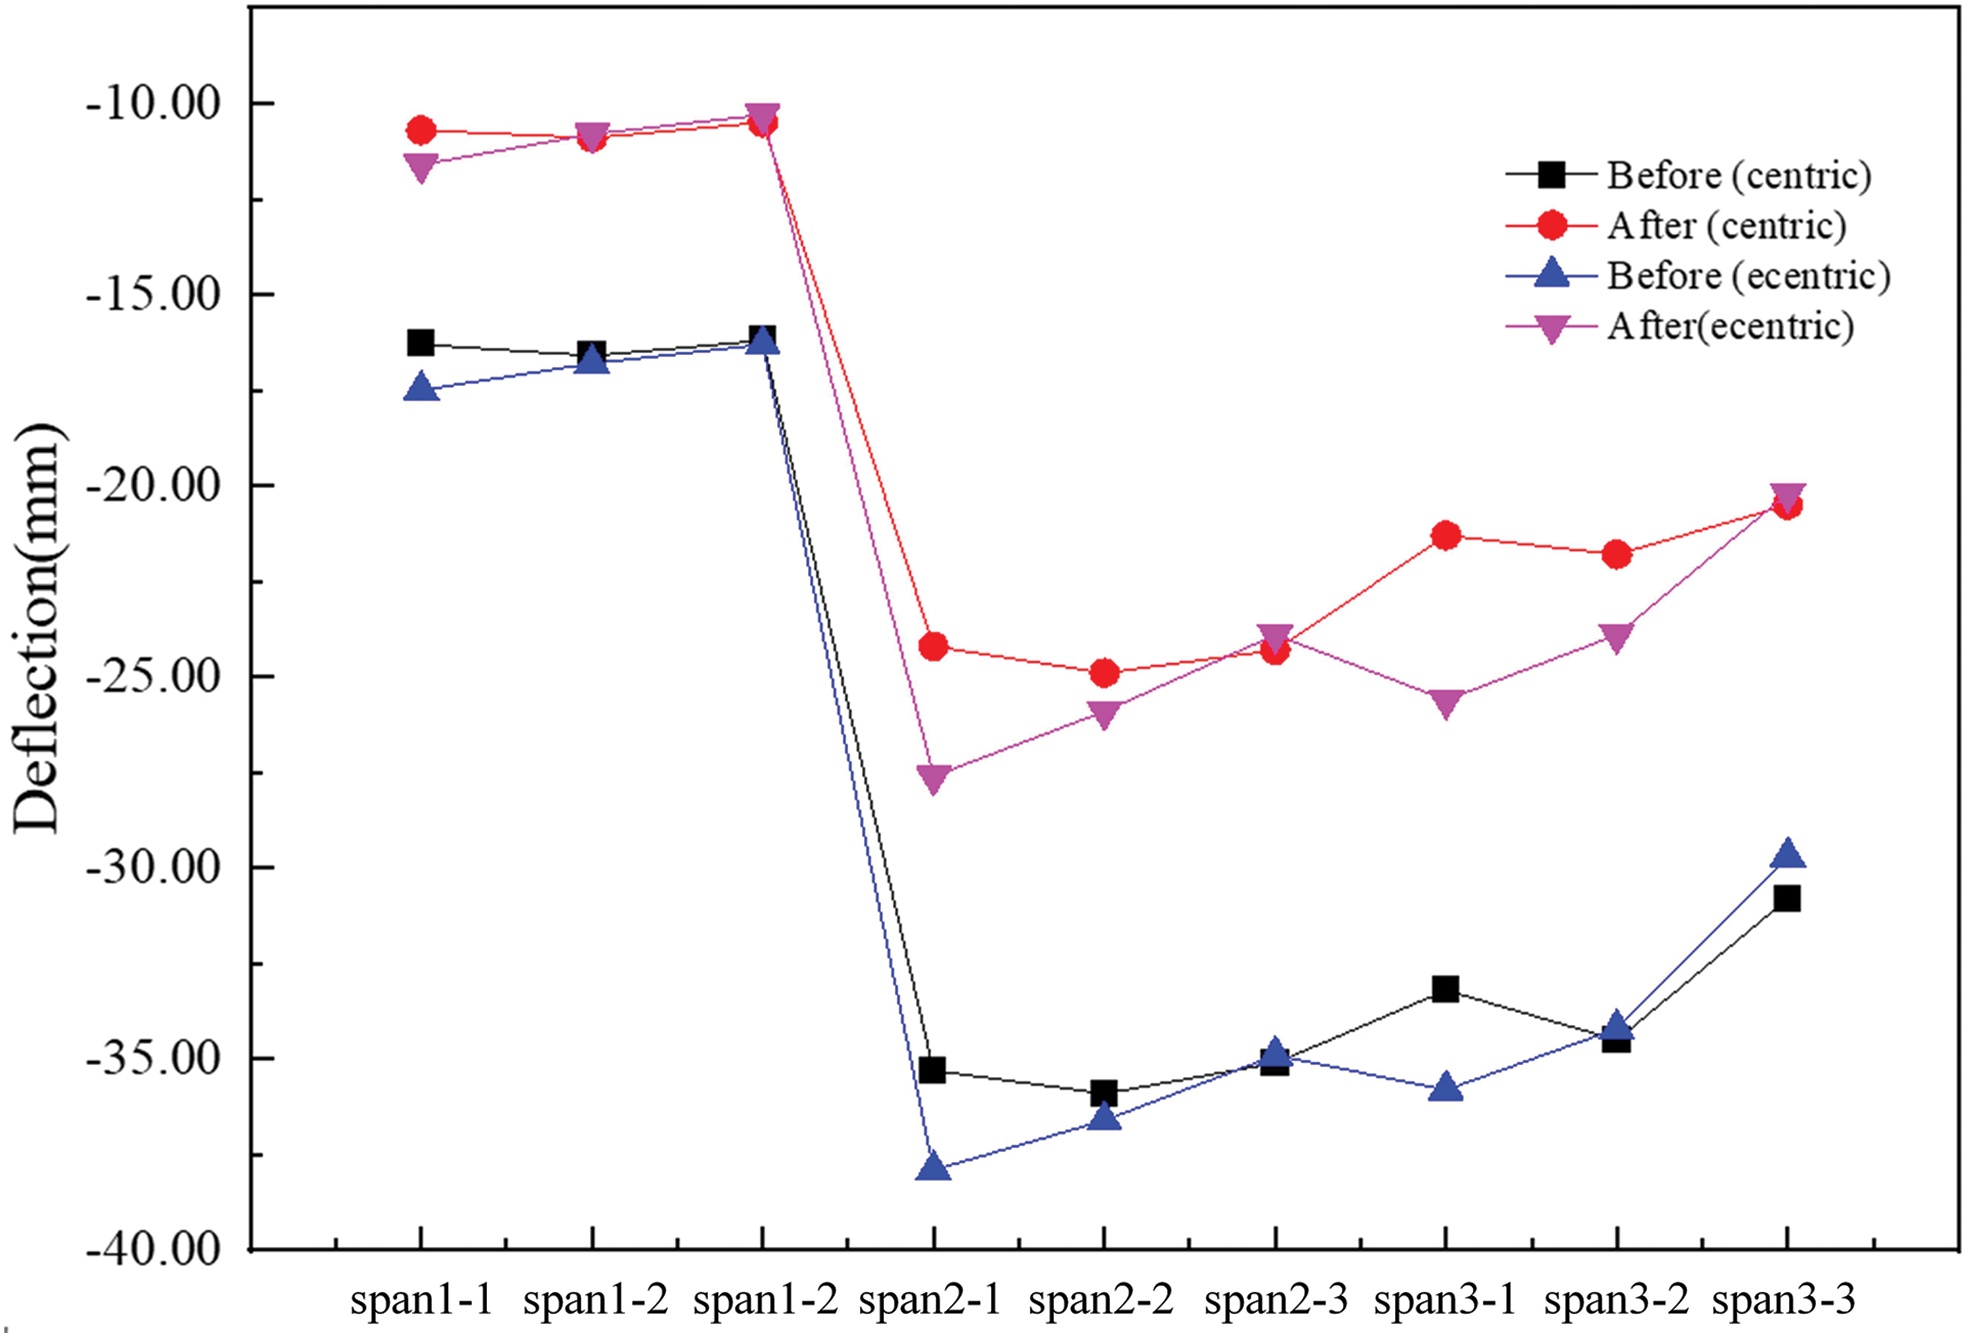
Figure 17: Graph showing the measured vertical displacement curve
4.2 Strain under Static Loading
Strain is a crucial parameter that provides valuable insights into the structural behavior of bridges. In this particular case, strain gauges were strategically positioned along the interior surface of the box girder to accurately measure strain levels. Furthermore, strain measurements can be converted into stress values for further analysis and evaluation of the bridge’s performance.
In order to account for the variation within the realm of structural mechanics between the midspan and sections near the piers, Fig. 18a displays the positioning of strain monitoring locations at the mid-span cross-section, while Fig. 18b illustrates the strain measurement points at the top of the pier.
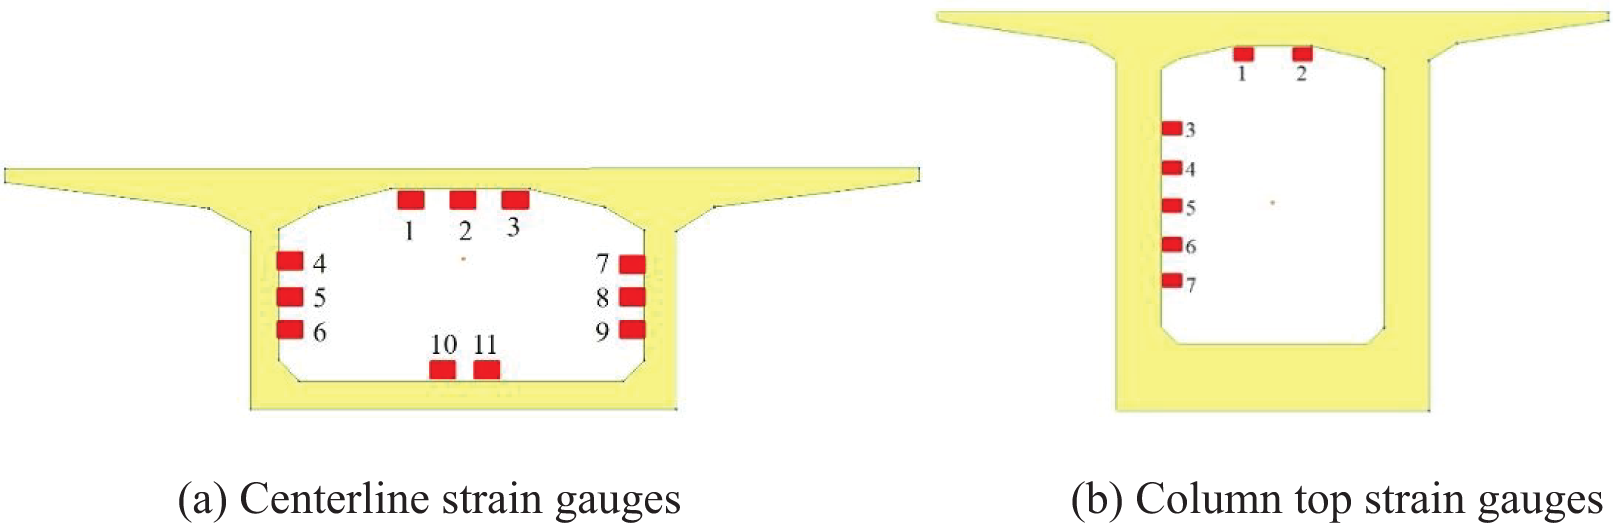
Figure 18: Strain measurement points during load testing
The deformation data collected from static loading tests are compared to the results obtained from previous static loading tests conducted prior to the rehabilitation process. The results for spans 1~3 are presented in Fig. 19, while the results for pier 2 are illustrated in Fig. 20.
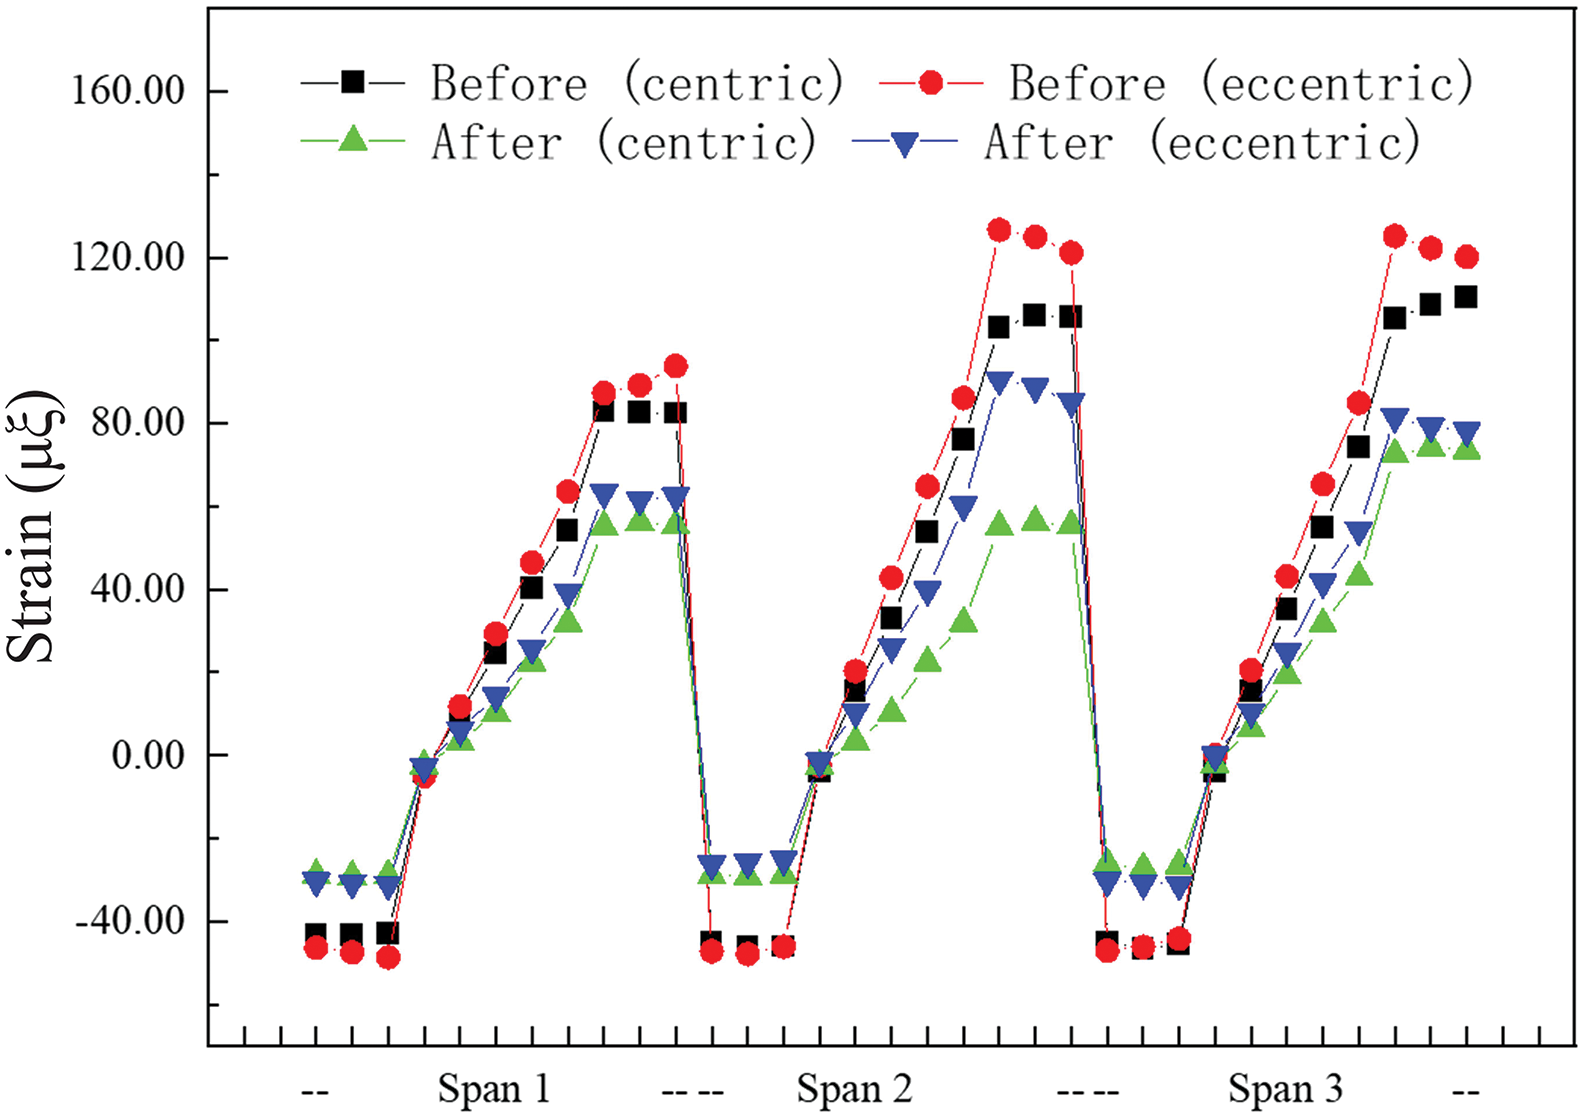
Figure 19: Recorded strain measurements for span 1~3
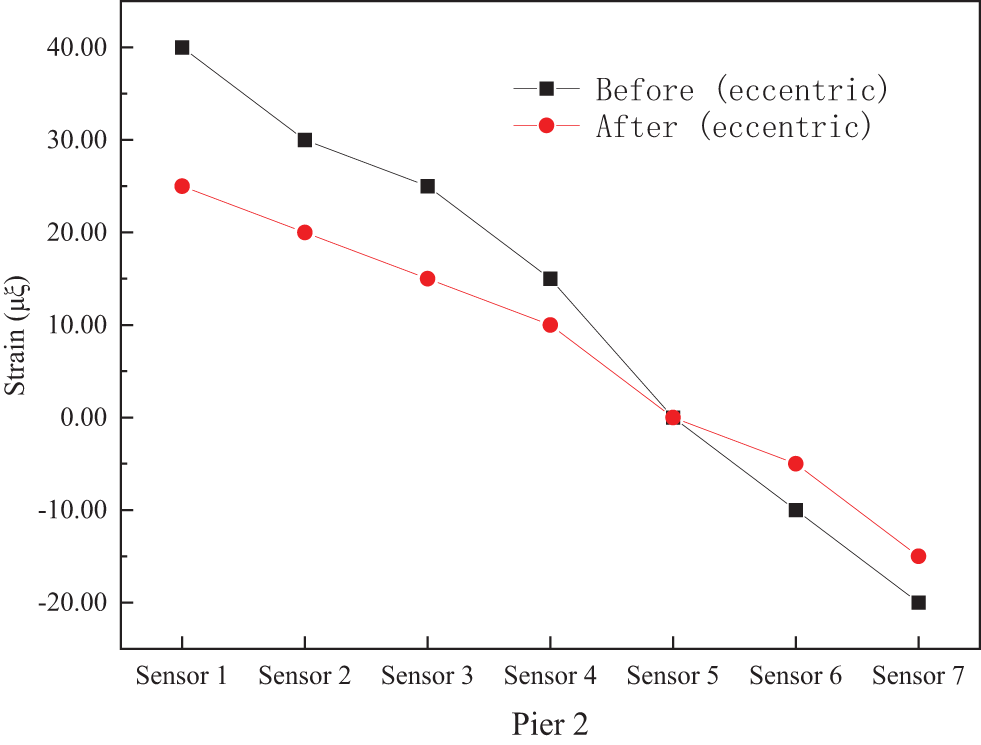
Figure 20: Measured strain data for pier 2
After the strengthening of span 1, the recorded strain values for each load case exhibited consistently improved results. The strain validation factor, varying from 0.66 to 0.75, signified an enhancement in the structural rigidity. The load carrying capacity exhibited an average increase of 28%, along with an average 27% increase in the verification coefficient. Likewise, for span 2, the strain validation coefficient varied from 0.57 to 0.79, with an average 26% increase in load carrying capacity and an accompanying average 27% rise in the verification coefficient. In span 3, the verification coefficient ranged from 0.57 to 0.76. Under center-loaded at midspan, there was an average 27% increase in strain, matched by an average 27% increase in the verification coefficient. In contrast, under eccentric loading, there was an average strain improvement of 23%, accompanied by an average increase of 24% in the verification coefficient. These results highlight the positive impact of the strengthening measures on the bridge’s performance and structural behavior.
At pier 2, as shown in Fig. 20, The load carrying capacity demonstrated an average increase of 15% following the strengthening measures, while the verification coefficient experienced an average improvement of 18%.
After the refurbishment of the deteriorated bridge, the strain measurements obtained during static loading tests at each span consistently demonstrated a reduction compared to the pre-strengthening evaluations. This indicates a substantial improvement in both the stiffness and bearing capacity of the bridge structure. As a result, the implementation of the external post-tensioning reinforcement technique not only enhances the structural performance of the bridge effectively but also simultaneously improves its overall strength and safety margin.
Actual resonant frequency for span No. 1 is f = 2.19~2.31 Hz, span No. 2 is f = 1.41~1.49 Hz, span No. 3 is f = 1.42~1.48 Hz, span No. 4 is f = 1.40~1.50 Hz, span No. 5 is f = 2.21~2.30 Hz. Actual measured data are all larger than theoretical data, which indicates that the bridge has satisfactory stiffness.
The maximum impact factor of span No. 1 is 1.341, lower than the theoretical calculated value of 1.368; impact factor for span No. 2 is 1.041, lower than the theoretical value of 1.050; impact factor for span No. 3 is 1.048, lower than the theoretical value of 1.050; impact factor for span No. 4 is 1.042, lower than the theoretical value of 1.050; impact factor for span No. 5 is 1.321, lower than the theoretical value of 1.368.
The first order resonant frequency of the original bridge is 1.37 Hz, and the rehabilitated bridge first order resonant frequency is 1.46 Hz.
Before rehabilitation, the maximum impact factor is 1.400, which is larger than the theoretical calculated 1.050. This means that the bridge does not satisfy the stiffness requirement specified in the code. After rehabilitation, the maximum impact factor is 1.048, less than the theoretical value.
5 Thresholding of Safety Standards
The maximum strains observed in the profile on top of the piers have been presented in Table 2.

The measured data obtained from the static load experiments indicate that the deflection levels at each midspan present a significant risk. The threshold for assessing this risk critically is established by the analysis of the calculated ultimate limit state. Conversely, the other risk levels are determined using reduction coefficients of 0.95, 0.9, and 0.8 applied to the maximum values obtained from the static load tests. The specific values corresponding to each warning level threshold are presented in Table 3.

The strain values associated with the high risk level are established by considering the maximum values obtained from the static loading tests, while the strains corresponding to the critical risk level are determined based on the calculated ultimate limit state. The remaining cautionary levels, similar to the deflection cautionary levels, are established by applying reduction coefficients of 0.95, 0.9, and 0.8 to the maximum values obtained from the static loading tests.
The threshold strain levels for the top plate are provided in Table 4, as listed below, thresholds for the bottom plate are shown in Table 5.


In the case of external prestressing, the bundles are elongated to a magnitude of 930 kN, resulting in a cumulative tensile force of 1953 kN per bundle. The prescribed limits for tension forces at each level are outlined in Table 6.

Following the removal of outliers, no instances of values surpassing the established threshold were observed. It has been confirmed once again that the rehabilitated bridge is operating normally under standard conditions.
(1) After the bridge is repaired, the stiffness of the bridge is improved and the maximum deflection is reduced from 37.9 to 27.6 mm. The bearing capacity after reinforcement is increased by 15% on average.
(2) The impact coefficient of the bridge before rehabilitation is 1.400, which is greater than the theoretical calculation of 1.050. This means that the bridge does not meet the stiffness requirements specified in the code. After rehabilitation, the impact coefficient decreased to 1.048, indicating that the stiffness of the repaired main beam increased significantly.
(3) Five risk levels each with its own colored warning alert and the corresponding alarm threshold. The highest risk threshold, the red critical level, uses the ultimate limit state value. The subsequent level is designated as “purple” and represents the higher risk level. The threshold for this level is set at the maximum static load test value. The remaining levels, namely “yellow” for moderate risk, “green” for low-moderate risk, and “blue” for low risk, are determined based on reduction coefficients of 0.95, 0.9, and 0.8, respectively, applied to the peak values obtained from the static load test.
Acknowledgement: The authors would like to extend their sincere gratitude to the School of Civil and Architectural Engineering, Harbin School for their continued support and for providing the necessary resources required for this study. Special thanks are also extended to all colleagues and peers who provided valuable insights and critiques that significantly improved the quality of this manuscript.
Funding Statement: This research received no specific grant from any funding agency in the public, commercial, or not-for-profit sectors.
Author Contributions: Dr. Xilong Zheng, the corresponding author, conceptualized and designed the study. He carried out an extensive literature review, identified relevant studies, and extracted significant findings. He was responsible for the drafting of the manuscript and made critical revisions related to the content. Dr. Qiong Wang and Dr. Di Guan contributed to the analysis and interpretation of the literature data. They also revised the manuscript critically for important intellectual content. Both authors read and approved the final version of the manuscript to be published, and agreed to be accountable for all aspects of the work in ensuring that questions related to any part of the work are appropriately investigated and resolved.
Availability of Data and Materials: The data used and/or analyzed during the current study are available from the corresponding author upon reasonable request.
Conflicts of Interest: The authors declare that they have no conflicts of interest to report regarding the present study.
References
1. Zhang, X., Zhang, Z., Cao, G., Mo, D. (2021). An experimental study on the flexural behavior of local prestressed steel-concrete composite continuous box beams. Advances in Structural Engineering, 24(2), 307–319. https://doi.org/10.1177/1369433220949464 [Google Scholar] [CrossRef]
2. Yarnold, M. T., Moon, F. L. (2015). Temperature-based structural health monitoring baseline for long-span bridges. Engineering Structures, 86(1), 157–167. https://doi.org/10.1061/JBENF2.BEENG-5871 [Google Scholar] [CrossRef]
3. Zeng, X., Deng, K., Wang, Y. (2022). Field investigation and numerical analysis of damage to a high-pier long-span continuous rigid frame bridge in the 2008 Wenchuan earthquake. Journal of Earthquake Engineering, 26(10), 5204–5220. https://doi.org/10.1080/13632469.2020.1868361 [Google Scholar] [CrossRef]
4. Li, J., Xu, L. (2023). Seismic responses and damage control of long-span continuous rigid-frame bridges considering the longitudinal pounding effect under strong ground motions. Journal of Bridge Engineering, 28(2), 04022140. https://doi.org/10.1061/JBENF2.BEENG-5871 [Google Scholar] [CrossRef]
5. Zhang, J., Wei, K., Gao, L. (2021). Effect of V-shape canyon topography on seismic response of deep-water rigid-frame bridge based on simulated ground motions. Structures, 33(3), 1077–1095. https://doi.org/10.1016/j.istruc.2021.05.002 [Google Scholar] [CrossRef]
6. Cross, E. J., Koo, K. Y., Brownjohn, J. M. W. (2013). Long-term monitoring and data analysis of the tamar bridge. Mechanical Systems and Signal Processing, 35(1–2), 16–34. https://doi.org/10.1016/j.ymssp.2012.08.026 [Google Scholar] [CrossRef]
7. Gomez, H. C., Fanning, P. J., Feng, M. Q. (2011). Testing and long-term monitoring of a curved concrete box girder bridge. Engineering Structures, 33(10), 2861–2869. https://doi.org/10.1016/j.engstruct.2011.05.026 [Google Scholar] [CrossRef]
8. Ni, Y. Q., Xia, H. W., Wong, K. Y. (2012). In-service condition assessment of bridge deck using long-term monitoring data of strain response. Journal of Bridge Engineering, 17(6), 876–885. https://doi.org/10.1061/(ASCE)BE.1943-5592.0000321 [Google Scholar] [CrossRef]
9. Fernandez-Navamuel, A., Zamora-Sánchez, D., Omella, Á.J. (2022). Supervised deep learning with finite element simulations for damage identification in bridges. Engineering Structures, 257(3–4), 114016. https://doi.org/10.1016/j.engstruct.2022.114016 [Google Scholar] [CrossRef]
10. Lantsoght, E. O. L., van der Veen, C., de Boer, A. (2017). State-of-the-art on load testing of concrete bridges. Engineering Structures, 150, 231–241. https://doi.org/10.1016/j.engstruct.2017.07.050 [Google Scholar] [CrossRef]
11. Han, X., Li, W. H., Li, P. F. (2023). Long-term deflection analysis of large-span continuous prestressed concrete rigid-frame bridges based on a refined modeling approach. Applied Sciences, 13(17), 9727. https://doi.org/10.3390/app13179727 [Google Scholar] [CrossRef]
12. Zhang, K., Qi, T., Li, D., Xue, X., Zhu, Z. (2021). Load testing and health monitoring of monolithic bridges with innovative reinforcement. International Journal of Structural Integrity, 12(6), 904–921. https://doi.org/10.1108/IJSI-11-2020-0103 [Google Scholar] [CrossRef]
13. Liu, Y., Mei, Z., Wu, B., Bursi, O. S., Dai, K. S. (2020). Seismic behaviour and failure-mode-prediction method of a reinforced-concrete rigid-frame bridge with thin-walled tall piers: Investigation by model-updating hybrid test. Engineering Structures, 208(2), 110302. https://doi.org/10.1016/j.engstruct.2020.110302 [Google Scholar] [CrossRef]
14. Tang, J., Su, Q., Su, H., Casas, J. R. (2023). Experimental and numerical study on the mechanical behavior of prestressed continuous composite I-girder bridges with partial connection. Journal of Bridge Engineering, 28(3), 04022154. https://doi.org/10.1061/JBENF2.BEENG-5955 [Google Scholar] [CrossRef]
15. Bennitz, A., Schmidt, J. W., Nilimaa, J. (2012). Reinforced concrete T-beams externally prestressed with unbonded carbon fiber-reinforced polymer tendons. ACI Structural Journal, 109(4), 521–530. [Google Scholar]
16. Wang, X., Zhou, C. (2018). Numerical investigation for the flexural strengthening of reinforced concrete beams with external prestressed HFRP sheets. Construction and Building Materials, 189(3), 804–815. https://doi.org/10.1016/j.conbuildmat.2018.08.219 [Google Scholar] [CrossRef]
17. Zhao, L., Dou, T., Cheng, B. (2019). Experimental study on the reinforcement of prestressed concrete cylinder pipes with external prestressed steel strands. Applied Sciences, 9(1), 149. https://doi.org/10.3390/app9010149 [Google Scholar] [CrossRef]
Cite This Article
 Copyright © 2024 The Author(s). Published by Tech Science Press.
This work is licensed under a Creative Commons Attribution 4.0 International License , which permits unrestricted use, distribution, and reproduction in any medium, provided the original work is properly cited.
 Downloads
 Citation Tools