
 Submit a Paper
 Propose a Special lssue
 Open Access
ARTICLE

A Comprehensive Investigation on Shear Performance of Improved Perfobond Connector
School of Civil Engineering, Architecture and Environment, Hubei University of Technology, Wuhan, 430068, China
* Corresponding Author: Caiping Huang. Email:
(This article belongs to the Special Issue: Sensing Data Based Structural Health Monitoring in Engineering)
Structural Durability & Health Monitoring 2024, 18(3), 299-320. https://doi.org/10.32604/sdhm.2024.047850
Received 20 November 2023; Accepted 31 January 2024; Issue published 15 May 2024
 View Full Text
 Download PDF
Abstract
This paper presents an easily installed improved perfobond connector (PBL) designed to reduce the shear concentration of PBL. The improvement of PBL lies in changing the straight penetrating rebar to the Z-type penetrating rebar. To study the shear performance of improved PBL, two PBL test specimens which contain straight penetrating rebar and six improved PBL test specimens which contain Z-type penetrating rebars were designed and fabricated, and push-out tests of these eight test specimens were carried out to investigate and compare the shear behavior of PBL. Additionally, Finite Element Analysis (FEA) models of the PBL specimens were established and validated against the test results. Through FEA, the effects of concrete grade, perforated plate’s aperture, Z-type penetrating rebar’s diameter, Z-type penetrating rebar’s bending angle, and bending length on shear behaviors were discussed. The results indicate that (1) Compared with PBL specimens with straight penetrating rebars, Z-type penetrating rebar can significantly improve the shear resistance and shear stiffness of the specimens. This enhanced performance can be mainly attributed to the increased adhesion of the transverse rebar. (2) By comparing the load-slip curve, the slip of PBL test specimens which contain straight penetrating rebar increases rapidly and the bearing capacity decreases rapidly after concrete craking, while the bearing capacity of Z-type penetrating rebar specimens decreases first and then increases gradually, showing better ductility. (3) The stress of the PBL shear connector with Z-type penetrating rebar is more uniform than the PBL shear connector with straight penetrating rebar, and the overall deformation is more uniform. (4) The higher the concrete grade, the higher the shear bearing capacity and the better ductility of the new PBL. Increasing the aperture of the perforated plate or the diameter of the rebar has a very limited effect on the improvement of the shear capacity of PBL. Through the systematic analysis of the mechanical properties of Z-type penetrating rebar PBL specimen, the experimental reference is provided for improving the structure and design of new type PBL.Keywords
Due to large shear stiffness, high ultimate shear capacity, good ductility, excellent fatigue resistance, and simple configuration, PBL (Perfobond Leiste) shear connectors have been widely used in composite girder bridges [1]. The researchers analysed the effects of PBL shear connectors with or without penetrating rebar, different opening diameters, number of openings, steel plate thicknesses, diameter of the penetrating rebar, and concrete strength grade on the shear bearing capacity of PBL shear connectors [2–6]. According to these research results, some scholars have started to improve and optimize the configuration of PBL shear connectors to obtain a higher shear capacity in PBL shear connectors. Liu et al. [7] used a rubber ring composed of an inner ring and two flanks and attached to the hole of the shear steel plate to reduce the local shear concentration near the hole. This method improved the skid resistance and shear stiffness of PBL shear connectors. Kim et al. [8,9] designed a Y-shaped shear steel plate with enlarging the contact area between the shear steel plate and concrete to enhance the pull-out resistance of PBL shear connectors. On this basis, Kim et al. [10] further applied various cyclic loading on shear connection with stubby Y-type perfobond rib shear connectors to analyze and verify the cyclic behavior. Then the finite element analysis was carried out on Y-type perfobond rib shear connectors, and the shear strength of Y-type shear connectors was accurately estimated [11]. Utashev et al. [12] wrapped the outside concrete with a carbon fibre cloth to improve the ductility and improved shear performance with the use of the PBL shear connector. Xiong et al. [13] replaced the shear steel plate by the carbon fiber plate which has higher shear strength to improve the shear strength of PBL shear connectors. Nguyen et al. [14] added steel fibre to concrete to improve its compressive strength, and this method prevented premature cracking of the concrete with PBL shear connectors. Arévalo et al. [15] replaced the single shear steel plate on both sides of the specimen with angle steel, the length direction of the angle steel was perpendicular to the flange plate of the I-shaped steel in the specimen, and the angle steel was rotated on the plane where the flange plate was located, then the influence of different rotation angles on the ductility of the PBL shear connector was analysed. Shariati et al. [16] replaced a single shear steel plate on both sides of the specimen with a V-shaped steel plate, changed its length and the angle between its length direction and the flange plate in the specimen, analysed its influence on the shear strength and ductility of the PBL shear connector. Mazoz et al. [17] replaced the single shear steel plate on both sides of the specimen with I-shaped steel, changed the length and height of the I-shaped steel, then analysed its influence on the ductility and ultimate bearing capacity of the PBL shear connector. Recently, researchers [18–21] applied the high-performance concrete with shear connectors and used different methods to treat the bonding interface of the connectors. The experimental results showed that these treatments improved the shear strength and ductility of the shear connectors.
The above improved methods for PBL shear connectors greatly increase the shear bearing capacity and stiffness of PBL shear connectors. However, for Y-type shear bond, T-type shear bond, V-type steel plate shear bond, and carbon brazing material enhanced shear bond, their failure modes all stem from the failure of the concrete mortise. Changing the type of shear bond yields only limited improvement on the specimen. Although employing ultra-high-performance concrete significantly enhances the shear bond performance, implementing aforementioned novel shear bonds with ultra-high-performance concrete is costly and needs endeavors. Consequently, adopting these aforementioned improved methods for PBL shear connectors would inevitably escalate construction costs and complexities.
To this end, an improved PBL shear connector with Z-type penetrating rebar is proposed in this paper. It only requires placing the Z-type penetrating rebar into the perforated plate, which is simple and convenient for construction. Fig. 1 shows the configuration of the specimen.
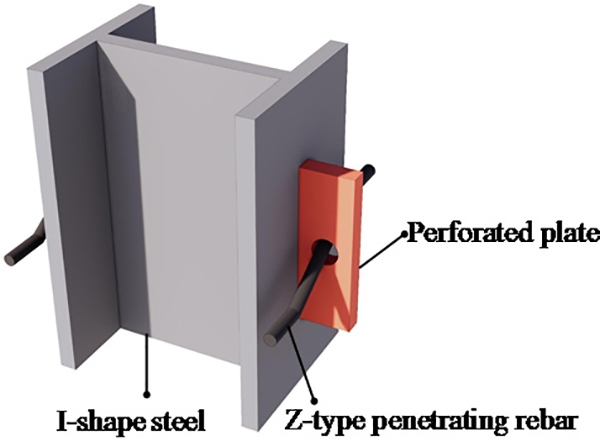
Figure 1: Specimen configuration
Compared with ordinary strain gauges, the Fiber Bragg grating (FBG) sensors have better corrosion resistance, anti-electromagnetic interference, high sensitivity and transmission capacity, and can realize multi-point distributed measurement [21]. Therefore, this paper used fiber grating instead of ordinary strain gauge to monitor the strain value of penetrating rebar.
To investigate the shear performance of the improved PBL with Z-type penetrating rebar, this paper carries out push-out tests and finite element analysis. By push-out tests, the load slip curve, concrete failure mode, ultimate bearing capacity and shear stiffness of ordinary PBL test specimens and improved PBL test specimens are obtained. The differences of the two types of test specimens in the above four responses are obtained. The strain values of straight penetrating rebar and Z-type penetrating rebar are measured by using fiber Bragg grating sensor in the entire push-out test process, and their results are compared and analysed. Further, PBL shear connectors with different parameters are established through the validated finite element analysis model, including the diameter of the penetrating rebar, the aperture of the perforated plate, the strength of concrete, and the bending angle and length of Z-type penetrating rebar. Based on the results, the influence of different parameters of the improved PBL on the bearing capacity is discussed.
To investigate the shear performance of the improved PBL in accordance with Eurocode 4 [22] and the experimental design of Wang et al. [23,24], two PBL test specimens with straight penetrating rebar, and six improved PBL test specimens with Z-type penetrating rebar, were designed and fabricated. Fig. 2a shows the configuration of PBL test specimen which contains straight penetrating rebar. Fig. 2b shows the configuration of PBL test specimen which contains Z-type penetrating rebar. The Z-type penetrating rebar is an inverse “Z” shape with a bending length of 50 mm at both ends and a bending angle of 45°. Each specimen is composed of a 250 mm × 200 mm × 360 mm I shape steel, two 180 mm × 60 mm perforated steel plates with a 40-mm-diameter aperture, two 14-mm-diameter perforated steel rebars, and two 200 mm × 320 mm × 360 mm concrete slabs. The flange plates and perforated plates are naturally bonded to the concrete.
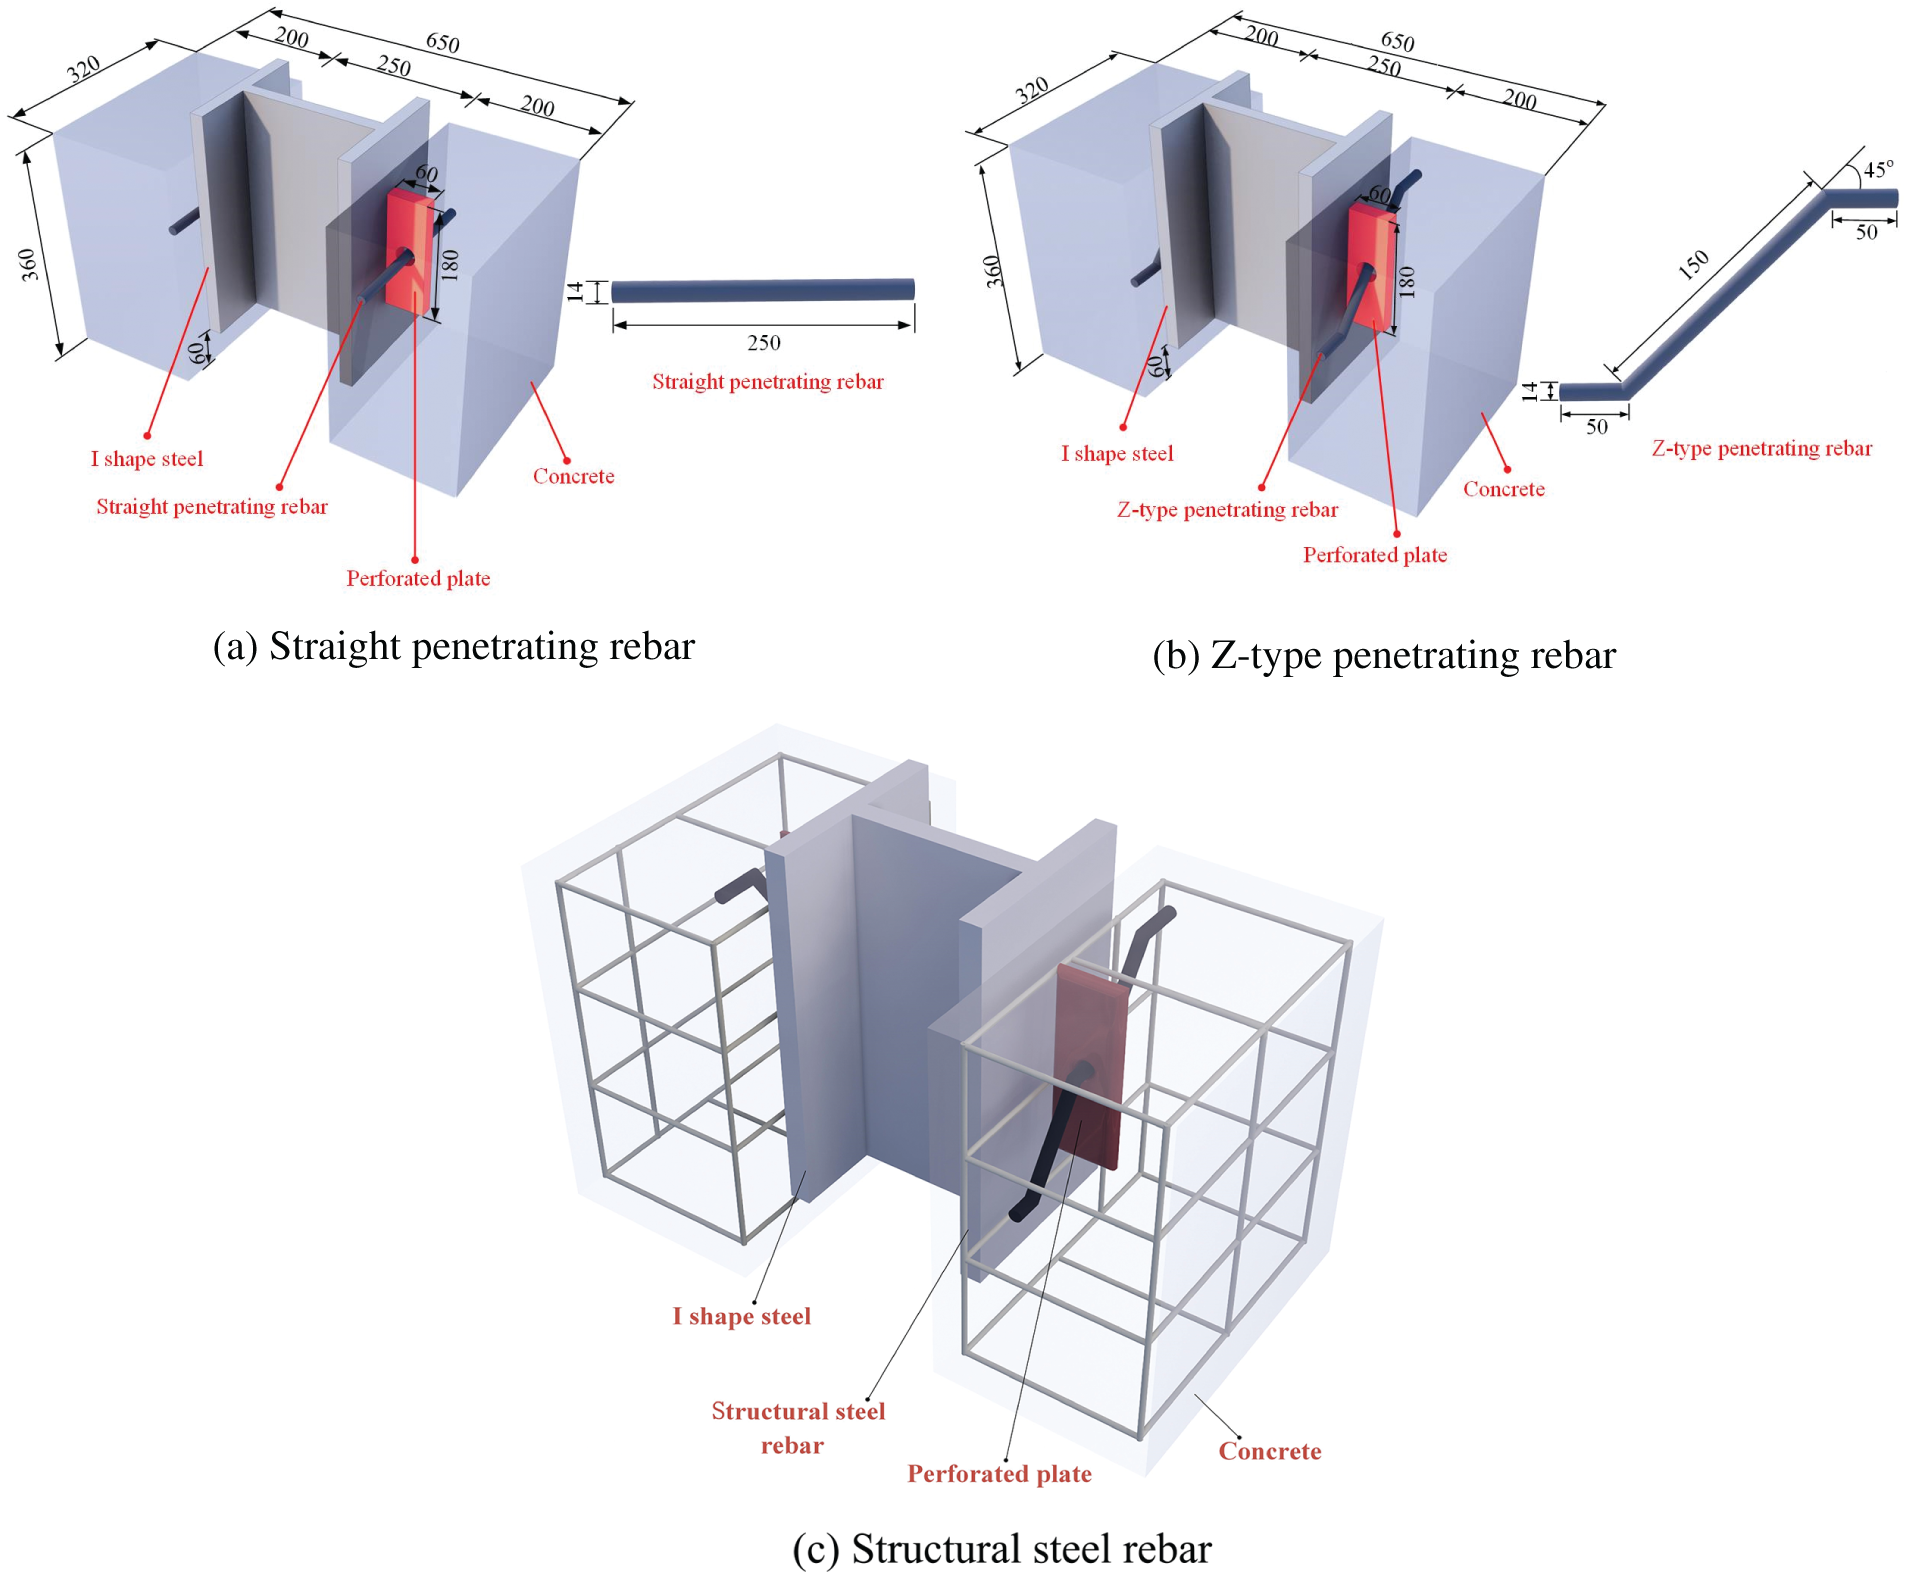
Figure 2: PBL test specimens configuration (mm)
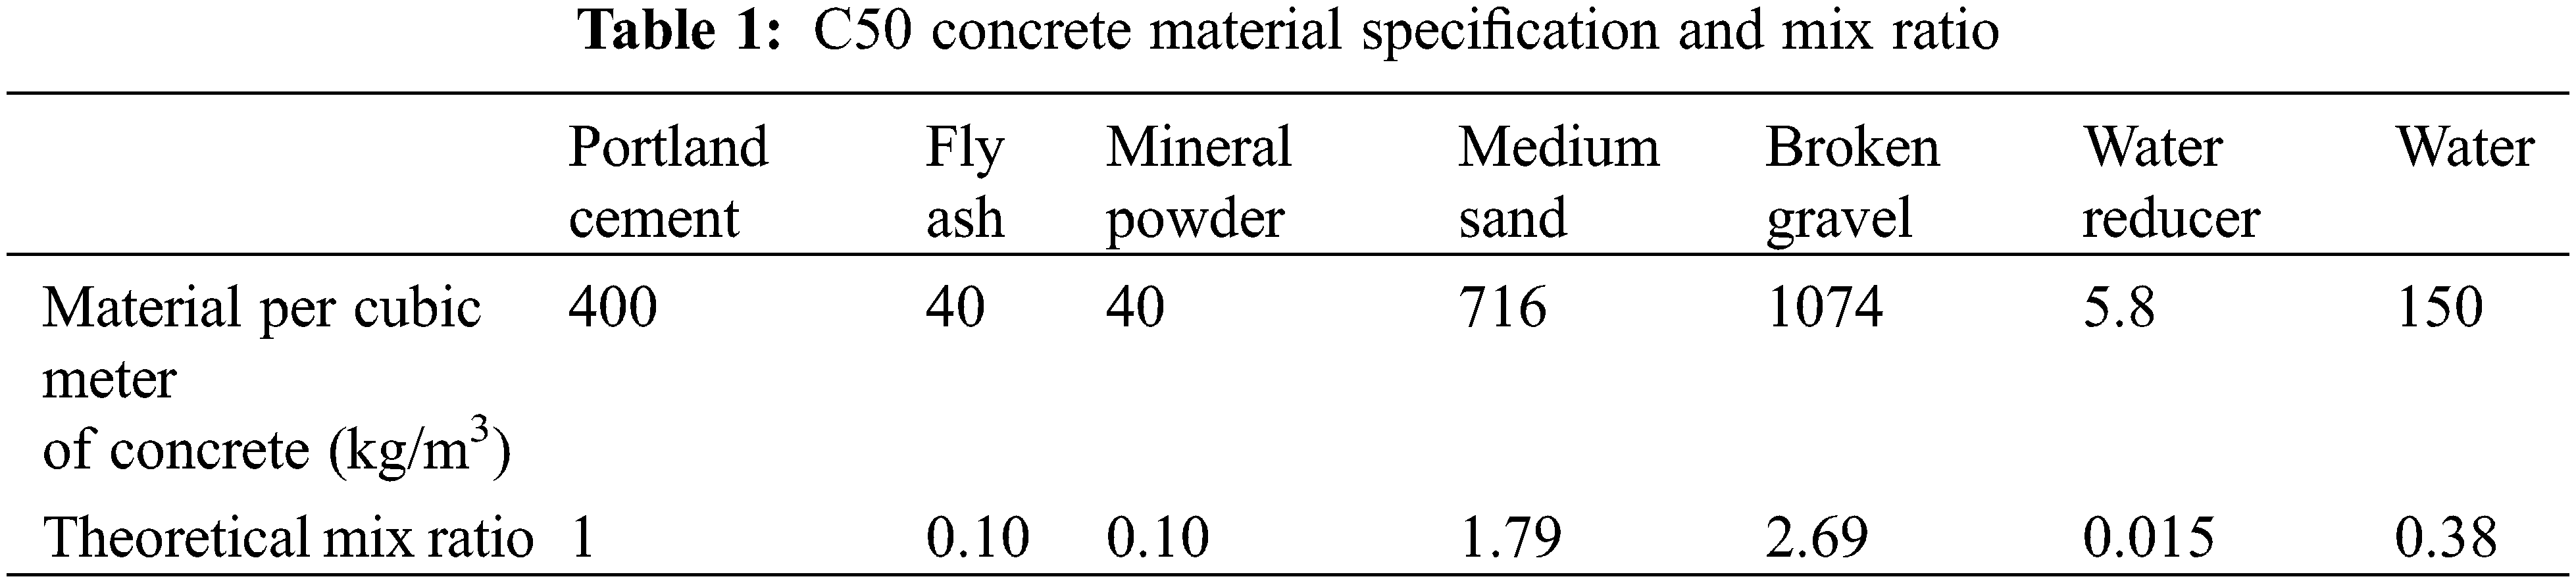
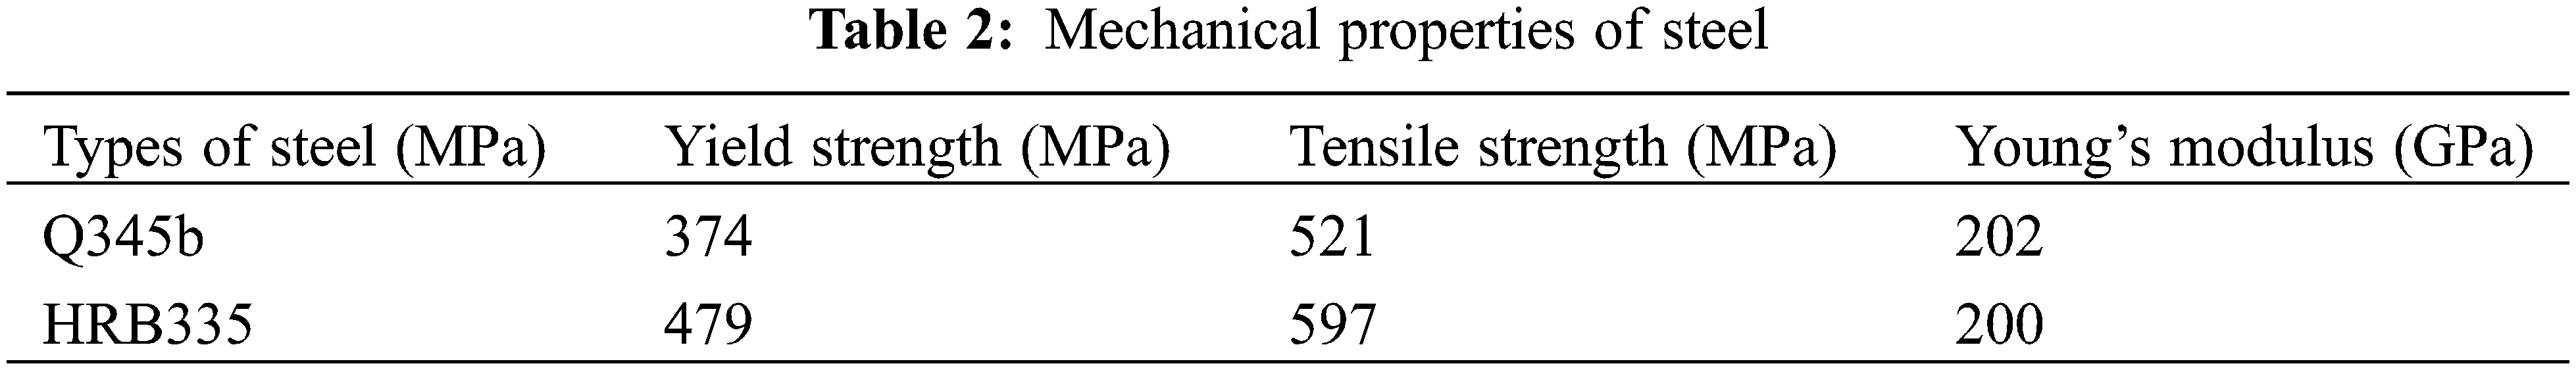
According to the code GB50010-2010 [25], the PBL specimen concrete in this paper is classified as grade C50. The concrete material specifications and mix ratio are presented in Table 1. The I shape steel used Q345b, while both straight penetrating rebar and Z-type penetrating rebar are HRB335. Specifically, the diameter of the straight penetrating rebar in the hole and Z-type penetrating rebar is set at 14 mm. Additionally, to prevent brittle damage to the concrete, HRB335 rebar was chosen for configuring the steel skeleton based on structural requirements with a diameter of 12 mm for the structural steel rebar. The nominal yield strength of steel plate, perforated steel rebar, and structural steel rebar are 345, 335, and 335 MPa, respectively. Tensile tests were conducted prior to fabricating push-out specimens to determine mechanical properties of the rebar. Table 2 lists the mechanical properties of steel.
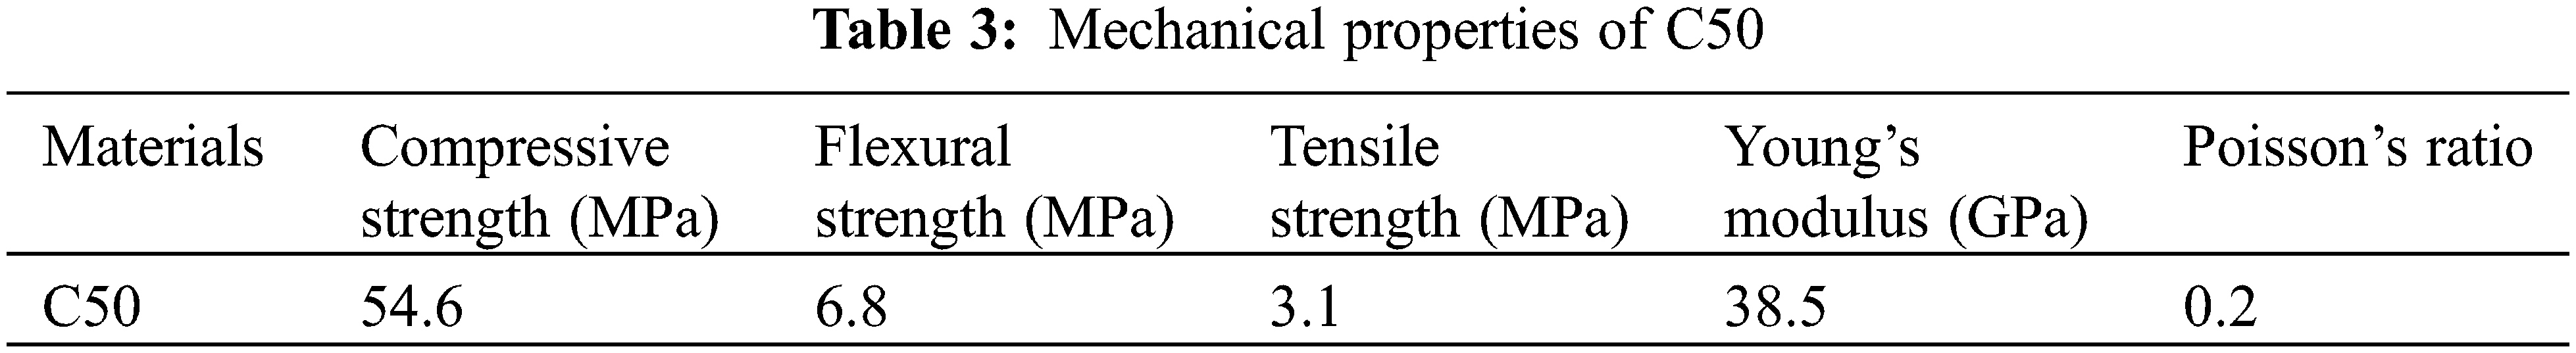
During the casting process, six groups of 150 mm × 150 mm × 150 mm cubic concrete samples with a standard strength of 50 MPa (C50) were prepared, and the performance of the concrete materials was evaluated. The test results indicated that the concrete exhibited a cubic compressive strength fcu of 54.6 MPa, an axial compressive strength fc of 44.5 MPa, a cubic splitting strength ft of 4.8 MPa, and an elastic modulus Ec of 42.6 GPa. Table 3 presents the measured properties of C50 grade concrete samples.
2.3 Test Setup and Instrumentation
Fig. 3 shows the test setup and instrumentation. The specimens were loaded by a servo-hydraulic system with 3000 kN loading capacity. The loading procedure included the force controlled cyclic preloading steps and the displacement-controlled monotonic loading step.
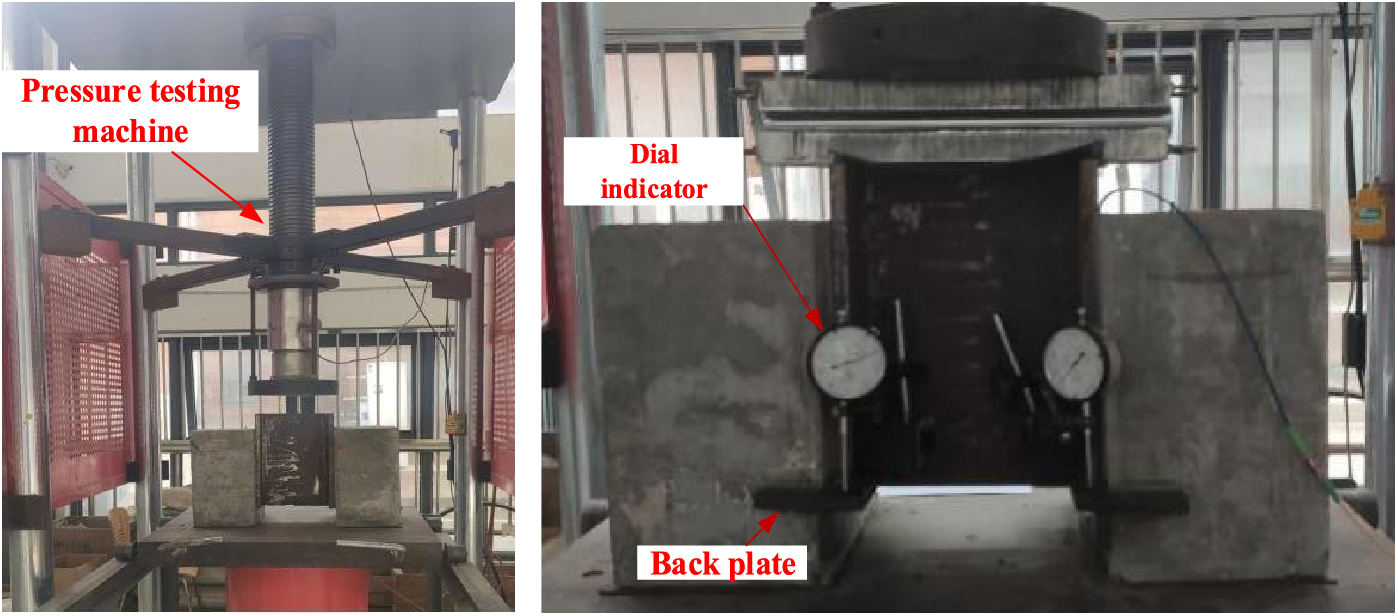
Figure 3: Test setup and instrumentation
After transferring the specimen to the test bench and before the start of the experiment, the vertical line method and the spherical angle steel plate were applied to align the center, then the specimen was preloaded to 100 kN, and its position was fine-adjusted. When the reading error of the relative slip by the four dial indicators was within ±0.1 mm, the specimen was considered to be under axial compression. Therefore, the loading process of PBL can be regarded as an uneccentric axial compression process.
In the preloading steps, the load was 100 kN and the loading speed was 2 kN/s, respectively. In the formal loading, each stage had a displacement of 0.4 mm with a duration of 2 min under the load. After the displacement reached 4 mm, the displacement of each stage was 0.2 mm while the duration under the load was 2 min, until the specimen was destroyed by the loading machine.
As shown in Fig. 4, the four displacement tables were arranged in the middle of the steel-concrete interface of each specimen to obtain the relative slip between I shape steel and concrete, and the displacement tables were 150 mm away from the bottom of the I shape steel.
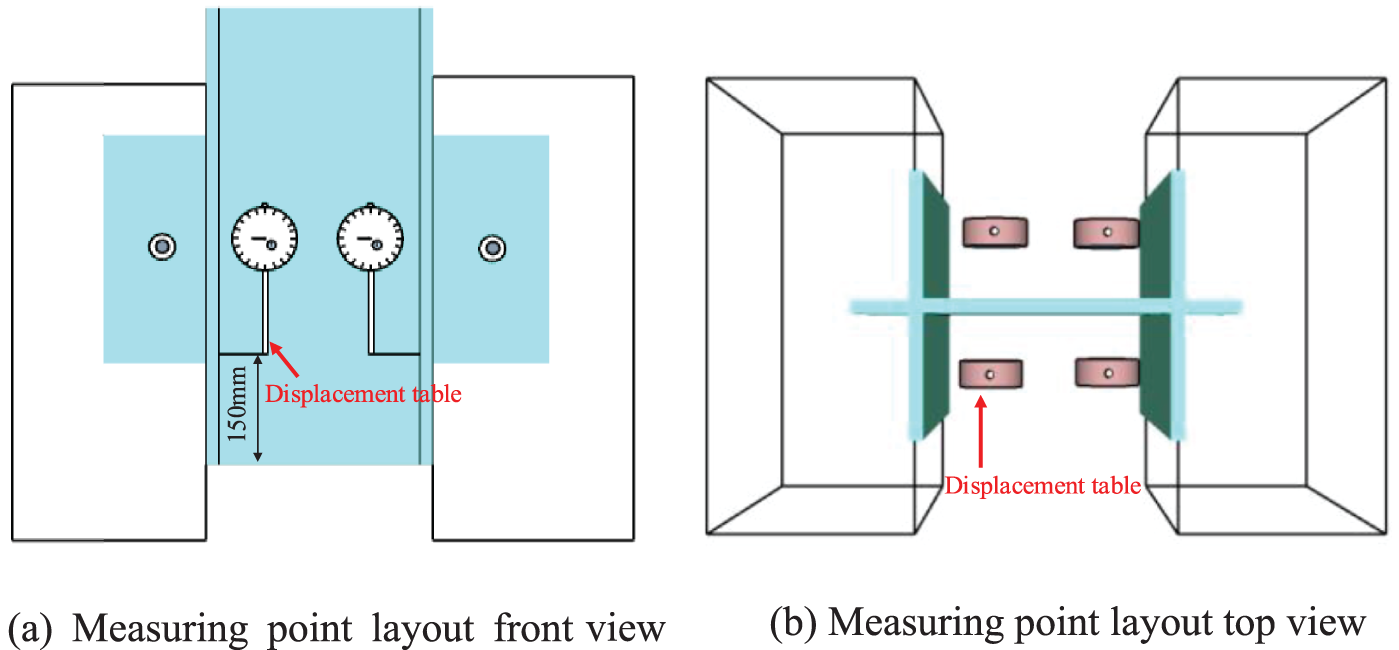
Figure 4: Displacement measuring point layout
Fig. 5 shows the packaged FBG sensor arranged on the penetrating rebar, which aims to monitor the strain value of the penetrating rebar. First, the metal base was welded onto the surface of the penetrating steel bar, and then FBG was embedded into concrete. The FBG sensor was encapsulated with polymer to prevent damage, and the strain transfer coefficient for sensors with double anchor blocks, each having an anchor piece at the ends, has been tested [26,27]. The FBG sensors, model number JFSS-04, were low-temperature sensitive, and had a central wavelength range of 1510 to 1590 nm. The FBG demodulator, model number SM-125, had a scanning frequency of 2 Hz and a sampling frequency of 3 times per minute.
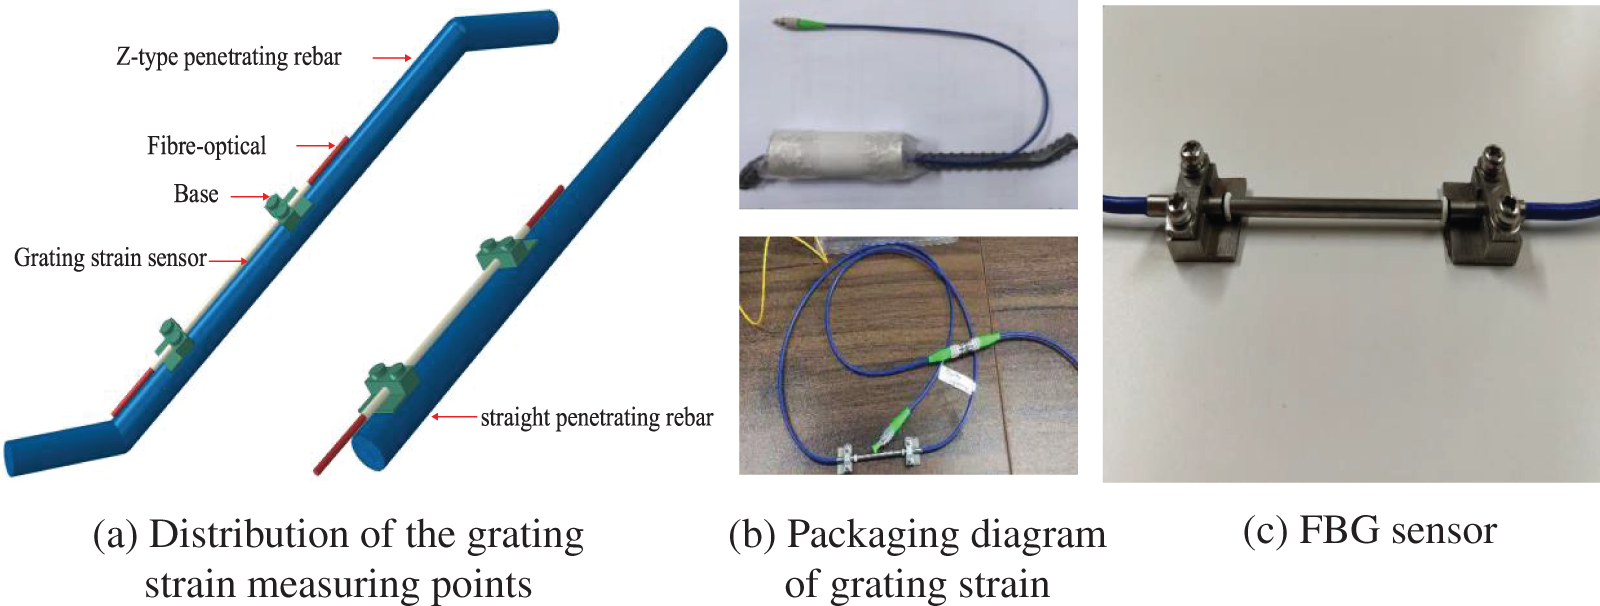
Figure 5: FBG sensor and its arrangement
Fig. 6a shows the crack distributions of concrete blocks in the specimen with straight penetrating rebar. On the top surface, a wide crack occurred first. Afterwards, cracks occurred on the two side surfaces perpendicular to the perfobond steel plates and these cracks were always in a vertical direction. No cracks were found on the side surfaces parallel to the steel plates. This suggests that after the perfobond steel plate and concrete adhesion failure, the concrete block was shear off by the perfobond steel plate.
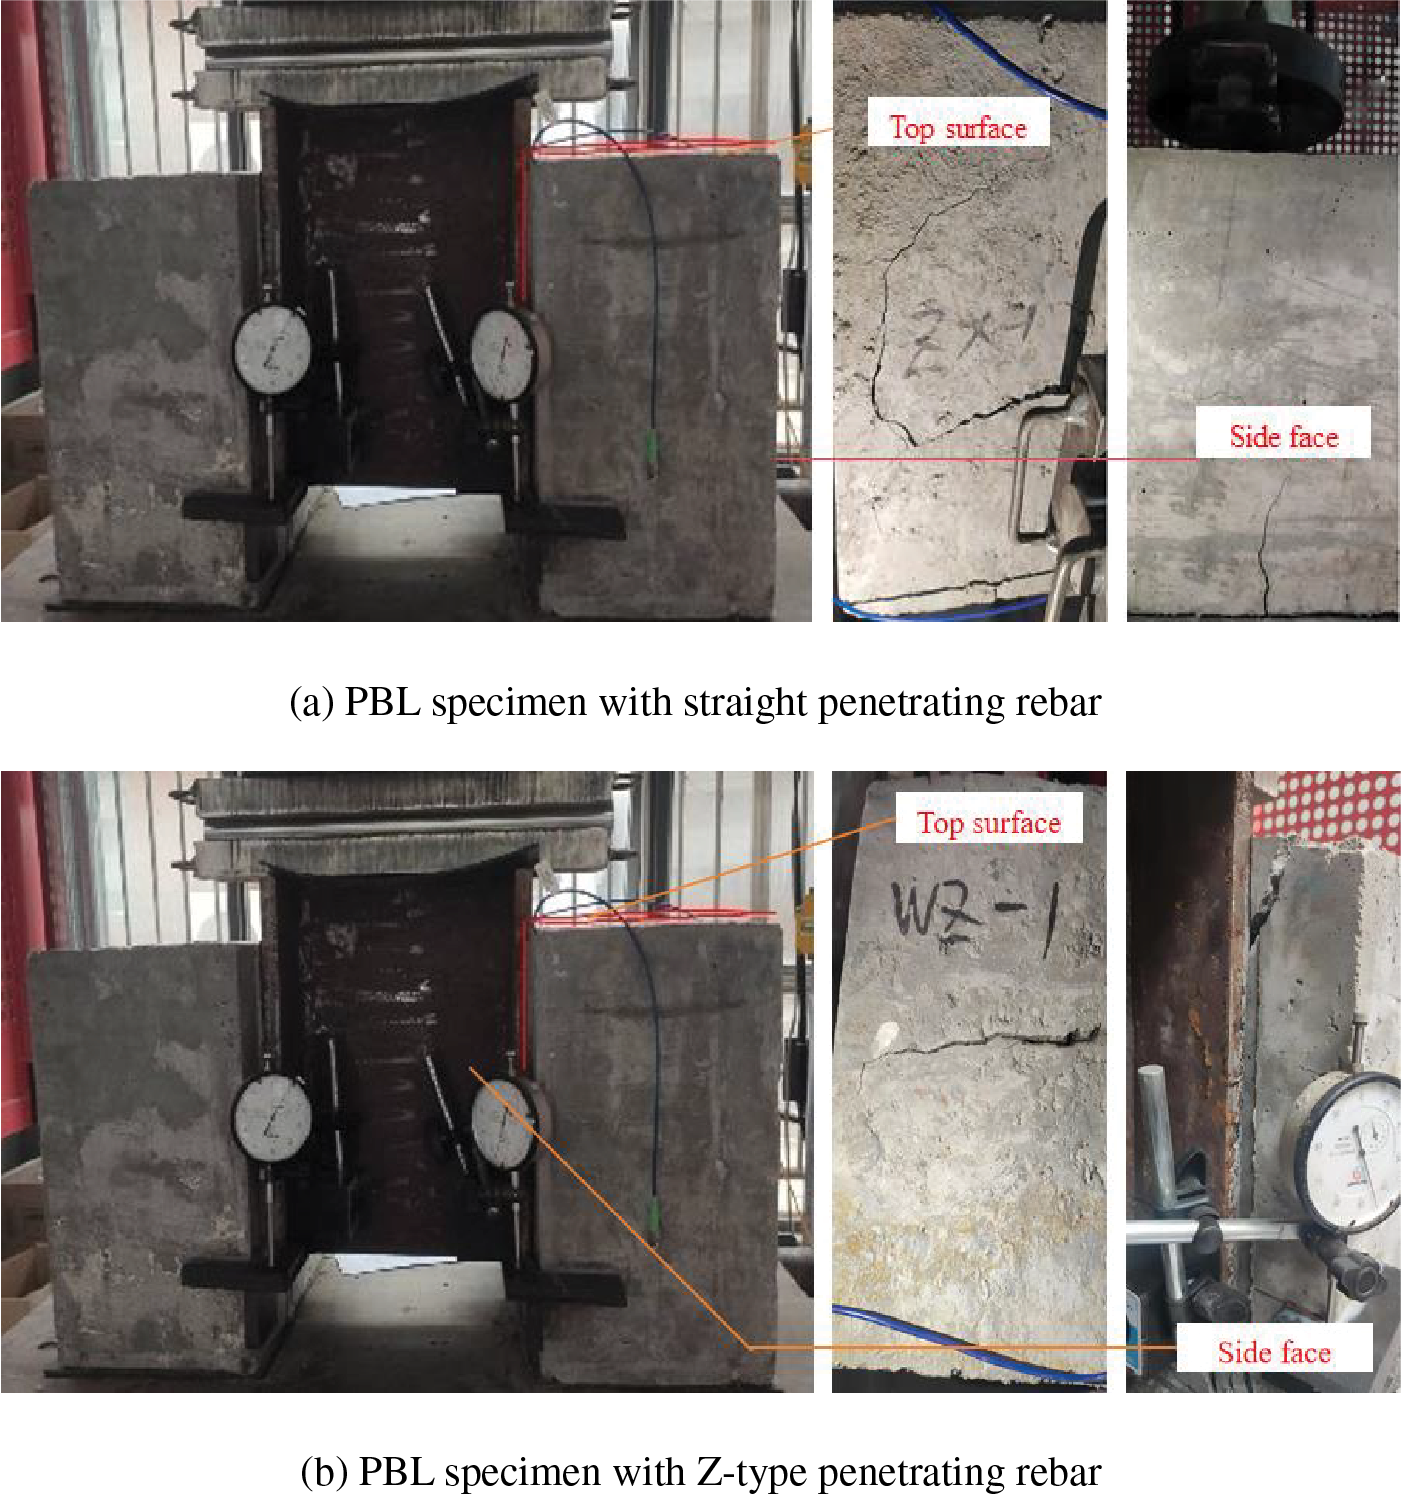
Figure 6: Crack distributions of the PBL specimens
Fig. 6b shows the crack distributions of concrete blocks in the specimen with Z-type penetrating rebar. Most crack distributions were the same as the specimen with straight penetrating rebar. However, the crack on the top surface of the specimen with straight penetrating rebar on the perfobond steel plate was in a U-shape, while the crack on the top surface of the specimen with Z-type penetrating rebar was in a J-shape. Also, the concrete block caused a diagonal crack near the adherent surface with the flange plate because of the change of the penetrating rebar shape.
To better analyse the failure pattern of the specimens, The concrete blocks were cut off in two directions after the failure. One direction was parallel to perfobond steel plates, as shown in Fig. 7 Section 1, and the other direction was parallel to the flange plate, as shown in Fig. 7 Section 2.
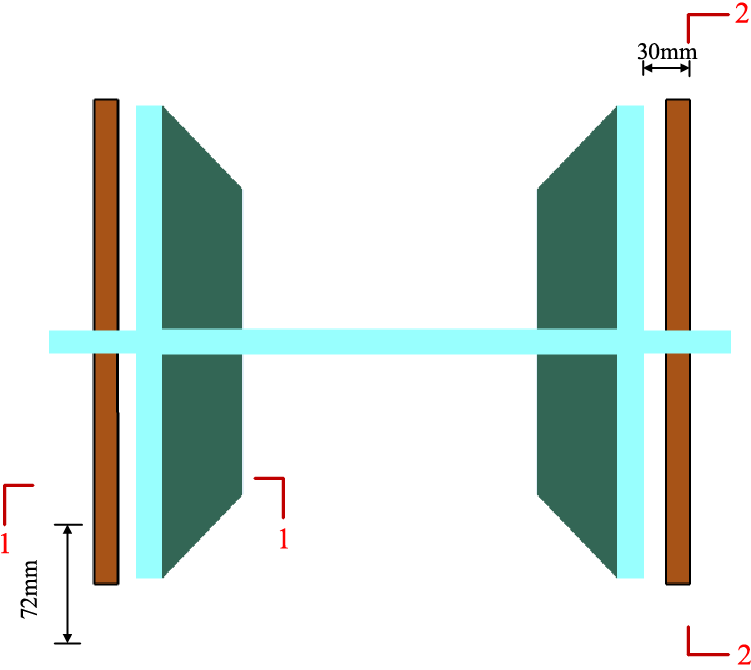
Figure 7: Sectional sketch (mm)
Fig. 8a shows the sections of the specimen with straight penetrating rebar after being cut. The oblique crack extended from the bottom to the top of the concrete, and severe concrete cracking beneath the perforated plate, as well as both sides of the perforated plate. The concrete around the end of the straight penetrating rebar appeared oblique cracks and went through the entire concrete block.
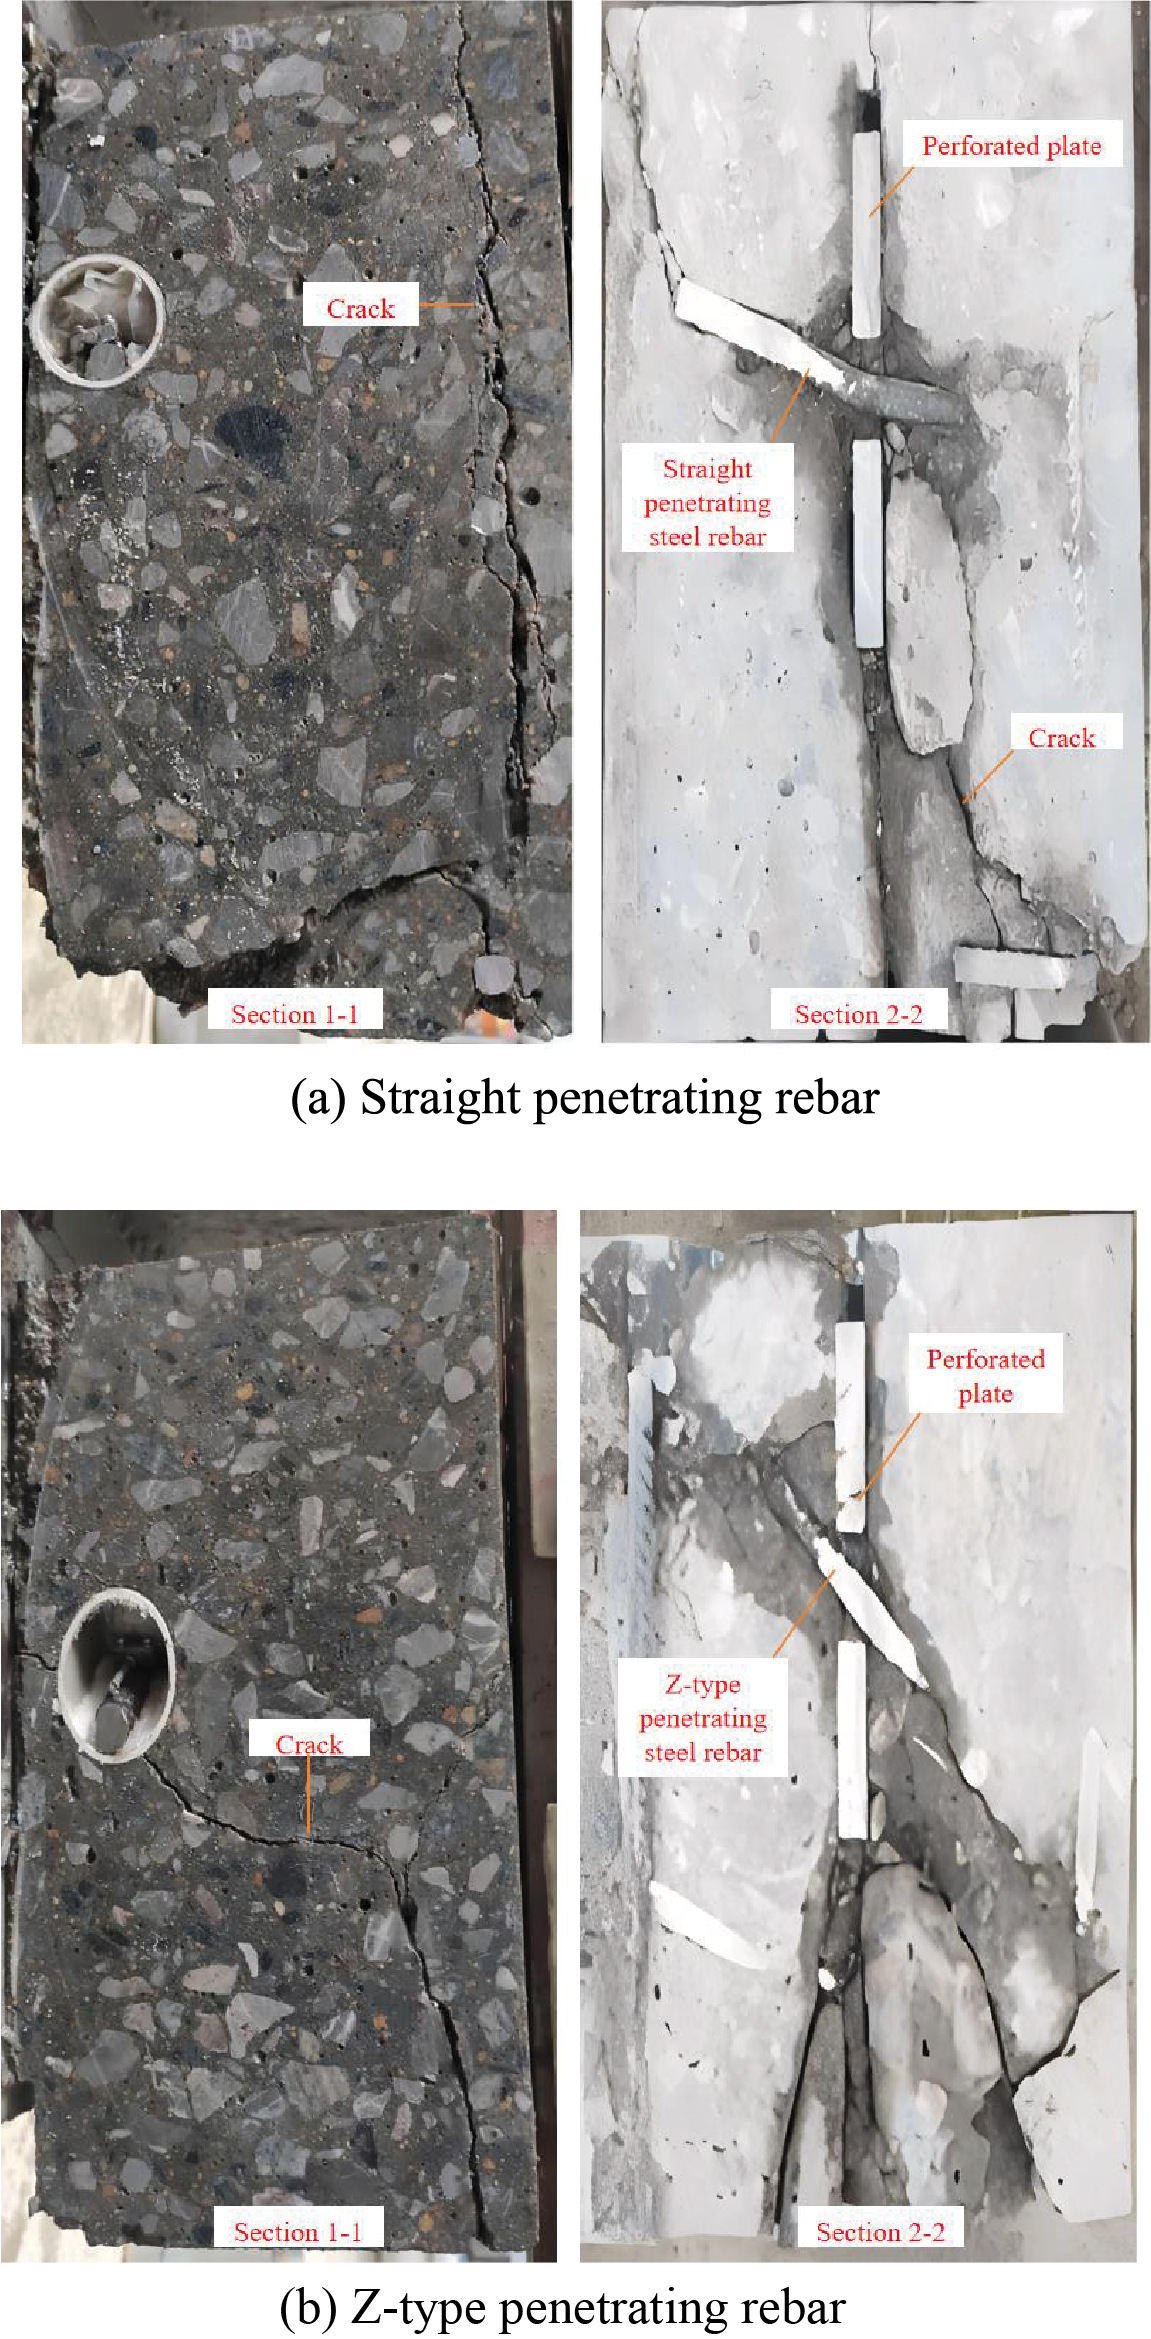
Figure 8: Section plane of the specimen
Fig. 8b shows the section of the specimen with Z-type penetrating rebar after being cut. The oblique cracks appeared at the bottom of the concrete block but did not penetrate through the whole concrete block. Significant concrete damage and cracking occurred beneath the perforated plate.
Fig. 9 shows penetrating rebar taken from the specimen; the overall deformation of the straight penetrating rebar and Z-type penetrating rebar was small, with a maximum displacement of 3.5 mm at the midpoint of the straight penetrating rebar, and a maximum displacement of 2.5 mm at the midpoint of the Z-type penetrating rebar. There was no shear failure in either the straight or the Z-type penetrating rebar; thus, the sample failure was due to shear failure of the concrete.
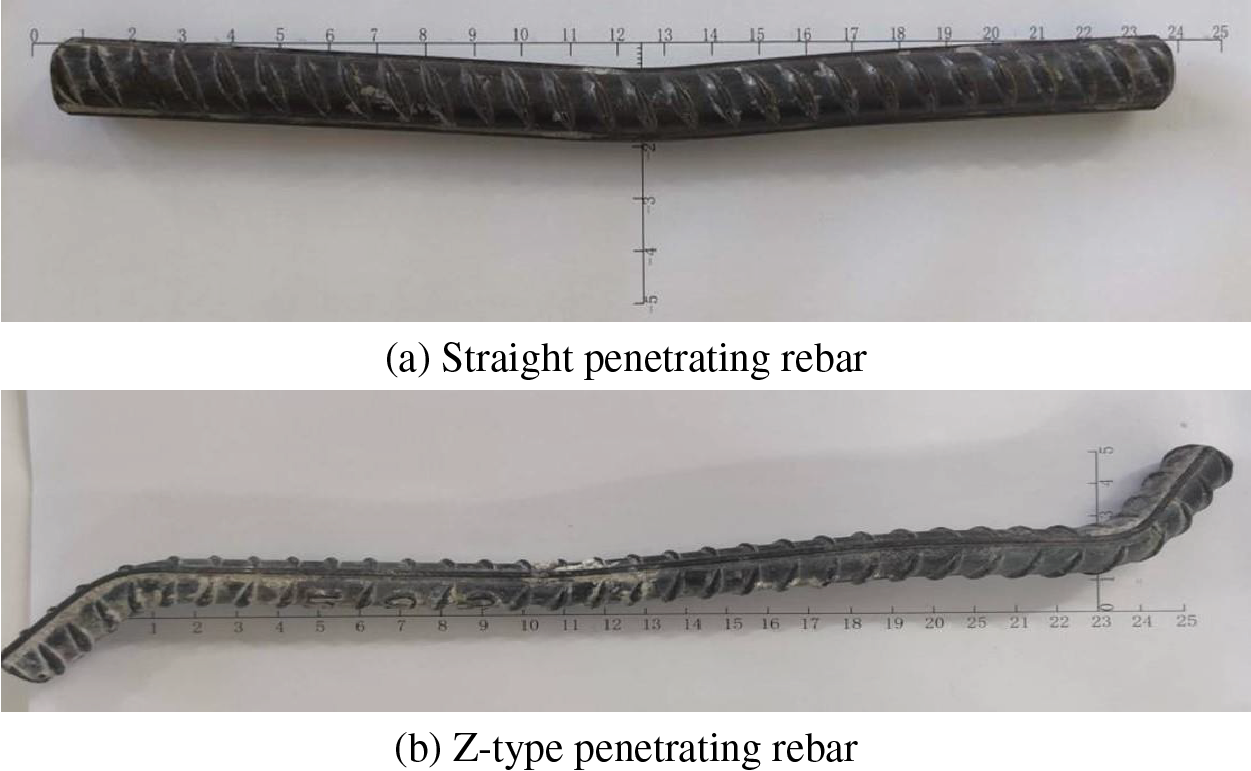
Figure 9: Deformation of penetrating rebar
The ultimate bearing capacity of the specimen in this study stems from the peak load in the load-slip curve. Table 4 shows the ultimate bearing capacity of the eight specimens and the shear bearing capacity of a single PBL shear connector. Each specimen is equipped with two PBL shear connectors, therefore half of the ultimate bearing capacity of the specimen is considered as the shear bearing capacity of a single connector.
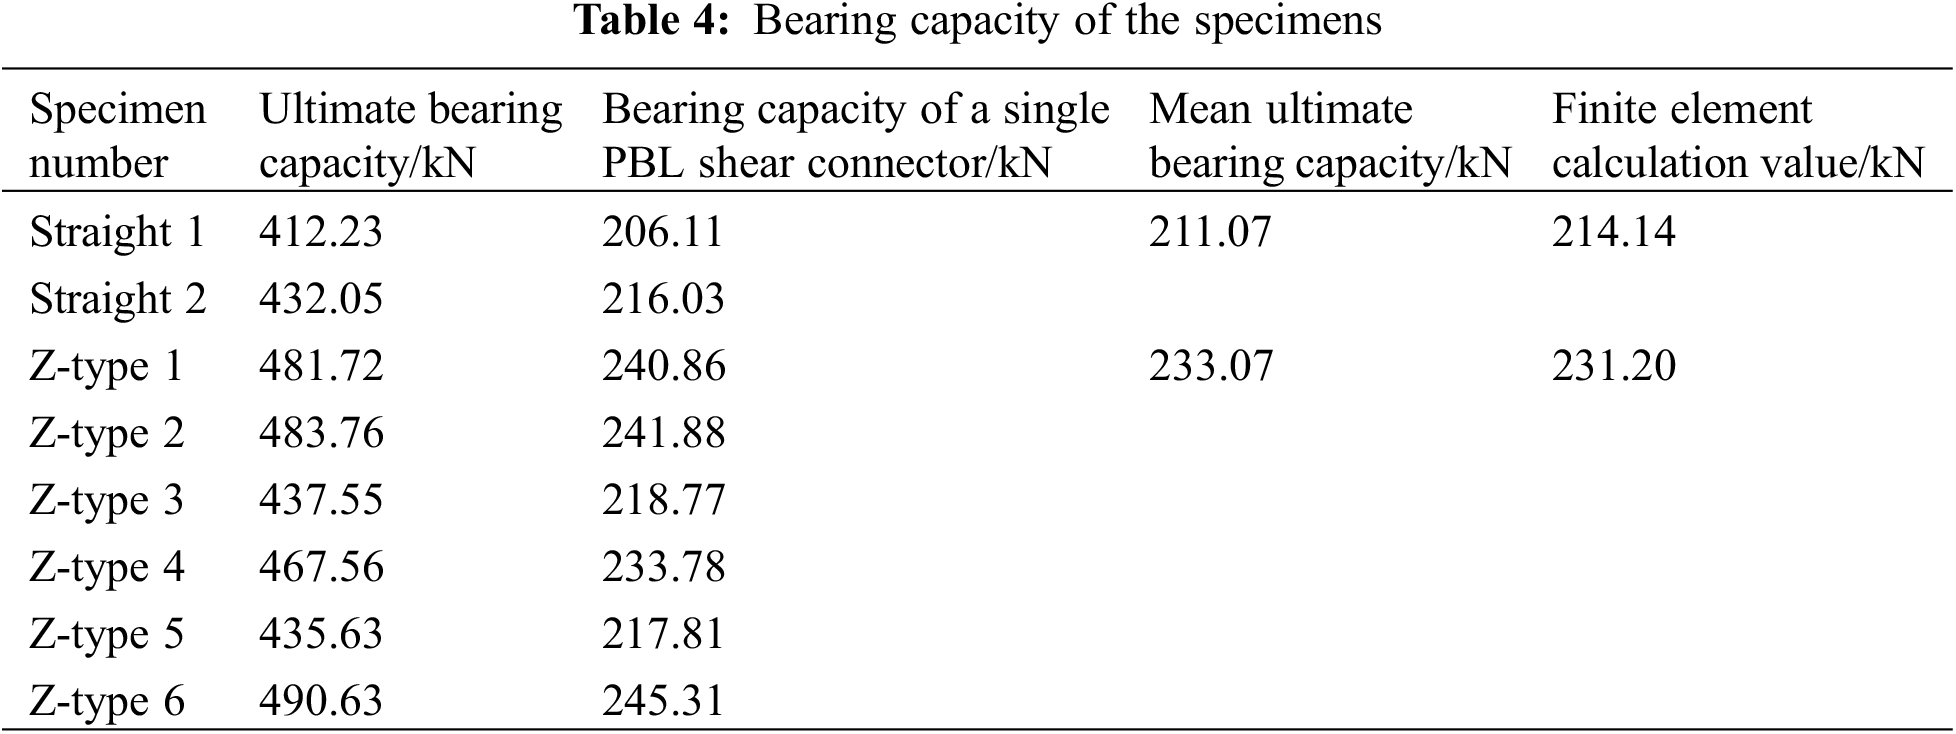
Table 4 illustrates that the mean ultimate bearing capacity of two specimens with straight penetrating rebar is 211.07 kN, whereas that of six specimens containing Z-type penetrating rebar is 233.07 kN, and the shear capacity increased by 10.42%. It is worth noting that the ultimate bearing capacity of the Z-type 3 and Z-type 5 specimens differs from that of the other Z-type specimens. Due to the negatives imposed by the perforated plate aperture of the specimen, there might be an uneven distribution of coarse aggregate around the aperture during construction, leading to a difference in the strength of the concrete around the perforated plate. As a result, the ultimate bearing capacity of Z-type 3 and Z-type 5 specimens is less than that of other Z-type specimens.
Fig. 10 presents the load-slip curves of specimens, where the slips represent the mean values of the four dial gauges. The load–slip curve can be divided into four stages: the elastic stage (I), bond failure stage (II), bending of penetrating rebar stage (III), and specimen failure stage (IV).
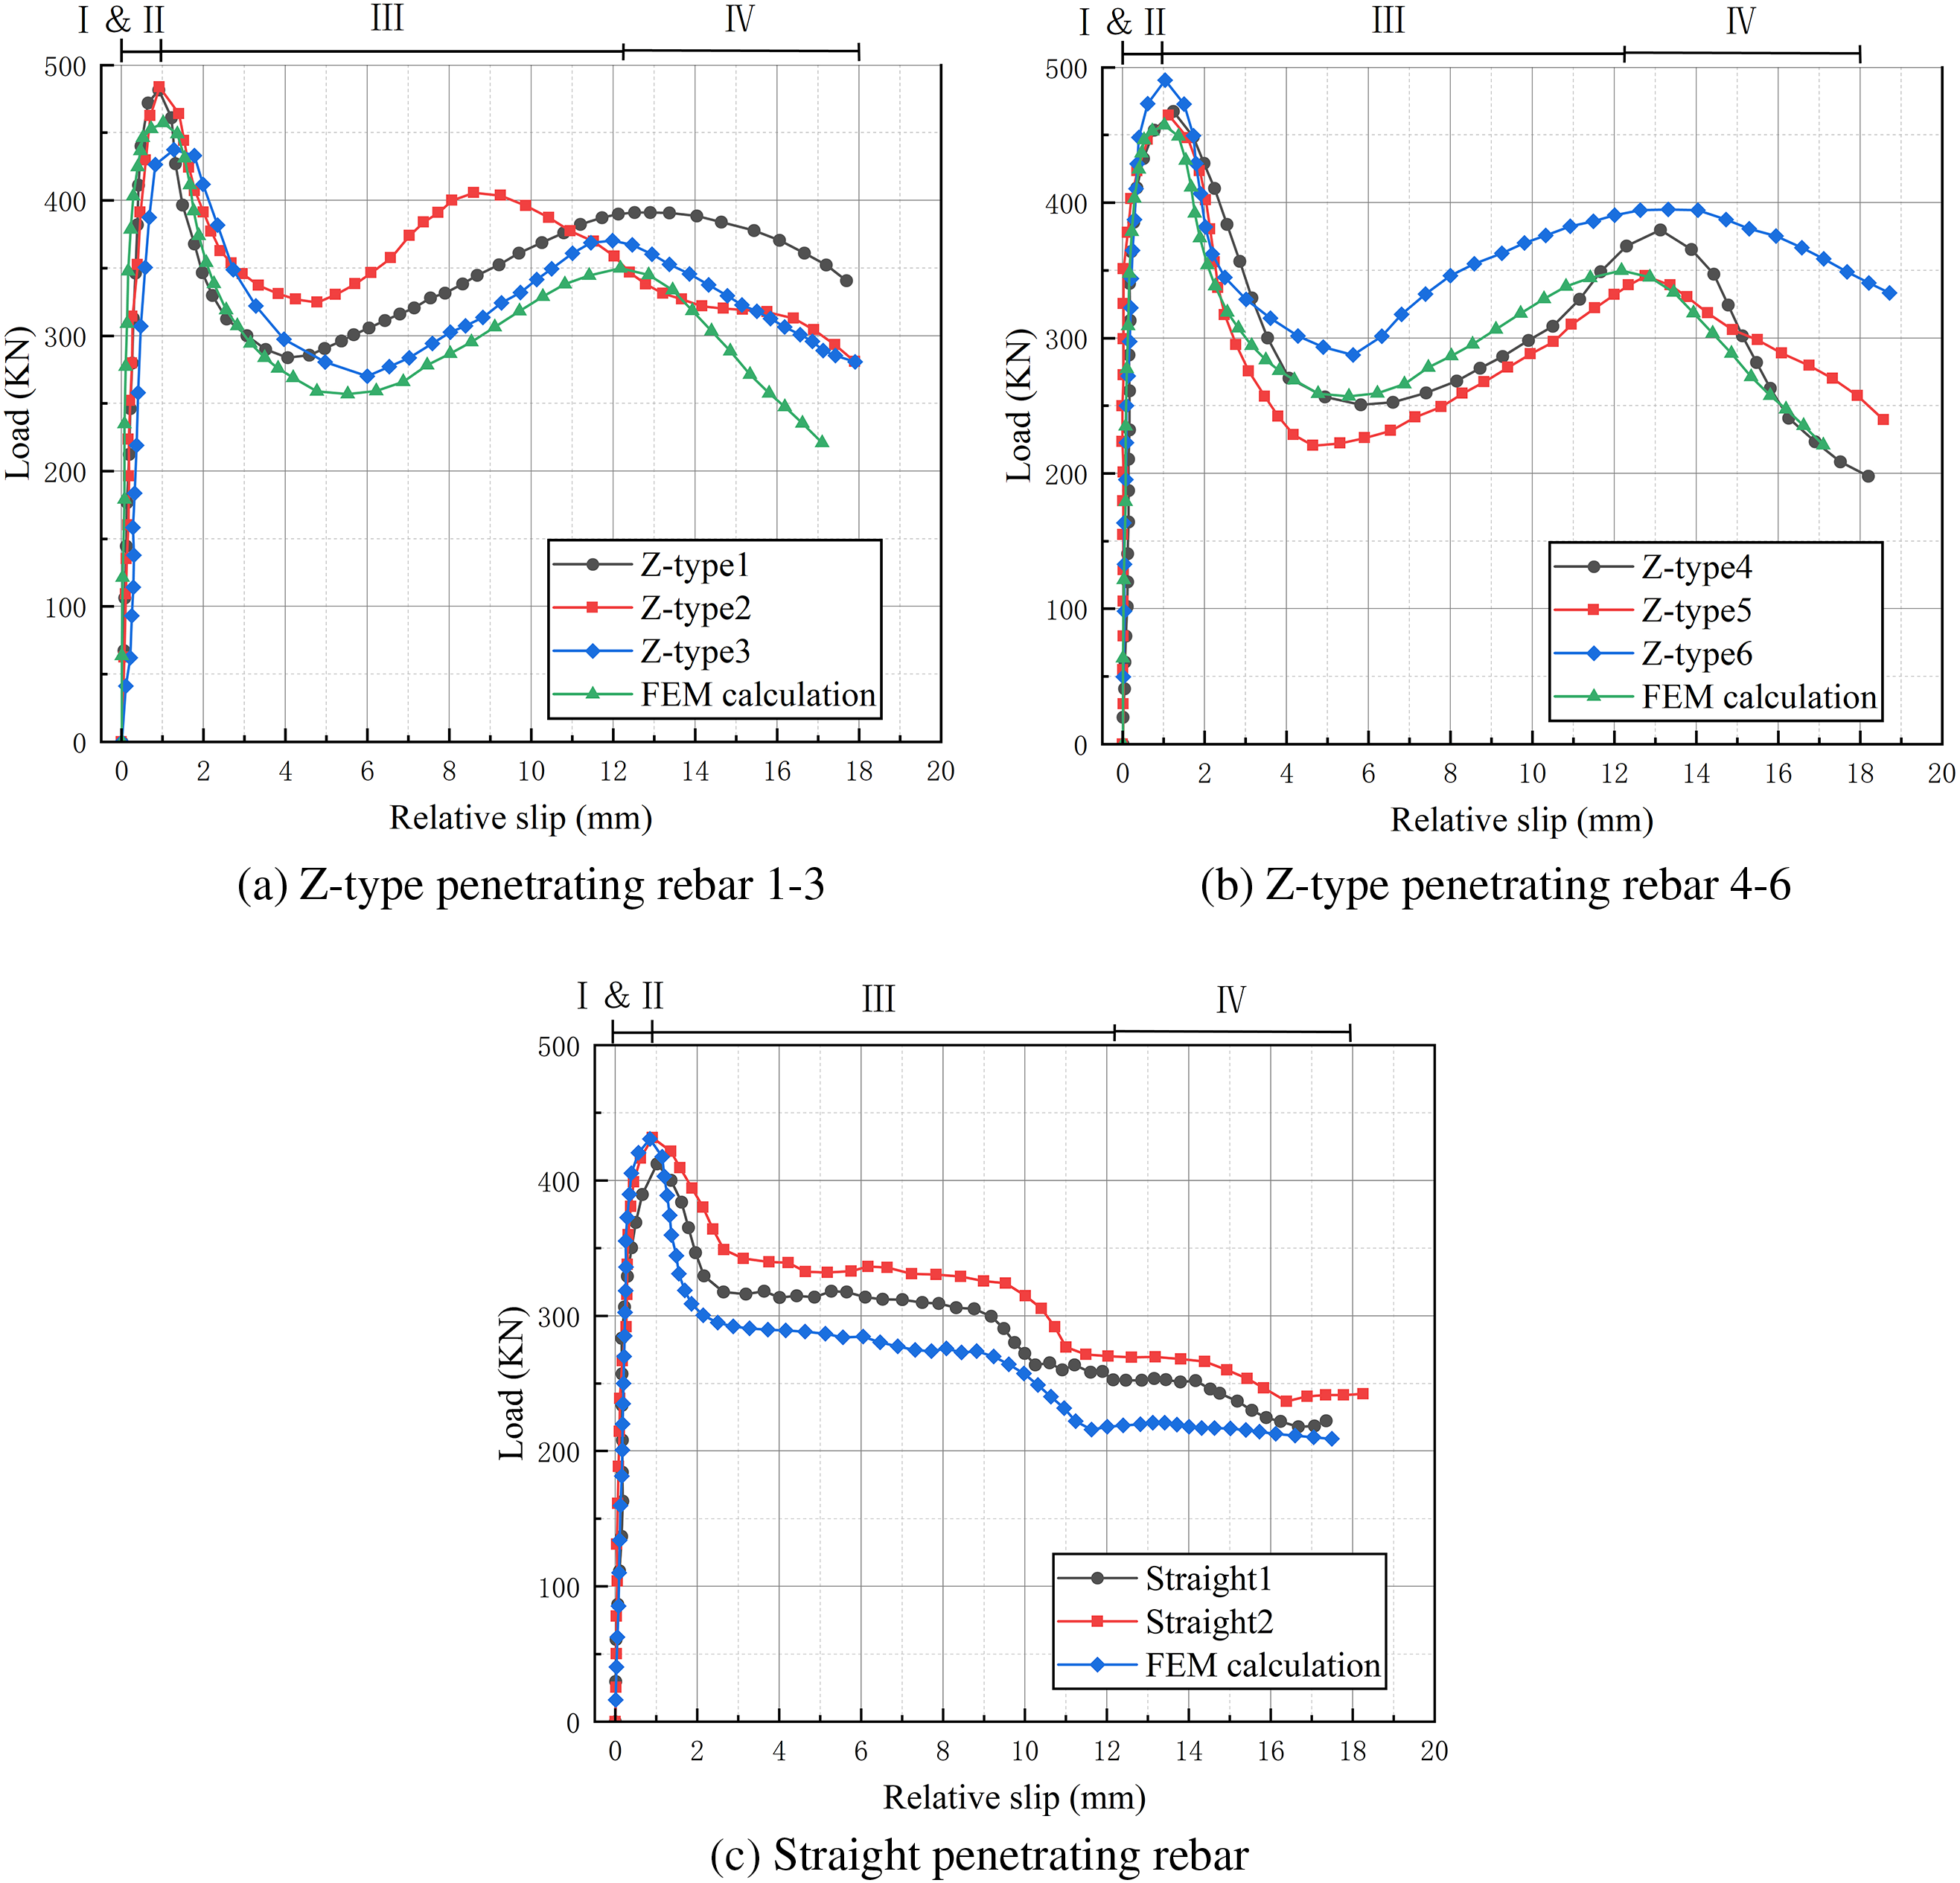
Figure 10: Load-slip curves
The elastic phase of the specimen under load is characterized by a linear phase with high stiffness, which mainly relies on the bond between the steel plate and the concrete to resist the applied force. Initially, the relative slip is negligible. However, with the increase of load, the bond at the steel-concrete interface gradually weakens. Once this binding force is eliminated, the load is gradually borne by the penetrating steel bar. Therefore, the relative slip gradually increases until the peak load is reached. Subsequently, with the continuous increase of load, the concrete cracks and the bearing capacity of the specimen decrease rapidly. It is noteworthy that cracks were observed on the concrete blocks, and this is mainly caused by insufficient bonding capacity of the transverse straight penetrating rebar. By comparing the peak load of the two types of specimens, the ultimate bearing capacity of the specimen with Z-type penetrating rebar is enhanced by 10.42% compared with the straight penetrating rebar. The high strength shown in the specimen using Z-type penetrating rebar may be due to the increased adhesion of the Z-type rebar.
After the concrete cracked, the specimen was in the post-yield hardening stage with rapidly increasing relative slip, while the bearing capacity of the specimen with straight penetrating rebar slowly decreased, and the bearing capacity of the specimen with Z-type penetrating rebar decreased first and then increased gradually. The specimen with a Z-type penetrating rebar achieved an average peak load of 380.8 kN in the third stage, while the specimen with a straight penetrating rebar attained an average peak load of 328.5 kN during the same stage. The utilization of Z-type penetrating rebar resulted in a significant increase of 15.9% in the average peak load of the third stage.
Therefore, the specimen with Z-type penetrating rebar did not fail immediately after reaching concrete cracking. It still had some shear resistance, which was beneficial for improving the ductility of PBL shear connectors. Finally, the perforated plate and the penetrating rebar were pushed out from the concrete block, leading to the failure of the specimen.
The final slip of the eight specimens in this test was greater than 6.00 mm. According to European specification 4, the ductility of the shear connectors can meet the shear requirements when the slip is greater than 6.00 mm [17].
Researchers have defined the shear stiffness of perforated connectors by using the cutting slope of important inflection points on the load-slip curve. The Japanese specification [28] took the secant slope at 1/3 of the ultimate load on the load-slip curve as the shear stiffness. Based on many push-out tests, Oehlers et al. [29] used the secant slope corresponding to 1/2 of the ultimate load as the shear stiffness. Zheng et al. [30] took the secant slope of the load-slip curve at 0.2 mm slip as the shear stiffness. Table 5 shows the average shear stiffness according to the above three shear stiffness calculation methods.
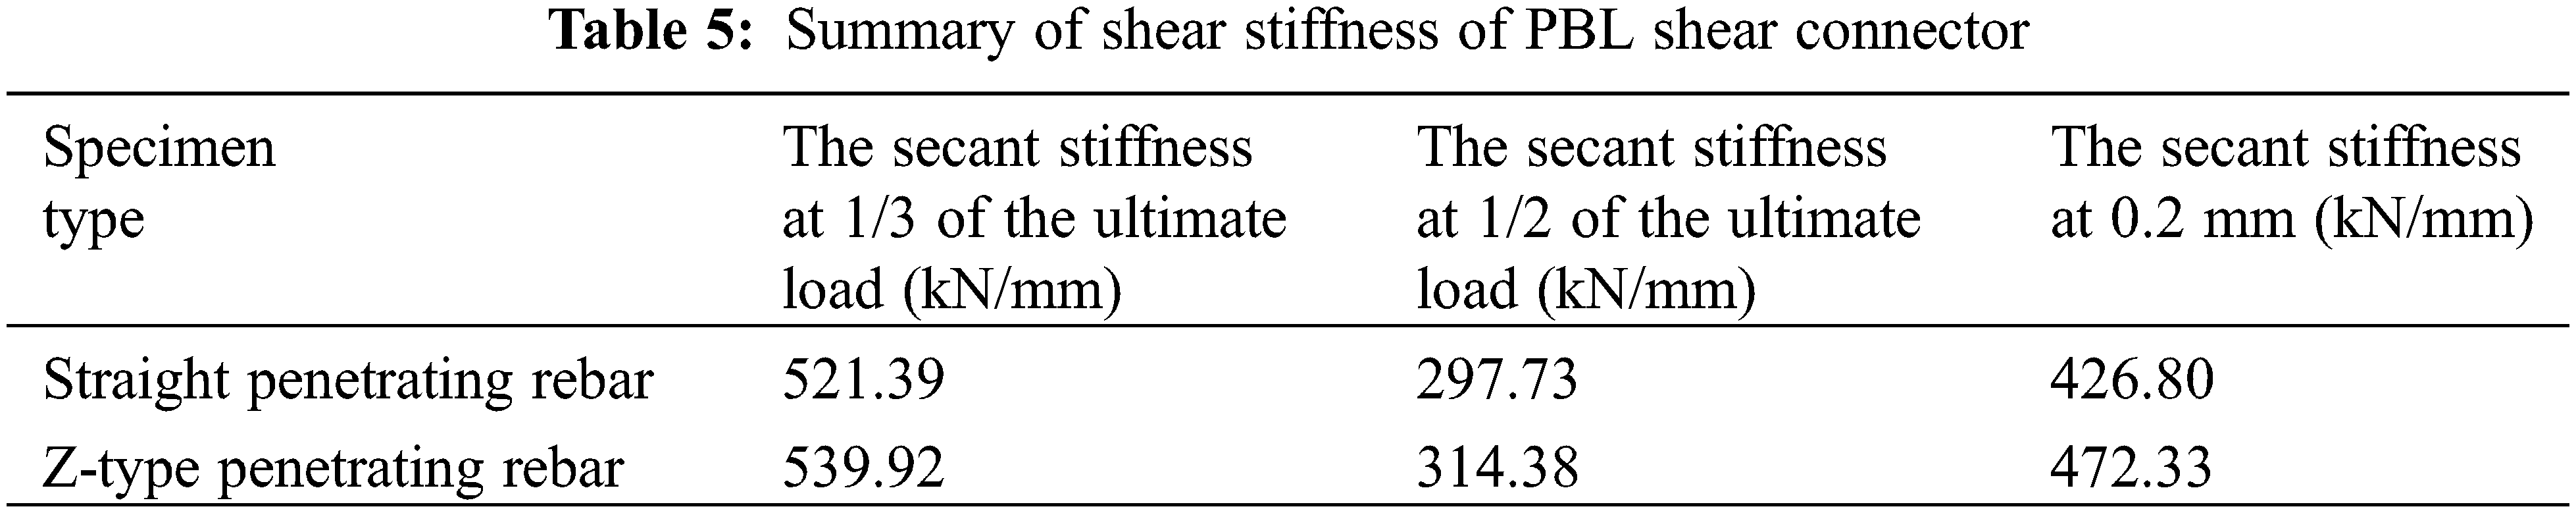
The shear stiffness of the Z-type perforated connector is consistently superior to that of the straight perforated connector in all three shear stiffness calculation methods. According to the results obtained by the three methods, the shear stiffness of Z-type perforated connectors is 3.55%, 5.59%, and 10.67% higher than that of straight perforated connectors, respectively. Among the three calculation methods, the maximum increase is 10.67%.
3.5 Strain on Penetrating Rebar
In this study, the grating strain sensor is used to measure the average strain of the steel rebar with a range of 60 mm under the sensor. The test captures strains of the penetrating steel rebars throughout the entire loading process. Fig. 11 shows the strain values of the Z-type penetrating rebars and straight penetrating rebars during the whole loading process. The failure mechanism of the PBL shear bond can be analysed according to the strain change of rebars [31]. As the displacement loading direction of the test is exerted by the jack from the bottom of the concrete to the top, to avoid the sensor being squeezed by the concrete or the packaging, the grating strain sensor is placed on the upper surface of the penetrating steel rebar. Also, the measured strain is a compressive strain [32].
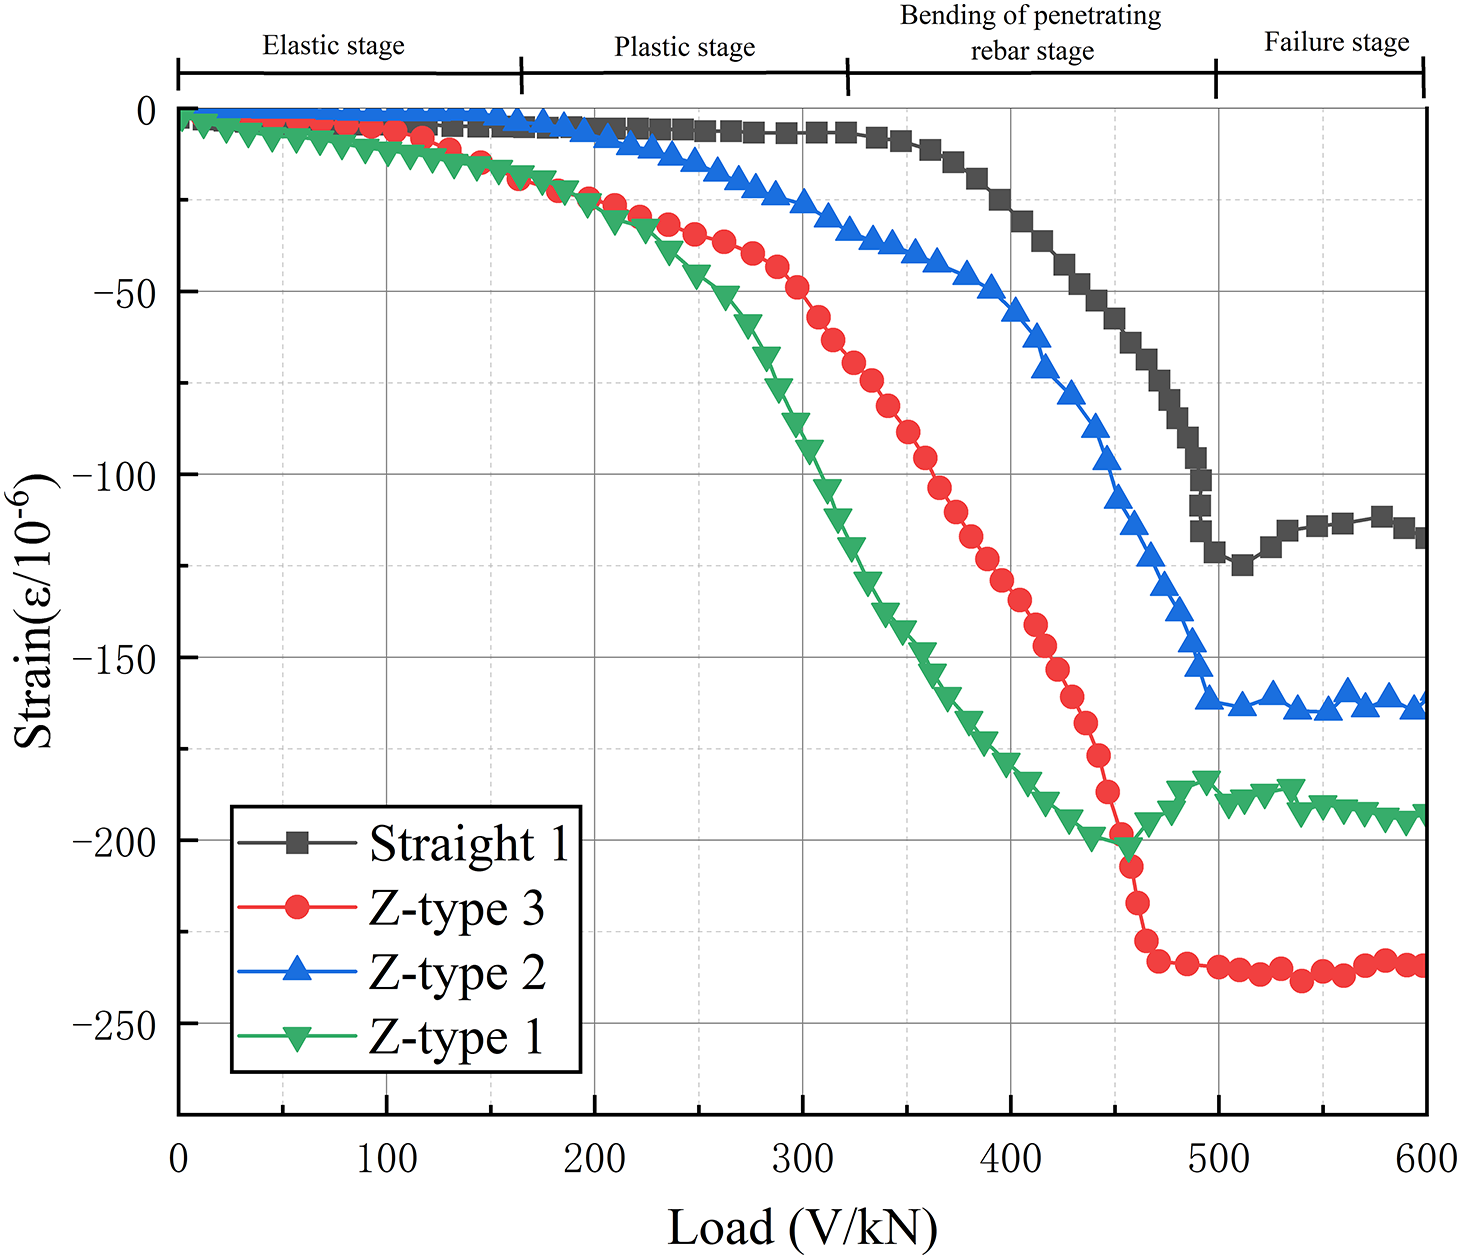
Figure 11: Strain-curve of penetrating rebars
The whole loading process can be divided into four stages: elastic stage, plastic stage, bending of penetrating rebar stage, and failure stage. At the initial stage of loading, the shear force transmitted by the steel-perfobond connector surface is small, mainly due to the bond resistance between the I shape steel and concrete. The strain values of the two types of penetrating steel rebars are very small, and the rebars are in the elastic stage.
After the bonding resistance is eliminated, the test enters the plastic stage. The penetrating steel rebar begins to be stressed under the action of load. The shear force is resisted by the penetrating steel rebar and the circular concrete tenon. The upper surface of the rebars is compressed, and the strain monitored by the sensor gradually increases.
After the test entered the bending stage of steel rebars, the strain of straight steel rebars and Z-type penetrating rebars continued to increase.
At the failure stage of the test, the strain values of both types of penetrating steel rebars did not change significantly. This is attributed to the concrete having seriously cracked by this time, losing its constraining effect on the penetrating steel rebars, with the specimens now only supported by the residual strength of the concrete. It is noteworthy that under the same load, Z-type penetrating rebars exhibit greater strain, which means that Z-type penetrating rebars bear more shear during loading.
3-D nonlinear finite element (FE) models of the push-out tests are established by ABAQUS to investigate the shear behavior of the PBL with Z-type penetrating rebar. As shown in Fig. 12, the models consist of I shape steel, perforated steel plate, concrete blocks, Z-type penetrating rebar, and distribution reinforcements. The distribution reinforcements and Z-type penetrating rebars are simulated by the linear truss element T3D2, and all the rest parts are built by the 3-D 8-node reduced integration element C3D8R.
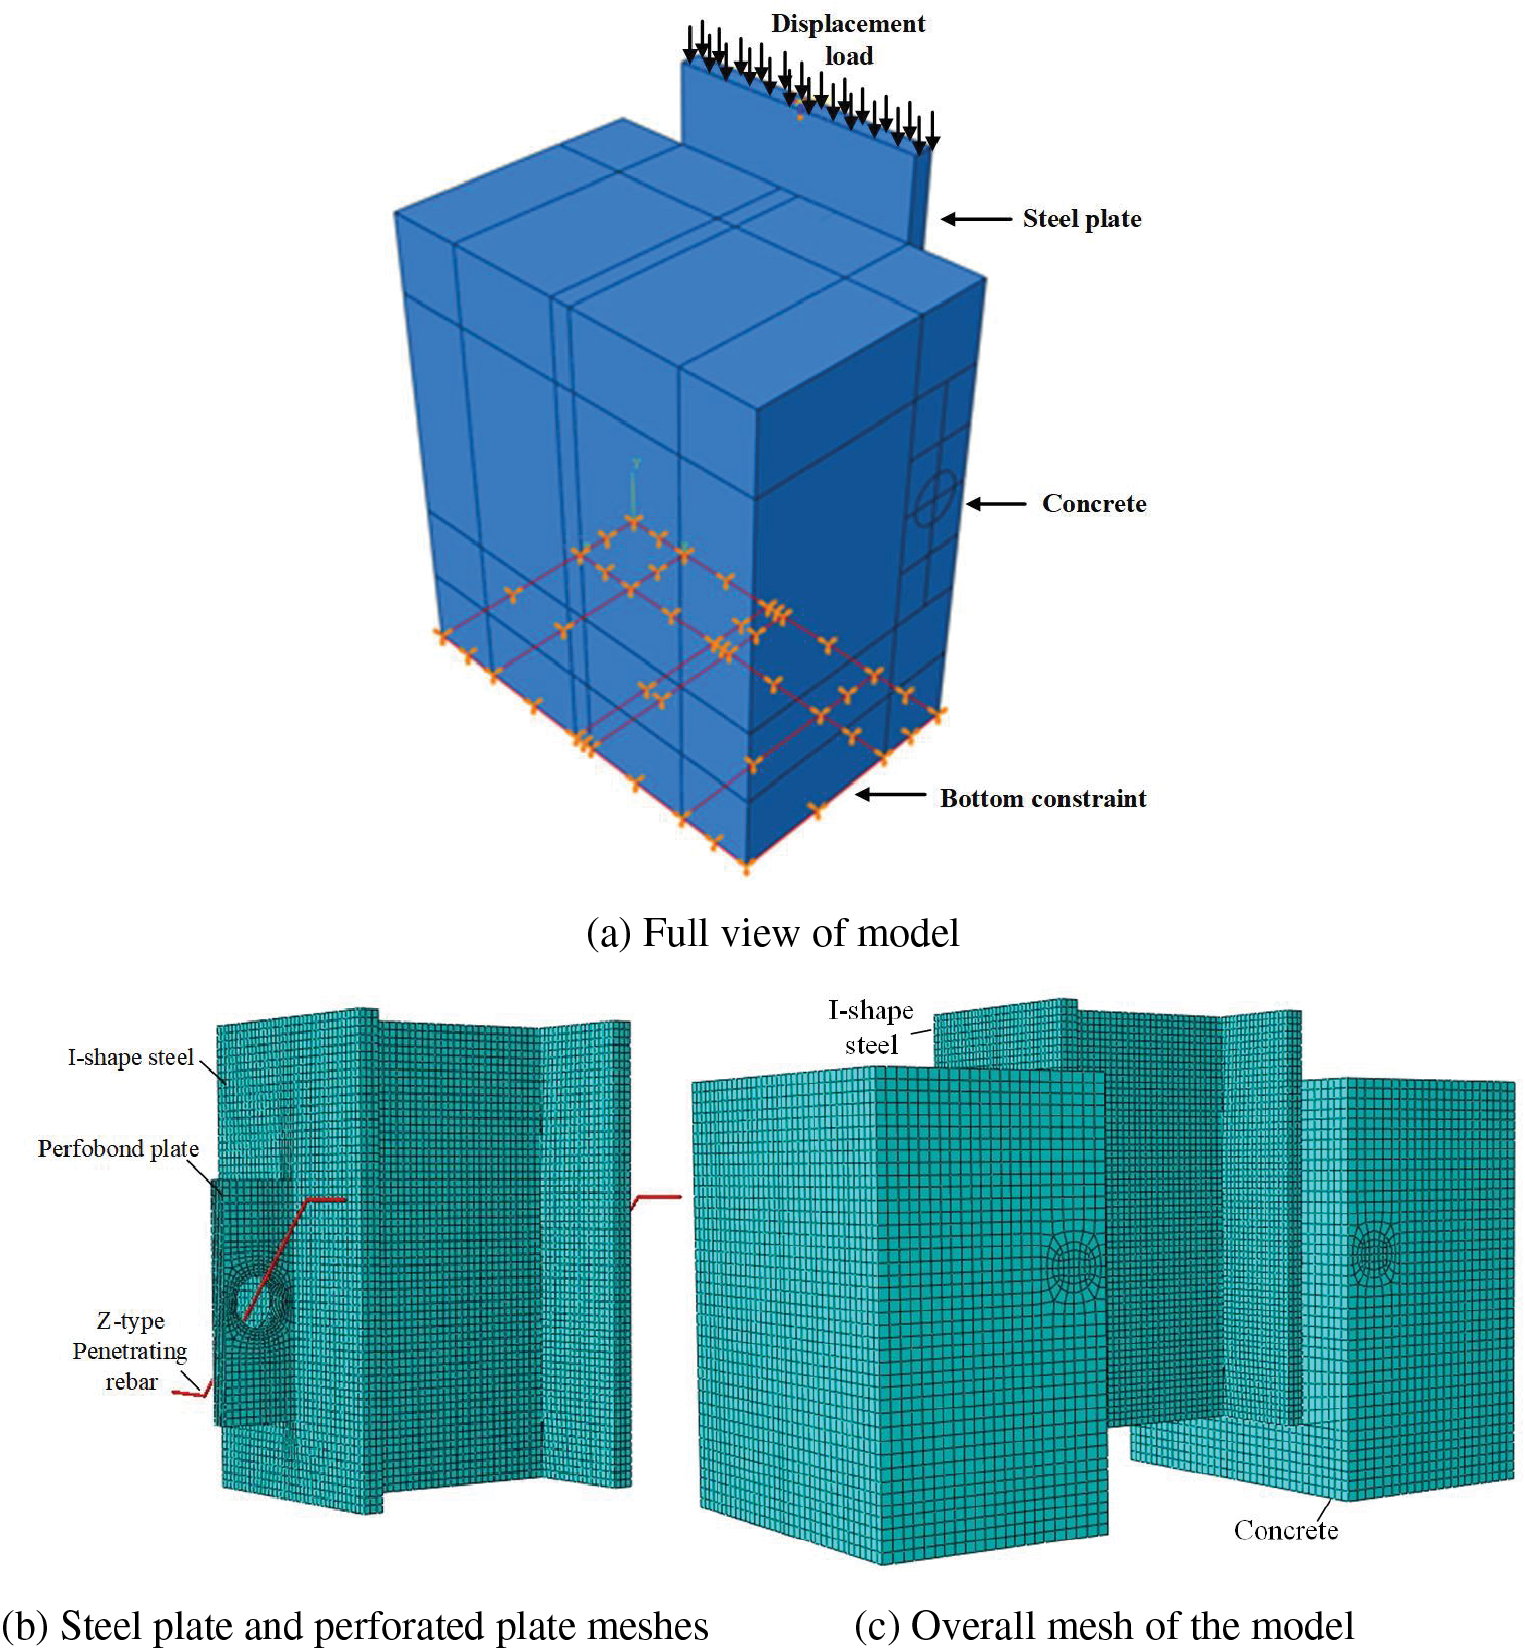
Figure 12: Finite element model
The bottom of the concrete block is fixed in the model, and the downward displacement loading is employed on the I shape steel, which is the same as the tests’ boundary condition and the loading condition. The perforated plate and the I shape steel share the same node. The concrete and the rebar are connected by the Embed technique. The surface-to-surface contact is adopted between the concrete and the perforated plate, as well as between the concrete and the I shape steel. The contact surface of I shape steel and the perforated plate are set as the main surface, and the concrete contact surface is set as the slave surface. A friction coefficient of 0.5 [33] is set between the master and slave surfaces to simulate the adhesive force between them.
In this paper, the ideal elastic-plastic bifold constitutive model is selected for the I-shape steel and the rebar [34]. The stress-strain curve is shown in Fig. 13, and the curve expression is as follows:
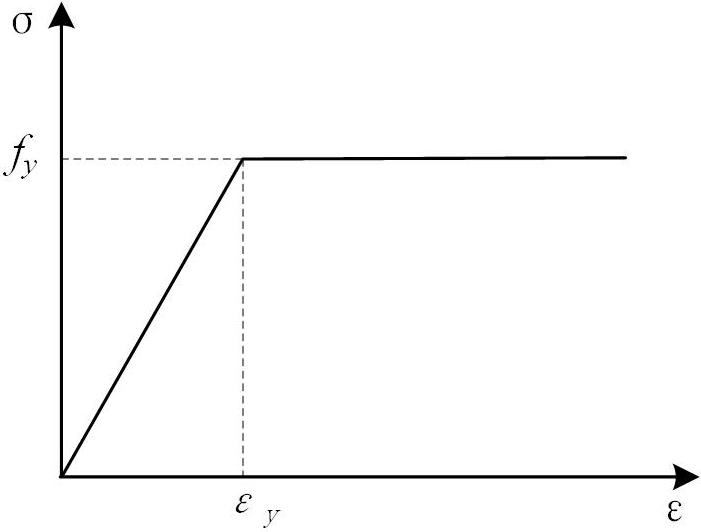
Figure 13: Stress-strain relationship for steel plate and rebar
The uniaxial stress damage constitutive model proposed by Ding et al. [35–37] is adopted for concrete, and the stress-strain curve equation is shown as follows:
where
The relevant parameters of concrete are substituted into Eq. (2) to obtain the final stress-strain curve equation of concrete, as shown in Eqs. (3) and (4). Other parameters of concrete are as follows: the density of 2.42 t/m3, the elastic modulus of 3.45 × 10⁴ MPa and Poisson’s ratio of 0.2.
Fig. 11 shows the test and FE analysis load-slip curves. Overall, the simulated curves agree well with the test results. Also, the good predictions of peak loads and yield loads are realized in the simulation.
The mean ultimate bearing capacity of two PBL specimens with straight penetrating rebar in test is 211.07 kN with a relative slip of 0.96 mm, while the FE analysis yields a mean ultimate bearing capacity of 214.14 kN and a relative slip of 0.97 mm. The actual mean ultimate bearing capacity of six PBL specimens with Z-type penetrating rebar in test is 233.07 kN with a relative slip of 1.07 mm, while the FE analysis yields a mean ultimate bearing capacity of 231.20 kN and a relative slip of 1.02 mm. These results demonstrate that the developed numerical modelling method is reasonable and effective in analysing the mechanical behavior of PBL shear connectors.
4.2.2 Deformation and Stress of the Perforating Rebar
Fig. 14 depicts the deformation of the penetrating rebar in FE analysis, showing a maximum displacement of 2.744 mm at the midpoint of the straight penetrating rebar, compared to 3.5 mm in the test. For the Z-type penetrating rebar, the maximum midpoint deformation is 1.798 mm, against 2.5 mm in the test. In both test and FE analysis, the Z-type penetrating rebar demonstrates a consistently smaller maximum displacement than its straight counterpart, with a relatively uniform deformation pattern. Fig. 15 highlights the maximum stress values at the midpoint of both Z-type and straight penetrating rebars. The measured stress value for the Z-type perforated connector is 29.78 MPa and FE analysis value is 32.09 MPa, while the straight perforated connector shows measured and calculated stress values of 54.16 and 70.90 MPa, respectively. These FE calculation results align closely with the push-out test outcomes. Furthermore, the maximum stress value for both types of penetrating rebar remains significantly below the reinforcement’s yield stress of 371 MPa, suggesting that the rebar yielding does not govern the failure of the PBL shear connector.
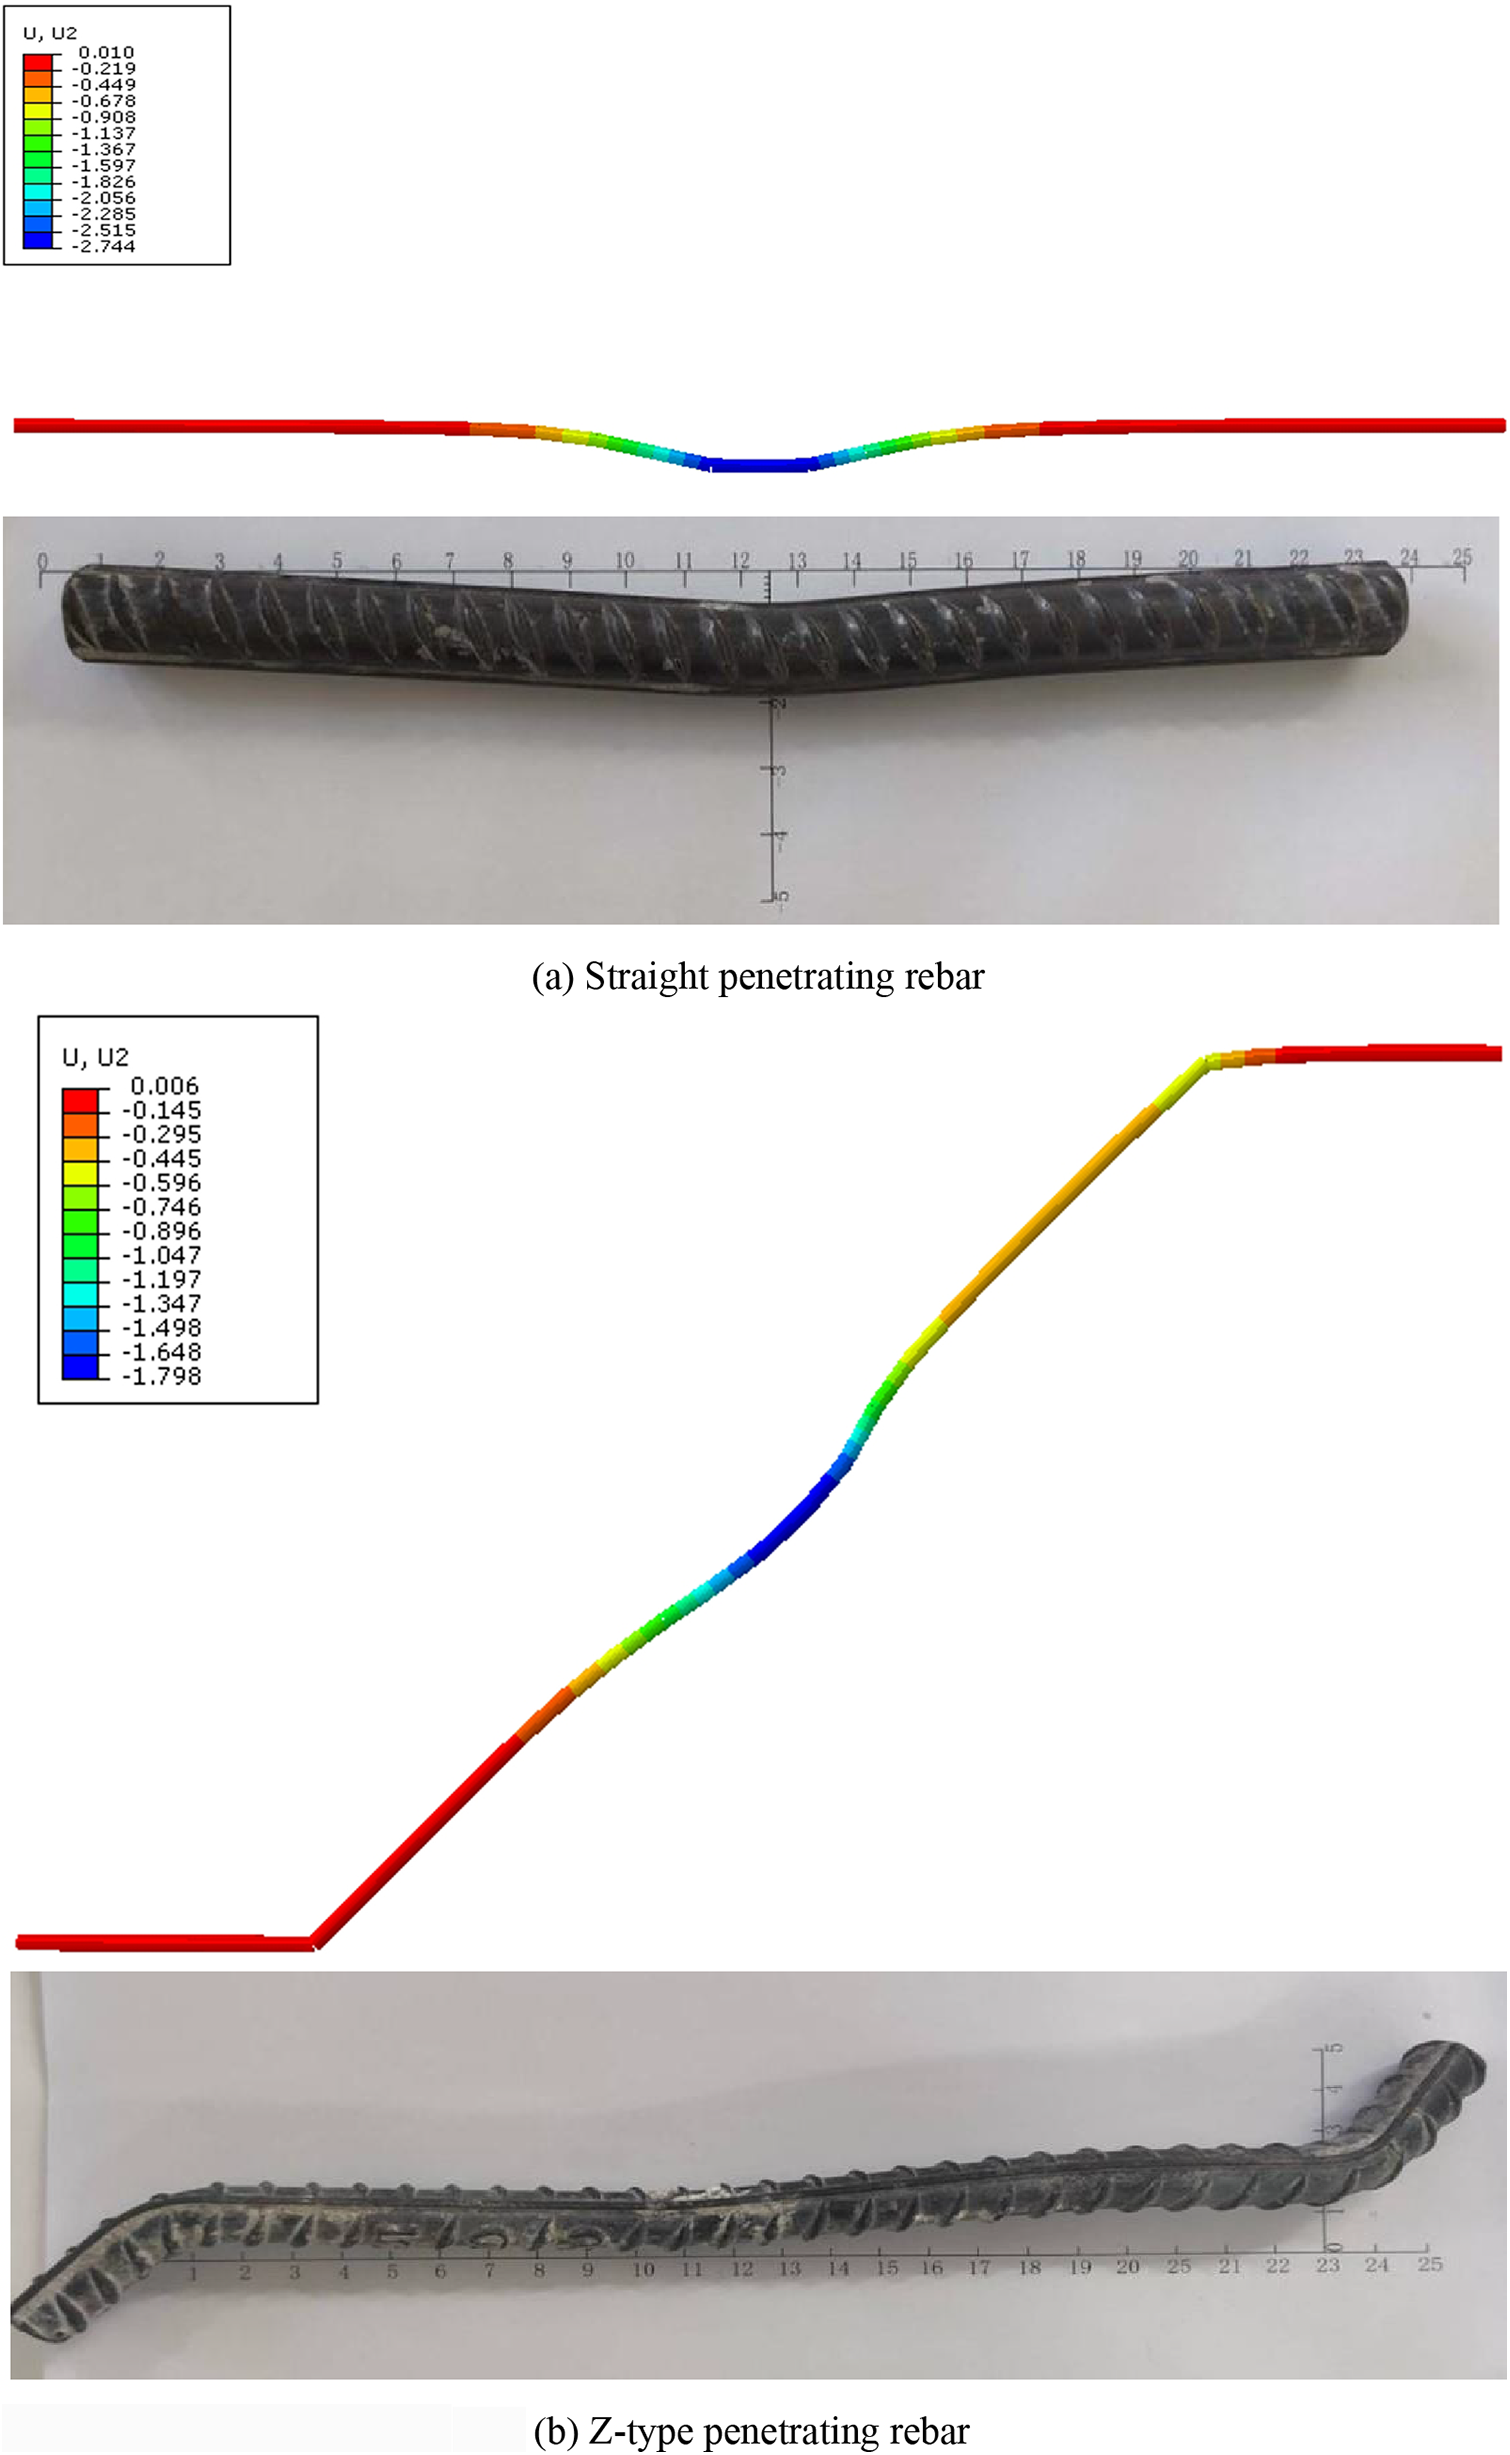
Figure 14: Comparison of deformation of the perforating rebar (mm)
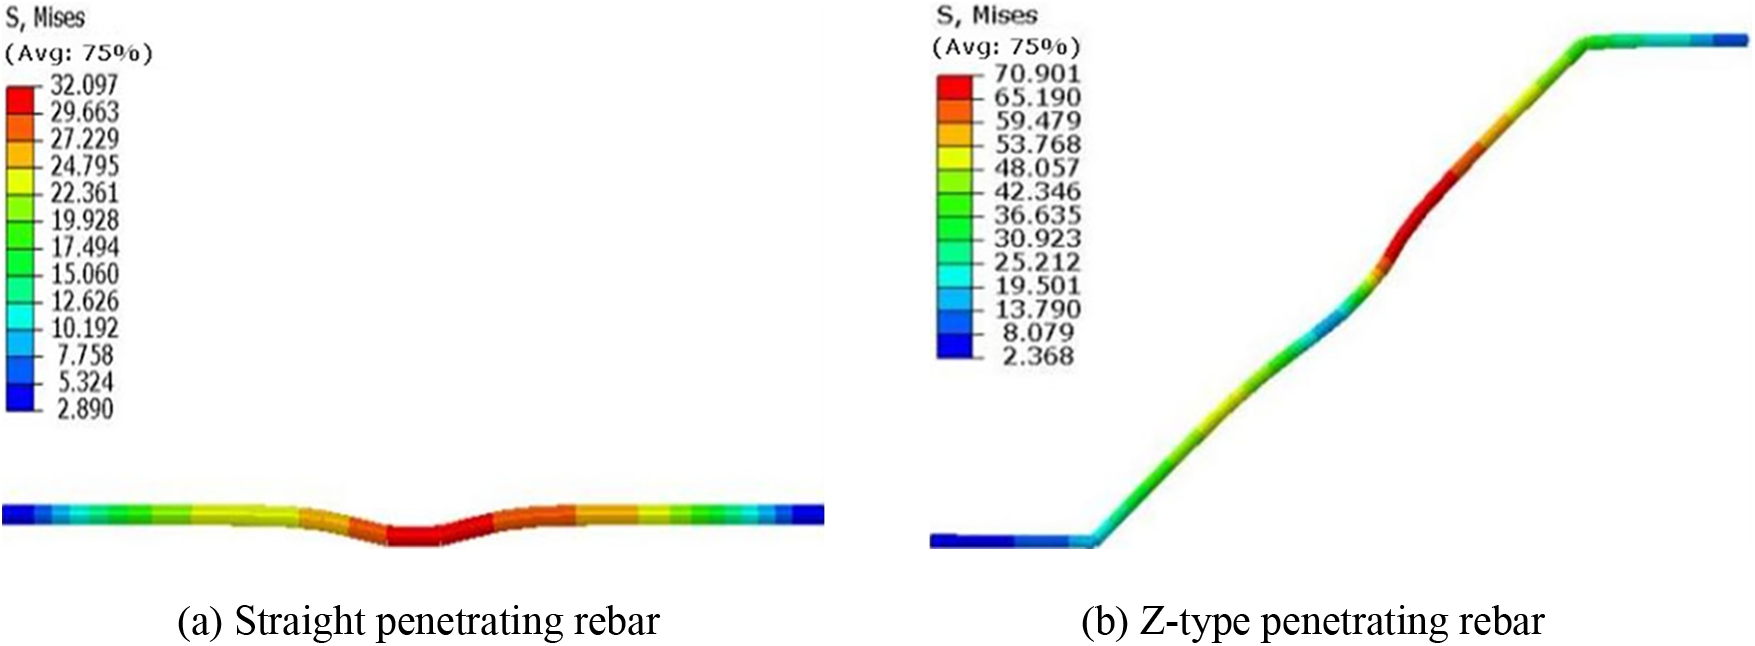
Figure 15: Comparison of the Mises stress of the two penetrating rebars (MPa)
4.3 Parametric Study of PBL Which Contain Z-Type Penetrating Rebar
To investigate the influence of different factors on the load-slip behavior of the PBL with Z-type penetrating rebar, 15 PBL models were parameterized by the validated FE. The relevant parameters include concrete strength grade, perforated plate aperture size, penetrating bar diameter, bending angle and length of Z-type penetrating rebar. Table 6 summarizes the values of each parameter, which basically covers the scope of application in engineering practice.
4.3.1 Influence of Concrete Grade
Three FE models with concrete grades of C40, C50, and C60 were used to explore the impact of concrete strength on the shear behavior of PBL connectors, and other factors remained unchanged like a 14-mm-diameter rebar, a 40-mm-diameter perforated plate aperture, and a 45-degree bend in the Z-type rebar.
Fig. 16 shows that the load-slip behavior of these models is similar, proceeding with elastic, elastic-plastic, yield, and failure stages. In the elastic phase, higher-grade concrete results in less slip under the same load and requires a higher load to reach the elastic-plastic phase. In the yield phase, models with higher-grade concrete produce a greater relative slip before failing. The shear capacities for the PBL connectors with C40, C50, and C60 concrete are 210.76, 231.20, and 245.59 kN, respectively. This indicates that higher concrete grades enhance the shear capacity and ductility of PBL connectors, making concrete strength a key factor in determining their performance.
Figure 16: Load-slip curves under different concrete grade
4.3.2 Influence of the Perforated Plate’s Aperture
Three FE models were developed to examine the impact of perforated plate aperture sizes (30, 40, and 50 mm) on the shear behavior of PBL connectors, and other parameters kept constant. The models featured 14-mm-diameter rebar, C50 concrete, and a 45-degree bend in the Z-type rebar. As shown in Fig. 17, load-slip curves for these models align in the elastic stage. With increasing load, smaller apertures transition to the elastic-plastic stage sooner. The shear capacity of PBL at apertures of 30, 40, and 50 mm was 230.31, 231.20, and 234.66 kN, respectively, showing a marginal increase with larger apertures. Notably, the 40-mm-diameter aperture exhibits enhanced ductility, failing at a later stage as compared to the 50-mm-diameter aperture. This suggests a limited improvement in PBL’s shear capacity from aperture size, with 40 mm offering optimal ductility.
Figure 17: Load-slip curves with different perforated plate apertures
4.3.3 Influence of the Penetrating Rebar’s Diameter
Three FE models were created to investigate the impact of penetrating rebar diameter on the shear behavior of PBL connectors. These models featured Z-type rebars with diameters of 10, 14, and 18 mm. All other parameters were maintained constant, i.e., the 40-mm-diameter perforated plate aperture, the C50 concrete, and the Z-type rebar’s bending angle at 45 degrees. Fig. 18 presents the load-slip curves of these models. The shear capacities of PBL with rebar diameters of 10, 14, and 18 mm were found to be 230.99, 231.20, and 231.47 kN, respectively. This indicates that with the increase of steel bar diameter, the shear capacity of PBL is increasing, but the improvement is very limited.

Figure 18: Load-slip curves with different penetrating rebar diameters
4.3.4 Influence of the Penetrating Rebar’s Bending Angle and Length
To investigate the effects of the bending angle and length of the Z-type penetrating rebar on the shear behavior of PBL connectors, three FE models were created for each variable. In the first set, the models had rebars with bending angles of 40°, 45°, and 50°, and in the second set, the rebars had bending lengths of 40, 50, and 60 mm. All other parameters were consistent among models: a concrete grade of C50, a rebar diameter of 14 mm, and an aperture size of 40 mm in the perforated plate. The load-slip curves, depicted in Figs. 19 and 20, revealed that the shear capacities varied with the bending angles and lengths. For the bending angles of 40°, 45°, and 50°, the shear capacities were 224.95, 231.20, and 228.44 kN, respectively, with the 45° angle yielding the highest capacity. Similarly, for bending lengths of 40, 50, and 60 mm, the capacities were 225.86, 231.2, and 237.12 kN, respectively, with the 60 mm length showing the highest capacity.
Figure 19: Load-slip curves of the penetrating rebars with different bending angle
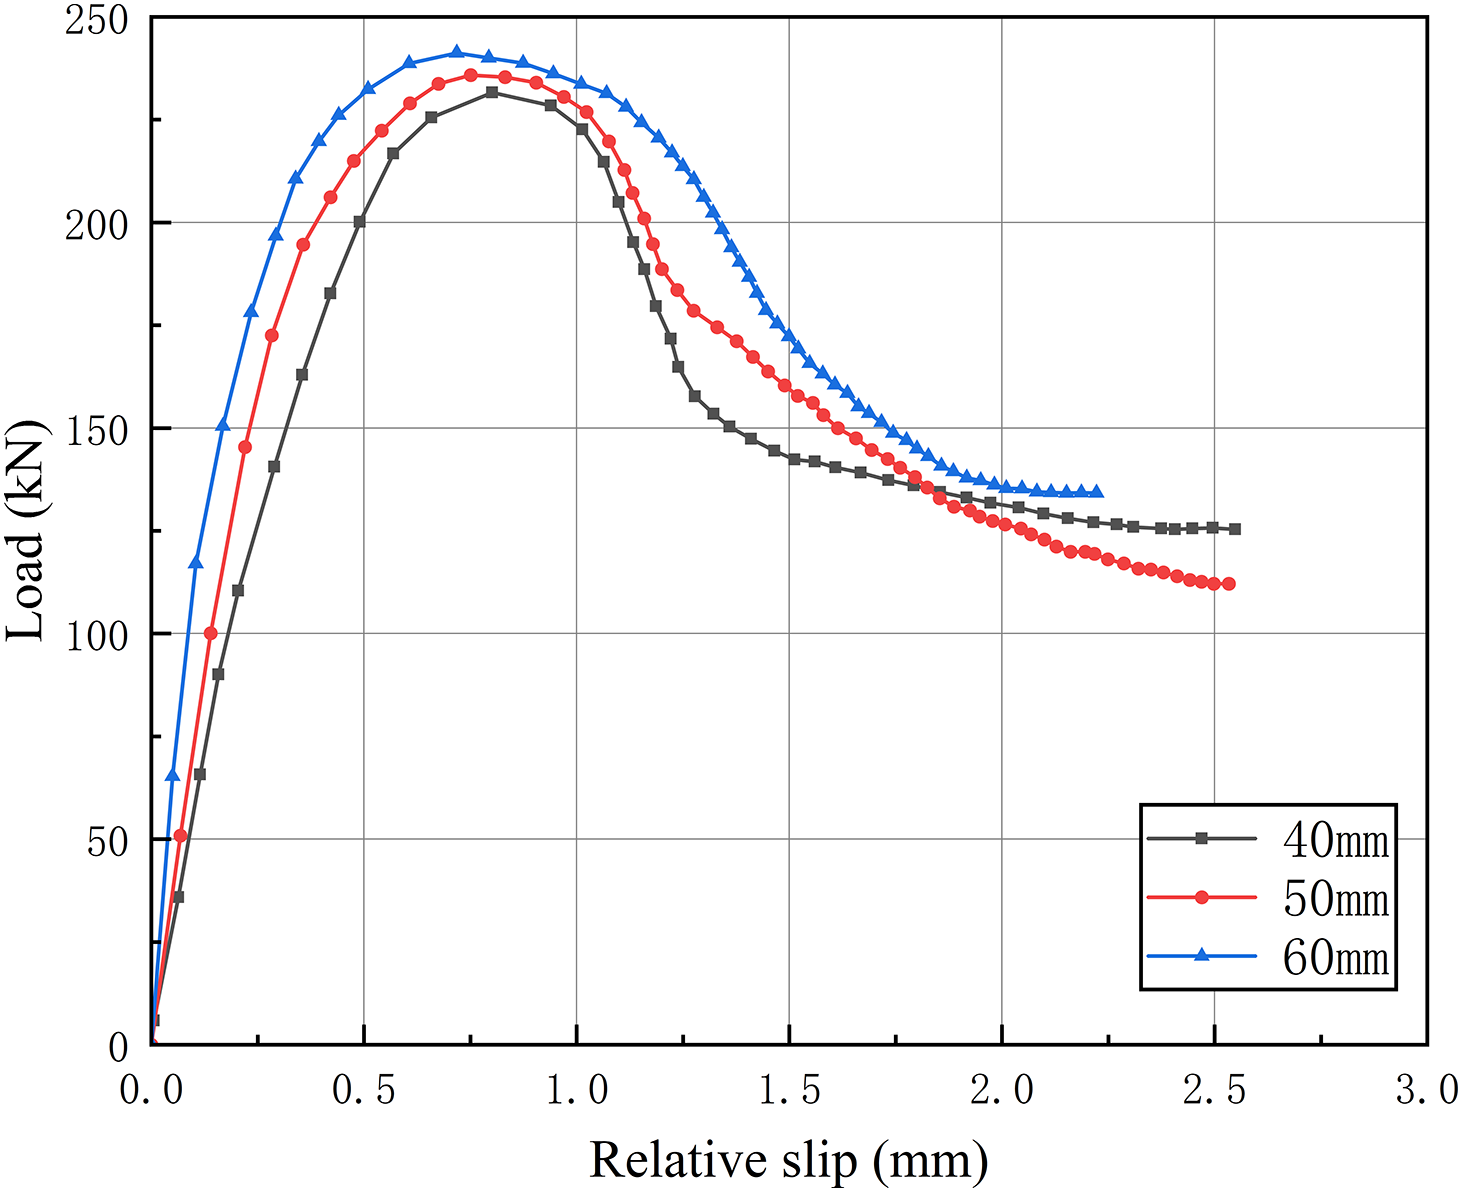
Figure 20: Load-slip curves of the penetrating rebars with different bending length
Based on the results of the parametric study of PBL with Z-type penetrating rebar, the conclusions are as follows:
1. The main factor affecting the bearing capacity and load-slip behavior of the PBL with Z-type penetrating rebar is the concrete grade. The higher the grade of concrete, the higher shear capacity and better ductility.
2. Increasing the perforated plate’s aperture has a very limited effect on the improvement of the shear bearing capacity of PBL. Increasing the penetrating rebar’s diameter has little impact on the improvement of the shear bearing capacity of PBL.
3. The bending angle of the rebar and the length of the bending part should match the diameter of the perforated plate aperture. In this study, the perforated plate’s aperture is 40 mm, with the Z-type penetrating rebar’s bending angle of 45° and the penetrating rebar’s bending length of 50 mm, the shear bearing capacity of the PBL with Z-type penetrating rebar is the largest.
In this study, the push-out tests of the PBL specimens with Z-type penetrating rebar and the PBL specimens with straight rebar were carried out to compare their load-slip curve, strain, ultimate bearing capacity and failure mode. Through FE analysis, the effects of concrete grade, perforated plate’s aperture, Z-type penetrating rebar’s diameter, Z-type penetrating rebar’s bending angle and length on shear behavior were discussed. The main conclusions are as follows:
1. Under the same material conditions, the PBL specimens with Z-type penetrating rebar is better than that of the PBL specimens with straight penetrating rebar. The ultimate bearing capacity of Z-type perforated connector is 10.42% higher than that of the straight rebar, and the maximum shear stiffness increased by 10.67%.
2. According to the load-slip curve of the specimen, the bearing capacity of the specimen with straight penetrating rebar slowly decreased, and the bearing capacity of the specimen with Z-type penetrating rebar decreased first and then increased gradually. Thus, the specimen containing Z-type penetrating rebar did not fail immediately after concrete cracking and it still retained shear resistance, enhancing the ductility of the specimen. By comparing the peak load of the two types of connectors, the ultimate bearing capacity with Z-type penetrating rebar is enhanced by 10.42% compared with straight penetrating rebar. This enhanced performance can be mainly attributed to the increased adhesion of the transverse penetrating rebar. The use of Z-type rebar can significantly improve the bonding ability to the concrete.
3. The stress of the PBL shear connector with Z-type perforated connector is more uniform than the PBL shear connector with a straight perforated connector, and the overall deformation is more uniform. Under the same load, Z-type penetrating rebars exhibit greater strain, which means that Z-type penetrating rebars bear more shear force during loading. It makes full use of the shear and tensile properties of the penetrating rebars, which promotes the shear bearing capacity and ductility of the integrated PBL shear connector.
4. Based on the results of the parametric study of PBL connectors with Z-type penetrating rebar, it can be observed that the higher the grade of concrete, the higher shear capacity and the better ductility. Increasing the perforated plate’s aperture and penetrating rebar’s diameter have a very limited effect on the improvement of the shear bearing capacity of PBL. The bending angle of the rebar and the length of the bending part should match the diameter of the perforated plate aperture.
Acknowledgement: None.
Funding Statement: The authors received no specific funding for this study.
Author Contributions: Study conception and design: Caiping Huang; data collection: Zihan Huang; analysis and interpretation of results: Wenfeng You; draft manuscript preparation: Caiping Huang, Zihan Huang, Wenfeng You. All authors reviewed the results and approved the final version of the manuscript.
Availability of Data and Materials: All data generated or analysed during this study are included in this published article.
Conflicts of Interest: The authors declare that they have no conflicts of interest to report regarding the present study.
References
1. Zou, Y., Di, J., Zhou, J., Zhang, Z., Li, X. et al. (2020). Shear behavior of perfobond connectors in the steel-concrete joints of hybrid bridges. Journal of Constructional Steel Research, 172(2), 106217. https://doi.org/10.1016/j.jcsr.2020.106217 [Google Scholar] [CrossRef]
2. Candido-Martins, J. P. S., Costa-Neves, L. F., Vellasco, P. C. G. D. S. (2010). Experimental evaluation of the structural response of perfobond shear connectors. Engineering Structures, 32(8), 1976–1985. https://doi.org/10.1016/j.engstruct.2010.02.031 [Google Scholar] [CrossRef]
3. Liu, Y., Xin, H., Liu, Y. (2021). Experimental and analytical study on tensile performance of perfobond connector in bridge engineering application. Structures, 29(5), 714–729. https://doi.org/10.1016/j.istruc.2020.11.045 [Google Scholar] [CrossRef]
4. Su, Q. T., Wang, W., Luan, H. W. (2014). Experimental research on bearing mechanism of perfobond rib shear connectors. Journal of Constructional Steel Research, 95(2), 22–31. https://doi.org/10.1016/j.jcsr.2013.11.020 [Google Scholar] [CrossRef]
5. da C. Vianna, J., de Andrade, S. A. L., da S. Vellasco, P. C. G., Costa-Neves, L. F. (2013). Experimental study of perfobond shear connectors in composite construction. Journal of Constructional Steel Research, 81(3), 62–75. https://doi.org/10.1016/j.jcsr.2012.11.002 [Google Scholar] [CrossRef]
6. Zhang, J., Hu, X., Kou, L. (2018). Experimental study of the short-term and long-term behavior of perfobond connectors. Journal of Constructional Steel, 150, 462–474. https://doi.org/10.1016/j.jcsr.2018.09.004 [Google Scholar] [CrossRef]
7. Liu, Y., Xin, H., Liu, Y. (2019). Experimental and analytical study on shear mechanism of rubber-ring perfobond connector. Engineering Structures, 197, 109382. [Google Scholar]
8. Kim, K. S., Han, O., Choi, J. (2019). Hysteretic performance of stubby Y-type perfobond rib shear connectors depending on transverse rebar. Construction and Building Materials, 200, 64–79. [Google Scholar]
9. Kim, S. H., Kim, K. S., Han, O. (2018). Influence of transverse rebar on shear behavior of Y-type perfobond rib shear connection. Construction and Building Materials, 180, 254–264. https://doi.org/10.1016/j.conbuildmat.2018.06.002 [Google Scholar] [CrossRef]
10. Kim, K. S., Han, O., Heo, W. H., Kim, S. H. (2020). Behavior of Y-type perfobond rib shear connection under different cyclic loading conditions. Structures, 26, 562–571. https://doi.org/10.1016/j.istruc.2020.04.053 [Google Scholar] [CrossRef]
11. Kim, K. S., Han, O., Gombosuren, M. (2019). Numerical simulation of Y-type perfobond rib shear connectors using finite element analysis. Steel and Composite Structures, 31(1), 53–67. https://doi.org/10.12989/scs.2019.31.1.053 [Google Scholar] [CrossRef]
12. Utashev, N., Wang, Q. Y., Wang, Z. Y. (2020). Anchorage of Perfobond Leiste shaped shear connector composite dowel with carbon fibre reinforced polymer. Journal of Building Engineering, 34, 101711. https://doi.org/10.1016/j.jobe.2020.101711 [Google Scholar] [CrossRef]
13. Xiong, Z., Liu, Y., Zuo, Y., Xin, H. (2023). Experimental evaluation of shear behavior of pultruded GFRP perforated connectors embedded in concrete. Composite Structures, 222(1), 110938. https://doi.org/10.1016/j.compstruct.2019.110938 [Google Scholar] [CrossRef]
14. Nguyen M. H., Hirano Y., Nakajima A., Fujikura S., Niimura R. (2020). Experimental evaluation of the shear capacity of perfobond strips with steel fiber-reinforced mortar in narrow joint structures. Structures, 28, 1173–1186. https://doi.org/10.1016/j.istruc.2020.09.059 [Google Scholar] [CrossRef]
15. Arévalo, D., Hernández, L., Gómez, C. (2021). Structural performance of steel angle shear connectors with different orientation. Case Studies in Construction Materials, 14(2), e00523. https://doi.org/10.1016/j.cscm.2021.e00523 [Google Scholar] [CrossRef]
16. Shariati, M., Ramli Sulong, N. H., Shariati, A. (2016). Behavior of V-shaped angle shear connectors: Experimental and parametric study. Materials and Structures, 49(9), 3909–3926. https://doi.org/10.1617/s11527-015-0762-8 [Google Scholar] [CrossRef]
17. Mazoz, A., Benanane, A., Titoum, M. (2013). Push-out tests on a new shear connector of I-shape. International Journal of Steel Structures, 13(3), 519–528. https://doi.org/10.1007/s13296-013-3011-4 [Google Scholar] [CrossRef]
18. Zhang, Z., Pang, K., Xu, L. (2023). The bond properties between UHPC and stone under different interface treatment methods. Construction and Building Materials, 365, 130092. [Google Scholar]
19. Yang, J., Chen, R., Zhang, Z. (2023). Experimental study on the ultimate bearing capacity of damaged RC arches strengthened with ultra-high performance concrete. Engineering Structures, 279, 115611. [Google Scholar]
20. Zou, Y., Jiang, J., Yang, J. (2023). Enhancing the toughness of bonding interface in steel-UHPC composite structure through fiber bridging. Cement and Concrete Composites, 137, 104947. [Google Scholar]
21. Lau, K. T., Yuan, L., Zhou, L. M. (2001). Strain monitoring in FRP laminates and concrete beams using FBG sensors. Composite Structures, 51(1), 9–20. https://doi.org/10.1016/S0263-8223(00)00094-5 [Google Scholar] [CrossRef]
22. Anderson, D. (2023). Eurocode 4-Design of composite steel and concrete structures. Berlin Heidelberg: Springer. https://doi.org/10.1007/978-3-642-41714-6_51757 [Google Scholar] [CrossRef]
23. Wang, L., Hu, Z., Yi, J. (2020). Shear behavior of corroded post-tensioned prestressed concrete beams with full/insufficient grouting. KSCE Journal of Civil Engineering, 24, 1881–1892. [Google Scholar]
24. Ma, Y., Zhang, B., Peng, A. (2023). Experimental and analytical investigation on shear mechanism of steel-UHPC composite T-perfobond shear connectors. Engineering Structures, 286, 116061. [Google Scholar]
25. Zhao, J., Liu, L., Qiu, H. (2015). Code for design of concrete structures (GB 50010-2010). Construction Science and Technology, 10, 3. [Google Scholar]
26. Wang, H., Jiang, L., Xiang, P. (2018). Priority design parameters of industrialized optical fiber sensors in civil engineering. Optics & Laser Technology, 100(10), 119–128. https://doi.org/10.1016/j.optlastec.2017.09.035 [Google Scholar] [CrossRef]
27. Wang, H., Xiang, P., Jiang, L. (2019). Strain transfer theory of industrialized optical fiber-based sensors in civil engineering: A review on measurement accuracy, design and calibration. Sensors and Actuators A: Physical, 285(2), 414–426. https://doi.org/10.1016/j.sna.2018.11.019 [Google Scholar] [CrossRef]
28. Japanese Architectural Standard Specification JASS 6 (1996). Structural steelwork specification for building construction. Japan Steel Structure Association. https://www.aij.or.jp/aijhome.htm [Google Scholar]
29. Oehlers, D. J., Coughlan, C. G. (1986). The shear stiffness of stud shear connections in composite beams. Journal of Constructional Steel Research, 6(4), 273–284. https://doi.org/10.1016/0143-974X(86)90008-8 [Google Scholar] [CrossRef]
30. Zheng, S. J., Liu, Y. Q. (2014). Experiment of initial shear stiffness of perfobond connector. China Journal of Highway & Transport, 27(11), 69–75 (In Chinese). [Google Scholar]
31. Yang, Y., Chen, Y., Cai, J. W. (2017). Experiment on static behavior of perfobond shear connectors. China Journal of Highway & Transport, 30(3), 255–263 (In Chinese). [Google Scholar]
32. Weichen, X., Yan, D., Liang, Z. (2009). Experimental studies on shear behavior of perfobond connectors. Journal of Building Structures, 30(1), 95–100. https://doi.org/10.1109/CLEOE-EQEC.2009.5194697 [Google Scholar] [CrossRef]
33. Ludwig, W. (2013). Abaqus CFD User’s Guide, Version 6.13.1. Providence, RI: Dassault Systèmes Simulia Corp. [Google Scholar]
34. Zhang, J. D., Gu, J. C., Deng, W. Q. (2018). Shear behavior of perfobond rib shear connectors for pre-fabricated composite bridges. China Journal of Highway and Transport, 31(12), 71–80 (In Chinese). [Google Scholar]
35. Ding, F. X., Yu, Z. W., Ou, J. P. (2008). Damage constitutive model for concrete under uniaxial stress conditions. Journal of Chang’an University, 30(5), 527–528 (In Chinese). https://doi.org/10.3724/SP.J.1005.2008.00527 [Google Scholar] [CrossRef]
36. Yu, Z., Ding, F. (2003). Unified calculation method of compressive mechanical properties of concrete. Journal of Building Structures, 13(4), 364–369 (In Chinese). https://doi.org/10.1007/s11769-003-0044-1 [Google Scholar] [CrossRef]
37. Ding, F. X., Yu, Z. W. (2004). Unified calculation method of mechanical properties of concrete in tension. Journal of Huazhong University of Science and Technology, 21(3), 29–34 (In Chinese). [Google Scholar]
Cite This Article
 Copyright © 2024 The Author(s). Published by Tech Science Press.
This work is licensed under a Creative Commons Attribution 4.0 International License , which permits unrestricted use, distribution, and reproduction in any medium, provided the original work is properly cited.
 Downloads
 Citation Tools