
 Submit a Paper
 Propose a Special lssue
 Open Access
ARTICLE

Coupling Effect of Cryogenic Freeze-Thaw Cycles and Chloride Ion Erosion Effect in Pre-Cracked Reinforced Concrete
School of Civil Engineering and Architecture, Hubei University of Technology, Wuhan, 430068, China
* Corresponding Author: Sibo Jiang. Email:
(This article belongs to the Special Issue: Health Monitoring and Rapid Evaluation of Infrastructures)
Structural Durability & Health Monitoring 2024, 18(3), 255-276. https://doi.org/10.32604/sdhm.2024.047776
Received 17 November 2023; Accepted 31 January 2024; Issue published 15 May 2024
 View Full Text
 Download PDF
Abstract
Chloride (Cl) ion erosion effects can seriously impact the safety and service life of marine liquefied natural gas (LNG) storage tanks and other polar offshore structures. This study investigates the impact of different low-temperature cycles (20°C, –80°C, and −160°C) and concrete specimen crack widths (0, 0.3, and 0.6 mm) on the Cl ion diffusion performance through rapid erosion tests conducted on pre-cracked concrete. The results show that the minimum temperature and crack width of freeze-thaw cycles enhance the erosive effect of chloride ions. The Cl ion concentration and growth rate increased with the increasing crack width. Based on the experimental model and in accordance with Fick’s second law of diffusion, the Cl ion diffusion equation was modified by introducing correction factors in consideration of the freeze-thaw temperature, crack width, and their coupling effect. The experimental and fitting results obtained from this model can provide excellent reference for practical engineering applications.Graphic Abstract
Keywords
The durability of concrete structures can be defined as their ability to maintain the original functional, aesthetic, and safety qualities within the specified service life, without additional expenses/labor for repair and reinforcement [1]. Corrosion of marine engineering structures has emerged as a global challenge as many in-service concrete structural components develop cracks that are exposed to the combined effects of low-temperature cycles and stress-induced cracking. This further facilitates the penetration of external corrosives, such as chloride (Cl−) ions. This effect is particularly significant in liquefied natural gas (LNG) storage tanks near coastal areas. Due to the necessity of storing LNG at −165°C, the tank surfaces undergo substantial temperature variations as the LNG amount in the tank changes. These limited cycles of ultra-low temperature exposure lead to continuous freezing/melting of the water within the concrete pores, resulting in internal damage and a reduction in strength [2]. In the ultra-low temperature environment, the concrete crystal volume reduces by ~20% and the crystal structure changes from hexagonal to monoclinic, resulting in a decrease in the overall density [3], further accelerating exposure to external corrosives. Several studies have focused on the corrosion mechanisms of reinforced concrete influenced by different factors, such as environmental conditions and specified usage. In particular, the impact of Cl− intrusion and freeze-thaw cycles are particularly significant. Chen et al. [4] studied the Cl− corrosion effects on steel reinforcement and found the bond stress to decrease with the increase of stray current and hydraulic pressure. This study established the bond stress degradation model for corroded reinforced concrete. In addition, in the results of stray current induced (ITZ) effect on chloride ion migration in concrete, it was found that there were huge differences in the depth of chloride ion penetration and effective diffusion coefficients of specimens with different aggregate grades due to the stray current induced ITZ effect (a significant increase in the thickness and porosity of interfacial transition zones (ITZs) on the reactive surfaces of the concrete in the presence of a stray current environment). The corrosion of steel reinforcement induced by Cl− ions in concrete leads to surface and service life deterioration of marine structures [5]. Chung et al. [6] indicated that the water-to-cement ratio is directly proportional to the Cl− ion diffusion coefficient, and the incorporation of fly ash or silica fume can significantly improve the resistance of concrete to Cl– penetration. Ma et al. [7] found that the a the incorporation of pre-damaged recycled aggregate concrete (RAC) was positively correlated with Cl− permeability. On the other hand, in freeze-thaw cycle studies. Liu et al. [8] investigated the corrode of concrete under multiple factors based on the steel reinforcement polarization curve and Stern-Geary equation, and revealed that corrosion occurs within 10–15 years due to repeated freeze-thaw cycles [9]. Peng et al. [10] conducted a study using the rapid Cl− migration method and revealed a series of functional relationships between Cl− concentration with the number of freeze-thaw cycles, along with a quadratic polynomial relationship with the applied unidirectional load. Wang et al. [11] presented a numerical simulation model for the concrete micro-composite structure and demonstrated the process of water and Cl− ions entering concrete. They found that the number of freeze-thaw cycles is directly proportional to the Cl– penetration rate.
Considering that reinforced concrete (RC) structures often operate with cracks, Xu et al. [12] investigated Cl− migration in concrete for varying Cl− salt species and number of freeze-thaw cycles. Their results indicated that after each freeze-thaw cycle, micro-cracks appeared within the concrete, leading to an increase in both porosity and Cl– concentration. Chen et al. [13] used data area normalization to reveal the corrosion characteristics of steel fibers for different crack widths. They observed that the Ultra-High Performance Concrete (UHPC) crack width affects its current value, which in turn reinforce the corrosion of steel fibers and ultimately leads to an increase in the uncracked region diffusion coefficient. Li et al. [14] established the diffusion equation considering crack width and depth, combining the research data from previous studies [15–17] through Laplace transformations.
Research on concrete durability has been predominantly centered on investigating the Cl− ion diffusion behavior either under freeze-thaw cycles in isolation or in cracked concrete at room temperature [18]. However, relatively few reports exist on the penetration of Cl− ions into concrete with cracks in concrete after freeze-thaw cycles at low temperatures. Therefore, in this study, (i) the effects of crack width and freeze-thaw temperature on Cl− ion diffusion were simultaneously considered, and (ii) the Cl− erosion of pre-cracked concrete samples subjected to cryogenic freeze-thaw cycles was investigated at the experimental stage for special facilities, such as LNG storage tanks, by combining diffusion theory and experimental data simulation. Furthermore, based on Fick’s second law, combined with the experimental data and Cl− ion diffusion variations in the cracked concrete after cryogenic freeze-thaw cycles, a modified model was established. Finally, an expression for quantifying the Cl− ion diffusion coefficient under ultra-low temperatures and cracking conditions was obtained.
2.1 Test Materials and Mixing Ratios
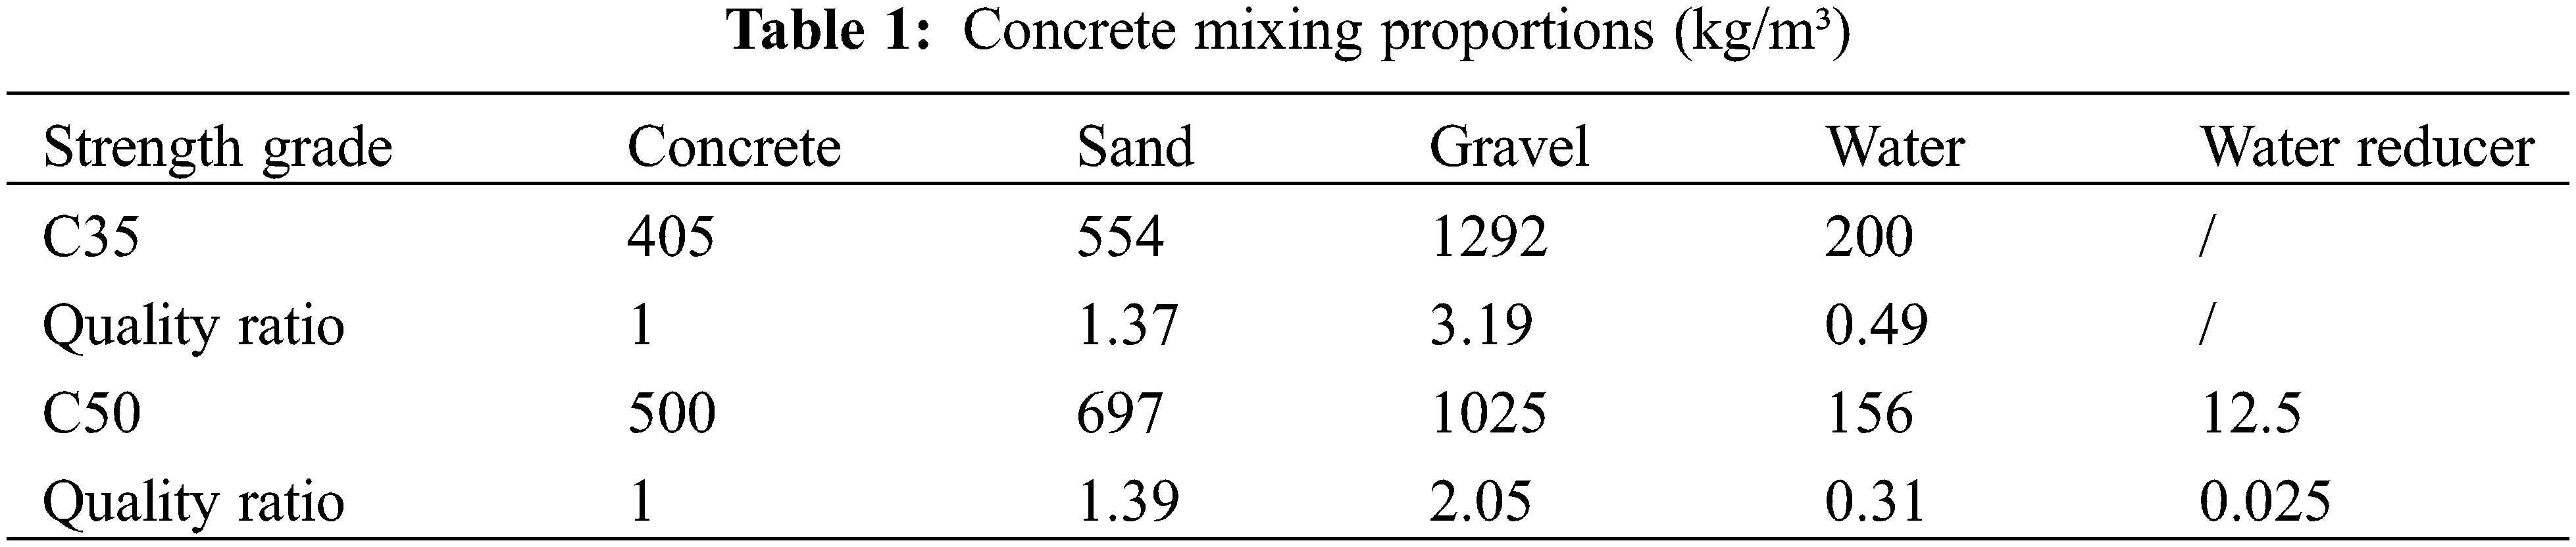
The binder materials in this study comprised Ordinary Portland cement (P.O42.5) sourced from Huarun Co., Ltd., China. The fine aggregate consisted of river sand with a fineness modulus of 2.6 and an apparent density of 2.61 g/cm3, and the coarse aggregate consisted of common gravel with a diameter of 10–15 mm. A standard liquid high-performance water reducing agent (Q8011) from Weike Building Materials Center was used. Steel reinforcement was provided by hot-rolled rebar (HRB400) with a diameter of 12 mm. Regular tap water was used throughout the mixing process (detailed mixing proportions are presented in Table 1).
2.2 Specimen and Experimental Design
All concrete specimens exhibited prismatic dimensions of 100 mm × 100 mm × 300 mm. Stainless steel sheets (0.3 and 0.6 mm thick, 50 mm wide, and 100 mm long) were selected as the tool for the prefabricated crack. The sides of the stainless steel sheet were glued onto a wooden stick and fixed in the middle of the mold (Fig. 1).
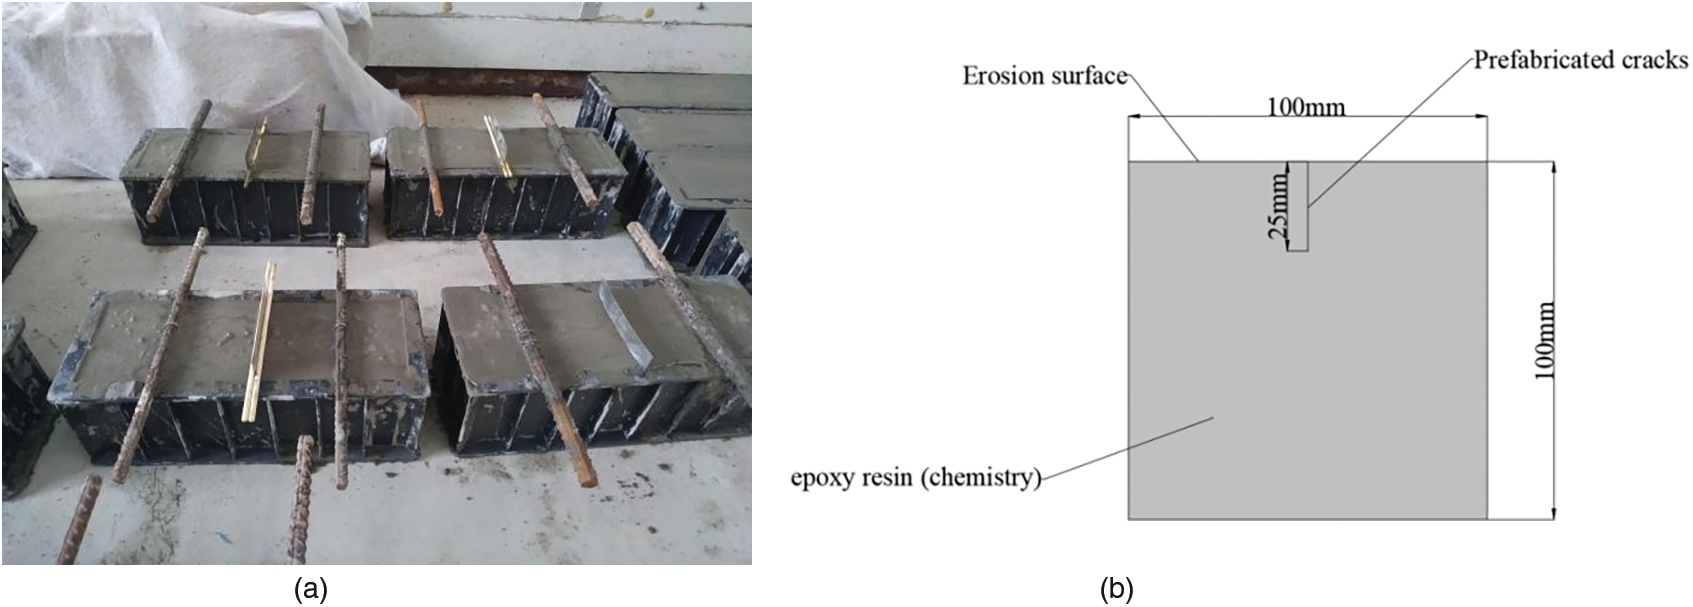
Figure 1: (a) Pre-buried reinforced specimen with artificial cracks; and (b) schematic diagram
The experiment consisted of four groups:
1. Group A consisted of specimens with C35 (cube compressive strength value ≧35 MPa) concrete without cracks.
2. Group B consisted of specimens with C35 concrete and a pre-fabricated crack width of 0.3 mm.
3. Group C consisted of specimens with C35 concrete and a pre-fabricated crack width of 0.6 mm.
4. Group D consisted of specimens with C50 (cube compressive strength value ≧50 MPa) concrete and a pre-fabricated crack width of 0.3 mm.
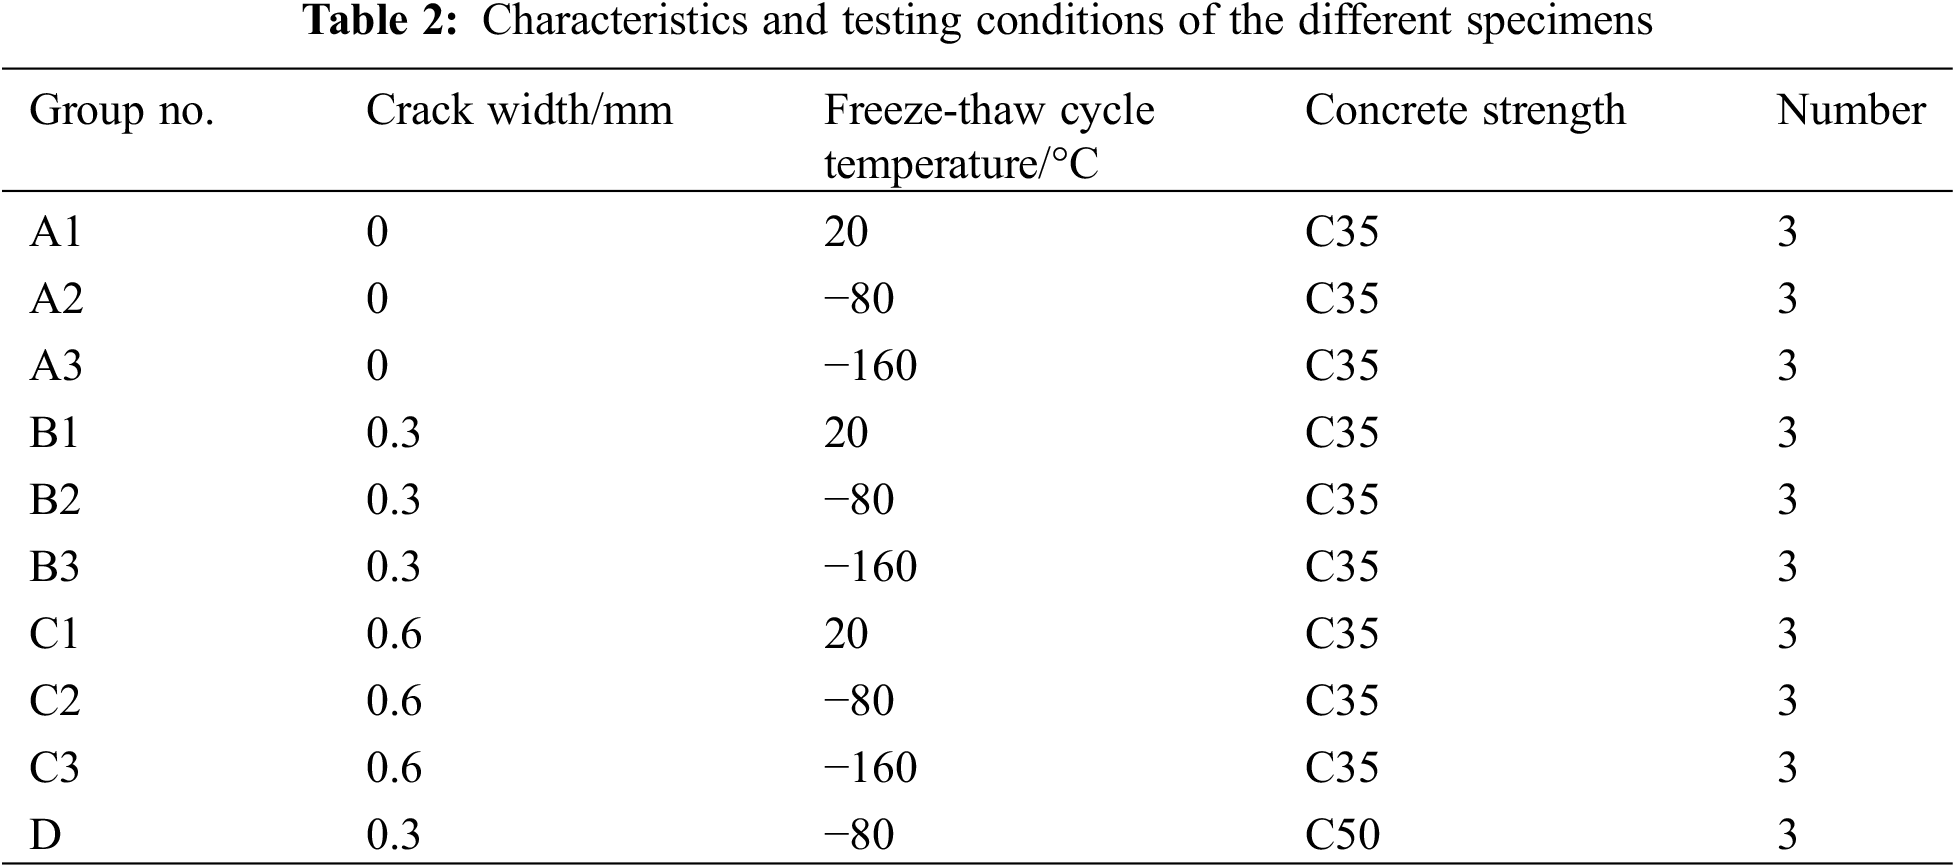
To capture the impact of the cryogenic cycles on specimen durability, the temperature gradient was set from ambient temperature to (i) −80°C and (ii) −160°C. The group number and their associated test conditions are detailed in Table 2. Each group contained three specimens, and the mean values of the test results for the three specimens were used for analysis.
2.3.1 Specimen Preparation and Maintenance
The stainless steel sheets were used to create pre-cracked specimens (Fig. 2). Two different sizes of high-strength and high-toughness sheets were produced with dimensions of 100 mm × 70 mm × 0.6 mm and 100 mm × 70 mm × 0.3 mm, respectively. During the manufacturing process, the sheet was inserted into the concrete, penetrating to a depth of 25 mm for subsequent hardening (Fig. 2). This insertion depth was determined in accordance with the fundamental rules for concrete protective cover thickness, representing the shortest distance to the surface of the steel bar. Then, once the concrete had initially set, different crack widths were obtained by inserting two different sized sheets.
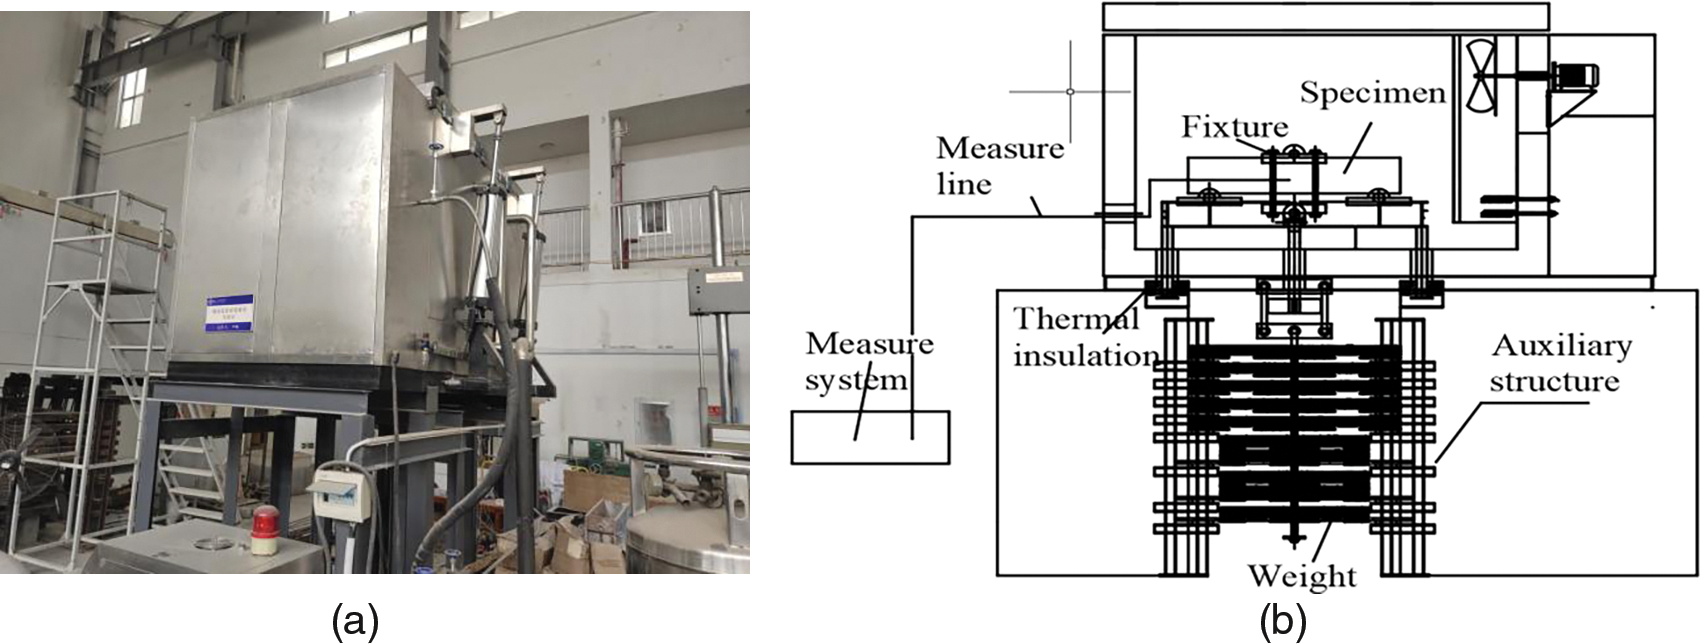
Figure 2: (a) Experimental setup and (b) schematic representation of the self-developed ultra-low temperature environment test chamber
2.3.2 Ultra-Low Temperature Freeze-Thaw Treatment
After the curing process, the specimens underwent cryogenic freeze-thaw testing, which was conducted using a self-developed ultra-low temperature environment test chamber (Fig. 2). The specimens were fixed in a freeze-thaw chamber and subjected to freeze-thaw cycles using liquid nitrogen. Under full-load operation, the air temperature inside the chamber was maintained (i) at 0°C, −80°C, or −160°C during the freezing period for 12 h, and (ii) within a range of 18°C–20°C during the thawing period for 24 h. Existing research has shown that the mechanical properties of concrete experience significant changes after 3–6 cryogenic cycles [19]. It can be expected that after the finite cryogenic freeze-thaw cycles, the internal structure of concrete will be sufficiently damaged, inevitably affecting the Cl− ion diffusion rate. We fixed the number of freeze-thaw cycles to 10 in this study.
After completion of the freeze-thaw cycles, to allow Cl− ions to erode the prefabricated crack surfaces, five surfaces except the cracked surfaces were coated with a 1-mm thick layer of a mixture of epoxy resin and hardener mixtures (Fig. 3). After 24 h, the samples were immersed in 5% NaCl solution for 60 d. The pH was measured weekly and 5% NaCl solution was added accordingly to stabilize the solution concentration.
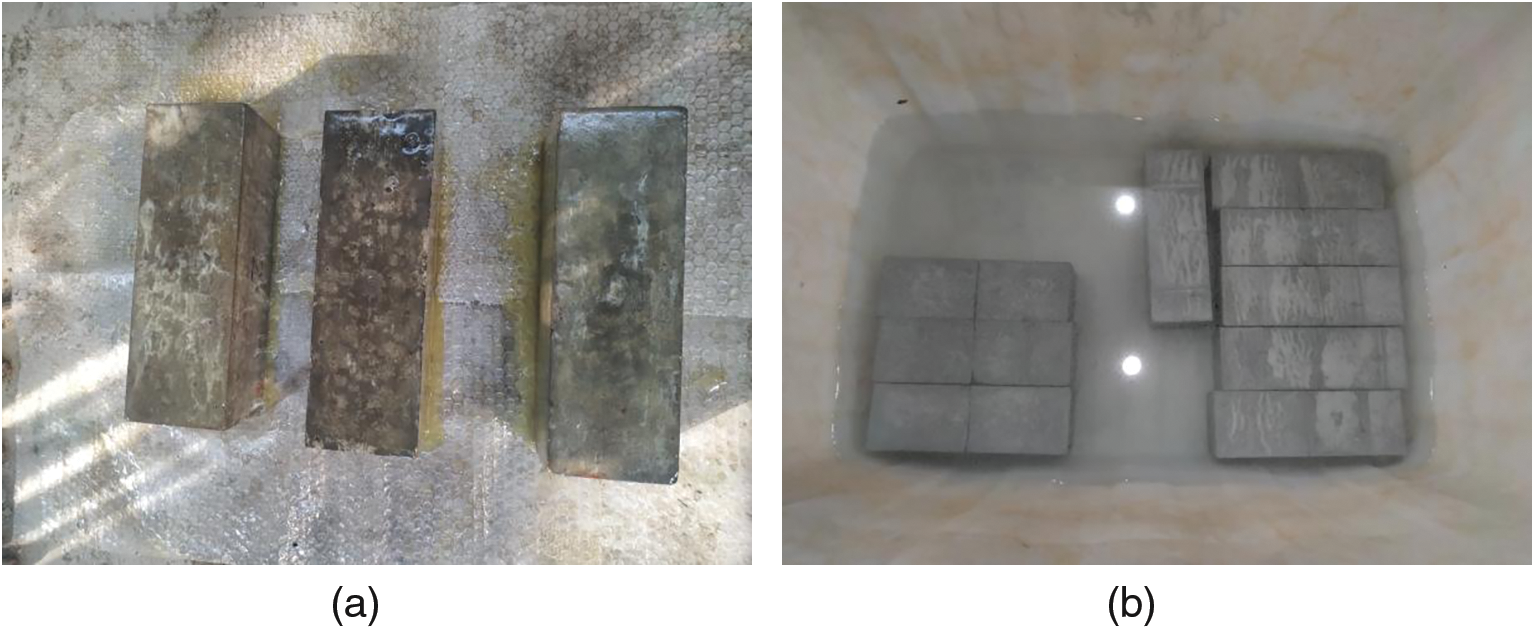
Figure 3: Cl– salt erosion of reinforced concrete specimens. (a) Application of epoxy resin adhesive; and (b) immersion of specimens in the 5% NaCl solution
After the soaking, the specimen was removed from the chlorine salt solution and placed in a well-ventilated area to air-dry for 48 h. Once completely dry, a small power source electric drill with an 8-mm diameter bit was employed for powder extraction (Fig. 4a). The powder was symmetrically extracted from locations at 20, 40, 60, 80, and 100 mm from the central crack (from both left and right sides), and from depths of 5, 10, 20, 30, and 45 mm. The extracted powder was sieved through a 0.2 mm screen. Subsequently, the powder samples from each point were stored in sealed bags and labeled.
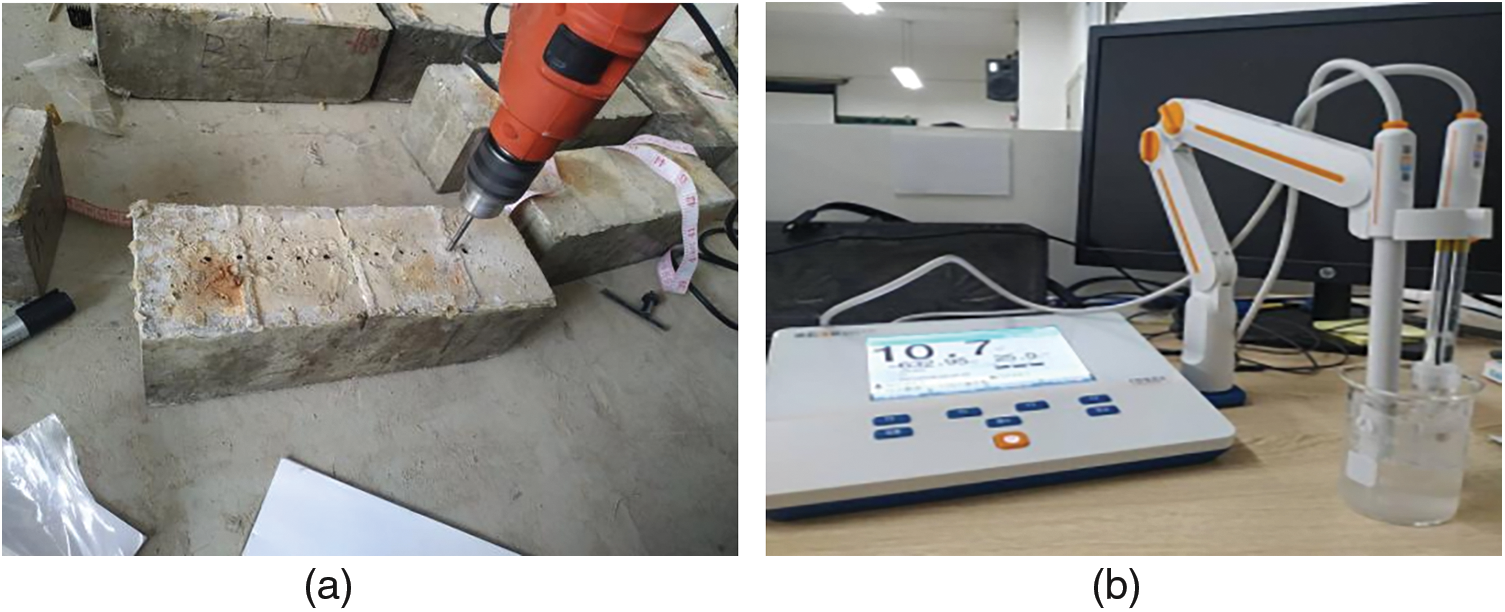
Figure 4: (a) Powder extraction and (b) free Cl− ion concentration measurement setups
2.3.5 Cl− Ion Measurement Methods
The solid-liquid extraction [20] and potential difference methods were used to measure the free Cl− concentration in the specimens. The PXSJ-216F ion analyzer (Shanghai Yidian Scientific Instrument Co., Ltd., China) was employed, along with a PCL-1 Cl− ion electrode and a reference electrode (Fig. 4b). The instrument operated under standard conditions, with a temperature range of 0°C–40°C and a relative humidity of ≤85%. For each sample, 5 g of the powder was completely dissolved in 100 ml of deionized water. The mixture was shaken using an oscillator for 10 min followed by a settling period of 24 h. The solution was then filtered and the filtrate was used to measure the free Cl− concentration. The Cl− concentration can be calculated as [21]. The flowchart of the experiment is shown in Fig. 5.
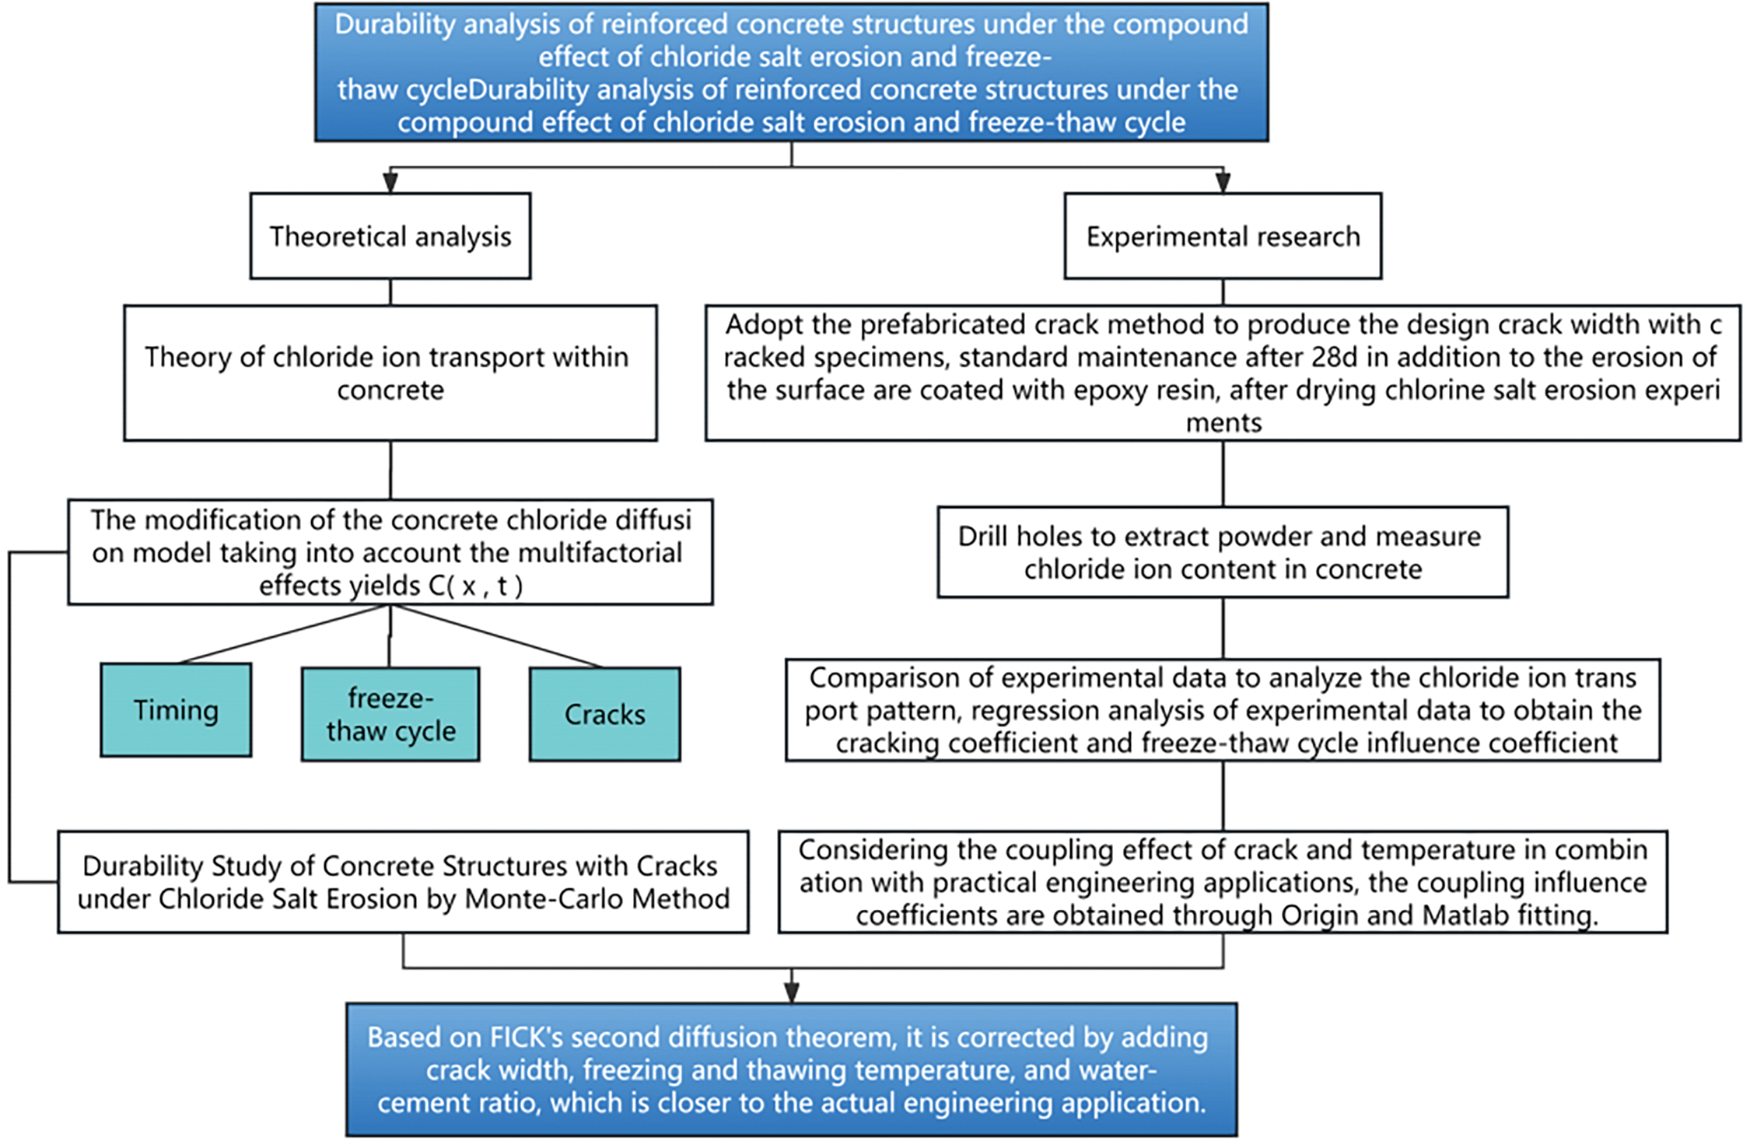
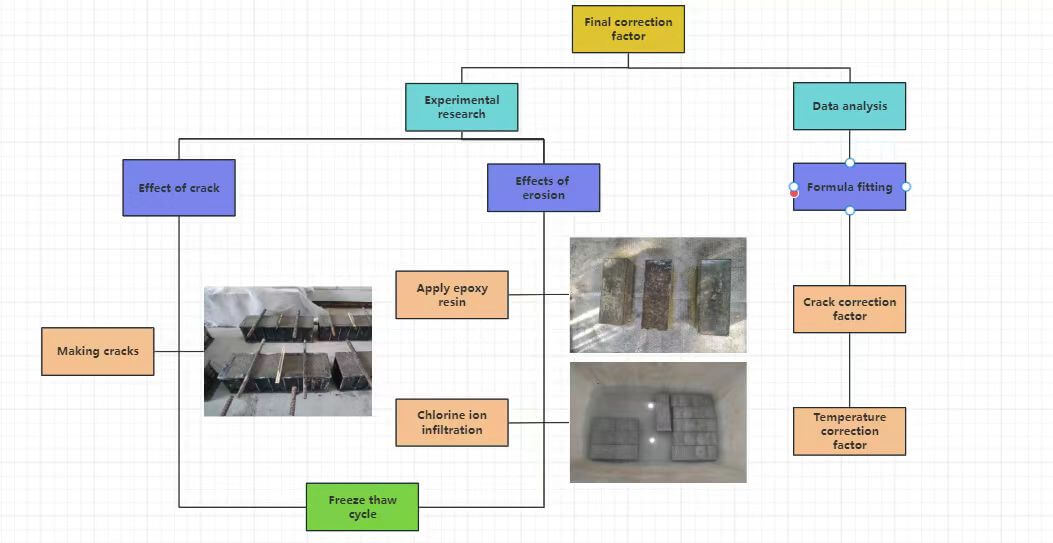
Figure 5: Reinforced concrete durability analysis roadmap
where PX is the negative logarithm of the molar concentration of the Cl− ions in the solution; M = 35.45 g/mol is the molar mass of the Cl− ions; w is the proportion of Cl− ions to the mass of concrete; V = 100 ml is the deionized water solution volume; and G = 5 g is the mass of the powdered sample.
3.1 Influence of Cracks on the Effect of Cl− Ion Penetration
3.1.1 Influence Range of Cracking
The Cl− ion concentration with respect to the crack depth for all test groups exhibited a consistent trend (Fig. 6). For the same depth, the Cl− concentration differences at various locations on the concrete specimen without artificial cracks were relatively insignificant (concentration ≤0.01%; Fig. 6a). However, as the transverse distance from the crack increased, the Cl− ion concentration decreased (Figs. 6b–6d). Taking group D with a prefabricated crack width of 0.3 mm as an example, we observed that at the depth of 5 mm from the specimen surface, the Cl− ion concentration at a distance of 20 mm from the crack was ~1.5 times that at 100 mm (Fig. 6b). This difference remained significant even at a depth of 45 mm. These findings indicated that cracks have a substantial influence on the Cl− ion diffusion within the specimen.

Figure 6: Cl− ion concentration profiles with respect to depth for specimens of group (a) A, (b) B, (c) C, and (d) D
To specifically investigate the impact of crack width on the Cl− ion erosion effect, three groups A1, B1, and C1, which were not exposed to the freeze-thaw cycles, were selected for analysis. The Cl− ion content curves for varying distances from the crack center were individually plotted (Fig. 7).
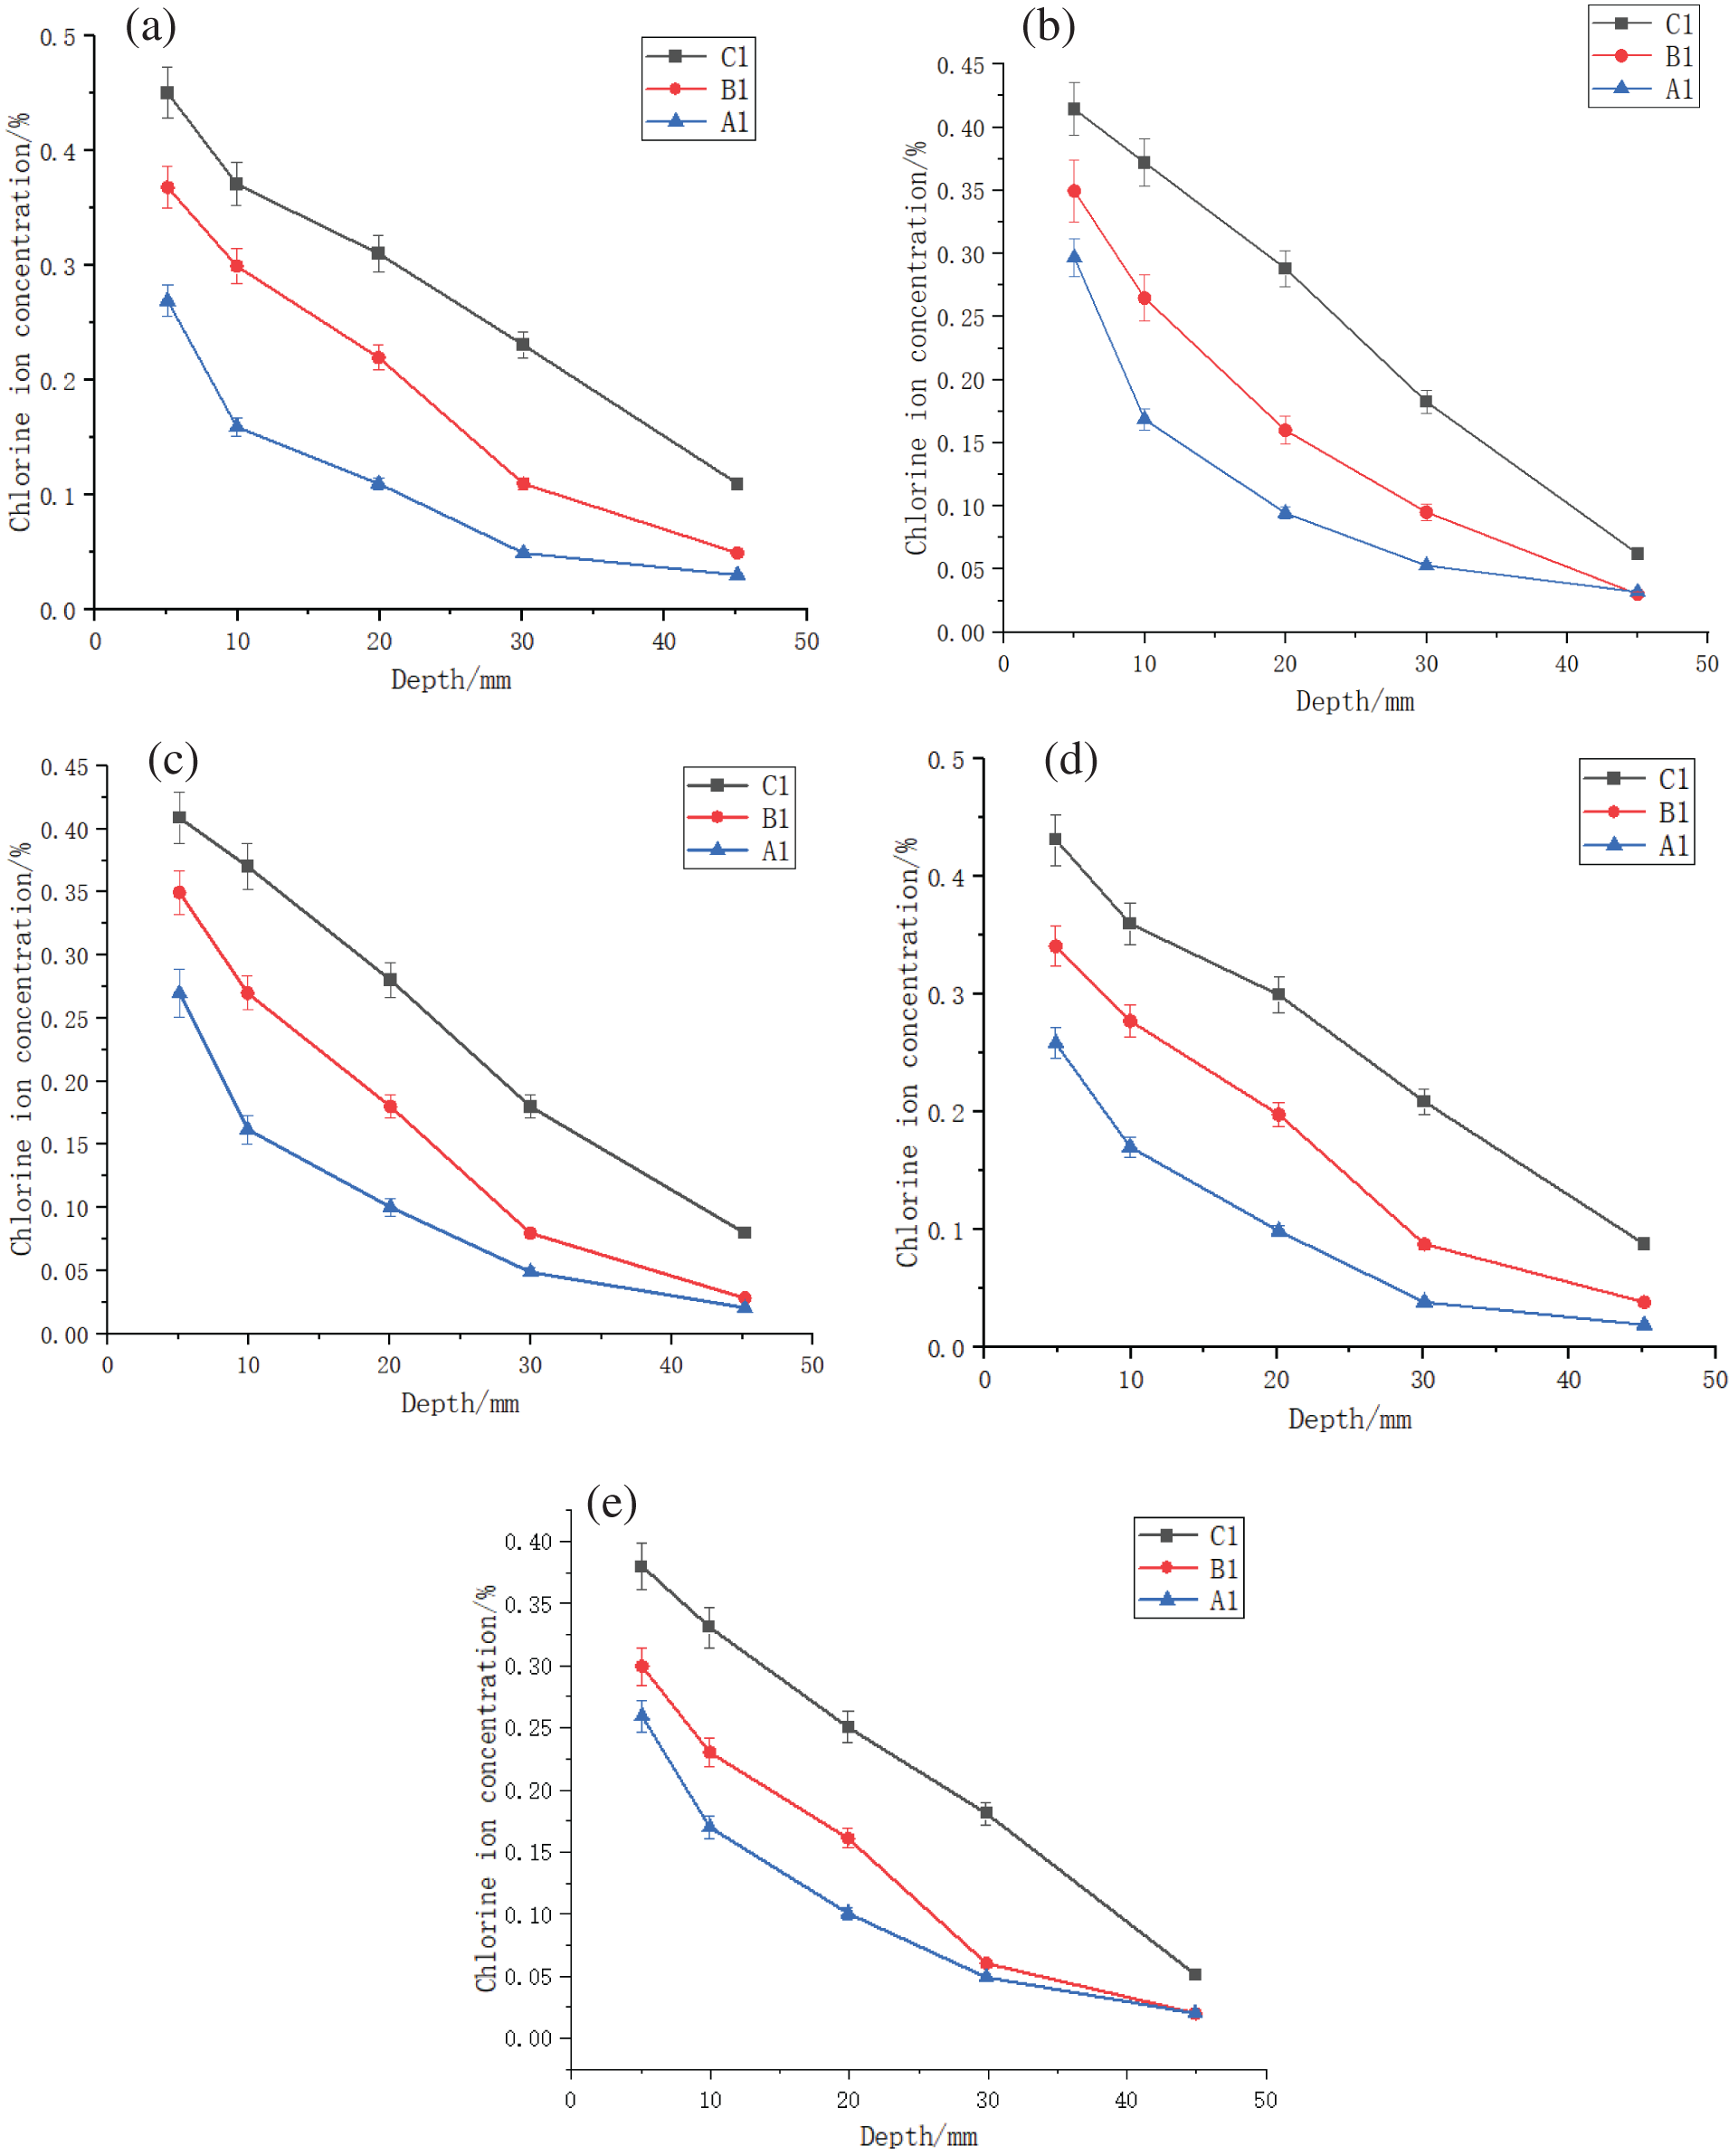
Figure 7: Cl− ion content at varying distances from the crack center for groups A1, B1, and C1. (a) 20 mm, (b) 40 mm, (c) 60 mm, (d) 80 mm, and (e) 100 mm
With the increasing crack width, the Cl− ion concentrations at a fixed location also increased (Fig. 7). For example, at a depth of 10 mm from the specimen surface and 20 mm away from cracking section, the Cl− ion concentration of the specimen with a crack width of 0.6 mm was ~2.5 and ~2 times that of specimens with crack widths of 0.3 and 0 mm, respectively (Fig. 7a).
The test results indicated that cracks have a substantial impact on both the Cl– ion concentration and diffusion. This underscores the importance of crack width as a critical factor for the Cl− ion erosion effect.
3.2 Effect of Freeze-Thaw Cycles on Cl− Ion Erosion Effect
To specifically investigate the impact of freeze-thaw cycles on the Cl– ion erosion effect, three groups without cracks, namely A1, A2, and A3, were selected for analysis. The Cl− ion content of the above three specimens at varying distances from the central crack was investigated (Fig. 8).
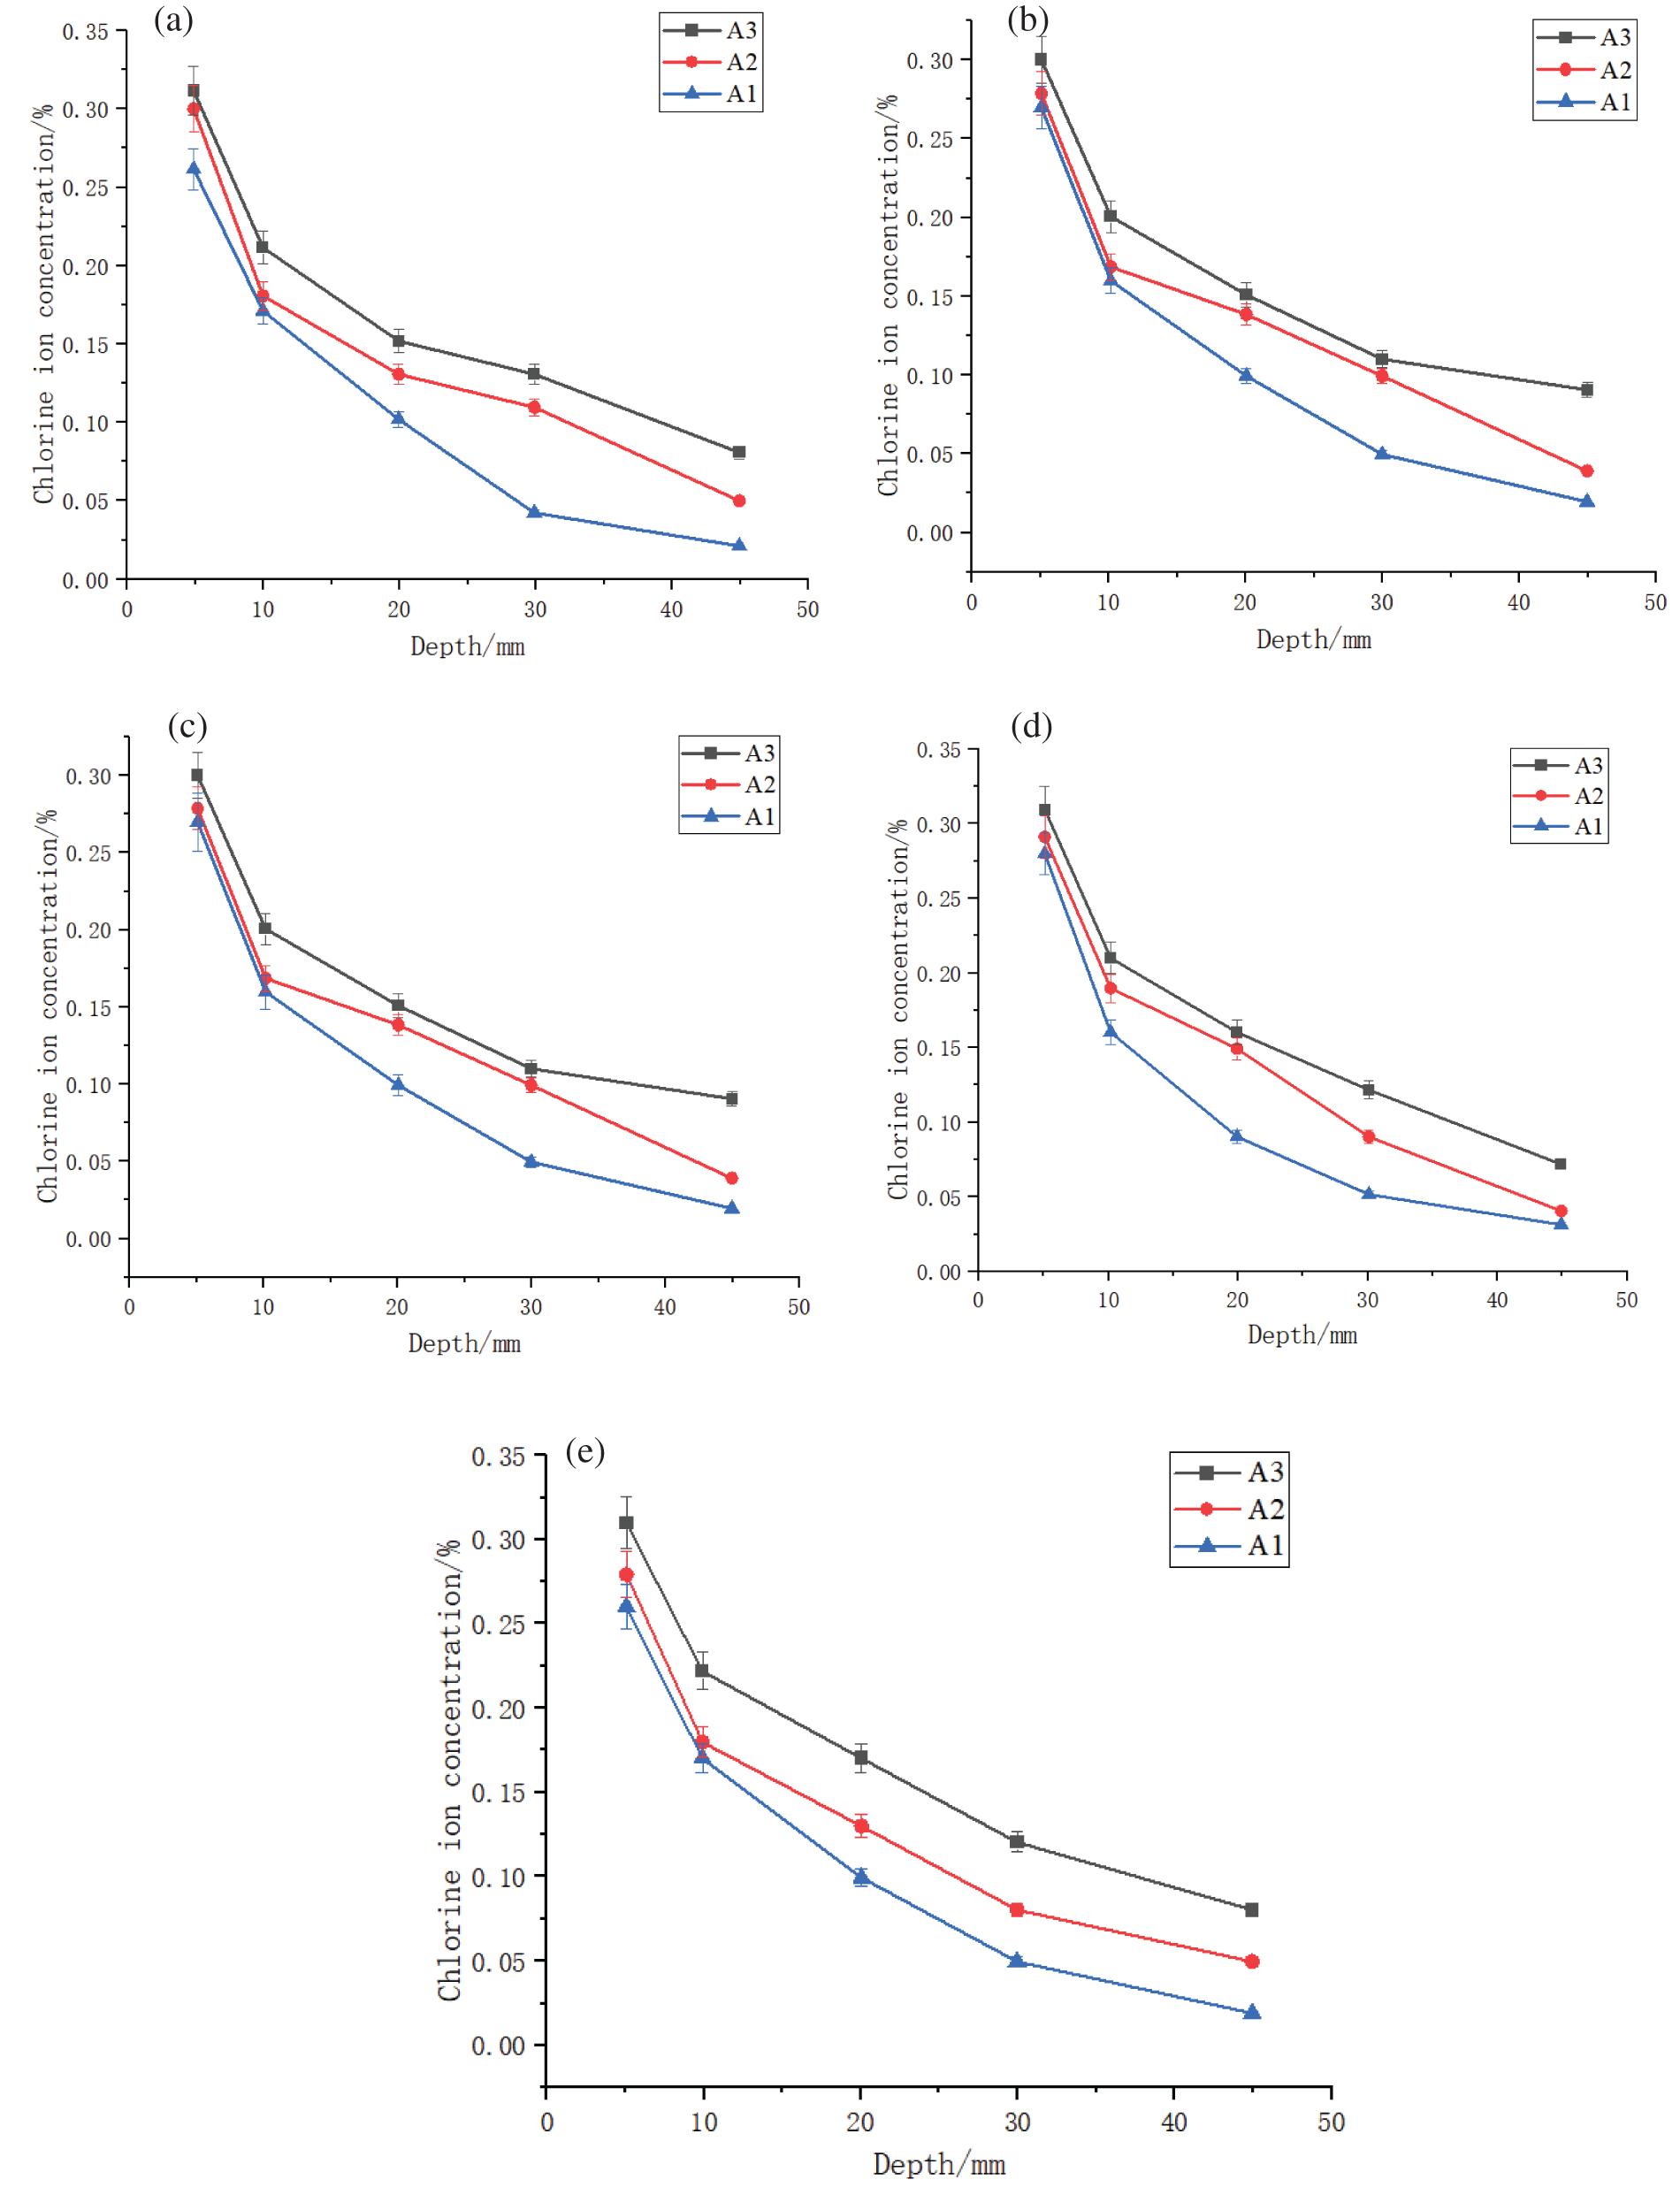
Figure 8: Cl− ion content curves for groups A1, A2, and A3 under different freeze-thaw cycle temperatures, at a distance of (a) 20 mm, (b) 40 mm, (c) 60 mm, (d) 80 mm, and (e) 100 mm from the crack
As the temperature decreases during the freeze-thaw process, the degree of Cl− ion erosion became more pronounced in comparison to the specimens that did not undergo the freeze-thaw cycles (Fig. 8). With the Cl− ion concentration at a depth of 5 mm at ambient temperature as the reference, the Cl− ion concentration was observed to increase by 0.03% and 0.05% for temperatures of −80°C and −160°C, respectively. This difference was pronounced at deeper locations within the specimen. The Cl− ion concentration at a depth of 45 mm in a specimen subjected to freeze-thaw cycles at −80°C and −160°C was 1.71 and 2.45 times higher than that at ambient temperature, respectively. As the temperature drops, the water in the pore structure of the concrete will freeze. Due to the higher density of ice than water, the original pore space cannot withstand the increased load, resulting in larger gaps and varying degrees of damage to the interior of the concrete. The more extreme the freeze-thaw cycle temperatures, the more significant this phenomenon, resulting in greater internal damage and higher Cl− ions diffusion rate.
3.3 Effect of Concrete Water-Cement Ratio on Cl− Ions
In specific practical applications, the water-cement ratio at room temperature has a certain impact on Cl− ion intrusion [22]. Therefore, Group D was designed as a control for this factor. In order to verify that the water-cement ratio affects the chloride ion transport rate at room temperature, a lower water-cement ratio implies the use of relatively less water and more cement during the pouring process, which leads to a higher density. This density contributes to better resistance to erosion and permeability of concrete. The effect of freeze-thaw cycles was tested by casting with different water-cement ratios. The experimental data for group B1 with C35 concrete and group D with C50 concrete were selected for calculation and analysis, and the Cl− ion concentration curves were plotted (Fig. 9).
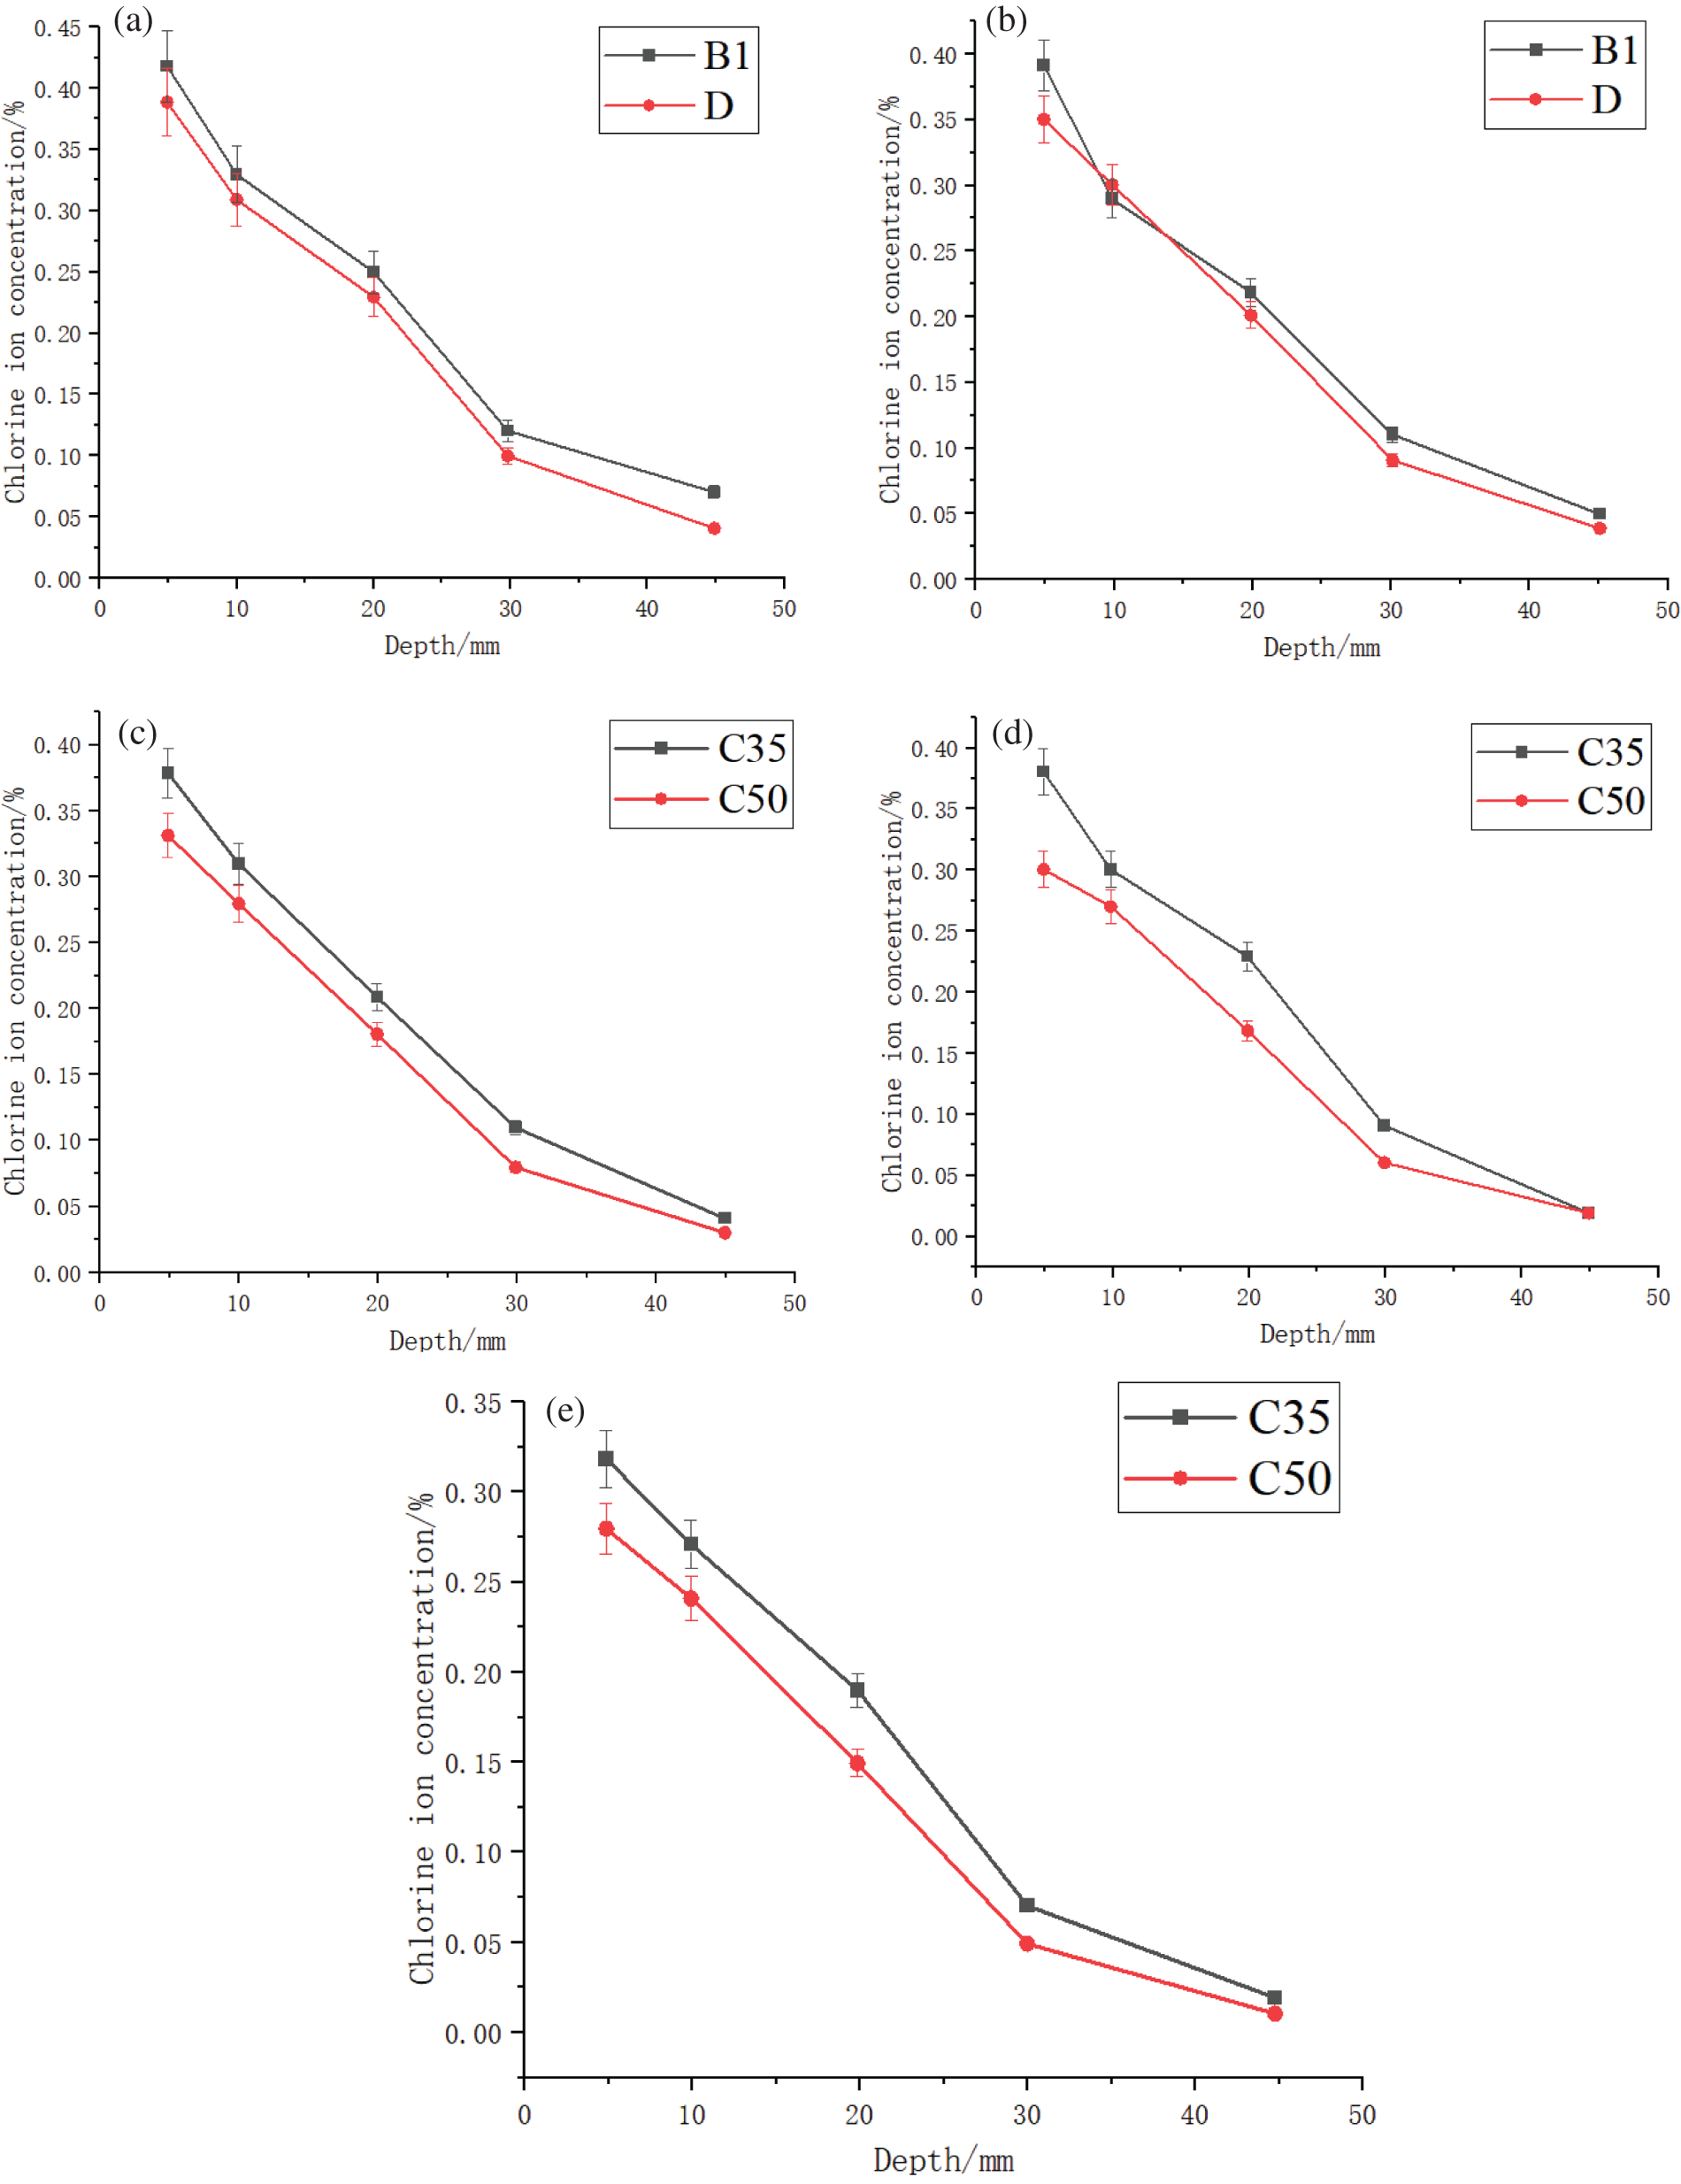
Figure 9: Cl− ion concentration curves for groups B1 (concrete C35) and D (concrete C50) at different water-cement ratios, for a distance of (a) 20 mm, (b) 40 mm, (c) 60 mm, (d) 80 mm, and (e) 100 mm from the crack
The C35 concrete exhibited a higher Cl− ion concentration compared to the C50 concrete (Fig. 9). For example, at a depth of 20–30 mm, the Cl− ion concentration in C35 concrete was 1.1 times that in C50 concrete (Fig. 9a). The primary reason for this effect is that concrete with a lower water-cement ratio has lower porosity and provides fewer channels for Cl− ion erosion. The above results highlighted the influence of concrete strength (water-cement ratio) on its resistance to Cl− ion diffusion; this was also reflected in the Cl− ion diffusion coefficient calculation. Our results can serve as a reference for producing high-strength concrete.
Additionally, it was evident that Cl− ion concentration decreased significantly with the increasing specimen depth. This implied that although concrete erosion is primarily a diffusion-based process, capillary action also acted as a complement. The lack of chloride ions erosion channels made it challenging for Cl− ions to continue diffusing through the concrete pores and eventually reach the interior.
4 Coupling Effect of Cracking and Freeze-Thaw Cycles
The relationship between diffusion flow and concentration gradient was established according to Fick’s first law of diffusion as
where J is the diffusion flux (kg/m2·s); C is the solution concentration (kg/m3); x is the diffusion distance; and D is the diffusion coefficient (m2/s).
However, Fick’s first law mainly addresses the steady-state diffusion problem, which states that the solution concentration distribution does not vary over time (C/t = 0). Diffusion occurs when the concentration gradient at different locations and the flux of the diffusing substances vary. The substance distribution changes with time as the concentration varies with time and location. Therefore, the concentration can be expressed as a function of both time and location, i.e., C(x, t). The diffusion flux is a function of position and time, i.e., J(x, t), over a certain time interval of dt. The non-stationary diffusion process in solutions is shown in Fig. 10. It was found that the diffusion rod traps a minute volume element, Adx, where A is the area and dx is an infinitesimal distance.
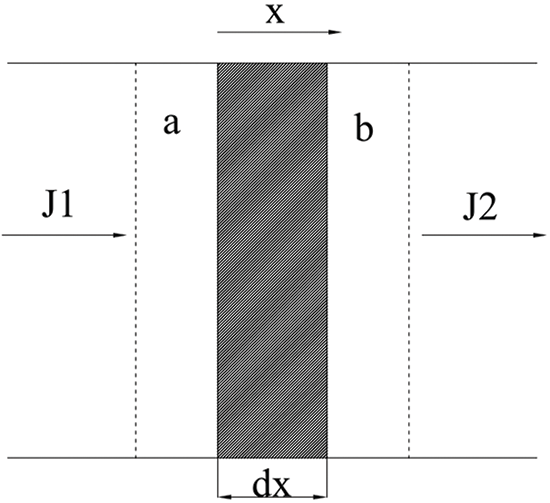
Figure 10: Non-stationary diffusion process in solutions. Here, a and b stand for two separate planar intervals; dx is the infinitesimal interface distance connecting a and b; and J1 and J2 are the inflow and outflow fluxes of the solution, respectively
When the concrete is not saturated, the Cl− ions are transported prominently through convection rather than diffusion. However, over the long term, the impact of Cl− diffusion (from high- to low-concentration regions) on concrete plays a more important role. The process can be categorized into steady state diffusion and unsteady state diffusion. The diffusion of chloride ions in concrete is considered to be in a steady state when the chloride ions are constant with time and other variables such as chloride ion concentration, and the inflow and outflow per unit time and unit area remain constant [23]. However, the transport process of Cl− ions inside concrete is extremely complex, affected by time and the different environments and states. Concrete is a highly alkaline porous medium that is more susceptible to chemical reactions under acidic conditions. Based on this property, Chen et al. modeled the coupled liquid-solid-chemical mass transfer of concrete with relevant combinations and microstructural evolutions, which includes the effects of chemical reactions on a series of parameters, such as concrete porosity, diffusion coefficient, and ion adsorption capacity [24]. The calculations incorporate chemical thermodynamic equilibrium, combinatorial and microstructural evolution. They comprehensively modeled the coupled mass transport by including partial differential equation solutions, control systems, and chemical equilibria, validated by a mature database. They further demonstrated that special cementitious materials enhance chlorine resistance and slag mixtures reduce porosity. Therefore, the Cl− transport inside concrete is regarded as non-steady-state diffusion. Suppose that the solution is infinitely diffused from the starting boundary to a particular distance, then its flux and concentration are both functions of space and time, and the entire spatial system is in an unstable state (Fig. 8). By conserving mass per unit time, we can say that the material storage rate can be computed by subtracting the material input and output rates; this can be further expressed as
where R is the accumulation of the diffusing substance in the volume element.
For
thus
Substituting
Concrete chloride erosion is a form of non-smooth diffusion, which has a concentration relationship derived from Fick’s second law as [25]
where erf is the error function; and Cs is the initial Cl− ion concentration at a specified location, C0 is the current chloride ion concentration at the specified location.
Eq. (7) can be applied to uncracked concrete under ambient conditions. However, in practical engineering scenarios, certain structures such as LNG tanks may need to operate under conditions involving both cracking and freeze-thaw cycles. Building upon Fick’s second law of diffusion, the main factors such as freezing/thawing temperatures and the crack width were selected to modify the model for calculating Cl− diffusion in concrete as
where C0 is the current chloride ion concentration at the specified location; and Cs is the initial Cl− ion concentration at a specified location, erf is the error function, m is the attenuation factor, D0 is the diffusion coefficient, t0 is the initial time, t is the erosion time.
4.1 Best-Fit Model for the Coefficient of Influence of Cracks in Concrete
To analyze the influence of concrete cracks on Cl− diffusion, groups A1, B1, and C1 with crack widths of 0, 0.3, and 0.6 mm, respectively, were chosen. A quadratic polynomial was employed for numerical fitting based on the Cl− ion concentration test results of A1, B1, and C1 at different specimen depths. The best-fit curve (Fig. 11) and fitting model expression were obtained for the relationship between Cl− ion concentration against specimen depth as
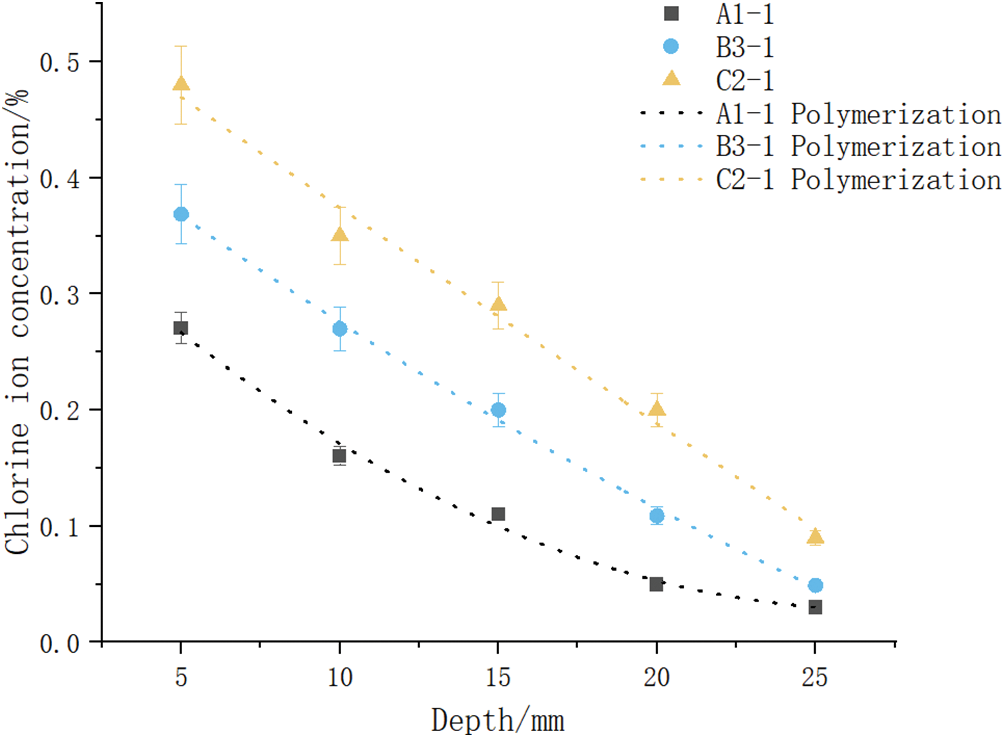
Figure 11: Cl− ion concentration best-fit curve against depth for groups A1, B1, and C1
The surface Cl− ion concentration, CS, was calculated for x = 0. The CS values were substituted into Eq. (7) to calculate the equivalent apparent Cl− ion diffusion coefficient, Di, at different depths. The three specimens, A1, B1, and C1, were chosen to determine the concrete degradation coefficient, f(w), in accordance with the relation, D(w) = D0f(w) (Table 3).
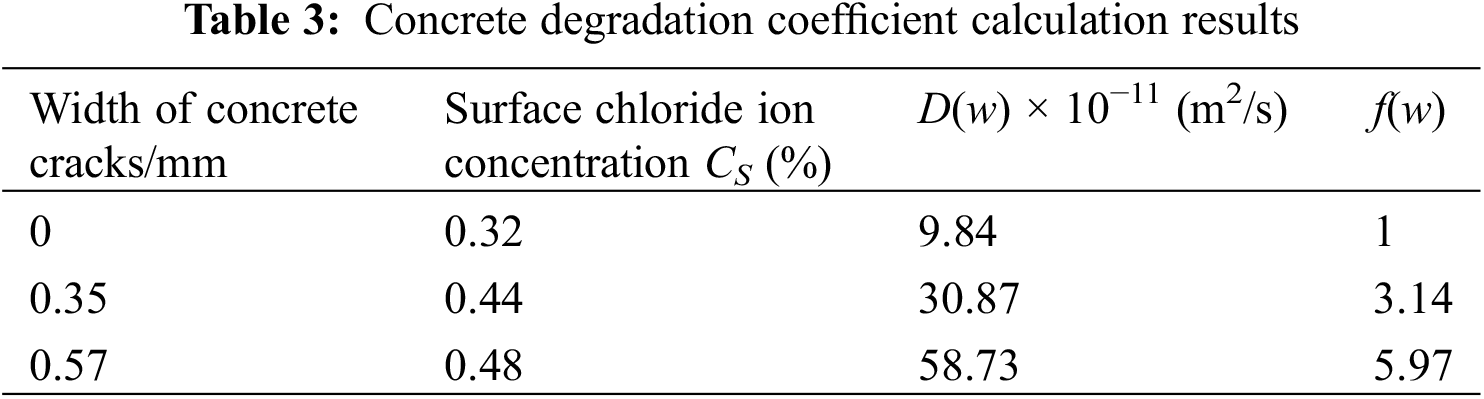
We observed that with the increasing crack width, w, the degradation coefficient, f(w), also increased (Table 4). For numerical fitting, the computed results were chosen as quadratic polynomials and the following best-fit model expression was obtained
4.2 Best-Fit Model for the Coefficient of Influence of Freeze-Thaw Cycles in Concrete
To analyze the effect of freeze-thaw cycle temperatures on Cl− ion diffusion in concrete at different depths, we chose A1 at ambient temperature, along with A2 and A3 with freezing temperatures of −80°C and −160°C, respectively (Fig. 12).
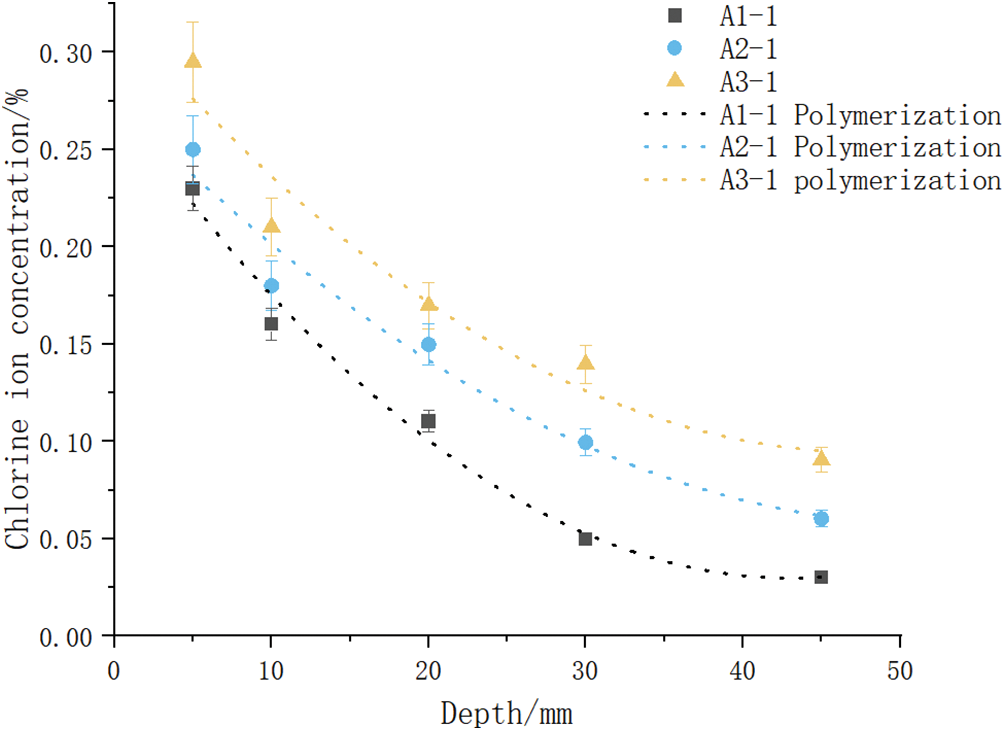
Figure 12: Cl− ion concentration best-fit curve against depth for groups A1, A2, and A3
The best-fit models for Cl− ion concentration against depth to analyze the influence of freeze-thaw cycles were obtained as
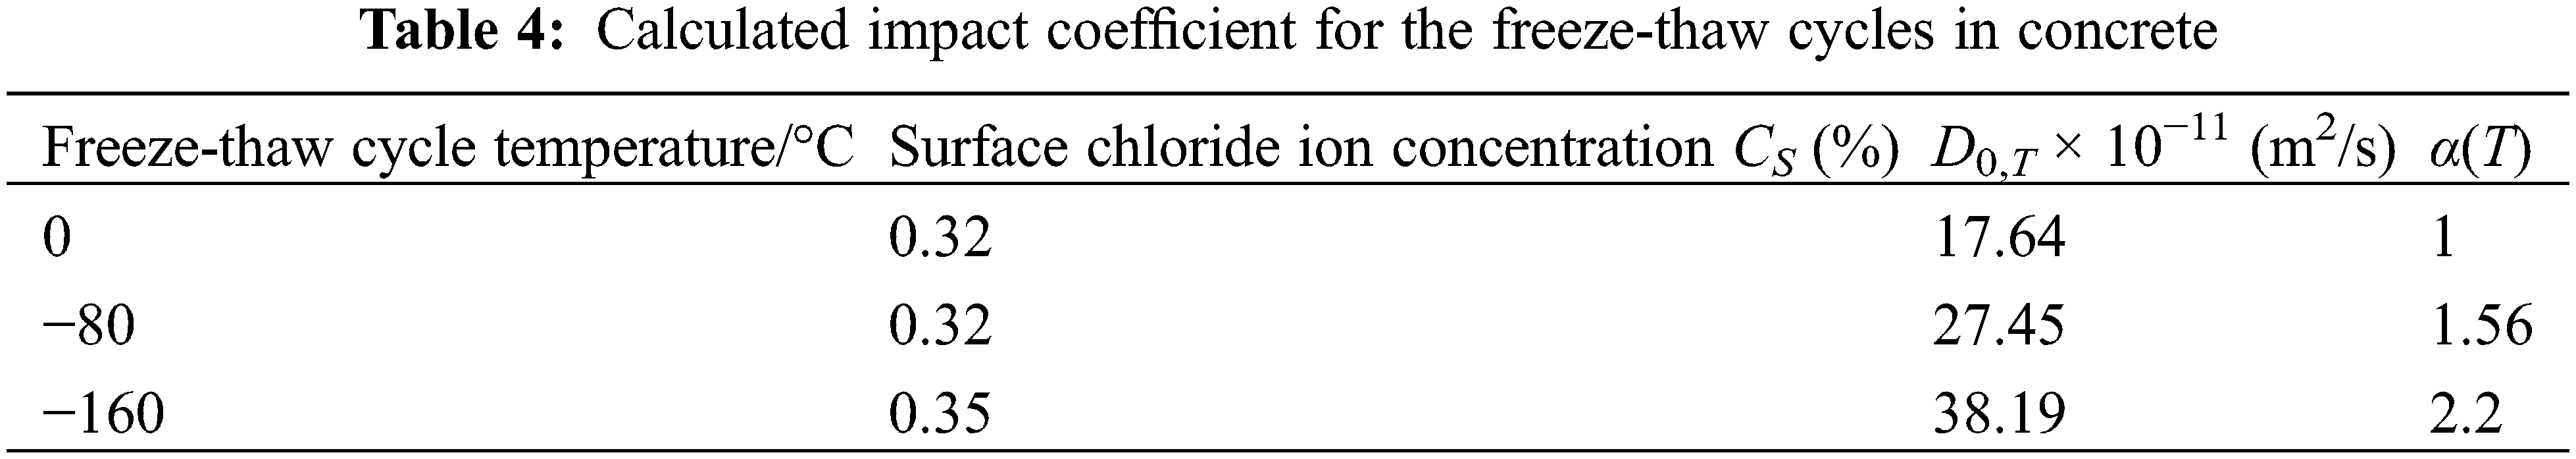
When the initial Cl− ion concentration is zero times into Eq. (7), the CS value is calculated by taking the average of three of the values of the experimental data to calculate the Di value for different sample depths. Groups A1, A2, and A3 were selected to calculate concrete using the D0, T = D0 × α(T) relationship (Table 4). In the fitting process, the freeze-thaw temperature variable was taken as 0 when no freeze-thaw was involved at room temperature was considered.
It was observed that for the rising temperature, T, the impact of the freeze-thaw cycle, α(T), reduced (Table 4). The computed results were numerically fitted using a quadratic polynomial, and the best-fit model expression for the concrete freeze-thaw cycle temperature and its impact coefficient was produced as
Certain coastal concrete structures (e.g., LNG storage tanks) in close proximity to polar regions need to consider the effects of cracking and low-temperature cycles on the Cl− ion erosion effect. Although LNG storage tanks are typically designed to be crack-free, non-penetrating surface cracks may develop over time, which can aggravate the corrosion of steel bars. Moreover, the cryogenic freeze-thaw cycle may exacerbate the development of micro-cracks to macro-cracks. It is necessary to analyze the Cl− ion erosion of cracked concrete under cryogenic freeze-thaw cycles to improve practical engineering designs.
By combining the results for all groups (A–C), the Cl− content for different crack depths and freeze-thaw temperatures at varying lateral distances from the cracks were studied (Fig. 13).

Figure 13: Cl− ion concentrations for different coupling effects at a distance of (a) 20 mm, (b) 40 mm, (c) 60 mm, (d) 80 mm, and (e) 100 mm from the crack
Eqs. (13) and (17) reflect the impact of cracks and cryogenic freeze-thaw cycles as independent factors, respectively, on the Cl− ion diffusion coefficient. However, in practical applications, freeze-thaw cycles and concrete cracks may coexist. Therefore, it is essential to ascertain if there exists a coupling influence between these factors. Considering the example of group B2 (crack depth = 0.3 mm; freeze-thaw temperature range = 25°C to −80°C), two sets of data with the same influencing factors were fitted to the average value (Fig. 14). The corresponding degradation coefficient, f(w), and the freeze-thaw cycle impact coefficient, α(T), were calculated by substituting the test condition parameters into Eqs. (13) and (17), respectively.

Figure 14: Cl− ion concentration against depth for group B2
As an example, for a depth of 5 mm, the CS value was determined for x = 0. Substituting into Eqs. (14) and (18), respectively. The values CS = 0.5149, f(w) = 1.7082, and α(T) = 1.752 were substituted into Eq. (9) to produce a C(x) value of 0.38 considering the initial Cl− ion concentration to be 0. The corresponding test value was, however, 0.42, indicating a discrepancy outside the acceptable error range. Thus, it was speculated that cracking and the freeze-thaw cycles have a positive coupling impact on the Cl− ion erosion effect.
For groups B2 (Fig. 15) and C3, we discovered that the actual Cl− ion concentration differed from the value calculated from Eq. (9). Thus, we explore here a correction factor, Re (x), by considering coupling effects.

Figure 15: Cl− ion concentration against depth for group B2
where C0 is the current chloride ion concentration at the specified location; and Cs is the initial Cl− ion concentration at a specified location, erf is the error function, m is the attenuation factor, D0 is the diffusion coefficient, t0 is the initial time, t is the erosion time.
To compute Re(x), a functional expression function for Z is established as
Using Eqs. (20) and (9) can be simplified as
For each depth value, the Z value was computed using Eq. (20). The experimental data in Eq. (21) were used as the test values.
Calculated value:
Actual value:
Comparison of calculated and experimental Z values at different depths for the experimental groups, B2, B3, C2, and C3, are shown in Fig. 16.

Figure 16: Calculated and experimental values for Z at different depths for groups B2, B3, C2, and C3
The correction coefficient is then obtained as:
According to previous studies, freezing and thawing cause various microcracks and micropores in concrete, accelerating the erosion effect of Cl− ions and resulting in irreversible structural damage. The thickness of the concrete protective layer in practical application is >20–30 mm; this value is closer to the mean value of the five different depths chosen in this study; based on which the Re(x) was recommended. Finally, considering the coupling effect of cracks and cryogenic freeze-thaw cycles on the Cl− ion erosion effect, we obtained Re = 11.04.
4.4 Validation of the Optimized Formula
The accuracy of the fitted and optimized relations was verified using experimental data from the literature [26,27] (Fig. 17). With increasing specimen depth, the difference between the predicted and actual values of Cl− ion concentration increased. This error may be attributed to the conservative methodology used to calculate the different values and the variation in the Cl− binding coefficient with depth.
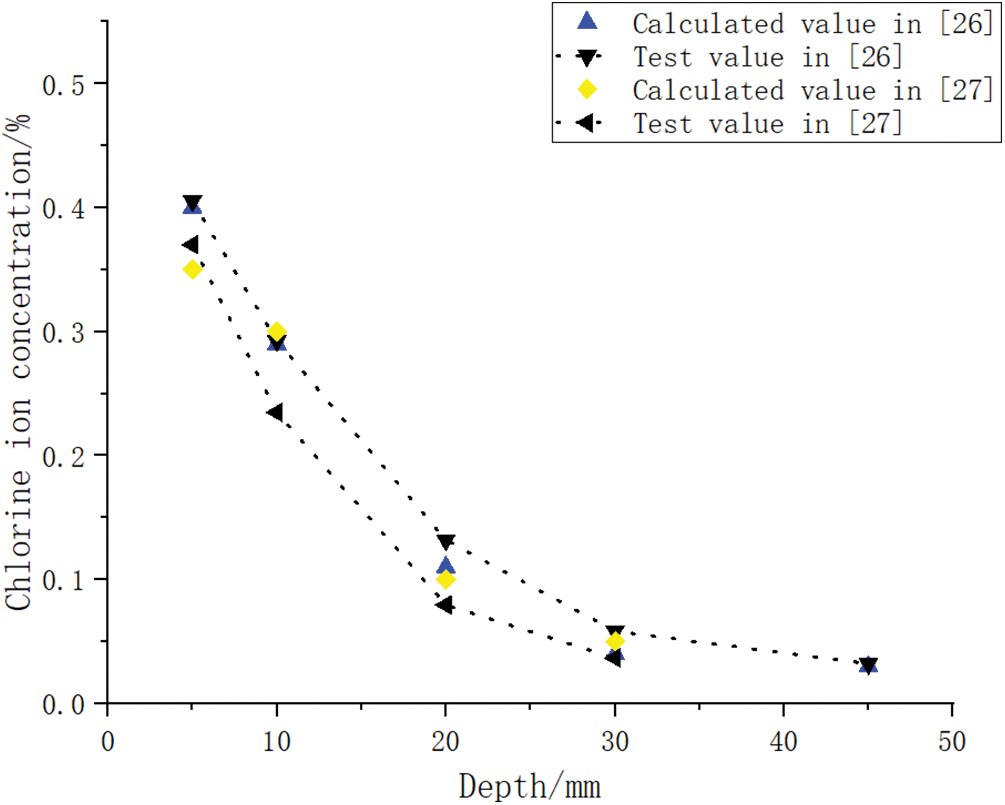
Figure 17: Comparison of Cl− ion concentration calculated and test data
4.5 Practical Engineering Application Design and Restoration Impacts
The standard requirements for Cl− ion content in concrete vary with different regions and countries, and the Chinese national standard, i.e., GB/T 50080-2016 Code for Durability Design of Concrete was selected for this particular study. This standard provides the allowed limits for Cl− ion concentration according to the structural use conditions and the concrete strength grade. The conclusions of this study can be applied mainly to the durability prediction of marine concrete structures. In marine regions, the Cl− ion content in concrete should be maintained at ≤0.3%. In coastal settings, the concrete temperature on the exterior surface of LNG storage tanks can be higher than the internal temperature of −196°C. Therefore, we fixed the external surface temperature as −150°C for our scenario. According to the design specification, the concrete structure service life should be 50 years and the thickness of the protective layer should be 30 mm. In light of these conditions, we speculated that the crack width may exceed 0.3 mm. Therefore, we employed a crack width of 0.3 mm for illustrative purposes. Plugging the aforementioned data into Eq. (19) yielded a Cl− concentration of C(x = 30 mm, t = 50 y) = 0.3302%, which only slightly surpassed the 0.3% threshold.
In addition to the preliminary design, timely maintenance is also particularly important as the increase in crack width directly increases the Cl− ion diffusion coefficient. By substituting the permissible crack width of 0.2 mm in Eq. (19), we obtained C′(x = 30 mm, t = 50 y) = 0.2853%, which meets the specification requirements.
In general, post maintenance of concrete structures should focus on crack repair and freeze-thaw temperature control. But in practice, as the temperature of the working environment is difficult to control, timely repair and crack prevention in the maintenance process is required to extend the structure service life and improve durability.
According to the comparative analysis of Cl− ion concentration under varying operating conditions, the Cl− ion diffusion equation for marine concrete structures, based on Fick’s second law, was modified by introducing correction factors in consideration of freeze-thaw temperature, crack width, and their coupling effect. The primary conclusions of this study are as follows:
1. Based on the effect of crack width, we obtained the degradation coefficient, f(w), expressed by a quadratic fitting model, f(w) = 3.85477w2 + 5.96394w + 1, which vividly presents the complex relationship between crack width and Cl− ion diffusion.
2. Based on the effect of cryogenic freeze-thaw cycles, we obtained the impact factor, α(T), expressed as α(T) = 0.000004T2 − 0.00663T + 1, which provides insight into the relationship between freeze-thaw temperature and Cl− ion diffusion.
3. Based on the coupling effects of cracking and the cryogenic freeze-thaw cycles for Cl− ion diffusion, we obtained the correction factor, Re(x) = (3453 + 97286x)/(23723 + 6304x). In practice, A value of 11.04 is recommended for Re(x) in practical engineering applications. The modified Cl− ion diffusion equation provides a valuable reference for concrete structure durability designs and practical applications, such as marine LNG storage tanks.
Acknowledgement: None.
Funding Statement: This research was financially supported by the Key Laboratory of Intelligent Health Perception and Lakes, Ministry of Education, Hubei University of Technology (No. 2020EJB004), National Natural Science Foundation of China (No. 51508171), Natural Science Foundation of Hubei Province (No. 2020CFB860).
Author Contributions: Yang Li: Investigation, Data curation, Methodology, Formal analysis, Writing—original draft. Sibo Jiang: Investigation, Data curation, Writing—original draft & editing. Ruixin Lan: Data collation.
Availability of Data and Materials: The data and materials are available upon request.
Conflicts of Interest: The authors declare that they have no conflicts of interest to report regarding the present study.
References
1. Wang, X. C., Li, M. Z., Li, C. F. (2006). A review of the current status of research on durability of concrete structures. Concrete, 3(2), 31–33 (In Chinese). [Google Scholar]
2. Li, J. Y., Cao, J. G., Xu, W. Y., Lin, L., Guan, Y. S. (1999). Study on the damage mechanism of concrete by freezing and thawing. Journal of Water Resources, 5(1), 42–50 (In Chinese). [Google Scholar]
3. Jiang, Z. W., He, B., Zhu, X. P., Ren, Q., Zhang, Y. (2020). State-of-the-art review on properties evolution and deterioration mechanism of concrete at cryogenic temperature. Construction and Building Materials, 257(10), 119456. https://doi.org/10.1016/j.conbuildmat.2020.119456 [Google Scholar] [CrossRef]
4. Chen, Y. Q., Chen, M. Y., Chen, R. P., Kang, X. (2023). Stray current induced ITZ effect on chloride transport in concrete. Construction and Building Materials, 409(1), 37–50. https://doi.org/10.1016/j.conbuildmat.2023.133759 [Google Scholar] [CrossRef]
5. He, S. Q. (2004). Experimental study on durability performance of reinforced concrete members under chloride ion environment (Ph.D. Thesis), pp. 53–55. Dalian University of Technology, China. [Google Scholar]
6. Chung, C. W., Shon, C. S., Kim, Y. S. (2020). Chloride ion diffusivity of fly ash and silica fume concretes exposed to freeze-thaw cycles. Construction and Building Materials, 9(24), 1739–1745. [Google Scholar]
7. Ma, Z. M., Miao, L., Qin, T., Liang, C. F., Duan, Z. H. (2020). Chloride permeability of recycled aggregate concrete under the coupling effect of freezing-thawing, elevated temperature or mechanical damage—ScienceDirect. Construction and Building Materials, 237, 25–31. [Google Scholar]
8. Liu, X. G., Yan, Z. W., Wang, D. J., Zhao, R., Niu, D. T. (2011). Corrosion cracking behavior of reinforced concrete under freeze-thaw cycles. Journal of Building Engineering, 64, 1022–1027. [Google Scholar]
9. Stern, M., Geary, A. L. (2019). Electrochemical polarization: I. A theoretical analysis of the shape of polarization curves. Journal of the Electrochemical Society, 104, 56. [Google Scholar]
10. Peng, Z., Folker, H. W., Michael, V., Harald, S. M., Zhao, T. J. (2017). Influence of freeze-thaw cycles on capillary absorption and chloride penetration into concrete. Cement and Concrete Research, 100, 60–67. [Google Scholar]
11. Wang, L., Ueda, T. (2014). Mesoscale modeling of chloride penetration in unsaturated concrete damaged by freeze-thaw cycling. Journal of Materials in Civil Engineering, 26(15), 955–965. https://doi.org/10.1061/(ASCE)MT.1943-5533.0000901 [Google Scholar] [CrossRef]
12. Xu, G., Wei, J. (2006). Effects of chloride salt species and freeze-thaw on interface shear behavior between ordinary concrete and self-compacting concrete. Structures, 56, 29–34. [Google Scholar]
13. Chen, M. Y., Chen, R. P., Chen, Y. Q., Ma, X. Y., Kang, X. (2023). Stray current induced chloride ion transport and corrosion characteristics of cracked ultra-high performance concrete. Construction and Building Materials, 398(23–27), 132536. [Google Scholar]
14. Li, J. P., Li, L., Li, L., Xie, F. (2019). Analysis of chloride ion diffusion in concrete structures under crack non-through condition. Journal of Tongji University (Natural Science Edition), 47, 1260–1267. [Google Scholar]
15. Kwon, S. J., Na, U. J., Park, S. S., Jung, S. H. (2009). Service life prediction of concrete wharves with early-aged crack: Probabilistic approach for chloride diffusion. Structural Safety, 31(1), 75–83. https://doi.org/10.1016/j.strusafe.2008.03.004 [Google Scholar] [CrossRef]
16. Lu, Z. H., Zhao, Y. G., Yu, Z. W., Ding, F. X. (2011). Probabilistic evaluation of initiation time in RC bridge beams with load-induced cracks exposed to de-icing salts. Cement and Concrete Research, 41(3), 365–372. https://doi.org/10.1016/j.cemconres.2010.12.003 [Google Scholar] [CrossRef]
17. Shao, W., Li, J. (2014). Service life prediction of cracked RC pipe piles exposed to marine environments. Construction & Building Materials, 64(1), 301–307. https://doi.org/10.1016/j.conbuildmat.2014.04.094 [Google Scholar] [CrossRef]
18. GB/T 50082-2009 (2019). Standard for long-term performance and durability test methods for ordinary concrete. Beijing, China: China Architecture & Building Press. [Google Scholar]
19. JGJ/T 322-2013 (2013). Technical specification for detection of chloride ion content in concrete. Beijing, China: China Construction Industry Press. [Google Scholar]
20. Su, L., Niu, D. T., Huang, D. G., Fu, Q. (2022). Chloride diffusion properties of basalt/polypropylene fiber reinforced concrete in marine environment. Journal of Building Materials, 25(1), 44–53. [Google Scholar]
21. GB/T 50080-2016 (2016). Standard for design of concrete structure durability. Beijing, China: China Architecture & Building Press. [Google Scholar]
22. Zhang, Y. (2008). Research on the transport mechanism of chloride ions in concrete (Ph.D. Thesis). Zhejiang University, China. [Google Scholar]
23. Chen, Y. Q., Chen, M. Y., Chen, R. P., Kang, X. (2023). A liquid-solid-chemical coupled mass transport model for concrete considering phase assemblages and microstructure evolution. Construction and Building Materials, 409(46–50), 133939. [Google Scholar]
24. Li, Y., Chen, X. H., Zhang, G. S. (2017). A study on effects of water-cement ratio and crack width on chloride ion transmission rate in concrete. Engineering, Materials Science, 19(4), 387–394. https://doi.org/10.12989/cac.2017.19.4.387 [Google Scholar] [CrossRef]
25. He, F. (2010). Measurement of chloride migration in cementitious materials by silver nitrate colorimetry (Ph.D. Thesis). Central South University, China. [Google Scholar]
26. Wang, J. Q. (2008). Experimental study on the coupled effect of freeze-thaw cycles and chloride erosion in concrete. Concrete, 11, 29–31. [Google Scholar]
27. Shen, B., Liu, L. Q., Diao, B. (2021). Effects of sustained load cracks and artificial cracks on chloride ion diffusion and life prediction in freeze-thaw erosion environment. Industrial Building, 6, 51. [Google Scholar]
Cite This Article
 Copyright © 2024 The Author(s). Published by Tech Science Press.
This work is licensed under a Creative Commons Attribution 4.0 International License , which permits unrestricted use, distribution, and reproduction in any medium, provided the original work is properly cited.
 Downloads
 Citation Tools