
 Submit a Paper
 Propose a Special lssue
 Open Access
ARTICLE

Research on Fatigue Damage Behavior of Main Beam Sub-Structure of Composite Wind Turbine Blade
1 School of Mechanical Engineering, Lanzhou Jiaotong University, Lanzhou, 730070, China
2 School of New Energy and Power Engineering, Lanzhou Jiaotong University, Lanzhou, 730070, China
* Corresponding Author: Haixia Kou. Email:
(This article belongs to the Special Issue: Health Monitoring and Rapid Evaluation of Infrastructures)
Structural Durability & Health Monitoring 2024, 18(3), 277-297. https://doi.org/10.32604/sdhm.2024.045023
Received 15 August 2023; Accepted 10 November 2023; Issue published 15 May 2024
 View Full Text
 Download PDF
Abstract
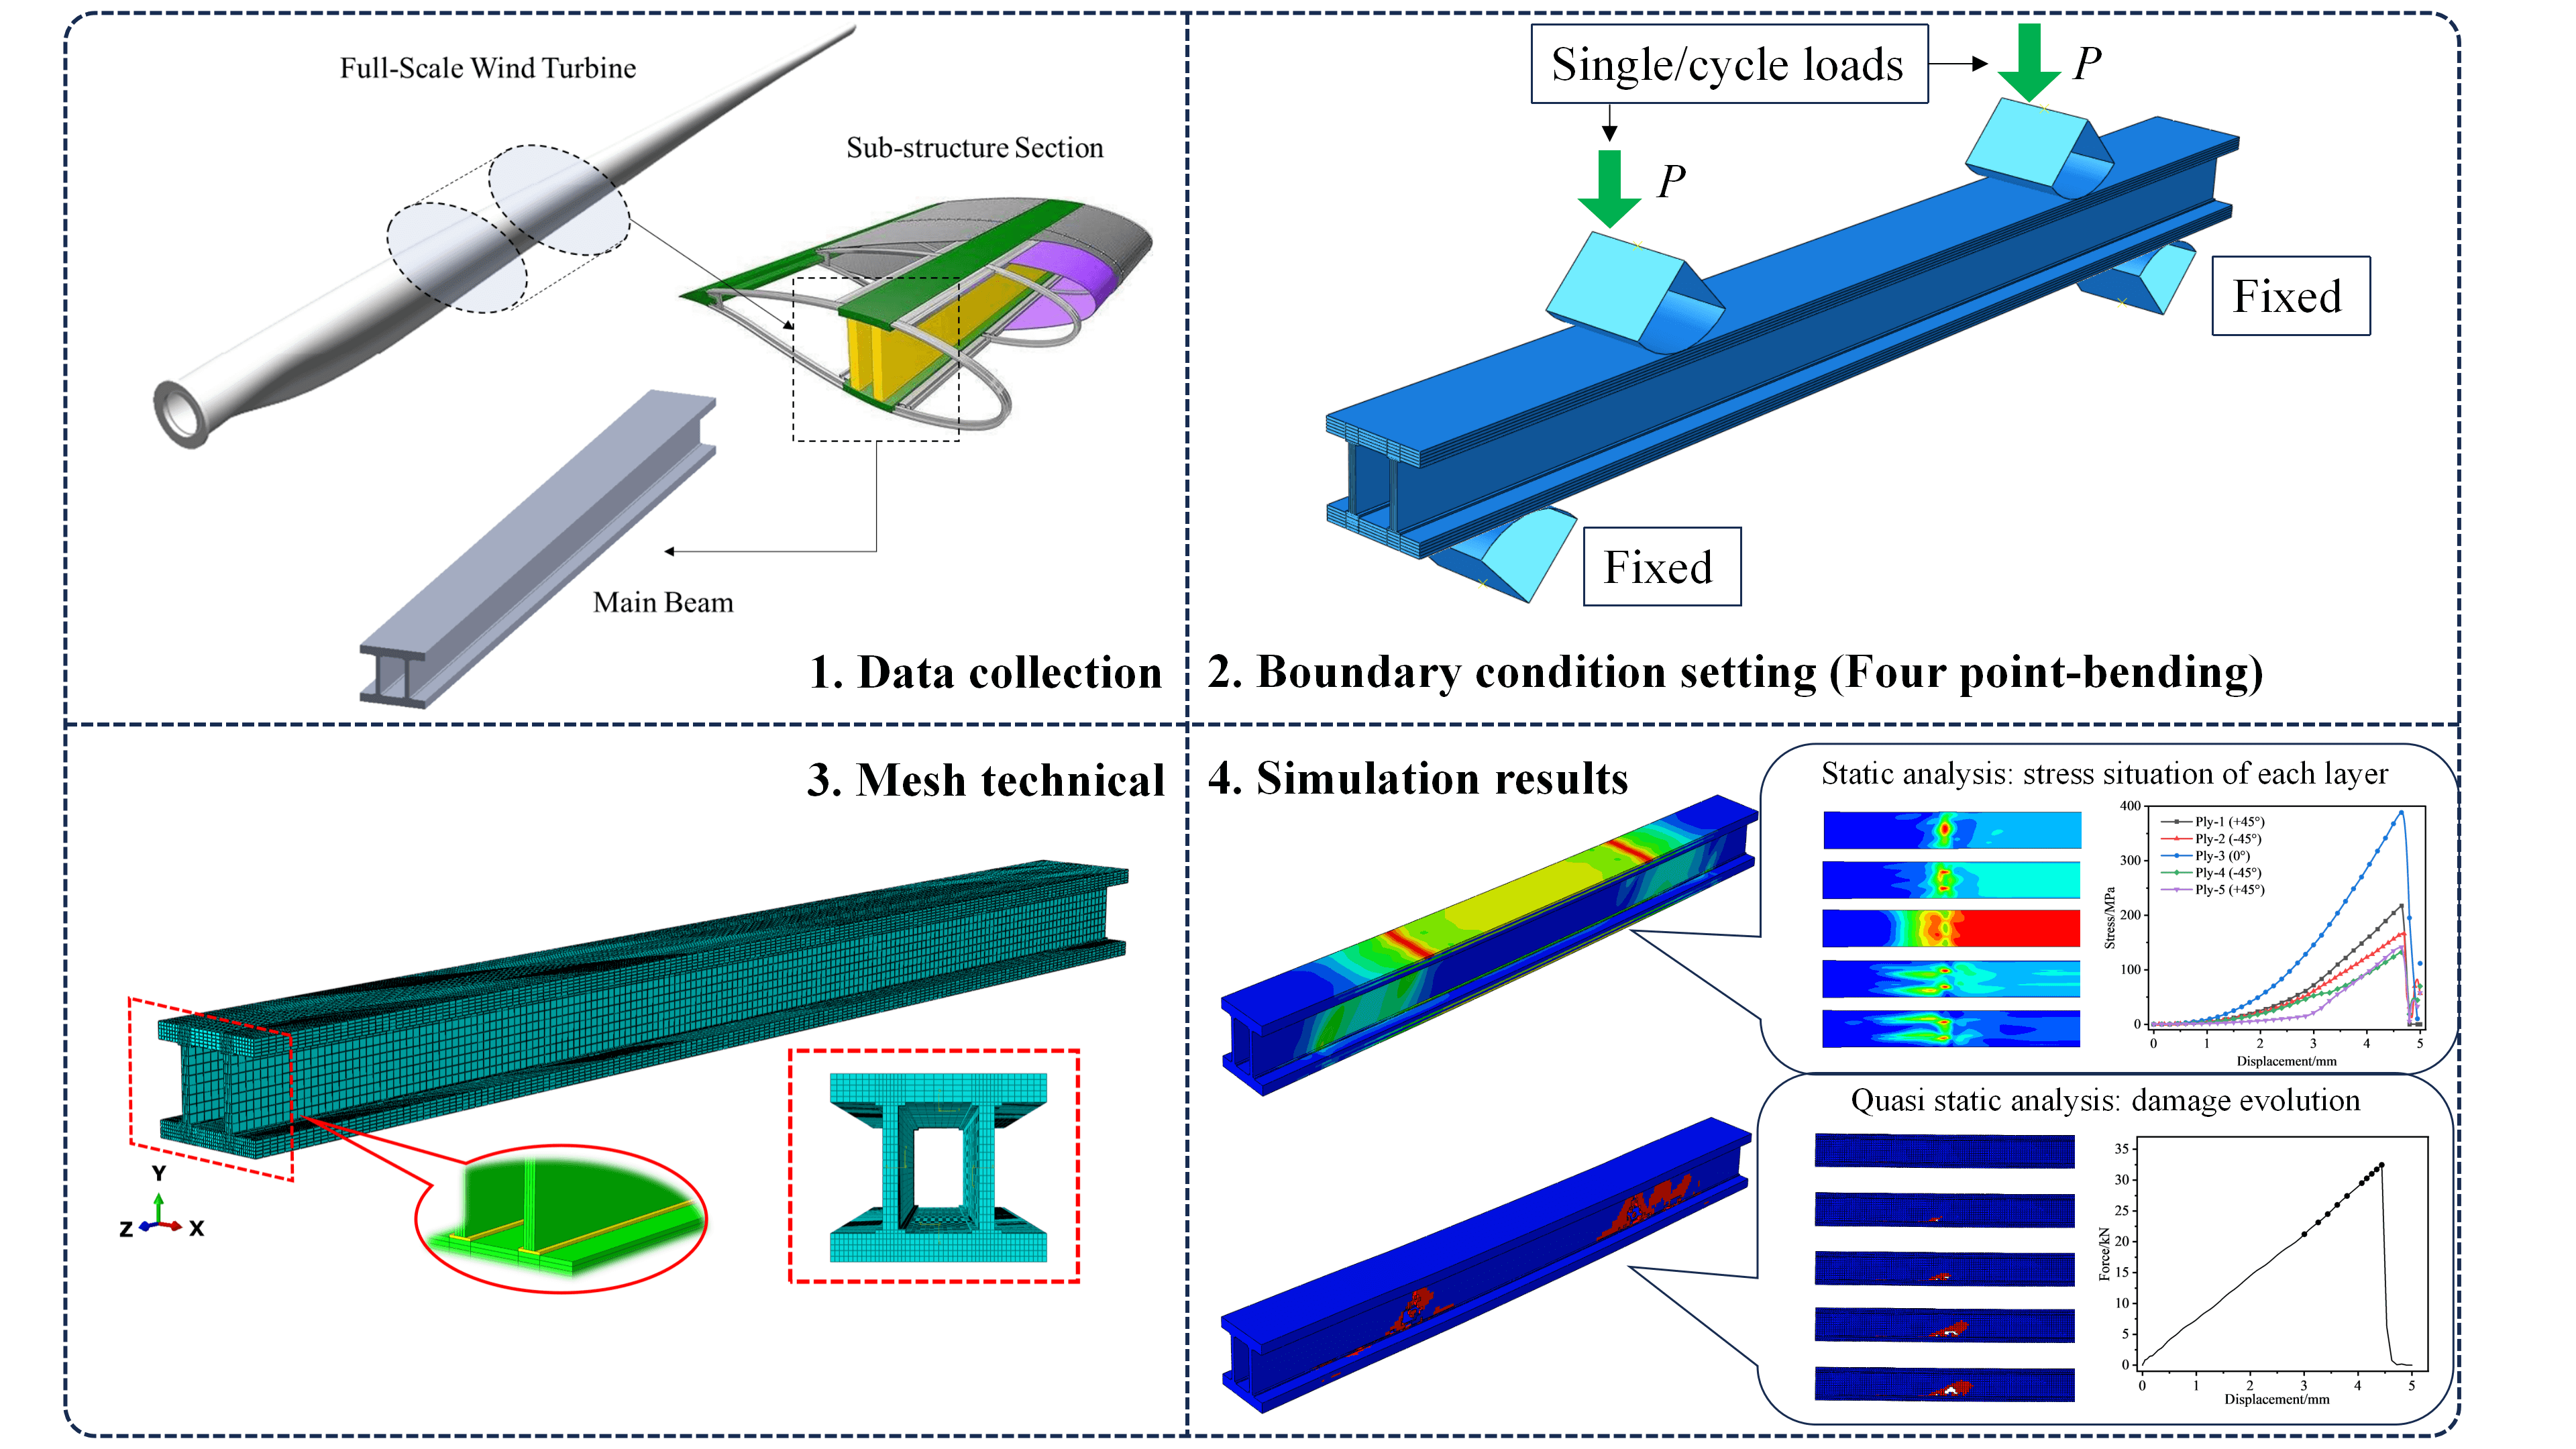
Given the difficulty in accurately evaluating the fatigue performance of large composite wind turbine blades (referred to as blades), this paper takes the main beam structure of the blade with a rectangular cross-section as the simulation object and establishes a composite laminate rectangular beam structure that simultaneously includes the flange, web, and adhesive layer, referred to as the blade main beam sub-structure specimen, through the definition of blade sub-structures. This paper examines the progressive damage evolution law of the composite laminate rectangular beam utilizing an improved 3D Hashin failure criterion, cohesive zone model, B-K failure criterion, and computer simulation technology. Under static loading, the layup angle of the anti-shear web has a close relationship with the static load-carrying capacity of the composite laminate rectangular beam; under fatigue loading, the fatigue damage will first occur in the lower flange adhesive area of the whole composite laminate rectangular beam and ultimately result in the fracture failure of the entire structure. These results provide a theoretical reference and foundation for evaluating and predicting the fatigue performance of the blade main beam structure and even the full-size blade.Graphic Abstract
Keywords
As the energy shortage issue brought on by the global energy crisis has become more prominent, the demand for the new energy industry as well as support from many countries around the world has increased dramatically. As the largest wind power country in the world, China’s development of the new energy industry will reach unprecedented heights [1]. The unit capacity of wind turbines is directly proportional to the size of their blades. Wind turbines are the essential components of the wind energy industry. Currently, the longest commercial blade is 123 meters long [2], To fully guarantee the aerodynamic and mechanical properties of the blade structure requirements, and at the same time to meet the new energy and other industries on the material proposed long service life, lightweight, cost control, and other high requirements, nearly all of the blade to glass fiber reinforced composite materials or carbon fiber reinforced composite materials (GFRP/CFRP) as the primary material [3].
Blade in long-term complex, harsh working conditions, its internal structure will experience fatigue damage; with the continuous accumulation of damage, blade fatigue performance (such as stiffness) will then decrease, until the loss of bearing capacity [4]. According to research, in the overall structure of the blade, the main beam structure carries more than 80% of the load during blade operation [5], and under this load condition, the main beam structure will experience fatigue fracture first [6]. Consequently, how to accurately and efficiently assess the fatigue performance of the blade main beam structure is the core problem of assessing the fatigue performance of the overall blade structure [7], which is not only of great importance for the stability and safety of wind turbine operation but also has significant engineering value and practical significance for the entire wind power equipment construction.
However, it is costly to directly investigate the fatigue performance of the main beam structure using a full-size blade, so it has become a popular research topic to indirectly infer the overall performance of the blade by directly investigating the fatigue performance of a sub-structure formed by intercepting a specific segment of the blade [8]. A blade sub-structure is the product of a blade composite laminate and a full-size blade, made of the same material as the main body of the simulated blade and containing at least one or more structural details of the simulated blade.
Domestic and international researchers have conducted numerous studies on the sub-structure of wind turbine blades in recent years. Eder et al. [9] intercepted the 26–29 m section of a 34 m blade and used fracture mechanics theory to study the structural linear and nonlinear properties of the section under waving load; Wang et al. [10] analyzed the bending-torsional coupling characteristics of the blade main beam sub-structure by offsetting the angular position of the main beam web and employing CFD. Jensen et al. [11] analyzed the nonlinear properties of the 8–15 m section of a 34 m box section blade under bending load using computer simulation. Sayer et al. [12] used a rectangular blade with a rectangular cross-section as the research object, selected a rectangular beam to simulate its main beam structure, combined asymmetric three-point bending fatigue testing, and performed a detailed analysis of the static and fatigue characteristics of the adhesive zone of the rectangular beam; Kou [13] established a stiffness degradation model of the main beam sub-structure of the blade with “I” cross-section, and a stiffness degradation model of the main beam sub. Zhao et al. [14] conducted a four-point bending loading test on the blade-pultruded core beam cap footprint specimen and investigated the effect of the ratio of the face layer and core size on the structure’s load-carrying capacity. Thus, it is evident that the study of blade-related properties based on the blade’s sub-structure offers a novel solution to the problem of assessing blade fatigue performance [15].
Therefore, this paper uses the blade main beam with a rectangular cross-section as the research object, employs the definition of blade sub-structure, selects a composite rectangular beam with blade flange, web, and adhesive layer to simulate the blade main beam structure, and, within the framework of composite fatigue damage theory and continuous medium damage mechanics theory, takes the stiffness as the defining parameter to characterize the fatigue damage state of the composite. The FEA model of the composite rectangular beam is used to clarify the progressive damage evolution of the composite rectangular beam. This is to indirectly evaluate the fatigue performance of the simulated blade main beam structure and provide a theoretical foundation for investigating the evolution of the blade main beam structure’s fatigue performance.
2.1 Blade Main Beam Structural Parameters Design
Although the failure form of the blade under the influence of fatigue load is complex and diverse, the failure location of the blade along the spreading direction exhibits a degree of regularity. Specifically, the easy damage zone of the blade is primarily concentrated between 26.2% and 53.85% distance from the leaf root [16]; the damage form is crack and fracture; and the phenomenon is most pronounced in the region close to the leaf root [17]. Based on this law and the structural characteristics of the laminate thickness of the blade main beam structure in the range of 13.3% to 41.7% from the root [18], this paper uses the AOC15/50 full-size blade as the prototype blade, whose cross-section is “moment” shaped, and designs the blade main beam sub-structure’s parameters. Specifically, a blade section is intercepted between 28.3% and 45.7% of the blade root, and the main beam structure parameters of this section form the basis for the design of the main beam sub-structure (composite rectangular beam) in this paper. Adopted with a rectangular main beam structure, as shown in Fig. 1.
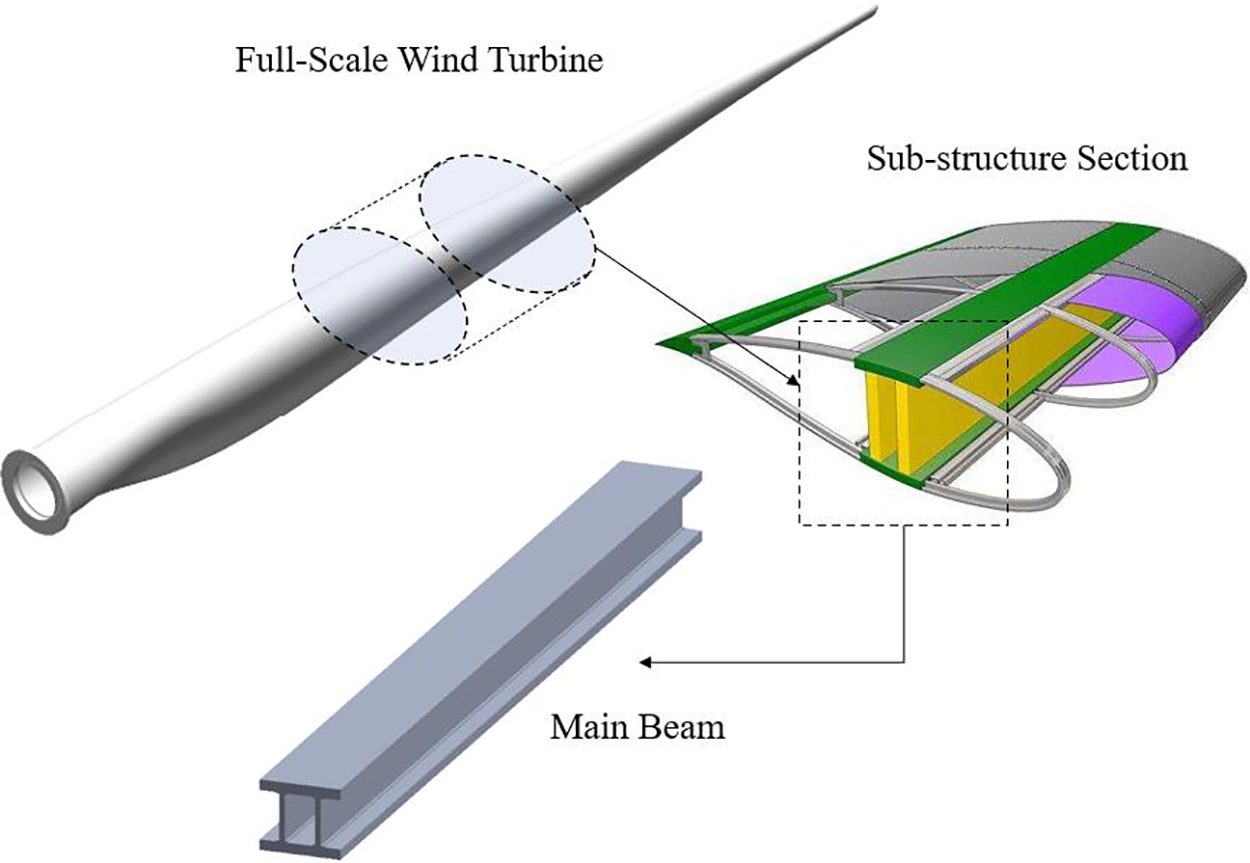
Figure 1: Position of the main beam sub-structure in full-scale blade
The rectangular beam sub-structure designed in this paper includes beam flanges, shear-resistant webs, and adhesive layers of the simulated blade main beam structure, with the beam flange including upper and lower flanges and the structural parameters of the rectangular beam structure cross-section, as shown in Fig. 2.
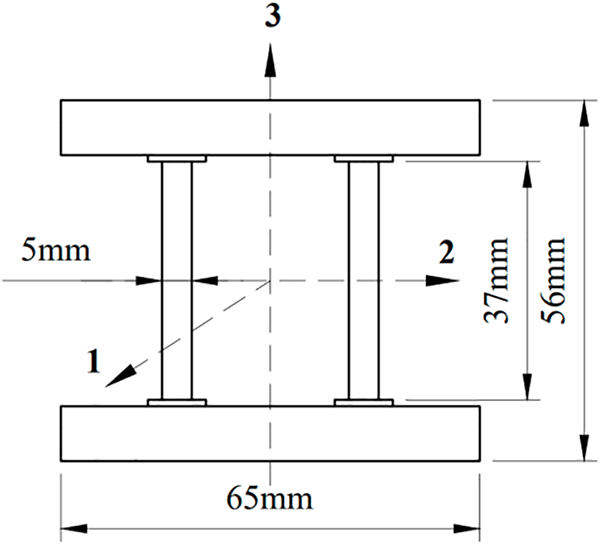
Figure 2: Structural cross-sectional parameters of composite rectangular beams
In this figure, the joint between the rectangular beam flange and the shear-resistant web (i.e., the adhesive layer) is bonded with epoxy resin adhesive. Based on the shear test results of a specific epoxy resin structural adhesive under different adhesive thicknesses [19], the thickness of the rectangular beam adhesive layer is chosen to be 1 mm to ensure that the adhesive layer has a certain shear strength performance. To ensure that the composite laminate constitutive model can be effectively applied to the numerical simulation analysis model and to obtain more accurate analysis results, when designing the rectangular beam structure parameters, the rectangular beam structure is scaled in proportion to the prototype blade main beam sub-structure sections, and has a total length of 766 mm. The composite laminate of the beam flange and the shear-resistant web is T300/6808 carbon fiber reinforced composite which thickness of layers are uniformly distributed, with a thickness of 1.7 mm for each layer in beam flange and 1.15 mm in the shear-resistant web. The composite rectangular beam structure’s laminate design is based on the simulated blade main beam structure.
2.2 Design of Composite Rectangular Beam Lay-Up Structure
To maximize the high-strength performance brought by composite laminated structures and considering the actual working conditions of blade main beam structures, the following conditions are met simultaneously: 0° plies are used primarily to bear the main tensile and compressive loads along the fiber direction, and ±45° ply groups are applied to bear the shear load by decomposing it into tensile and compressive components along the fiber direction. A certain number of ±45° ply groups should be arranged at the flange of the spar cap to improve the compressive stability and anti-buckling performance of this part of the structure. It is preferable to locate the ±45° plies on the outer surface of the overall structure as much as possible to improve the compressive stability and impact resistance of the laminated structure. Unless otherwise required, balanced symmetric laminates are used for ply settings to avoid warping caused by coupling failure during blade curing or after loading [20].
In this paper, based on the above principles of lay-up design of composite laminates and the layer groups design of the simulated blade main beam structure, the total number of lay-ups of beam flanges of rectangular beam structure is set to 10 layers and the total number of lay-ups of shear resistant webs is set to 4 layers by equal scaling.
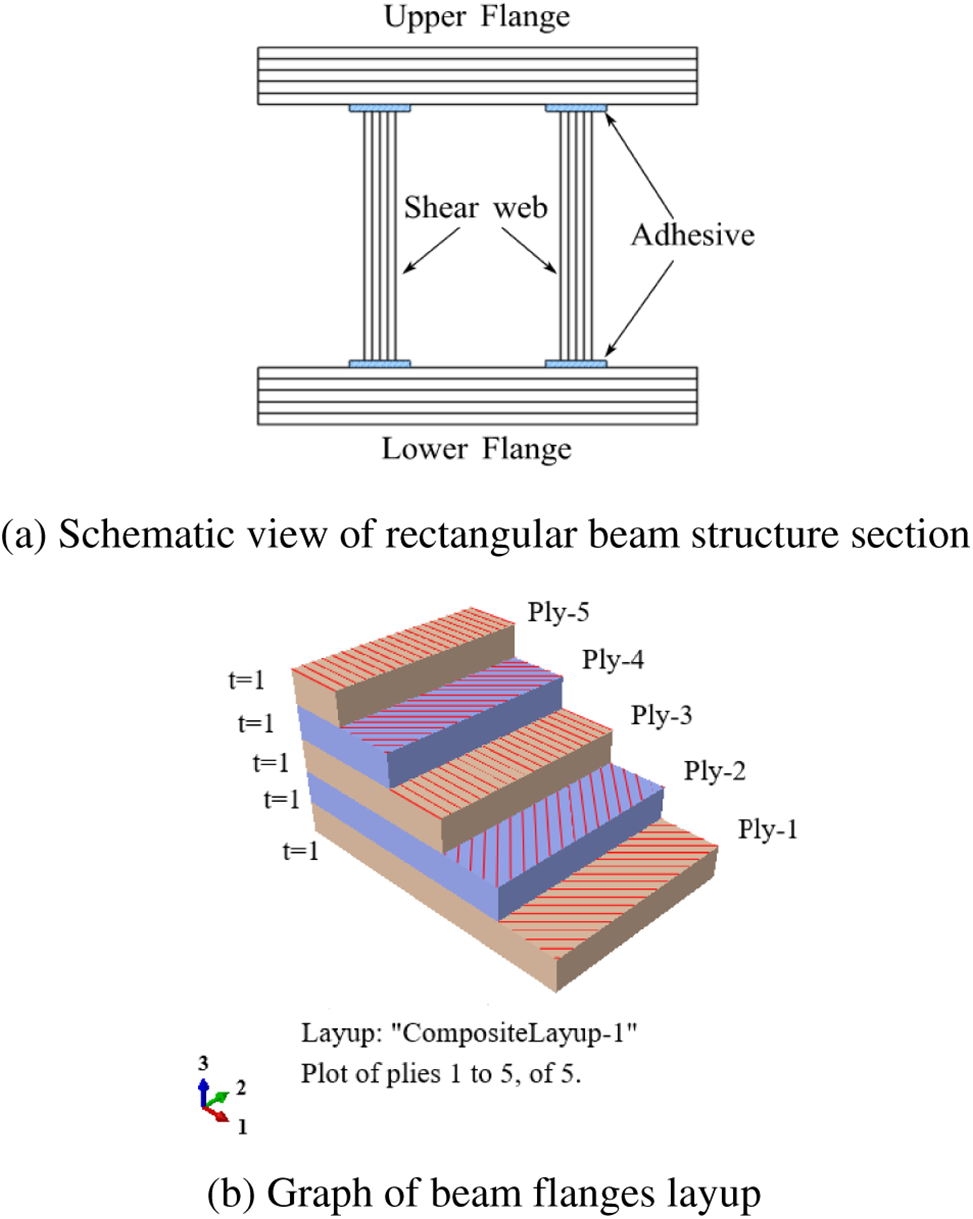
Figure 3: Composite rectangular beam layup structure
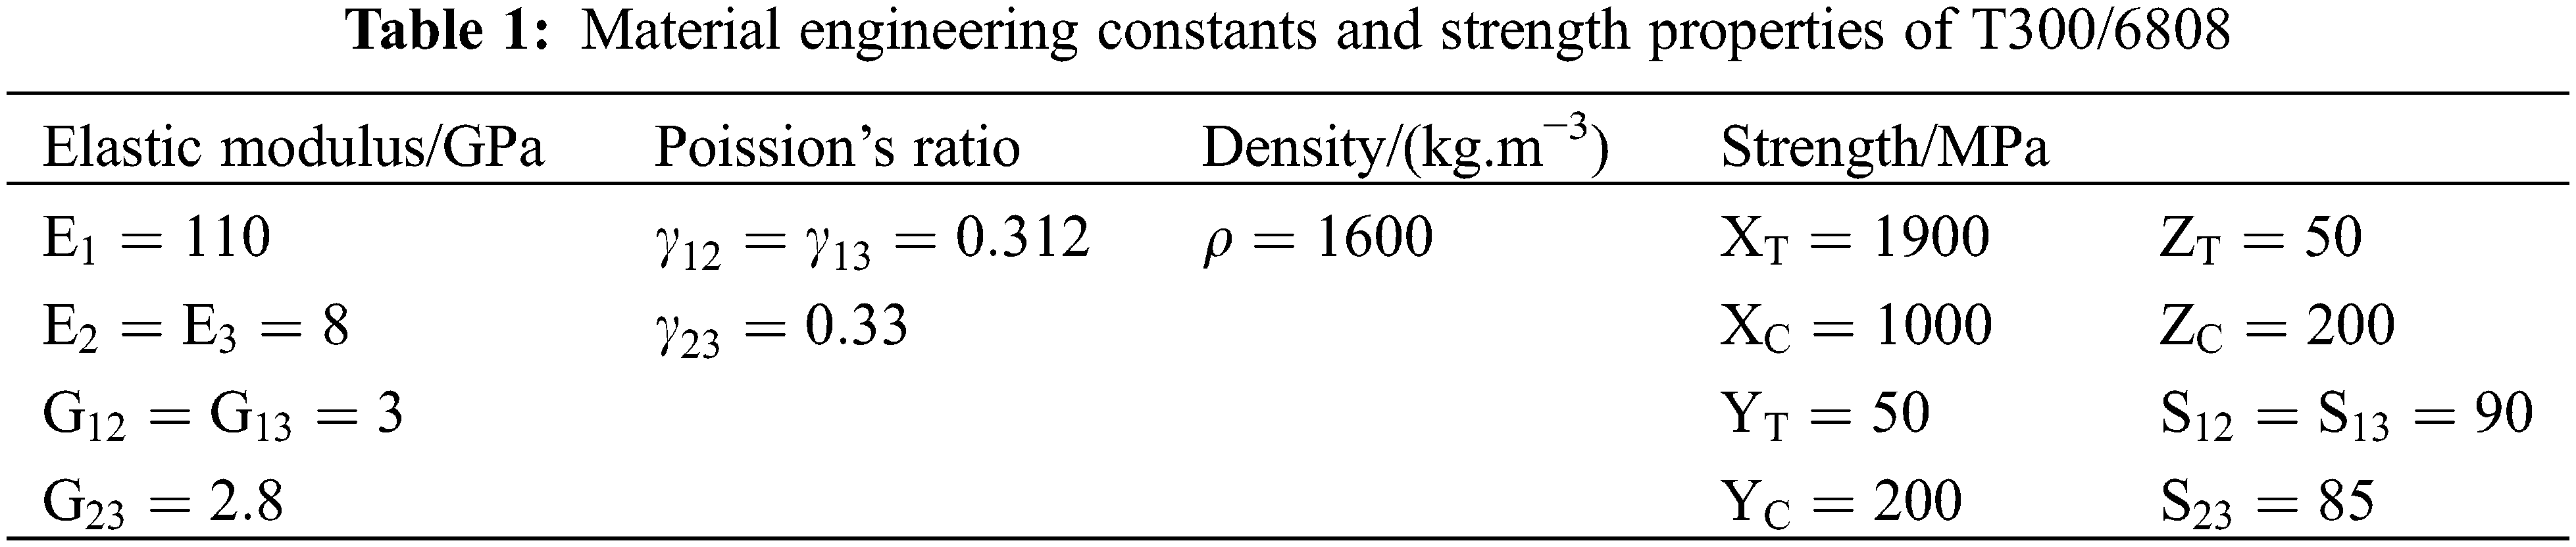
The composite laminates used for the beam flanges and shear webs are T300/6808 carbon fiber-reinforced composites; the material specifications are listed in Table 1 below.
3.1 Constitutive Model of Composite Rectangular Beam
Since each component of the composite rectangular beam structure is by definition a composite laminate, the intrinsic structure model of the composite laminate applies to the composite rectangular beam structure as well. The intrinsic structure relationship in the elastic deformation phase of common materials is expressed as:
In the formula,
In the formula,
In the formula,
3.2 Fatigue Analysis Method of Composite Rectangular Beam
Based on the multilayer structural design characteristics of composite laminates, the internal damage can be categorized into two forms: single-layer intra-layer damage and inter-layer damage. Fig. 4 illustrates the nonlinear evolution of fatigue damage in composites [21]. The damage progression and expansion during fatigue alternating load can be roughly divided into the following stages:
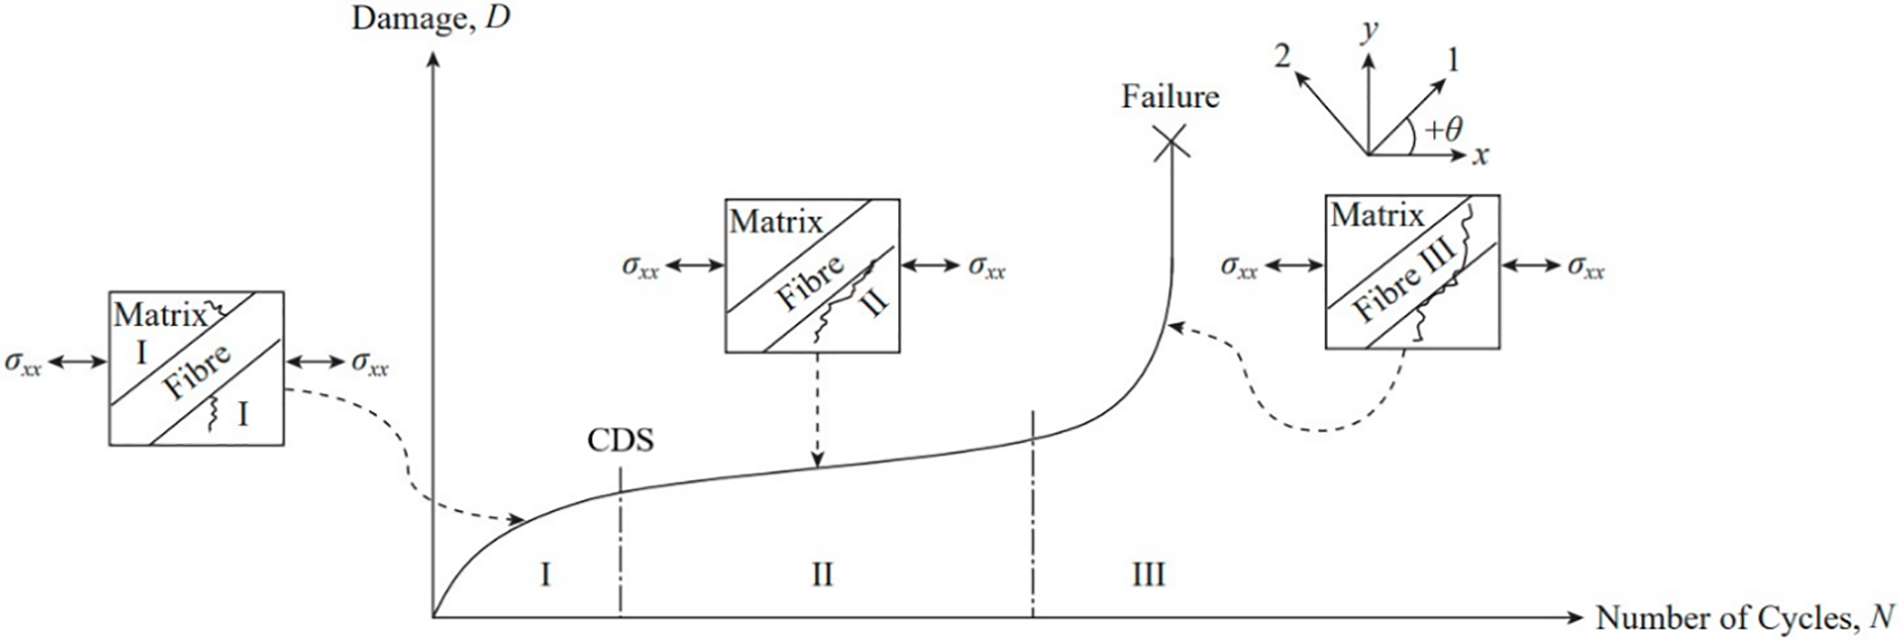
Figure 4: Fatigue damage evolution process of unidirectional composites
I. The initial damage emergence stage, wherein a significant number of microcracks are generated within each monolayer matrix, and there is no interaction between the cracks.
II. The quasi-saturated stage of relatively slow damage accumulation, wherein microcracks in the matrix further expand. Simultaneously, interfacial debonding occurs, resulting in the interaction of intra-ply and inter-ply damage, and the formation of damage localization in the severe zone. Interfacial debonding leads to interactions between intra- and inter-layer damage, resulting in damage localization in the severe zone. The number of cycles required to reach a certain stage of characteristic damage saturation (CDS). Loading continues, and after about 50% of the fatigue life, local delamination occurs. The delamination then continues to expand along with the random fiber fracture or extraction in a certain part.
III. Rapid failure and destruction stage, wherein the accumulation of various damages and interactions during the process leads to further expansion of cracks and instantaneous failure damage of the entire structure.
3.3 Failure Criteria for Composite Rectangular Beam
In this paper, a modified three-dimensional Hashin failure criterion is used to comprehensively describe the failure modes of fiber tensile failure, fiber compression failure, matrix tensile failure, matrix compression failure, and fiber-matrix shear failure.
Fiber tensile failure
Fibre compression failure
Matrix tensile failure
Matrix compression failure
Matrix fiber shear failure:
In Eqs. (5)–(9),
3.4 Stiffness Degradation Method for Composite Rectangular Beams
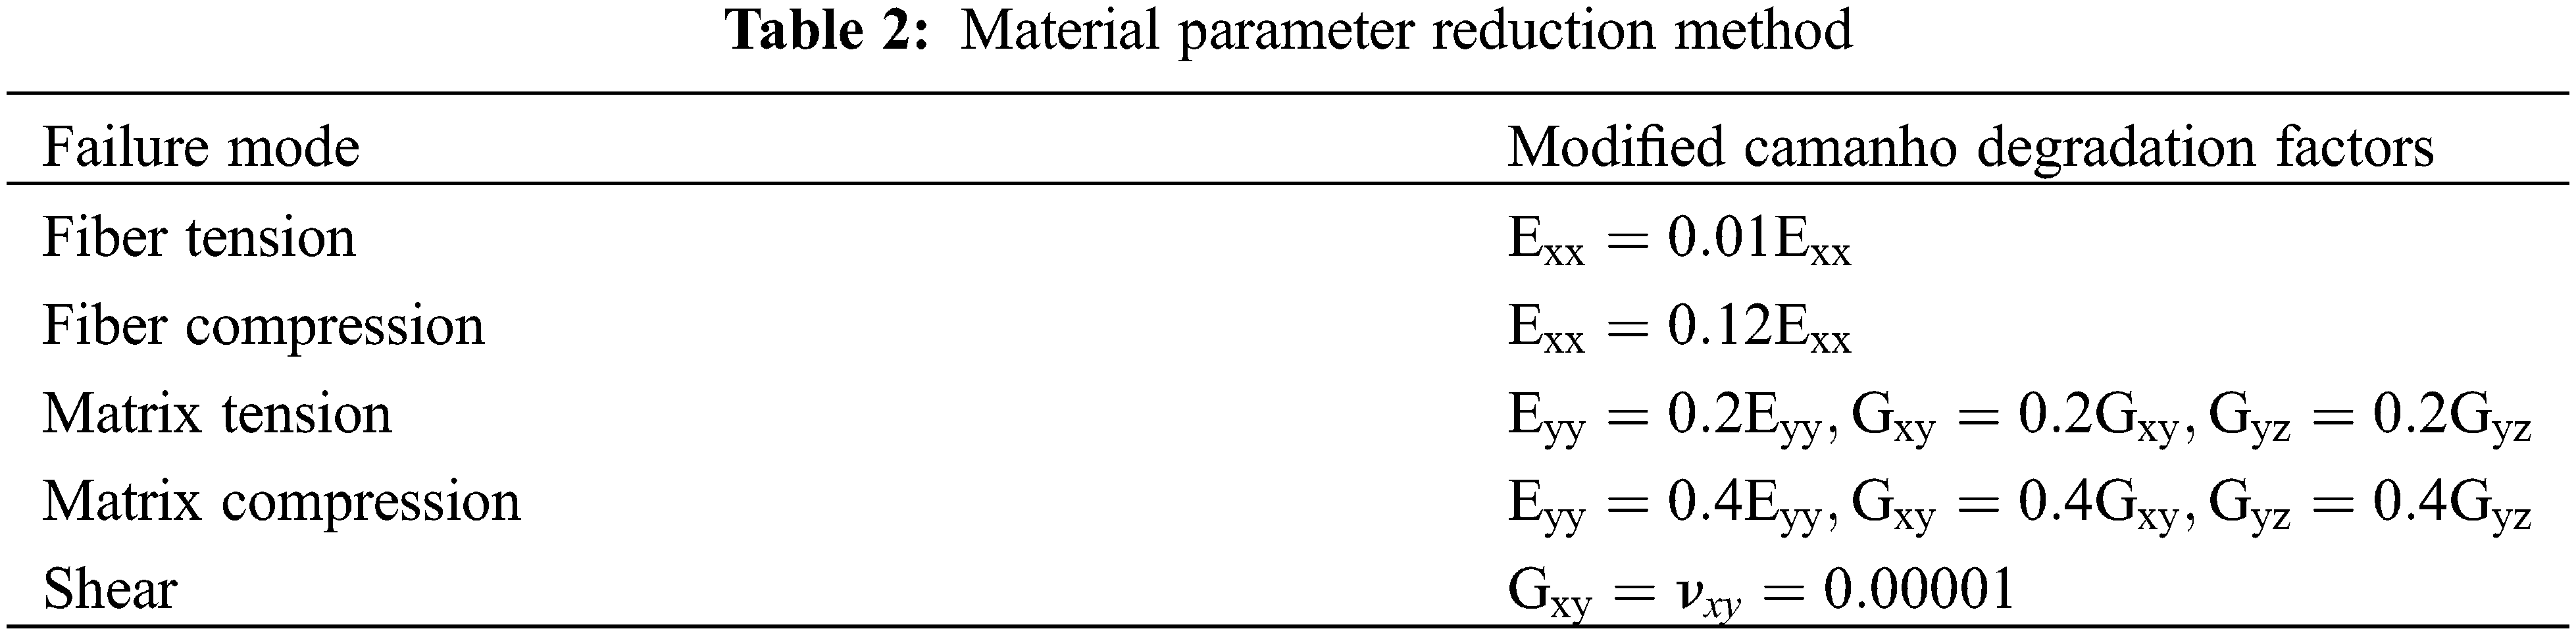
In this paper, the pros and cons of the existing damage accumulation models and their applicability in finite element numerical simulations are evaluated, and the modified three-dimensional Camanho stiffness degradation model is chosen as the stiffness reduction scheme for the progressive damage analysis of rectangular beam structures, as shown in Table 2 [22].
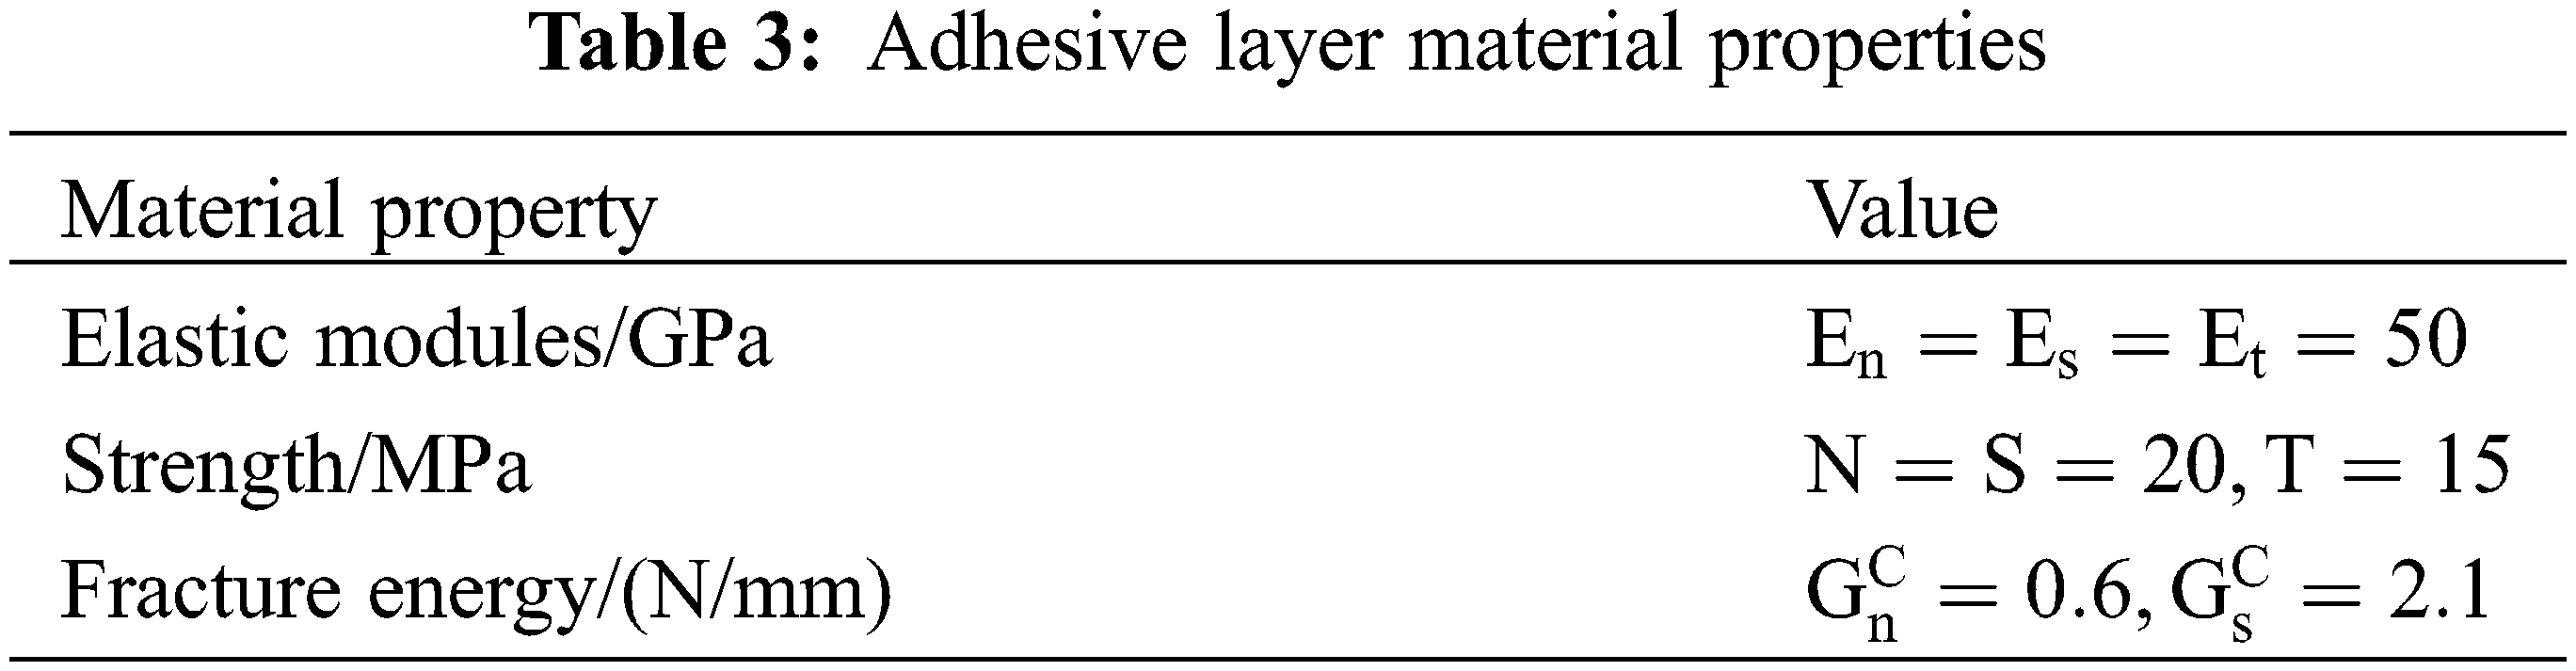
3.5 Adhesive Layer Cohesive Zone Model
This paper introduces a three-dimensional cohesive element with thickness based on the bilinear traction-separation law to simulate the delamination damage in the bonded area between the main beam flange and the shear-resistant web, i.e., interfacial debonding [23]. Fig. 5 depicts the model’s schematic, which has the advantages of high accuracy, fast calculation speed, and good convergence.
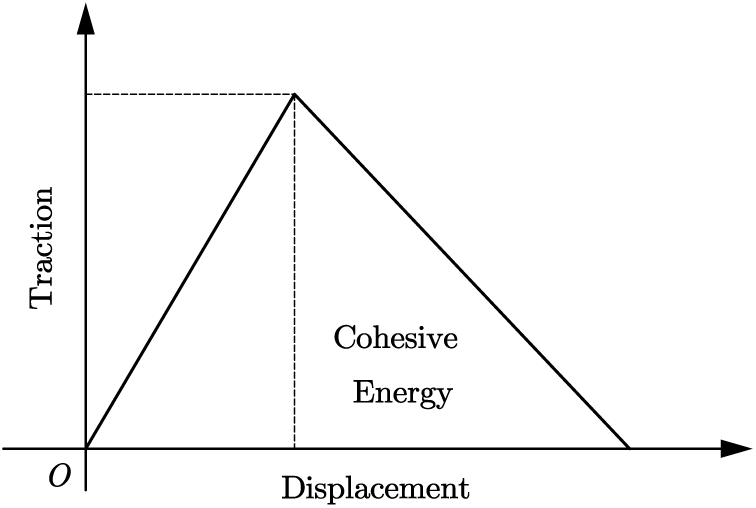
Figure 5: Bilinear traction-separation cohesive zone model
As shown in the following equation, the initial damage criterion for the cohesive zone model of the adhesive layer is determined by the maximum stress criterion:
In the formula,
In the formula,
4 FEA of the Composite Rectangular Beam
4.1 General Process of Simulation Analysis
In this paper, we examine the adhesive layer and nonlinear characteristics of the composite rectangular beam structure. We analyze the progressive fatigue damage process of the composite rectangular beam (including the adhesive layer) using the continuous medium damage mechanics theory and the composite interface cohesive model by writing the UMAT subroutine. The foundation is the static model of the composite rectangular beam with the subroutine interface running platform of the Abaqus software, as shown in Fig. 6, and the general flow of its simulation analysis.
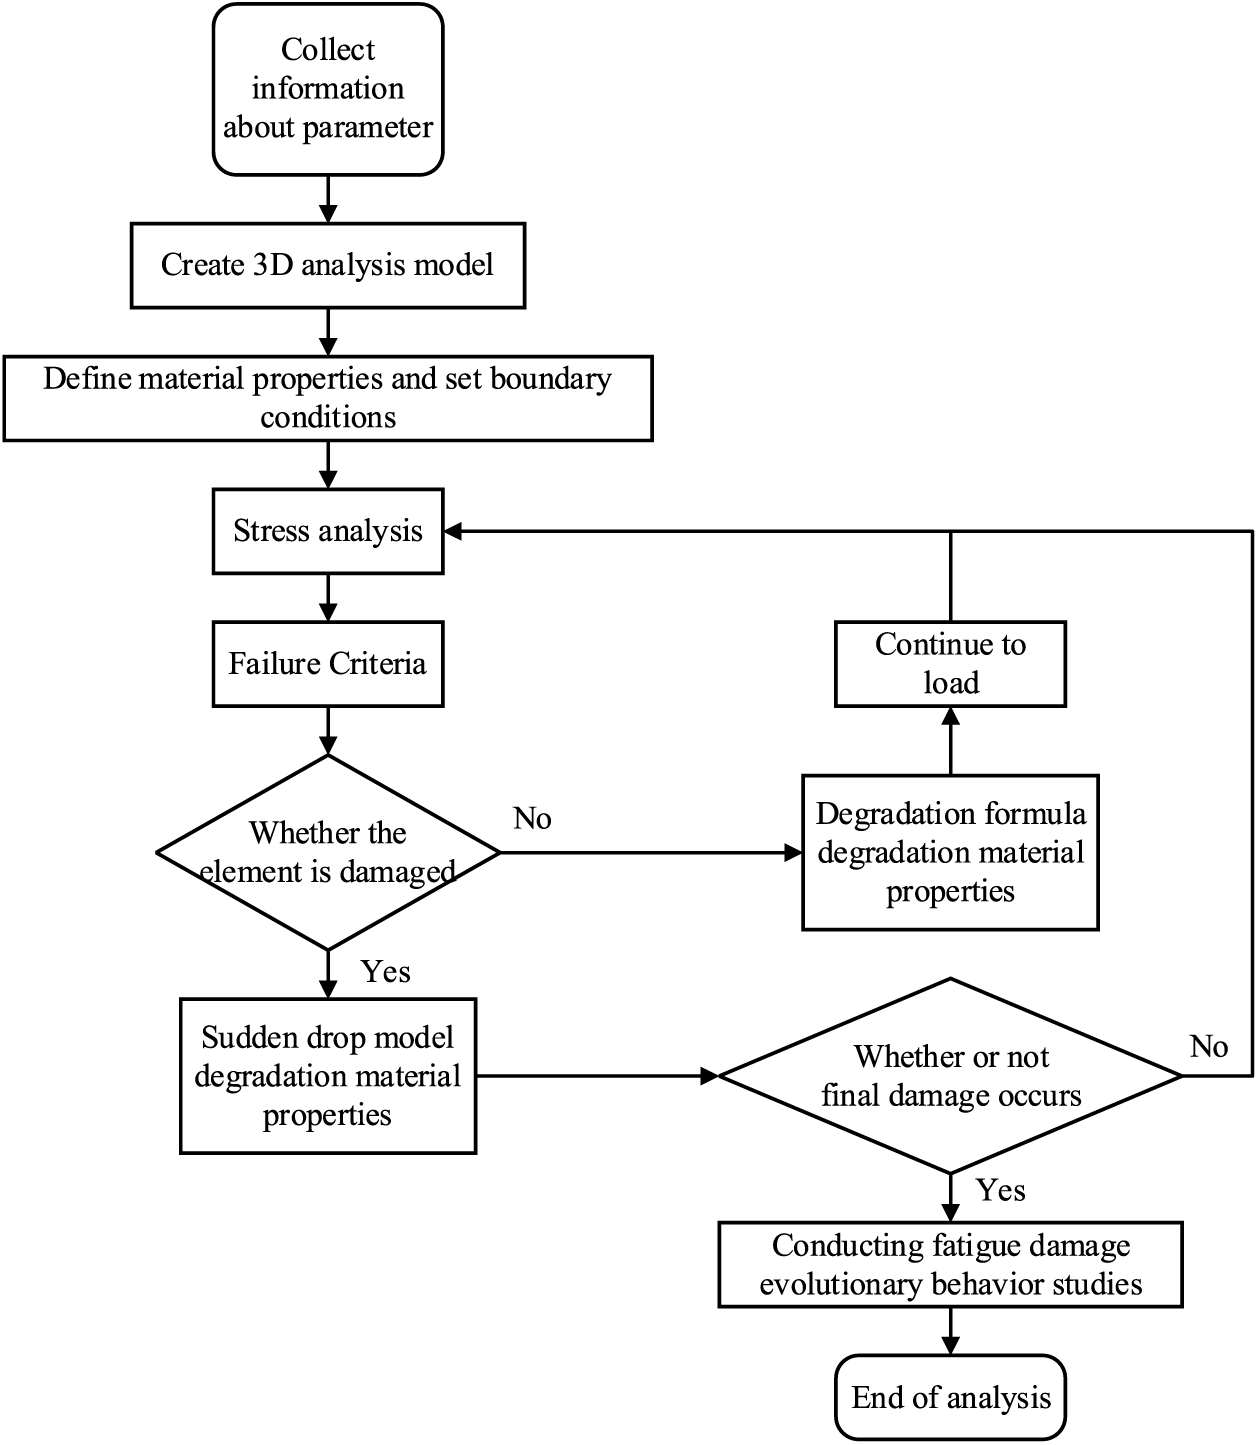
Figure 6: Progressive damage analysis process of composite blade beam sub-structure
4.2 Modeling and Loading of Composite Rectangular Beam
As shown in Fig. 7, the rectangular beam structure and its four-point bending test model were developed using the modeling module of the Abaqus FEA software. The model consists primarily of two loading rigid bodies as pushers, two fixed restrained rigid bodies as supports, and a rectangular beam structure as the test specimen. Four analysis rigid bodies are coupled with their specimens via face-to-face contact, and four reference points are bound to the analysis rigid bodies as boundary condition setting control points.
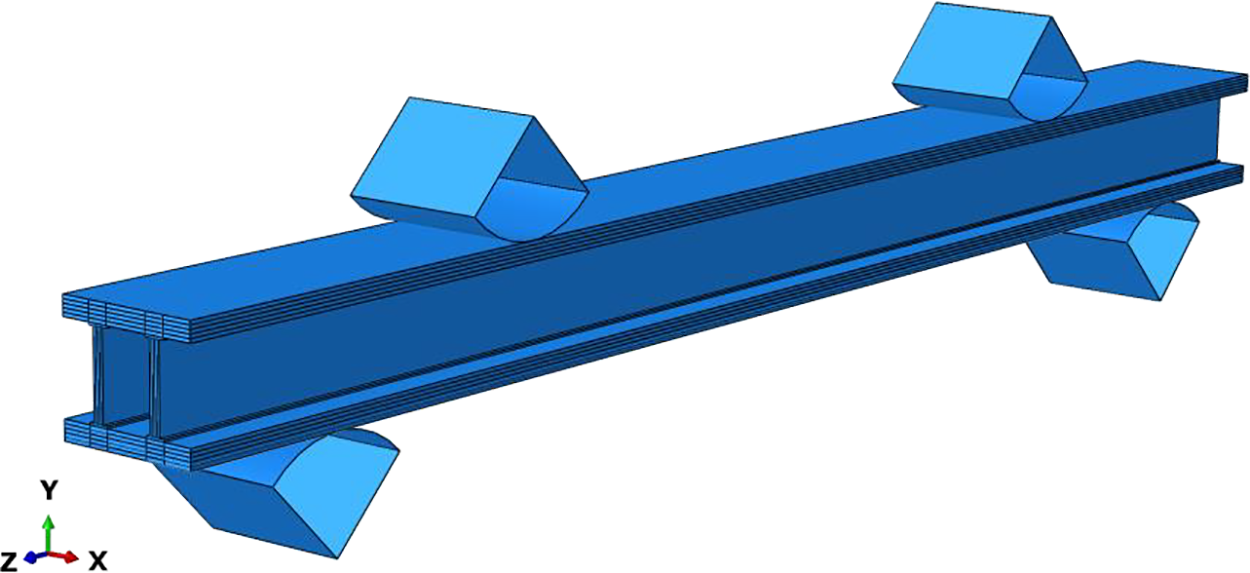
Figure 7: FEA model of blade rectangular beam
When it comes to mesh part, the COH3D6 cells are applied to the adhesive bonding zone and the C3D8R element is used to composite laminate structures such upper and lower flanges and shear resistant webs. In this instance, the adhesive bonding zone is delineated by sweeping the mesh in a direction parallel to the stacking direction of each flange layer. Hexahedral mesh is used for laminate structures, wedge mesh is used for bonding zones, and Fig. 8 depicts the mesh model.
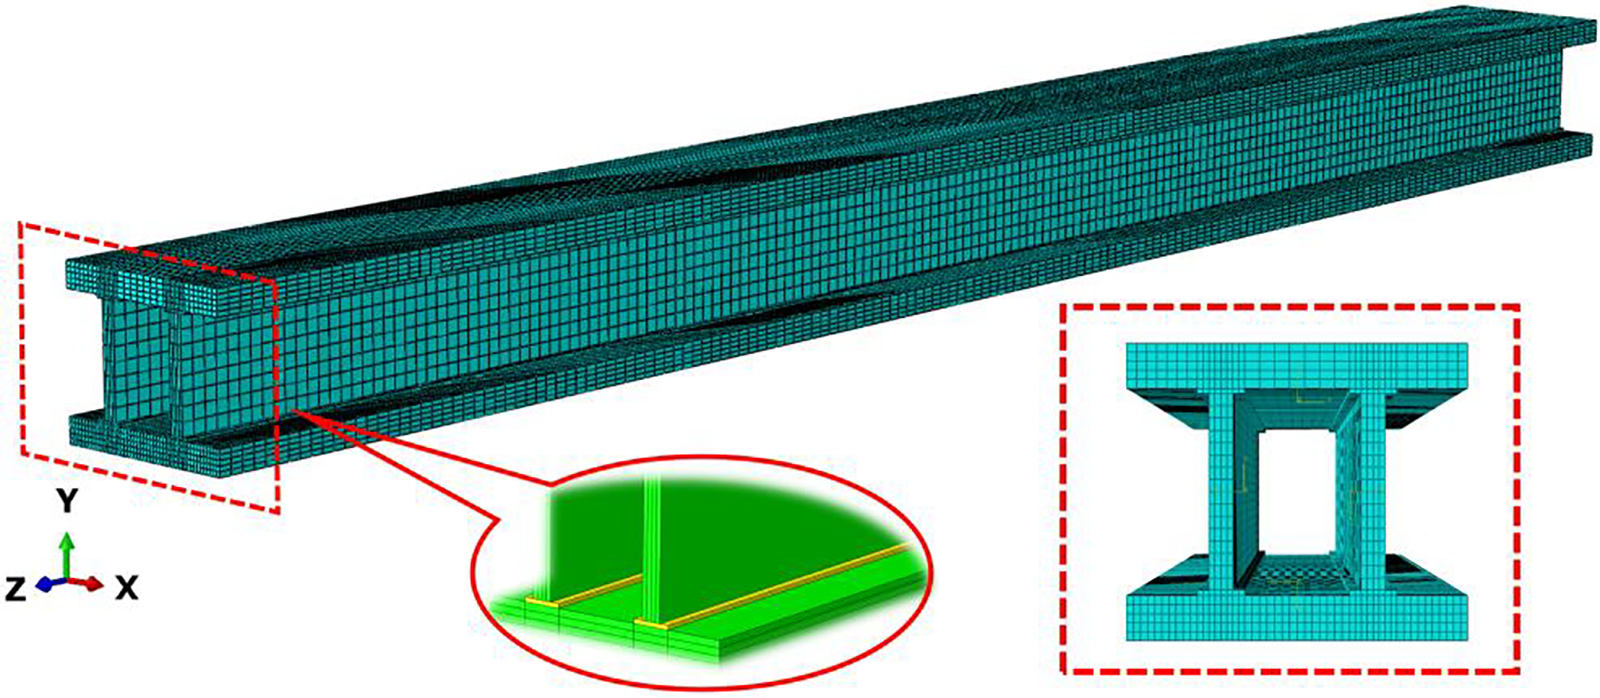
Figure 8: Mesh model of blade rectangular beam
According to the four-point bending test standard, a hinged fixed constraint is applied at points A and D to restrict rotation and displacement in directions 1, 2, and 3. At points B and C, a displacement load of 10 mm is applied in the opposite directions of 3, limiting all degrees of freedom of displacement and rotation, except for displacement in the 3-direction [24]. Fig. 9 depicts the four-point bending loading diagram of the composite rectangular beam.
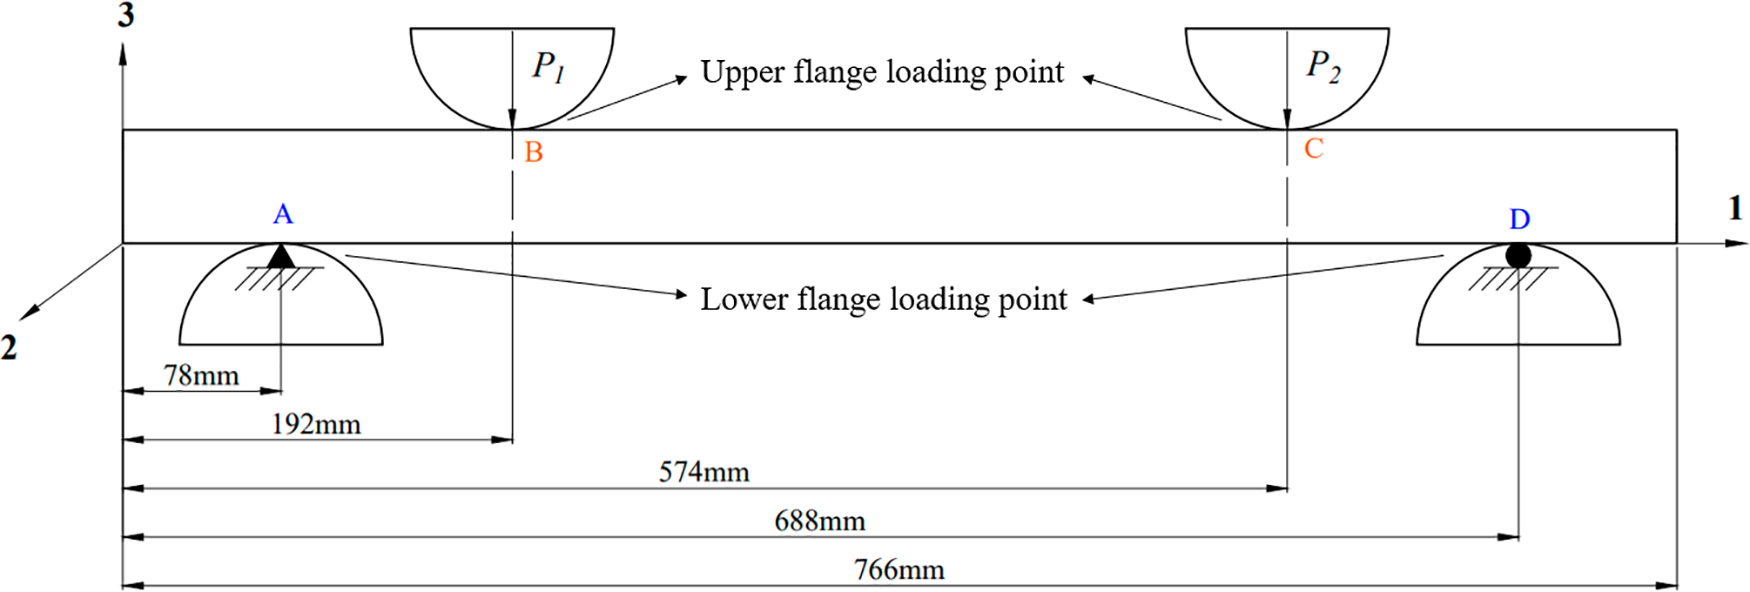
Figure 9: Four-point bending of blade main beam sub-structure
4.3 Static Simulation and Analysis of Composite Rectangular Beam
First, the shear-resistant webs of the composite rectangular beams are laid in a lay-up sequence with a lay-angle of [+45/−45]2S facing up. As illustrated in Fig. 9, the displacement load size of the rigid body push-head is 10 mm, and the UMAT subroutine based on the modified three-dimensional Hashin failure criterion is utilized for the static analysis of the composite rectangular beam and its overall structural static stress response.
Based on Fig. 10 and the software’s output data, it can be seen that the stress concentration in the upper flange of the composite rectangular beam is primarily distributed at the rigid body pushing head loading, where the stress state of the composite material is primarily in compression of the fibers and tension of the matrix. In the lower flange, it is predominantly distributed in the middle portion of the fixed support ends, where the tension of the fibers and compression of the matrix predominate. The stress concentration in the lower flange and the shear-resistant web is also prone to occur on both sides of the edge joint area, i.e., the adhesive layer area, above the support ends A and D. Also susceptible to stress concentration on both sides of the edge joint area, i.e., the bonding zone, are the lower flange and the shear web. The shear web’s stress concentration extends at 45° from the lower flange to the upper flange, and the stress state on the opposite side of the web is consistent with this. The stress state of each layer of the upper and lower flange is distributed axially symmetrically with the centerline of the rectangular beam as the boundary, and the stress distribution clouds of each layer of the upper and lower flange of the composite rectangular beam are obtained as depicted in Fig. 11, with the left side of the centerline as an illustration.
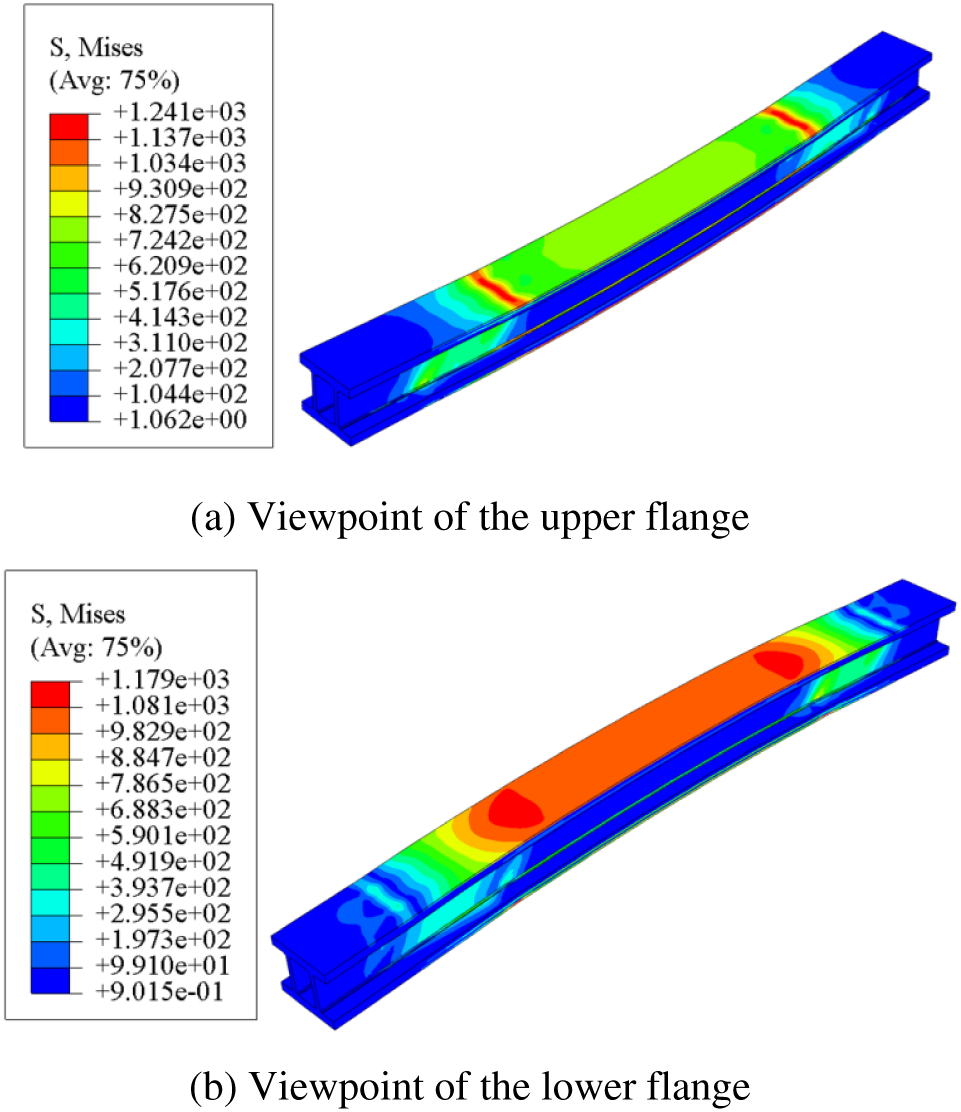
Figure 10: Static response results of blade rectangular beam
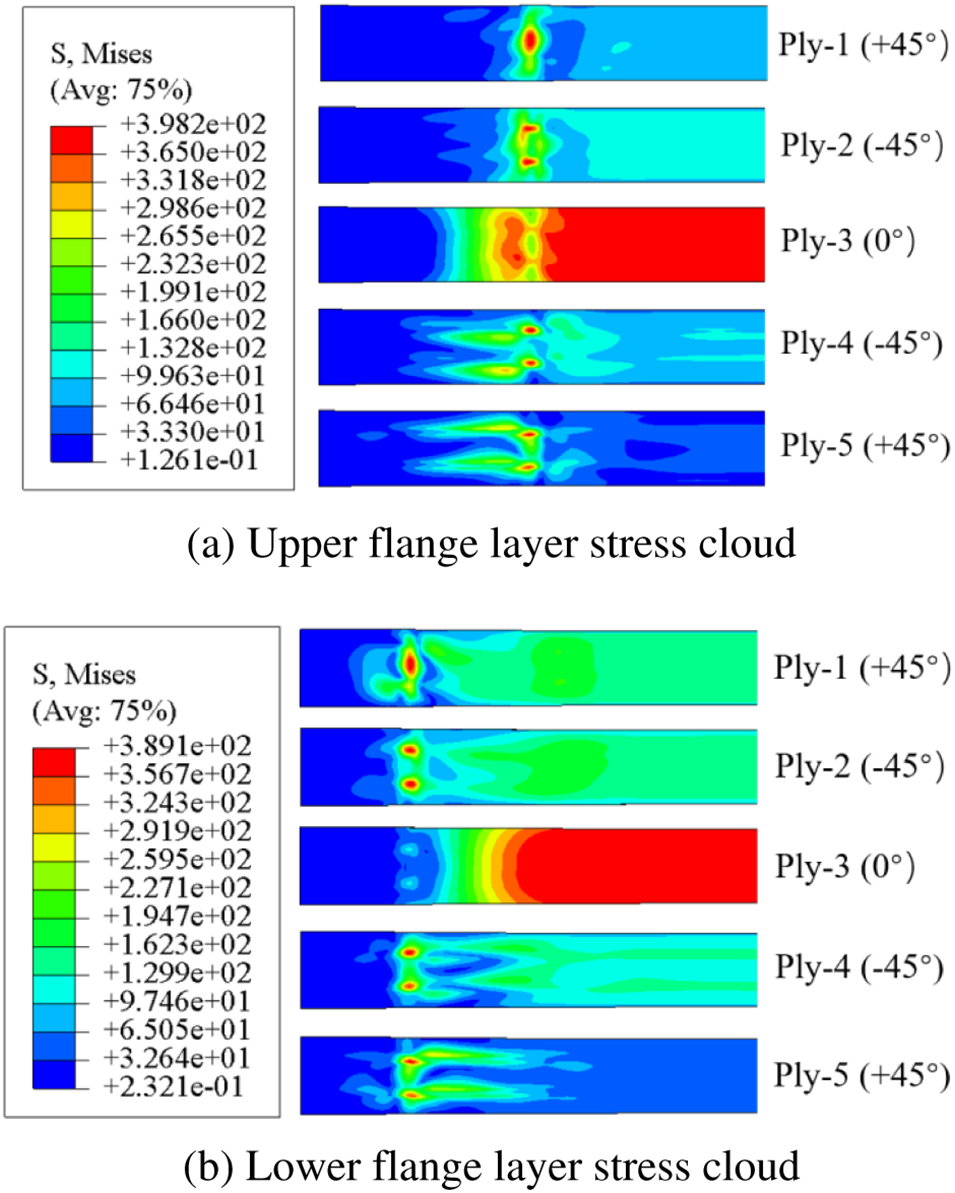
Figure 11: Static response results of blade rectangular beam
By analyzing the stress distribution of each layer of the upper and lower flange, it was determined that the stress concentration sites of the ±45° layers occurred predominantly at the intersection between the loading contact surface and the web side. Moreover, the maximum stress of the 0° layer occurred frequently at the locations on both sides. Fig. 12 depicts the stress variation curve of the maximum stress point of the upper and lower flange with the loading push-head displacement; Table 4 depicts the maximum stress value.
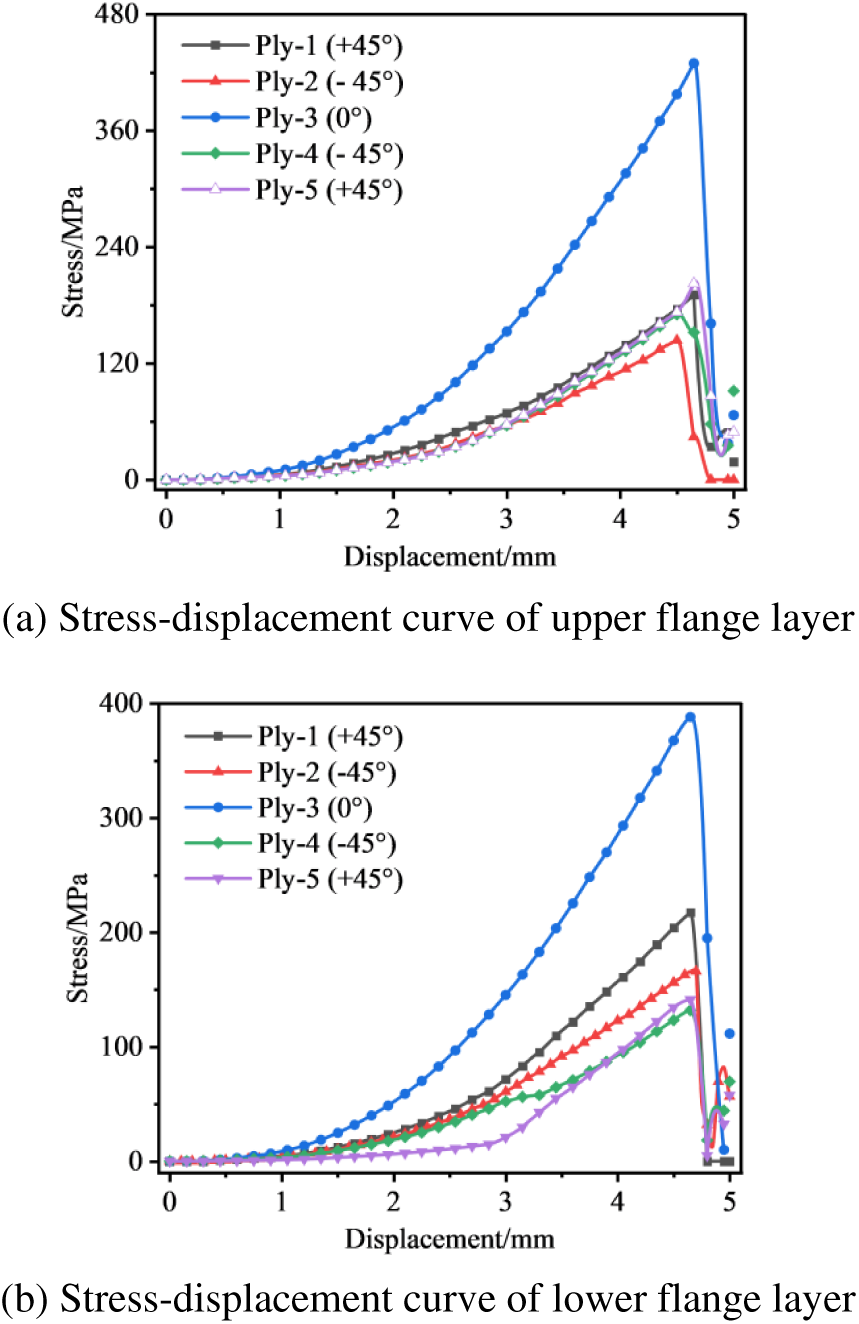
Figure 12: Stress-displacement curve of beam flange ply structure
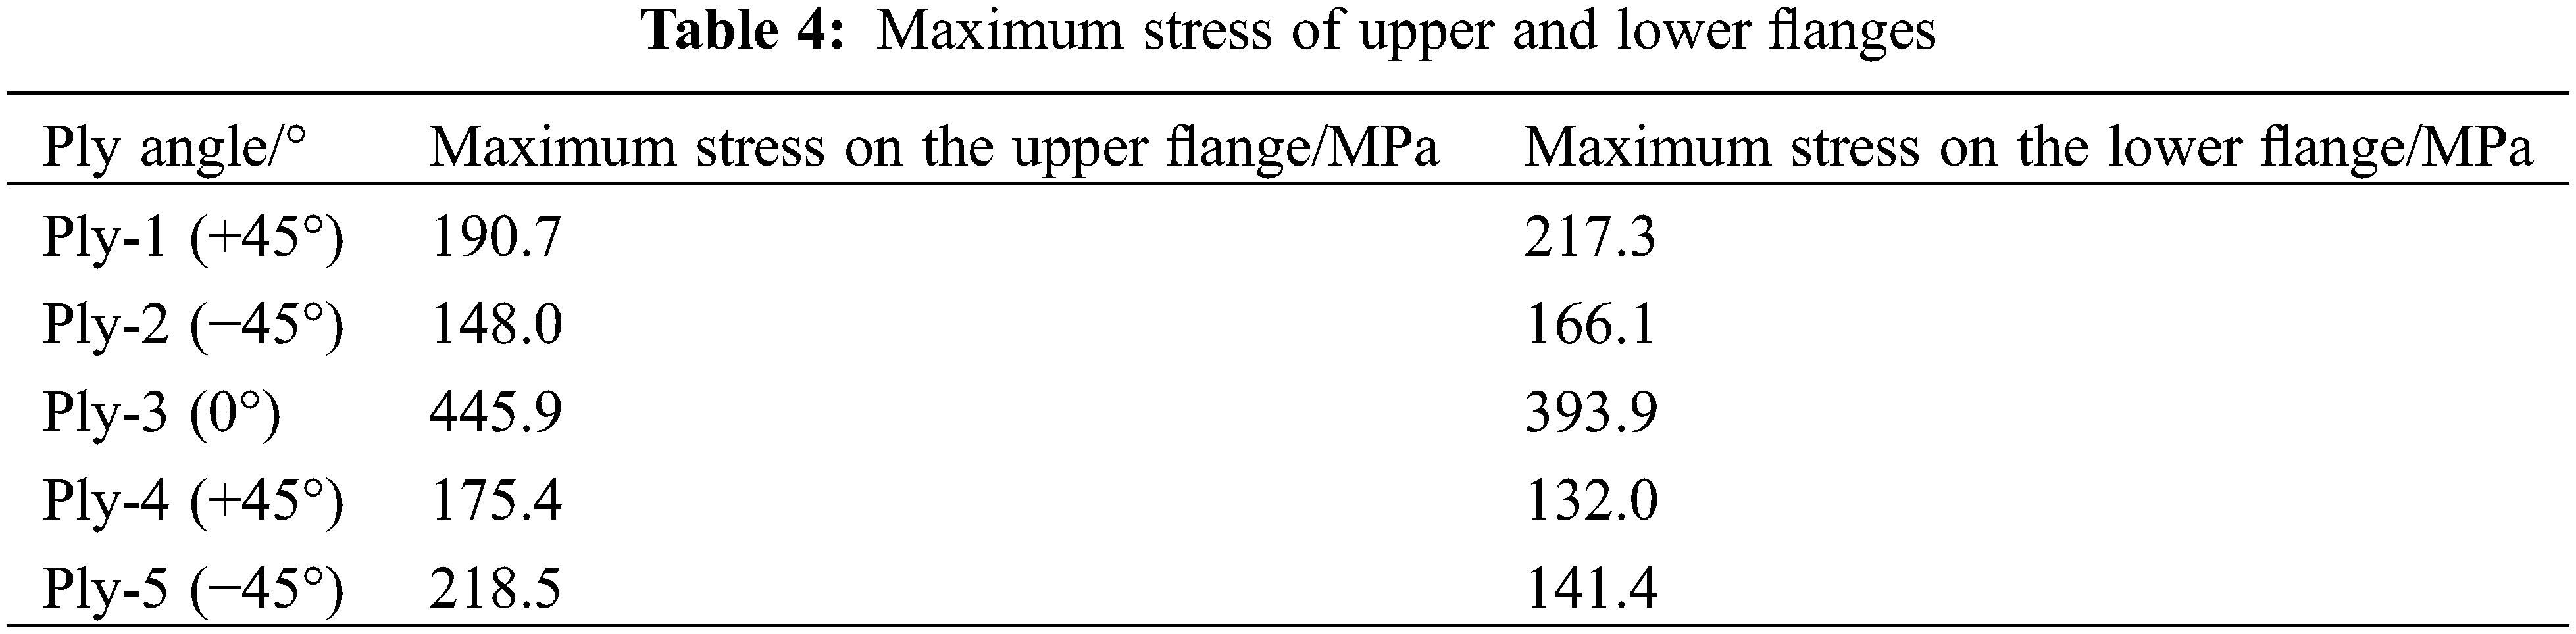
As shown in Fig. 12, the loading process of each layup of the beam flange of the main beam substructure essentially follows the stress magnitude increases linearly with the displacement load, and when the rigid body pushes the head displacement load loaded to within 5 mm, the stress state abruptly changes and the stress magnitude drops sharply. In other words, this law determines the overall structural failure. The detailed description of each layer is as follows:
1. Both ±45° plies and 0° plies tend to fail under static load at the same displacement loading process point, while 0° plies are subjected to significantly higher stresses than other plies. This is because the loading direction of the four-point bending test is perpendicular to the fiber tensile direction;
2. The maximum stresses on the lower flange Ply-1 plies are greater than those on the other non-0° plies. This is due to the large tensile deformation of this ply under displacement load on the outermost side, whereas the composite material has superior tensile-compression resistance in the axial1 direction. In addition, the stress state of the composite rectangular beam’s shear-resistant web plies is not distributed axially symmetrically with the geometric center. As shown in Fig. 13, the stress response of one of the two webs is now extracted.
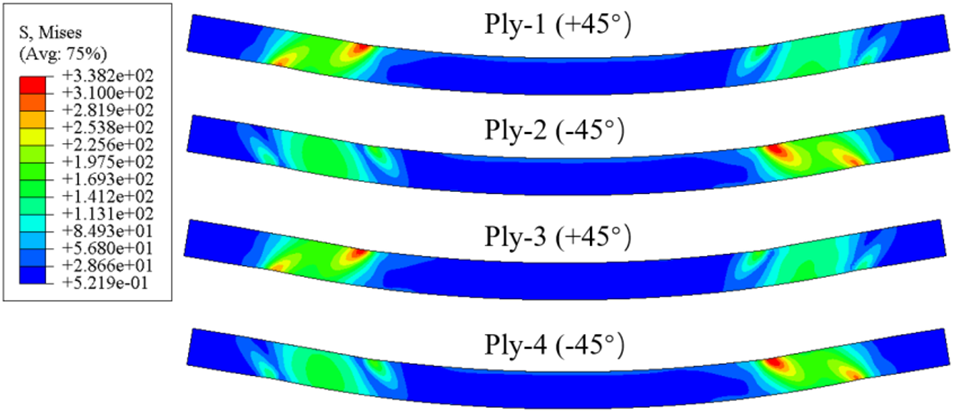
Figure 13: The stress response when the web ply angle is ±45°
The shear-resistant web is subjected to the shear load from the rigid body pusher loading, i.e., the shear load is decomposed into ±45° axial load and transverse load, as shown in Fig. 11. The stresses in the web increase with the angle of the layer in the ±45° direction, and the stress state exhibited by the ±45° layer is mirror-symmetrical to the center line. The stress distribution is primarily concentrated above and below the loading point and the fixed endpoint, and the beam flange joints tend to experience the highest stresses. The stress displacement at the maximum stress point of each layer is shown in Fig. 14.
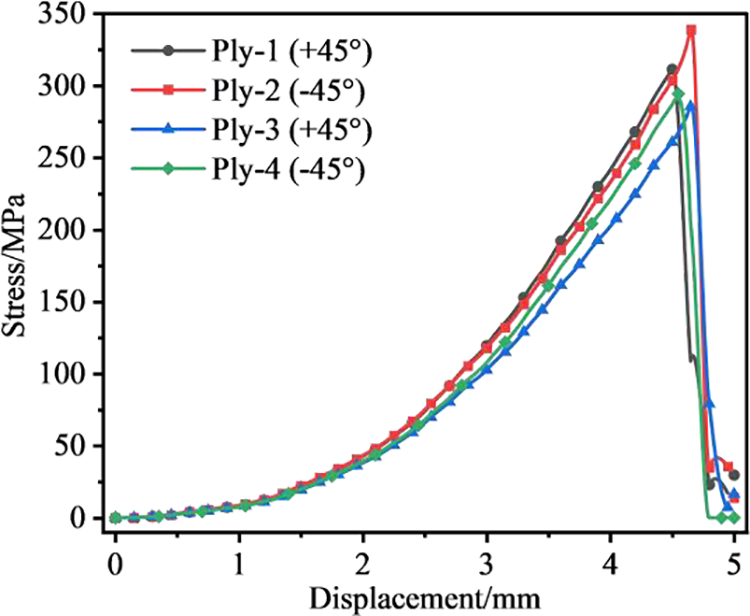
Figure 14: Stress-displacement curve of web ply structure of ±45° ply group
The maximum stresses on the ±45° plies of shear-resistant webs are comparable, as depicted in the figure above. Fig. 15 illustrates the stress response when the angle of the shear web plies is set to
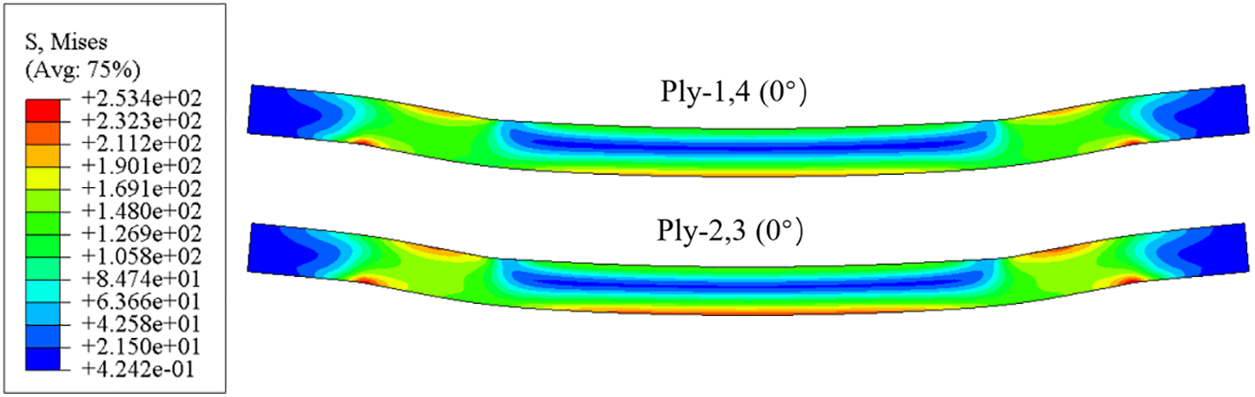
Figure 15: The stress response when the ply angle is 0°
Comparing the stress distribution of shear-resistant webs of composite rectangular beams with different layup angle settings (Figs. 13 and 15), it was discovered that the stress response range of webs with 0° layup angle was greater than that of ±45° layup angle, and the maximum stress response occurred not only at loading points B and C and above and below fixed ends A and D, but also at the lower flange articulation (i.e., adhesive layer). Fig. 16 depicts the stress displacement of each layup at the maximum stress point; Tables 5 and 6 compare the maximum stress values and the corresponding displacements when a sudden drop (failure) occurs for the ±45° layup group and the 0° layup group, respectively.
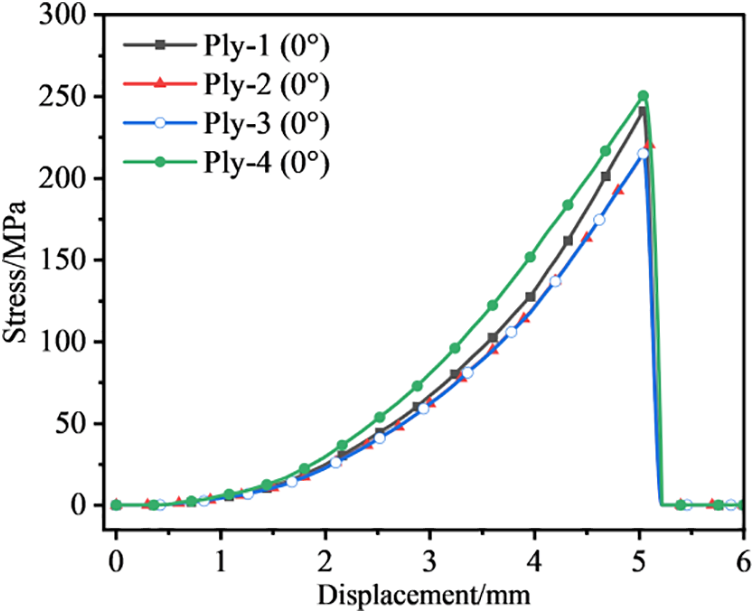
Figure 16: Stress-displacement curve of web ply structure of ±45° ply group
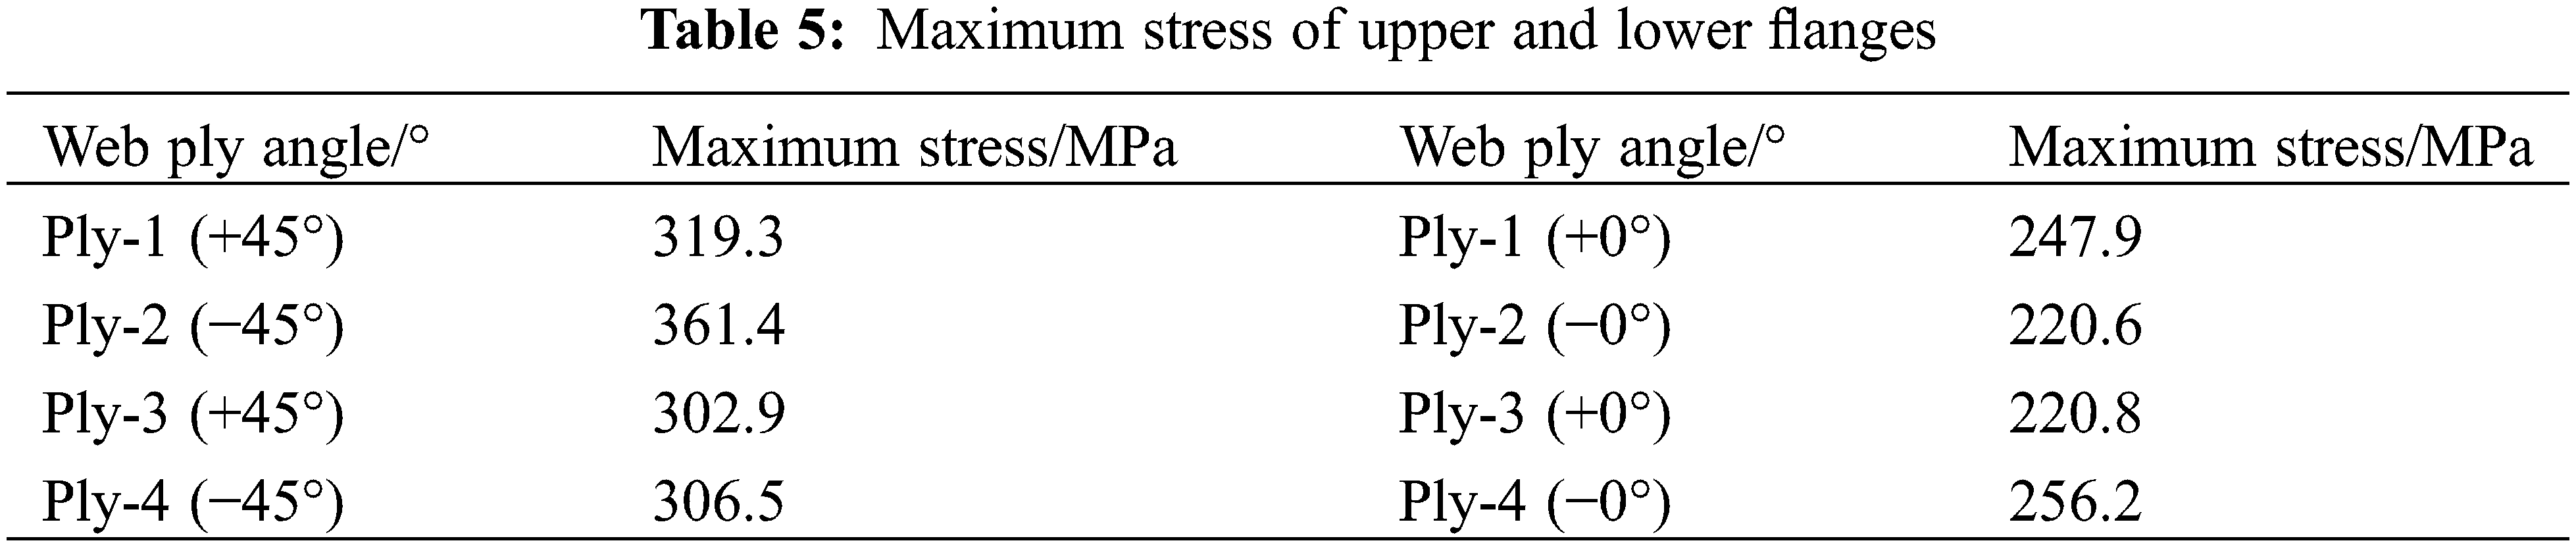
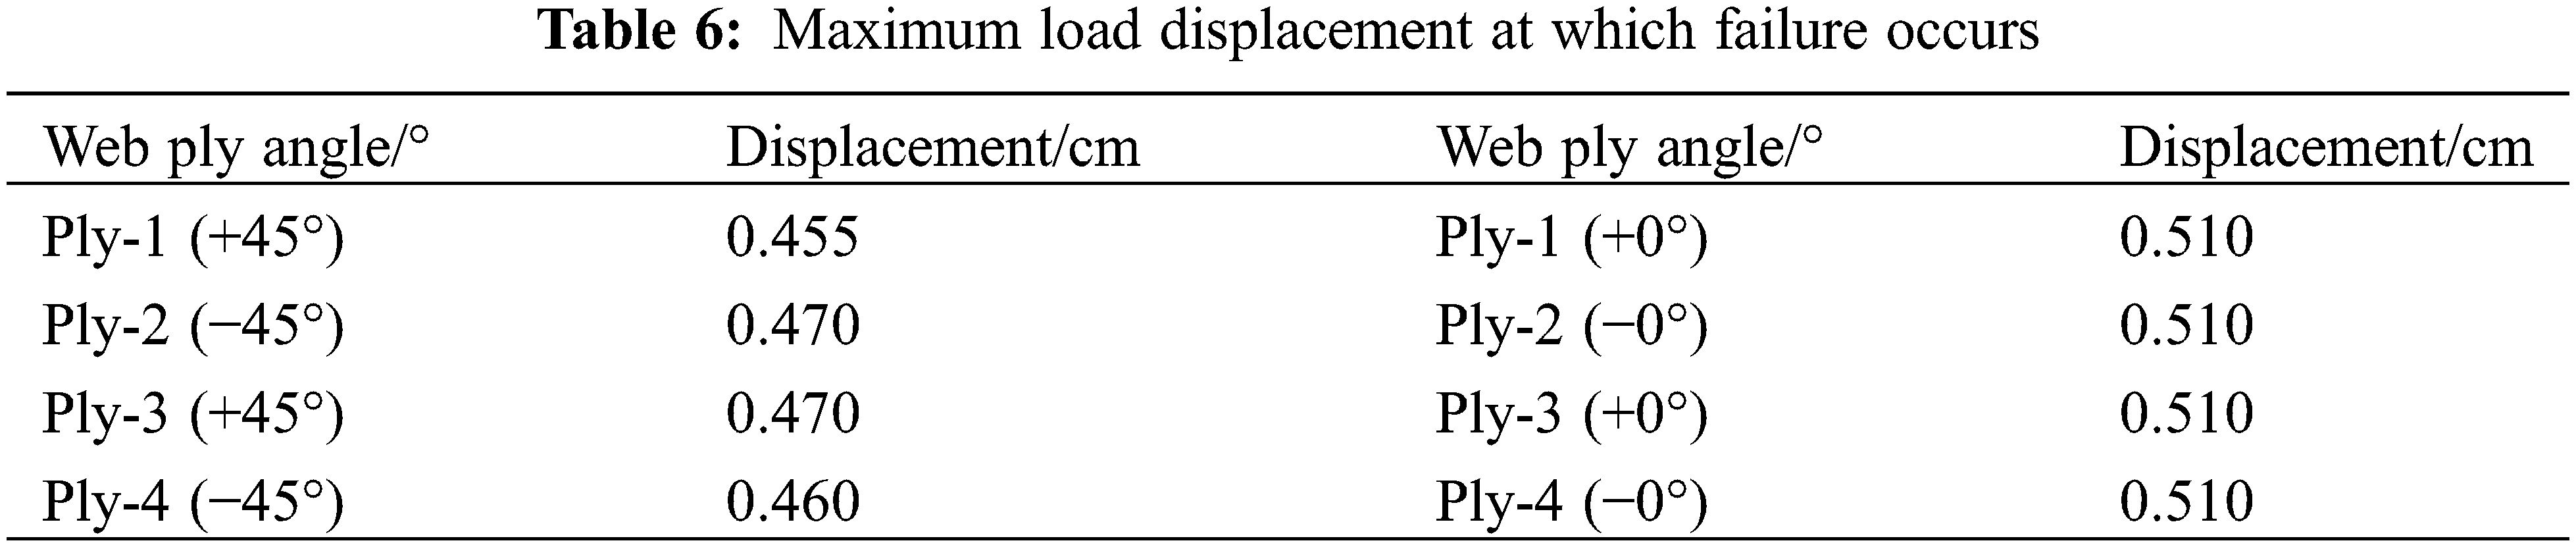
Comparing Figs. 14 and 16, the maximum stress that the ±45° ply group of the shear-resistant web structure can withstand is greater than that of the 0° ply group, as shown in Tables 5 and 6. In the 0° layer group, the displacement corresponding to the sudden drop in maximum stress is greater than in the ±45° layer group.
The static properties of shear-resistant webs of composite rectangular beams are concluded to be strongly related to the lay-up direction of the composite material. The transverse shear resistance of the ±45° lay-up group is significantly greater than that of the 0° lay-up group. In the longitudinal direction, the tensile and compressive properties of 0° lay-up are superior to those of ±45° lay-up. The arrangement of a small amount of 0° layer in the upper and lower flange layer can effectively improve the web’s axial tensile performance.
4.4 Simulation and Analysis of Dynamics of the Composite Rectangular Beam
4.4.1 Progressive Damage Analysis of Composite Rectangular Beam
The progressive damage analysis of the composite rectangular beam was conducted using the explicit dynamics analysis mode of Abaqus. At the loading points B and C depicted in Fig. 9, a 6-mm displacement load was applied, and its progressive damage analysis was performed using smooth loading, introducing the user-defined subroutine VUMAT, and setting the history output variables at the displacement-loaded rigid body’s reference point. Fig. 17 depicts the support reaction-displacement curves for the entire loading process.
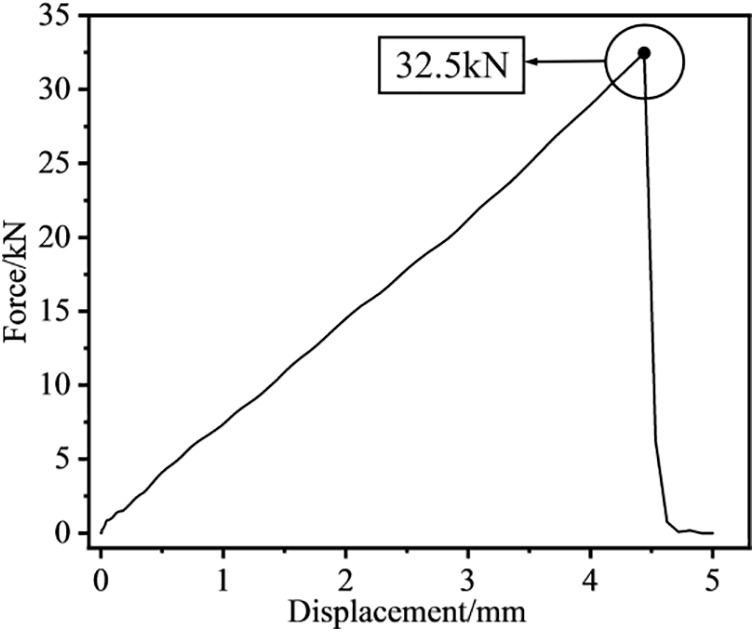
Figure 17: Main beam sub-structure reaction force-displacement loading curve
As shown in Fig. 17, the composite rectangular beam structure can withstand a maximum load of 32.5 kN. Before reaching this peak, the support reaction force and the loading displacement have a linear relationship; however, when the peak load is reached, the magnitude of the support reaction force abruptly changes and decreases rapidly. It can be determined that the rectangular beam will fail once the full displacement loading of 6 mm has been applied.
Fig. 18 depicts the progressive damage evolution occurring in each ply of the beam flange and web of the composite rectangular beam throughout the entire loading process.
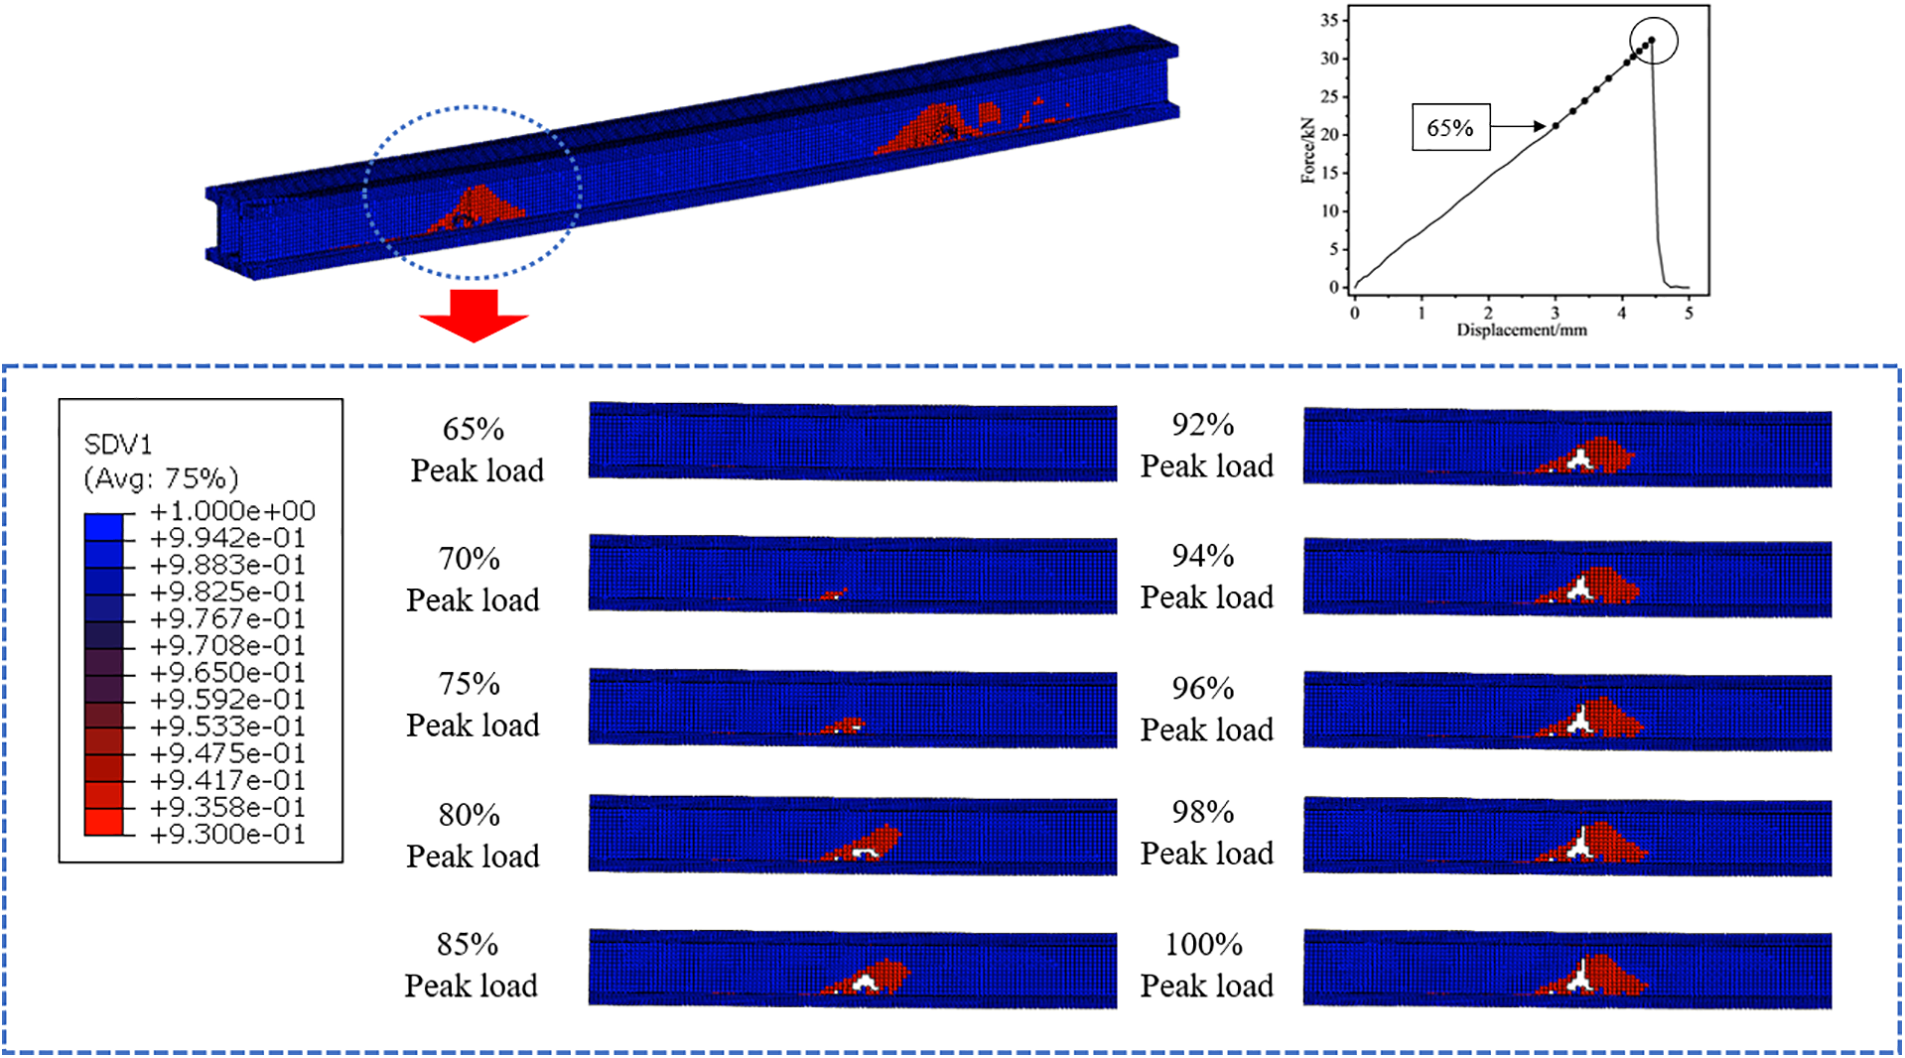
Figure 18: Progressive damage failure crack propagation of main beam sub-structure
According to the simulation results, the progressive damage failure of the composite rectangular beam manifests primarily as fiber tensile damage failure. Fig. 18 demonstrates that when the load reaches 65% of the peak load, the web structural unit of the composite rectangular beam experiences a slight decrease in stiffness, i.e., crack sprouting. When the load continues to increase until it reaches 75% of the peak load, a significant number of structural elements have already failed, i.e., the cracks have grown. The failure area of the structural element begins primarily between points A and B on the lower flange adhesive layer. Interfacial debonding of the adhesive layer occurs at this time, and the failed elements expands at a 45° angle in the direction of the upper flange and its adhesive area. The crack will continue to grow as the displacement load continues to increase. Until 85% of the peak load is reached, the progressive failure area does not expand upwards, but rather in the direction of a −45° angle, expanding in the direction of the lower flange and its adhesive area; the crack also extends in this direction. Due to the increase in the number of failed elements and the continuous expansion of cracks, when the load carrying capacity exceeds 90% of the peak load, the rectangular beam structure will be fatigue fractured and the entire structure will fail. Under fatigue cycle loading simulation, crack extension also showed great similarity. Consequently, the adhesive zone of the composite moment beam structure will experience fatigue damage under the fatigue load first.
4.4.2 Damage Failure in the Interface Adhesive Zone
From Section 4.4.1, it is clear that the progressive damage of the composite rectangular beam begins in the adhesive zone of the lower flange and shear web, where the damage is most evident. As shown in Fig. 19, the initial damage in the adhesive zone of the rectangular beam is analyzed.
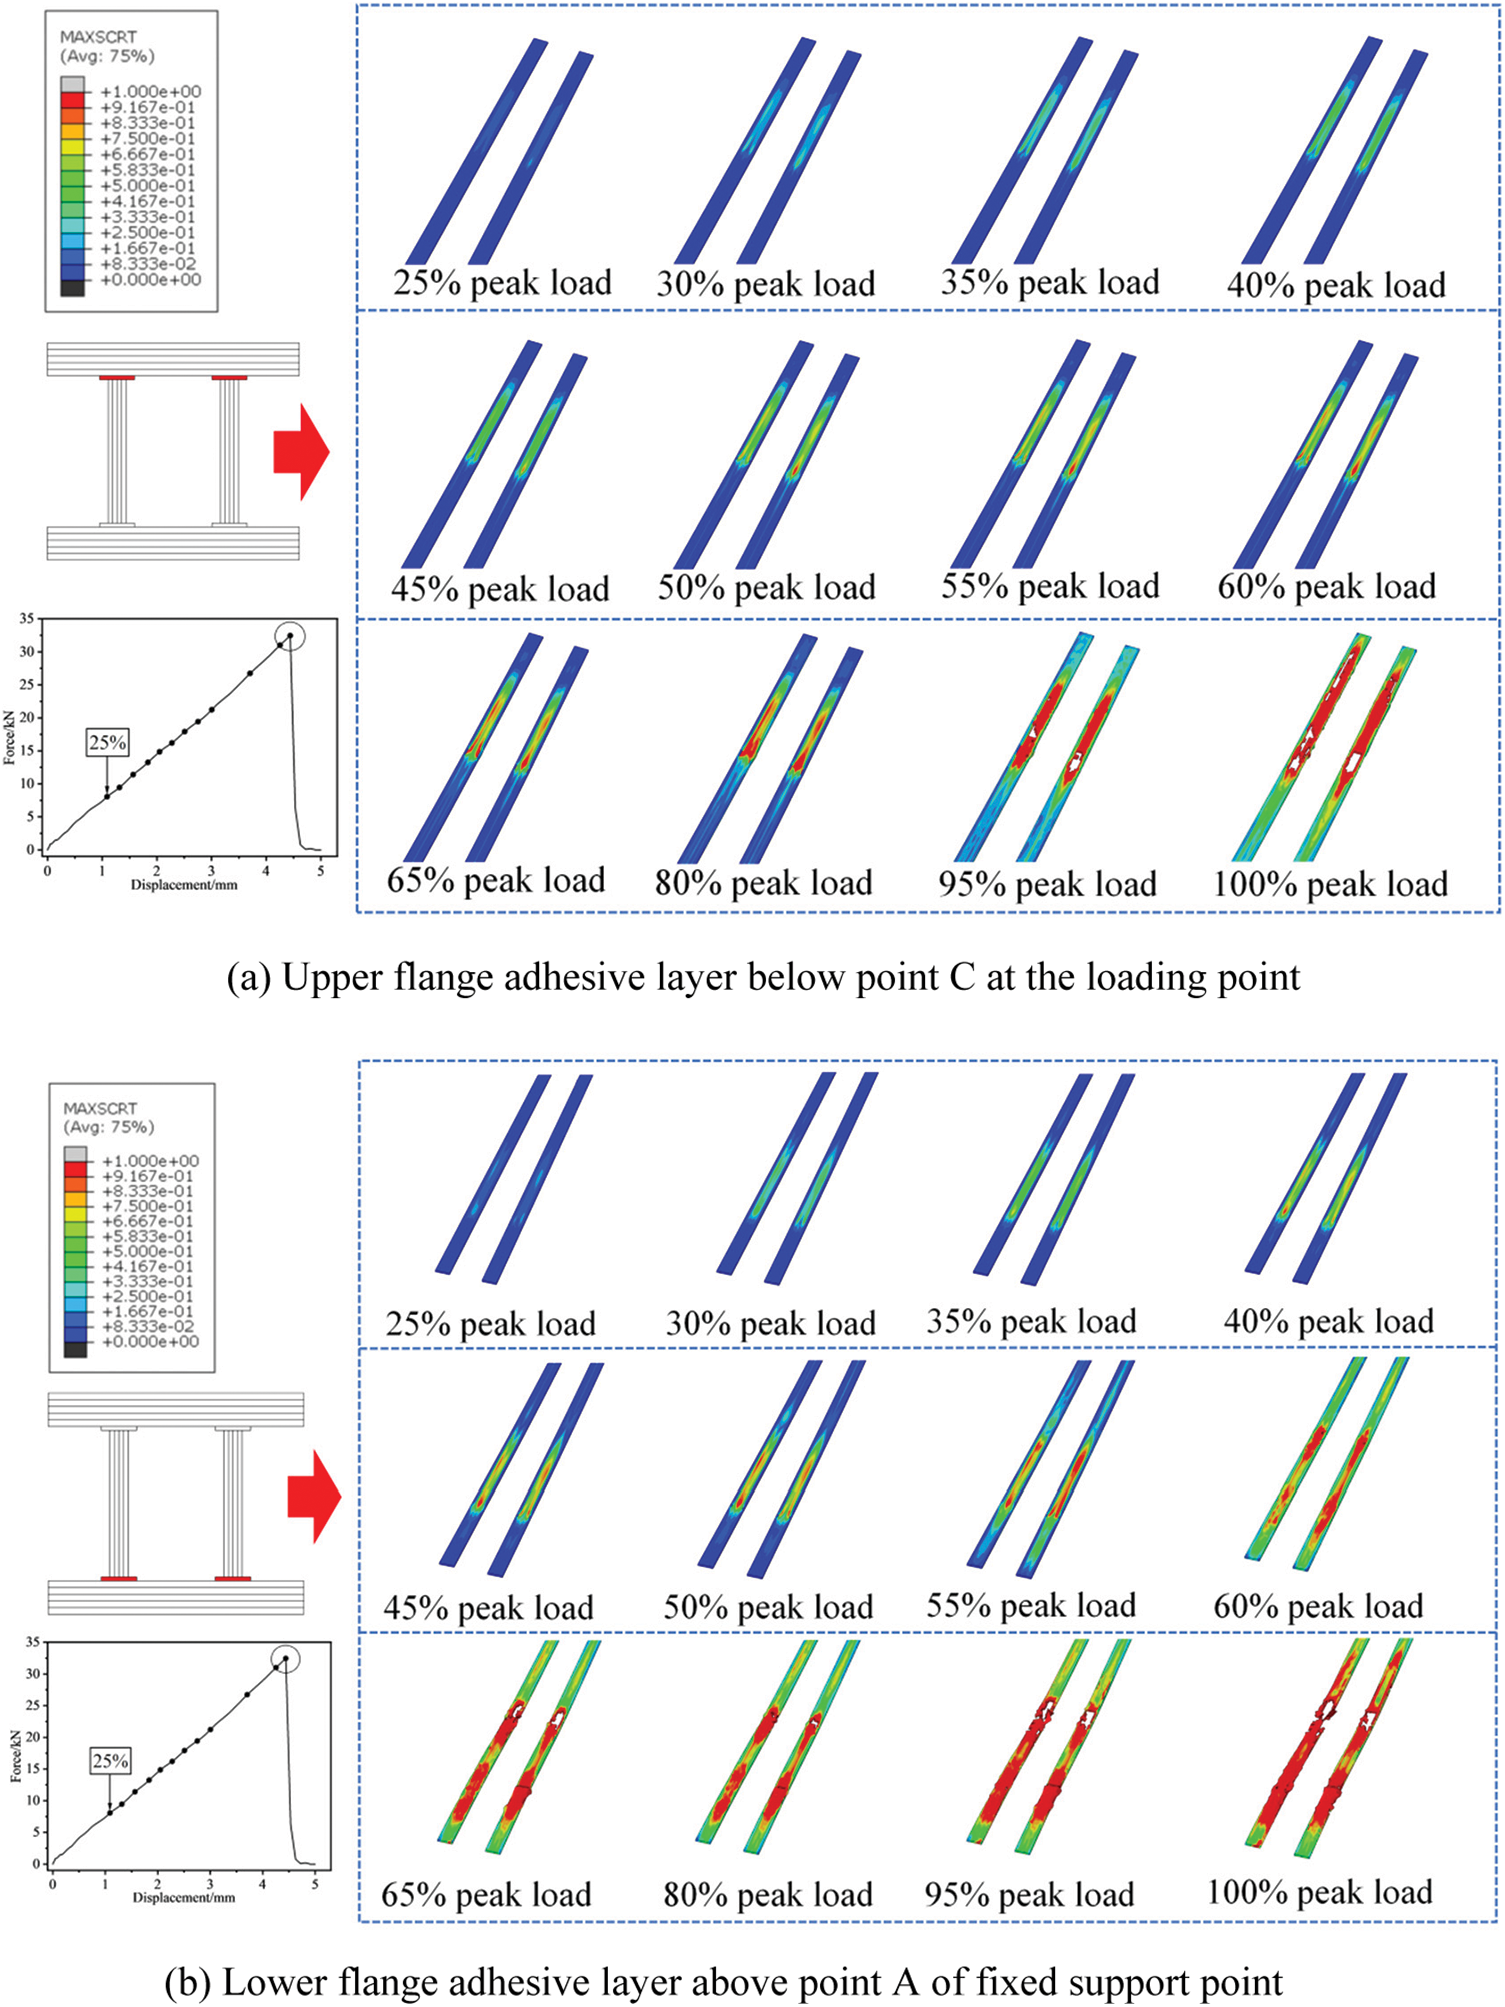
Figure 19: Damage initiation index of sub-structure adhesive zone of the main beam
Fig. 19 demonstrates that, following the maximum stress initial damage criterion, when the load reaches 25 percent of the peak value, the upper and lower flange adhesive layers of the composite rectangular beam begin to sustain damage simultaneously and the stiffness begins to degrade. The energy accumulated in the adhesive layer represented by the cohesive model increases as the load increases. As shown in Fig. 19b, the adhesive zone between the beam flange and the shear web above the fixed support end of the lower flange at points A and D fails first when the load reaches 65% of the peak load. The cohesion energy has reached the critical damage fracture energy and the damage evolution stage has begun. As the load continues to increase until it reaches the maximum load, the adhesive zone of the lower flange sustains increasingly severe damage. As depicted in Fig. 19a, when the load reaches 95% of the maximum load, certain structural elements of the upper flange adhesive layer begin to fail and enter the damage evolution stage. Their damage distribution is primarily concentrated in the region vertically downward from the two points B and C of the loaded thrust head, and the failure zone expands as the load increases. The overall damage distribution area of the lower flange is larger than that of the upper flange, so crack expansion is more likely to occur in the adhesive zone of the lower flange, and the damage is also more severe. In conclusion, the lower flange adhesive zone of the composite rectangular beam structure is the weakest area.
This paper begins with an investigation into the fatigue performance of composite material blade main beam structures. Using a rectangular blade main beam structure as the simulation object, a composite material rectangular beam structure with beam flange, web, and the adhesive layer was designed. Based on the theory of composite material fatigue damage and the technology of finite element simulation, static and dynamic analyses were performed to investigate the progressive damage evolution law of the rectangular composite material beam. The following inferences have been made:
1. The web lay-up angles of composite rectangular beams have a close relationship with their static properties. Under the same loading conditions, it is preferable to adopt a lay-up angle of ±45° for the web structure to effectively increase the static load-carrying capacity of the composite rectangular beam.
2. In the process of progressive damage, the composite rectangular beam has a maximum load capacity of 32.5 kN, and its progressive damage law states that at 65% of the peak load, some of its structural elements will have initial damage, crack sprouting, and stiffness degradation; with the gradual increase of the load, the crack expands rapidly, and the stiffness decreases noticeably; and when the peak load is reached, some structural elements experience complete failure and lose all stiffness. When the peak load is reached, some of the structural elements will fail and lose their load capacity until the composite rectangular beam’s entire structure fails due to fatigue.
3. Under fatigue loading, the composite rectangular beam structure’s lower flange adhesive zone is the structure’s weakest area.
In summary, the probably point of failure under fatigue loading may be accurately depicted by the static numerical model, which is important for future proposals of new structures, the design of the number of layers and lay-up angle of composite laminates, and the improvement of the test equipment. The simplified main beam sub-structure has the benefits of high calculation speed and good convergence, which can significantly reduce the time and cost incurred by thorough experiments, provide the prediction and trend of structural design viability, and provide a rapid and indirect evaluation of the mechanical properties and fatigue damage mechanism of actual blades as a benchmark method.
Acknowledgement: The authors thank the journal editor and reviewers for their valuable comments, as well as all members and colleagues for their support and dedication to this work.
Funding Statement: This work is supported by the Science and Technology Programs of Gansu Province (Grant Nos. 21JR1RA248, 23YFGA0050), the Young Scholars Science Foundation of Lanzhou Jiaotong University (Grant Nos. 2020039, 2020017), the Special Funds for Guiding Local Scientific and Technological Development by the Central Government (Grant No. 22ZY1QA005), the National Natural Science Foundation of China (Grant No. 72361019), and the Gansu Provincial Outstanding Graduate Students Innovation Star Program (Grant No. 2023CXZX-574).
Author Contributions: The authors confirm contribution to the paper as follows: study conception and design: Haixia Kou; analysis and interpretation of results: Bowen Yang; draft preparation: Haixia Kou, Xuyao Zhang and Xiaobo Yang; data collection: Bowen Yang and Haibo Zhao. All authors reviewed the results and approved the final version of the manuscript.
Availability of Data and Materials: The authors confirm that the research methods and resulting data used have been presented in the article.
Conflicts of Interest: The authors declare that they have no conflicts of interest to report regarding the present study.
References
1. Sahu, B. K. (2018). Wind energy developments and policies in China: A short review. Renewable and Sustainable Energy Reviews, 81(1), 1393–1405. [Google Scholar]
2. Adnan, M. (2022). 123-Metre wind turbine blade rolls out in China. https://www.offshorewind.biz/2022/09/07/123-metre-wind-turbine-blade-rolls-out-in-china/ (accessed on 16/01/2024). [Google Scholar]
3. Thomas, L. J., Ramachandra, M. (2018). Advanced materials for wind turbine blade-A review. Materials Today: Proceedings, 5, 2635–2640. [Google Scholar]
4. Cai, X., Pan, P., Zhu, J., Gu, R. R. (2014). Wind turbine blade. Beijing: China Water Power Press (In Chinese). [Google Scholar]
5. Mohamad, E. A., Christopher, N., James, S., Peter, A. (2018). Scaled composite I-Beams for subcomponent testing of wind turbine blades: An experimental study. Mechanics of Composite and Multi-Functional Materials, 6, 71–78. [Google Scholar]
6. Epaarachchi, J. A., Clausen, P. D. (2004). Accelerated full scale fatigue testing of a small composite wind turbine blade using a mechanically operated test rig. Structural Integrity and Fracture International Conference, pp. 111–117. Brisbane, Australia. [Google Scholar]
7. Asl, M. E., Niezrecki, C., Sherwood, J., Avitabile, P. (2017). Similitude analysis of thin-walled composite I-beams for subcomponent testing of wind turbine blades. Wind Engineering, 41(5), 297–312. [Google Scholar]
8. Rosemeier, M., Basters, G., Antoniou, A. (2018). Benefits of subcomponent over full-scale blade testing elaborated on a trailing-edge bond line design validation. Wind Energy Science, 3, 163–172. [Google Scholar]
9. Eder, M. A., Branner, K., Berring, P., Federico, B., Henrik, S. T. et al. (2015). Department of wind energy report, Experimental blade research-phase 2, pp. 1–109. Technical University of Denmark, Denmark. [Google Scholar]
10. Wang, H. S., Miu, W. P., Zhang, L., Li, C., Li, Z. H. (2023). Research on main girder web configuration of bend-twist coupling blade of large wind turbine with composite laying. Acta Energies Solaris Sinica, 44(3), 29–38 (In Chinese). [Google Scholar]
11. Jensen, F. M., Falzon, B. G., Ankersen, J., Stang, H. (2006). Structural testing and numerical simulation of a 34 m composite wind turbine blade. Composite Structures, 76(1), 52–61. [Google Scholar]
12. Sayer, F., Antoniou, A. E., Van Wingerde, A. (2012). Investigation of structural bond lines in wind turbine blades by sub-component tests. International Journal of Adhesion and Adhesives, 37, 129–135. [Google Scholar]
13. Kou, H. X. (2019). Research on stiffness degradation model of composite wind turbine blades (Ph.D. Thesis). Lanzhou University of Technology, China. [Google Scholar]
14. Zhao, D. H., Yang, J. Q., Meng, X. M., Zhang, D. P., Zhang, Z. C. (2022). Experimental study on flexural performance of novel pultruded sandwich spar caps of wind turbine blades. Acta Materiae Compositae Sinica, 39(11), 5264–5274 (In Chinese). [Google Scholar]
15. Zarouchas, D. S., Makris, A. A., Sayer, F., van Hemelrijck, D., van Wingerde, A. M. (2012). Investigations on the mechanical behavior of a wind rotor blade subcomponent. Composites Part B-Engineering, 43(2), 647–654. [Google Scholar]
16. Wang, J. W., Yan, S. J., Zhang, J. W., Gao, Z. Y. (2024). Analysis of stress and power characteristics of wind turbine blades and tower under dynamic wind direction change. Proceedings of the CSEE, 44(2), 610–620. (In Chinese). [Google Scholar]
17. Thapa, M., Missoum, S. (2022). Uncertainty quantification and global sensitivity analysis of composite wind turbine blades. Reliability Engineering & System Safety, 222(12), 108354. [Google Scholar]
18. Liu, J. W., Liu, P. F., Leng, J. X., Wang, C. Z. (2022). Finite element analysis of damage mechanisms of composite wind turbine blade by considering fluid/solid interaction. Part I: Full-scale structure. Composite Structures, 301(2), 116212. [Google Scholar]
19. Niu, J. J., Lu, B., Zeng, H. M. (2021). Research on control of adhesive layer of shear web for wind turbine blade. Wind Energy, 11, 118–123 (In Chinese). [Google Scholar]
20. Asl, M. E., Niezrecki, C., Sherwood, J., Avitabile, P. (2017). Experimental and theoretical similitude analysis for flexural bending of scaled-down laminated I-beams. Composite Structures, 176, 812–822. [Google Scholar]
21. Böhm, R., Gude, M., Hufenbach, W. (2010). A phenomenologically based damage model for textile composites with crimped reinforcement. Composites Science and Technology, 70(1), 81–87. [Google Scholar]
22. Camanho, P. P., Matthews, F. L. (1999). A progressive damage model for mechanically fastened joints in composite laminates. Journal of Composite Materials, 23, 2248–2280. [Google Scholar]
23. Brocks, W., Scheider, I. (2010). Identification of material parameters for structural analyses. Structural Durability & Health Monitoring, 6(3), 189–212. [Google Scholar]
24. Asl, M. E., Niezrecki, C., Sherwood, J., Avitabile, P. (2016). Design of scaled-down composite I-beams for dynamic characterization in subcomponent testing of a wind turbine blade. In: Shock & vibration, aircraft/aerospace, energy harvesting, acoustics & optics, vol. 9, pp. 197–209. Springer, Cham. [Google Scholar]
Cite This Article
 Copyright © 2024 The Author(s). Published by Tech Science Press.
This work is licensed under a Creative Commons Attribution 4.0 International License , which permits unrestricted use, distribution, and reproduction in any medium, provided the original work is properly cited.
 Downloads
 Citation Tools