 Open Access
ARTICLE
A Noise Reduction Method for Multiple Signals Combining Computed Order Tracking Based on Chirplet Path Pursuit and Distributed Compressed Sensing
School of Mechanical Engineering, Hebei University of Science and Technology, Shijiazhuang, 050018, China
* Corresponding Author: Guangfei Jia. Email:
Structural Durability & Health Monitoring 2023, 17(5), 383-405. https://doi.org/10.32604/sdhm.2023.026885
Received 30 September 2022; Accepted 24 May 2023; Issue published 07 September 2023
Abstract
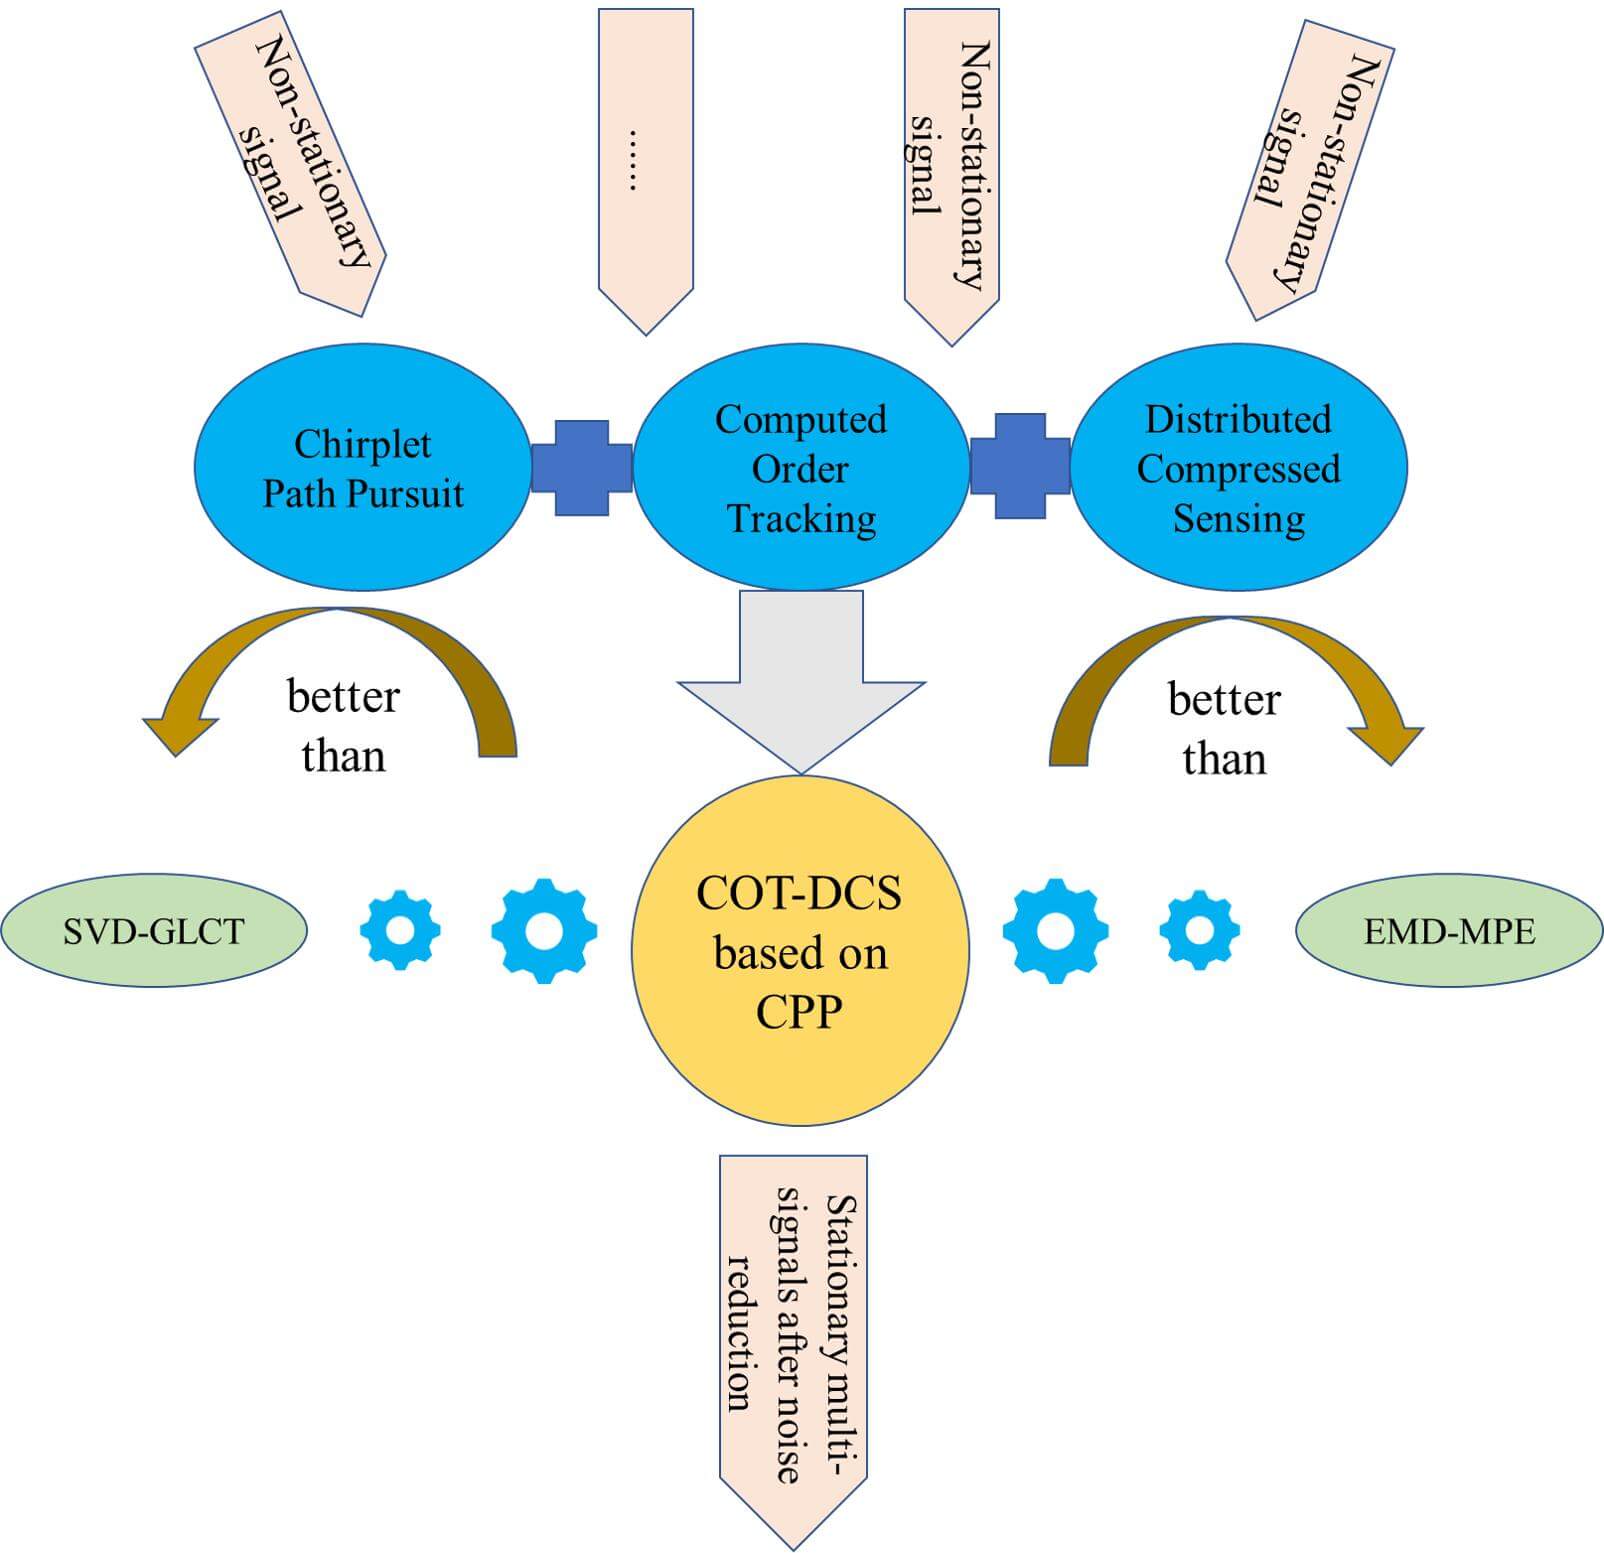
With the development of multi-signal monitoring technology, the research on multiple signal analysis and processing has become a hot subject. Mechanical equipment often works under variable working conditions, and the acquired vibration signals are often non-stationary and nonlinear, which are difficult to be processed by traditional analysis methods. In order to solve the noise reduction problem of multiple signals under variable speed, a COT-DCS method combining the Computed Order Tracking (COT) based on Chirplet Path Pursuit (CPP) and Distributed Compressed Sensing (DCS) is proposed. Firstly, the instantaneous frequency (IF) is extracted by CPP, and the speed is obtained by fitting. Then, the speed is used for equal angle sampling of time-domain signals, and angle-domain signals are obtained by COT without a tachometer to eliminate the nonstationarity, and the angledomain signals are compressed and reconstructed by DCS to achieve noise reduction of multiple signals. The accuracy of the CPP method is verified by simulated, experimental signals and compared with some existing IF extraction methods. The COT method also shows good signal stabilization ability through simulation and experiment. Finally, combined with the comparative test of the other two algorithms and four noise reduction effect indicators, the COT-DCS based on the CPP method combines the advantages of the two algorithms and has better noise reduction effect and stability. It is shown that this method is an effective multi-signal noise reduction method.Graphic Abstract
Keywords
The rotating machinery is an important mechanical equipment. As the core component of transmission machinery, the gearbox is vulnerable to damage, resulting in machine damage and accidents. Gearboxes are mostly in variable working conditions and are often used in situations with high working intensity and complex speed changes [1], such as automobile engines, aircraft, wind turbines, etc. In some cases, it is difficult to find out the damage and replace it frequently after the gearbox is damaged. The gears in the gearbox may have faults such as broken teeth, cracks, missing teeth and pitting corrosion. In order to obtain fault information as soon as possible when a fault occurs, the condition monitoring and diagnosis technology have gradually developed in the recent years [2]. The vibration signal is collected by the sensor, and the noise in the signal is removed by algorithms. Then the signal is analyzed and processed to obtain the features of the signal, and thus get the fault information of gearbox, in this way, the production costs can be reduced and the accidents can be avoided, it is of great significance to mechanical production.
The shaft, gear and bearing in the gearbox will generate vibration during operation, and the vibration signal is the carrier of gearbox fault features. Therefore, vibration signals processing methods have become a common method of mechanical condition monitoring and diagnosis [3]. However, the vibration signal of gearbox under variable working conditions contains a lot of noise and frequency components. Therefore, removing the noise from the collected signal has become an important problem in signal processing. In recent years, there have been many methods to achieve noise reduction and feature extraction of signals through a single sensor. With the development of technology, multi-signal collection and data processing are gradually applied in condition monitoring [4], which has attracted the attention of researchers. However, in signal pre-processing, there is little research on the noise reduction algorithm of multiple signals. Therefore, in order to solve this problem, a COT-DCS method based on CPP is proposed, which is applied to multi-signal denoising. This method first extracts the IF curve from the collected signal through the CPP, and uses the speed curve as the tacho pulse to calculate COT for the equal angle sampling, equal angle sampling can convert the time domain signal into the angle domain signal. Finally, the DCS is used to reduce the noise of the multiple-angle domain signals.
1.1 Chirplet Path Pursuit (CPP)
For the variable speed signal, it is an important processing step to obtain the speed signal to observe the speed change. When analyzing and processing the signal under time-varying working conditions, it is necessary to extract the IF or speed from the signal firstly. For the variable speed gearbox, the IF of the signal is also the meshing frequency of the gear. The speed can be obtained by dividing IF by the number of gear teeth. Therefore, it is necessary to extract the IF curve through some algorithms from the vibration signal under variable working conditions. In the early stage of speed tracking and extraction, the digital differential five-point formula method of numerical analysis was generally used to calculate the speed directly, but the accuracy of the speed by this method was very poor. At present, the commonly used method is to obtain the speed indirectly by obtaining the IF. In order to get IF, an IF estimation method based on the peak search was proposed by Guo Yu and their team [5], the time-frequency diagram is obtained first, and then the peak search method [6] is used to obtain the discrete IF from the diagram, and then the IF curve is obtained by fitting. However, the IF obtained by this method will have burrs, although the accuracy is better than the five-point rotational speed method, there is still a big gap with the real frequency.
The CPP algorithm which was put forward by Candès et al. [7] is used to adaptively obtain the signal component whose frequency changes in a curve by connecting the chirplet atoms in the chirplet diagram, and it has been applied in the analysis of seismic gravitational wave. In the recent ten years, the CPP has been introduced into the field of signal processing. For gearbox signals, this method can accurately estimate the gear meshing frequency and has strong noise resistance ability. Compared with the peak search algorithm, the CPP algorithm has higher frequency fitting accuracy and higher noise resistance ability.
In addition to proposing the algorithm, Candès and his team also detect highly oscillatory signals by CPP to verify the feasibility of the algorithm. In addition, Luo et al. [8] proposed a new gear fault detection technology based on Multi-Scale Chirplet Path Pursuit (MSCPP) algorithm and Fractional Fourier Transform (FrFT) method. Liu et al. [9] proposed a spectrum analysis method of multi-fault azimuth detection and demodulation based on CPP. Xu et al. [10] applied the method based on MSCPP and Linear Canonical Transform (LCT) to gear fault diagnosis under variable speed conditions at the first time. Based on CPP and sparse signals decomposition method, Peng et al. [11] proposed a sparse signal decomposition method based on MSCPP which is more suitable for the decomposition of multi-component non-stationary signals with time-varying frequency, and applied it to the gearbox the vibration signal. Luo et al. [12] proposed a new method of gear fault detection under time-varying speed, which is based on CPP and multi-scale morphological analysis. Luo et al. [13] also introduced a new IF estimation method based on Synchro Squeezing Transform (SST) and MSCPP. Because the Adaptive Time-varying Filter (ATF) based on Multi-scale Chirplet Sparse Signal Decomposition (MCSSD) will produce phase shift and signal distortion when used to separate multi-component non-stationary signals, Wu et al. [14] introduced the zero-phase filter into the filter and proposed a gearbox fault diagnosis method. Jiang et al. [15] also proposed an optimal chirplet method based on hybrid particle swarm optimization, which used the absolute value of the inner product of vibration signal and the chirplet basis function as the fitness function. Millioz et al. [16] proposed a correlation maximum chirp detection method based on iterative masking which is no need to recalculate the spectrum.
1.2 Computed Order Tracking (COT)
After being proposed and applied for an invention patent by Potter of HP in 1989, the COT was used to realize equal angle resampling instead of Hardware Order Tracking (HOT) which realizes equal angle sampling through analog equipment. The COT is a method to transform non-stationary signals in the time domain into stationary signals in the angle domain, there are two kinds of converted signals which are stationary and cyclostationary. At present, order tracking has been widely used in various fields, the monitoring of ducted fans and turbomachinery in the aerospace industry is a typical application scenario of this method. Truong et al. [17] used the Vold-Kalman filter order component technology to study the noise of propeller and duct fan, and the results are generally consistent with the large-scale fan test results conducted by NASA under transonic conditions. Chiang et al. [18] studied the dynamic characteristics of the turbomachinery system through the finite element analysis model, and used order tracking to obtain the critical engine speed of the test device when verifying the analysis results through the modal test and engine dynamic test.
The signal under variable speed conditions is non-stationary and nonlinear. Therefore, algorithms such as the Fourier transform cannot be directly used. The COT is an effective method for processing variable speed signals. The angle domain signal obtained after conversion by COT is stable so that some traditional signal processing methods can continue to be used. Different from HOT, the COT only needs to use the device to collect the speed pulse of the reference shaft to calculate the equal angle time, but sometimes it does not have the conditions to collect the pulse signal. Therefore, the COT is generally divided into COT with and without a tachometer whose difference is whether the speed pulse of reference shaft is collected. Li et al. [19] realized the quasi-steady state component separation in the angle domain and the shock resonance component extraction in the time domain based on order analysis technology with a tachometer and without it. Wu et al. [20] proposed an improved TLOT method based on Nonlinear Compensated Demodulation Transform (NCDT) for fault diagnosis in mechanical extreme condition monitoring. Schmidt et al. [21] proposed a TLOT method which can accurately estimate the phase of the axis of interest in the presence of large angular acceleration and noise, and the estimated instantaneous phase is used to resample the vibration signal from the time domain to the angle domain. Besides, Wang et al. [22] also proposed a method for time-varying fault diagnosis of rotating machinery based on TLOT and deep learning. Walker et al. [23] applied a case study based on actual wind turbine bearing data to prove that the combination of adaptive resampling and sequential tracking is simple and intuitive to diagnose the fault of low-speed non-stationary bearing. Koli et al. [24] used COT to resample the vibration signal sampled at a constant time into a constant angle sampling signal. Combined with the working characters of Rolling Mill Gearbox (RMG), Liu et al. [25] proposed a convenient and low-cost order analysis method to realize the rapid analysis of the running state of the gearbox. Yang et al. [26] proposed a fault-weak feature extraction scheme combining envelope sequence tracking and constrained Independent Component Analysis (cICA) with COT to transform the envelope from the time domain to the angle domain. Combined with the signal resampling technology based on COT, Wei et al. [27] used the vibration response under scanning excitation to diagnose the crack state of the beam. Ouadine et al. [28] applied a method based on order tracking signal analysis and a genetic algorithm to detect flight or ground faults implemented on the helicopter computer.
1.3 Distributed Compressed Sensing (DCS)
In the field of multi-signal collection and data fusion, Multiple Measurement Vectors (MMV) models is usually used to process multiple signals. He et al. [29] proposed a sparse global navigation satellite system (GLONASS) signal acquisition method based on compressed sensing and MMV, which can reduce the storage space and energy loss of data transmission. He et al. [30] proposed a sparse Bayesian learning method based on a multi-channel mode coupling hierarchical Gaussian prior model for MMV to solve the complex problem that is a high-resolution inverse synthetic aperture radar (ISAR) imaging task of fast rotating targets. The DCS model is also one of the MMV models. In recent twenty years, an emerging theory called Compressed Sensing (CS) has been put forward in the signal sparsity field by Donoho in 2004. In order to solve MMV problem, based on compressed sensing theory and the idea of distribution, combining CS [31] and Distributed Source Coding (DSC) [32], Baron et al. [33] introduced a new theory for DCS and enabled new distributed algorithms for multi-signal ensembles in 2005.
Torkamani et al. [34] used wavelet transform as sparse transform and proposed a Bayesian DCS algorithm based on wavelet which considered the scale dependence between wavelet coefficients and the correlation between signals. Wen et al. [35] proposed a new data collection method called Decentralized Distributed Compressed Sensing (DDCS) whose performance is better than traditional DCS. Chen et al. [36] proposed a new distributed compressed video sensing scheme which is a new key frame reconstruction scheme to reduce computational complexity and improve the quality of keyframes. Zheng et al. [37] also proposed a new distributed compressed video sensing scheme to meet the requirements of low encoder complexity and high coding efficiency in the new scene. Torkamani et al. [38] proposed a new Bayesian decentralized algorithm which is a model-based DCS so that a single signal structure can be used, its recovery performance is better than the existing technology. Jahanshahi et al. [39] developed an adaptive sensing framework based on sparse order, and a joint reconstruction method is proposed by using a DCS scheme at the decoder side. Chen et al. [40] proposed a new algorithm called Backtracking-Based Adaptive Orthogonal Matching Pursuit for block Distributed Compressed Sensing (DCSBBAOMP) to achieve perfect reconstruction performance.
2 Basic Principles of COT-DCS Based on CPP
The multi-scale chirplet primitive function library adopted by the CPP algorithm is as follows:
where:
The idea of CPP is to use chirplet atoms in the primitive function library to approximate the time domain analysis signal, use the linear combination of these chirplet atoms to estimate the signal, and connect the corresponding lines of each atom segment by segment to approximate the IF curve. According to this theory, we can find the core problem of the CPP algorithm: the connection of chirplet atoms and the selection of chirplet atoms. Among them, the selection of chirplet atoms can be realized by drawing a chirplet diagram. The chirplet diagram obtained by calculating a signal mixed with colored noise is shown in Fig. 1.
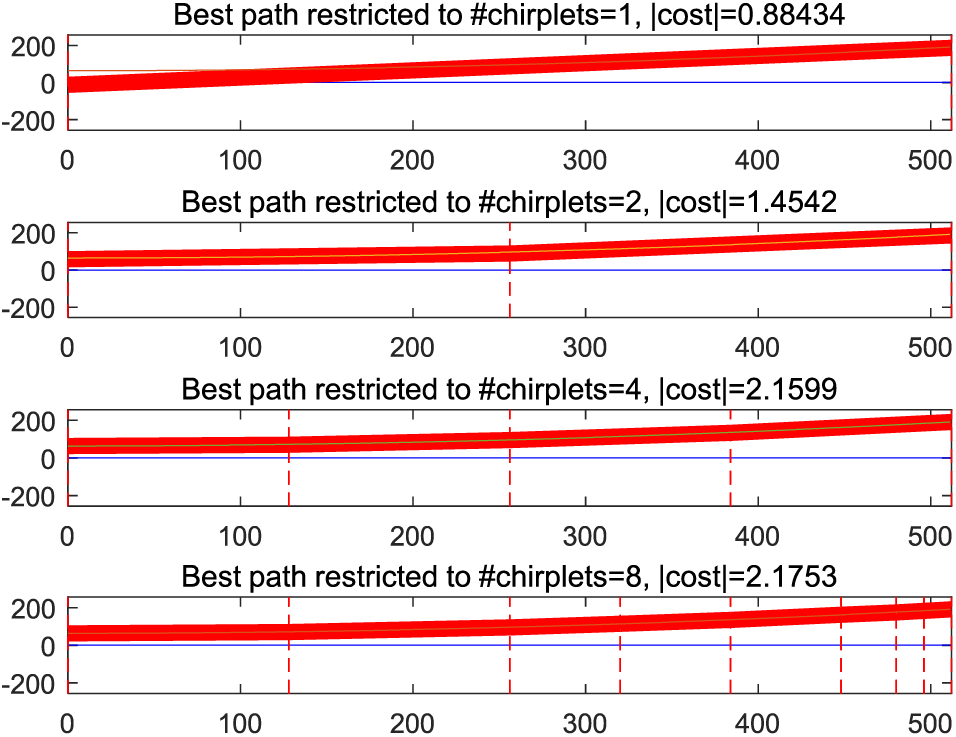
Figure 1: A chirplet diagram
Chirplet atoms have linear IF
(1) Initialization.
(2) For each element
There is
2.2 Order Tracking: Equal Angle Sampling
COT is essentially to convert the time-domain signal sampled by Shannon-Nyquist sampling theorem into angle-domain signal. Different from HOT, the equal angle sampling for COT calculation only needs a tachometer. The equipment collects the speed pulse signal of the axis with equal time interval to calculate the equal angle time, then the interpolation algorithm is used to interpolate and fit the resampling time to obtain the final angle domain signal.
The calculation formula of order ratio
where:
The order tracking calculation requires a total of two filters, anti-aliasing filter and low-pass filter. Since the definition of order is obtained from frequency, anti-aliasing filter is to use Shannon-Nyquist sampling theorem to process firstly to prevent frequency aliasing. The angle domain resampling for COT is similar to the time domain signal sampling, and the angle domain sampling theorem is also similar to the time domain sampling theorem, corresponding to the time domain sampling frequency, the angle domain sampling theorem is:
where:
The maximum order of the signal can be limited by low-pass filtering, and the highest order is determined by the cut-off frequency
The angle sampling rate can be calculated from the maximum order of the signal. If the reference axis is uniformly accelerated for a short time period, the angle of rotation
where:
The three coefficients
By using the coefficient, we can obtain the equal angle time
where,
2.3 Distributed Compressed Sensing
CS is a new sampling method, which is different from the traditional Shannon-Nyquist sampling. The principle is: as long as the signal is sparse on the sparse basis, the signal can be projected from high dimension to low dimension space through the measurement matrix, and the original signal can be reconstructed from the projection by solving the optimization problem in the end. It can be seen that the three important steps of compressed sensing are: sparse representation of signal, selection of measurement matrix and solution of optimization problem.
The sparsity or compressibility of the signal is the premise of the application of the compression sensing theory. Therefore, compressed sensing is completed based on the signal sparsity theory. If a signal
where:
where:
If the original signals
If the sparse bases of the original signals whose sparsity are all K are the same, then the JSM-2 model can be used:
where:
Same as JSM-1 model, except that
The residual
where:
Due to the good data processing ability of DCS, it is introduced into multi-signal noise reduction. However, mechanical equipment often operates under variable speed conditions, the collected signals are also non-stationary and nonlinear due to the impact of speed, which affects the noise reduction effect. To eliminate this impact, preprocessing is carried out by COT before DCS processing. However, to calculate order tracking, it is necessary to calculate the pulse trigger time through the tacho pulse to obtain the resampling time. Therefore, CPP is used to extract the speed from the original signal and use it for COT calculation. The steps of the algorithm which is COT-DCS based on CPP method are:
(1)To prevent too much signal data from taking too long to calculate the sparse matrix, a segment of the vibration signal data is intercepted as the original signal in the time domain.
(2)Pre analyze one of the signals to determine
(3)The speed pulse is obtained through CPP, and the angle resampling time is calculated by angle domain sampling rate
(4)The obtained equal angle time sequence is interpolated with cubic spline to obtain angle domain signal.
(5)Perform steps (1) to (4) for other time domain signals to obtain respective angle domain signals.
(6)The JSM-2 model of DCS is used to compress the angle domain signal and obtain the measured value, which is then transmitted to the decoder.
(7)The SOMP algorithm is used to complete joint decoding at the decoding end, and the noise-reduced signal is successfully reconstructed.
In order to study the effect of CPP algorithm, a simple sine simulation signal
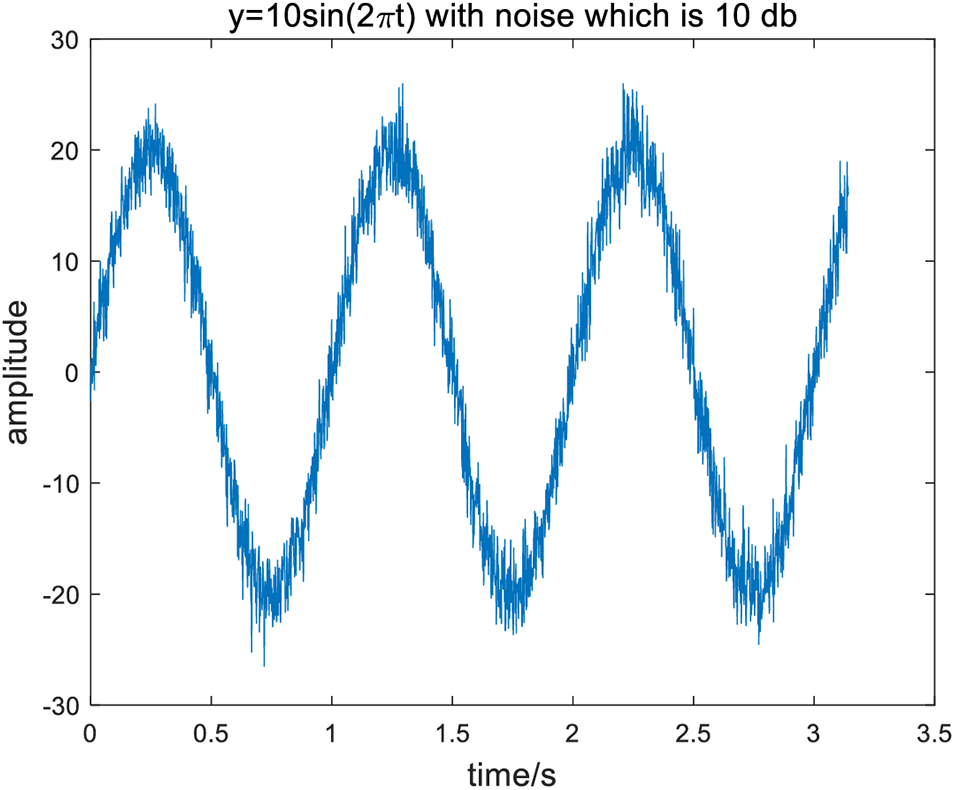
Figure 2: The mixed signal
Then try to extract the original sine signal from the mixed signal by using the CPP method. The best path pursuit algorithm of CPP calculates that the best path is the 8th path, and then the chirplet diagram obtained after fitting the IF is shown in Fig. 3. When the diagram is redrawn, the sine signal extracted from the mixed signal by CPP is shown in Fig. 4.
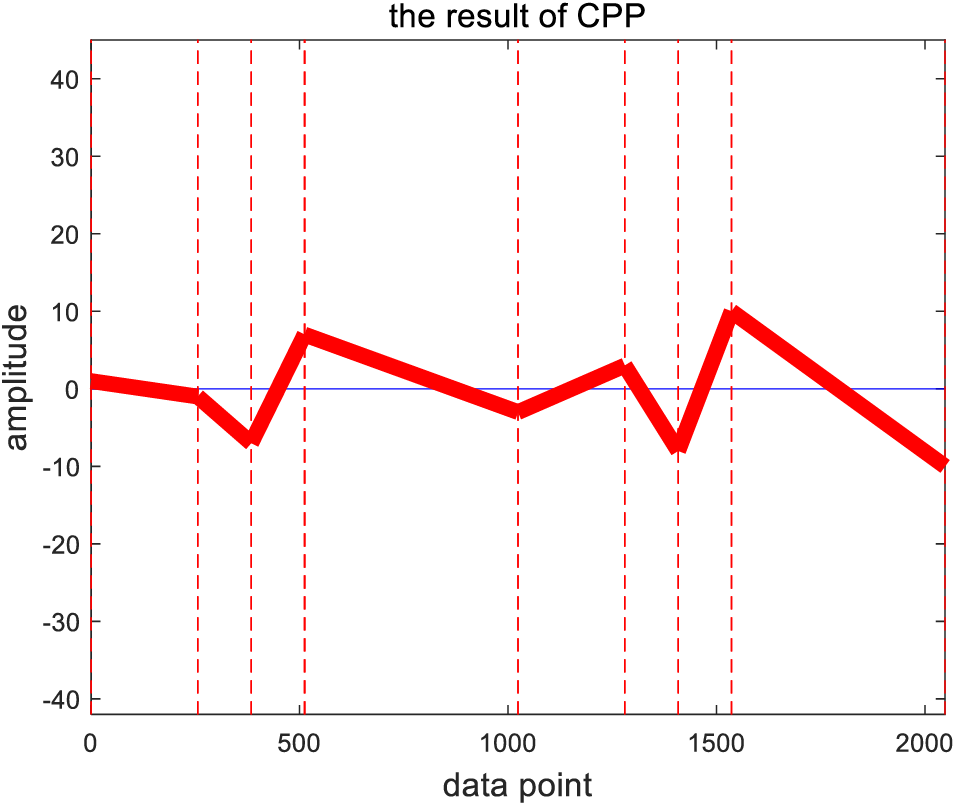
Figure 3: The chirplet diagram after calculated
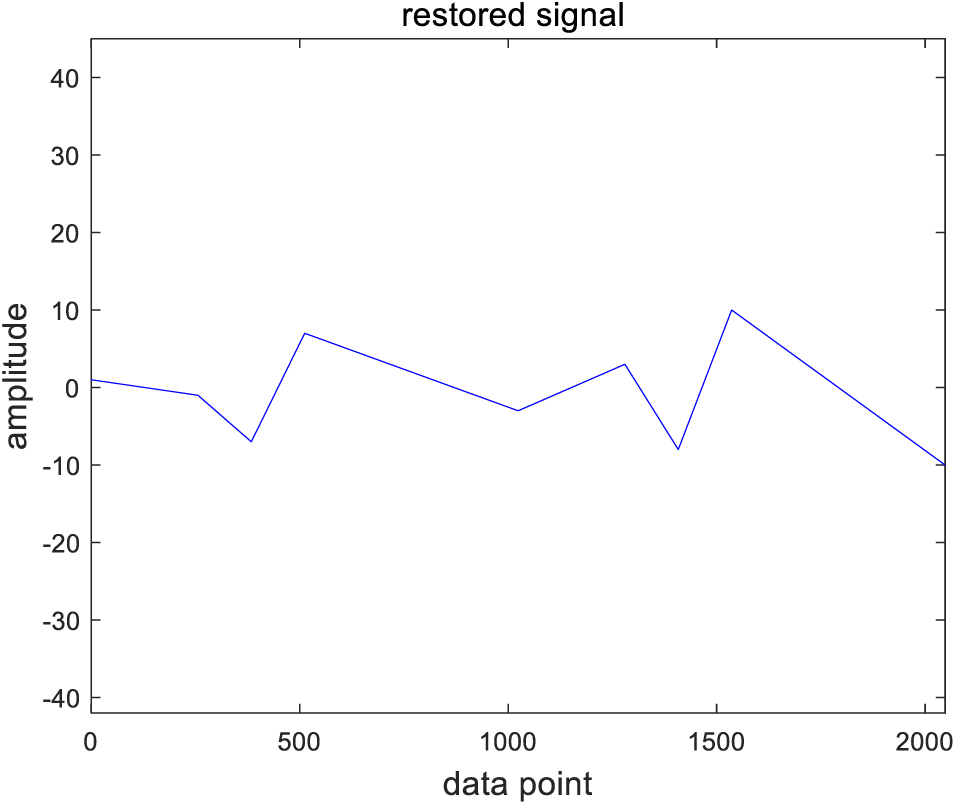
Figure 4: Sine signal from CPP
It can be seen from the figure that the signal extracted by CPP is close to the original signal in shape, and the maximum and minimum values of the sine signal can also be accurately reflected, which can indicate the effectiveness of the CPP algorithm. However, because the algorithm is more suitable for extracting the IF of non-stationary signals, the extraction effect of mixed noise sine signal is worse than that of non-stationary signal.
With the development of non-stationary signal fault diagnosis under variable speed condition, the International Conference on Condition Monitoring of Machinery in Non-stationary Operations (CMMNO) was held this years, and there is a contest from CMMNO14 in 2014 to make the most relevant diagnosis of a wind turbine operating. In order to study the processing effect of CPP method on non-stationary signals, the IF will be extracted from the sound signal of the contest under variable working conditions provided by Leclère et al. [41].
The signal is a non-stationary signal whose sampling frequency is 5000 Hz. Its time-domain signal image is shown in Fig. 5.
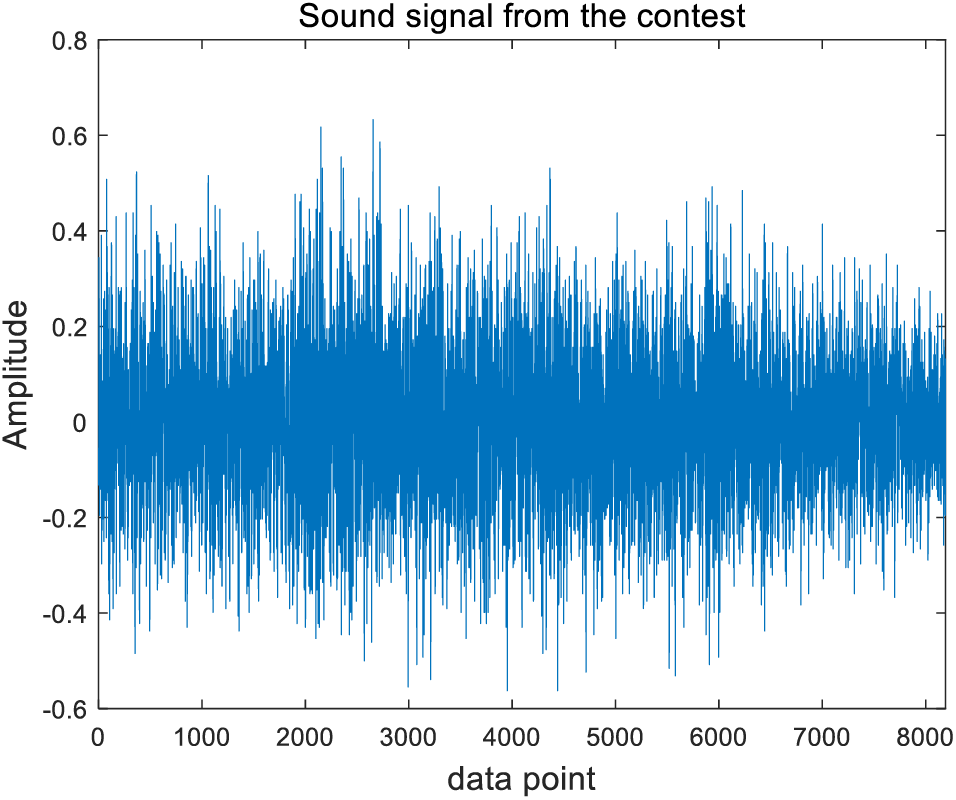
Figure 5: Signal in time domain
The speed of the signal will be tracked through CPP. Firstly, the chirplet diagram which contains the IF information is obtained, and then the IF curve is redrawn. In the competition, the unit of speed is rpm, so it is necessary to convert the amplitude of the IF diagram, and then divide it by the number of teeth to get the final speed diagram, as shown in Fig. 6.
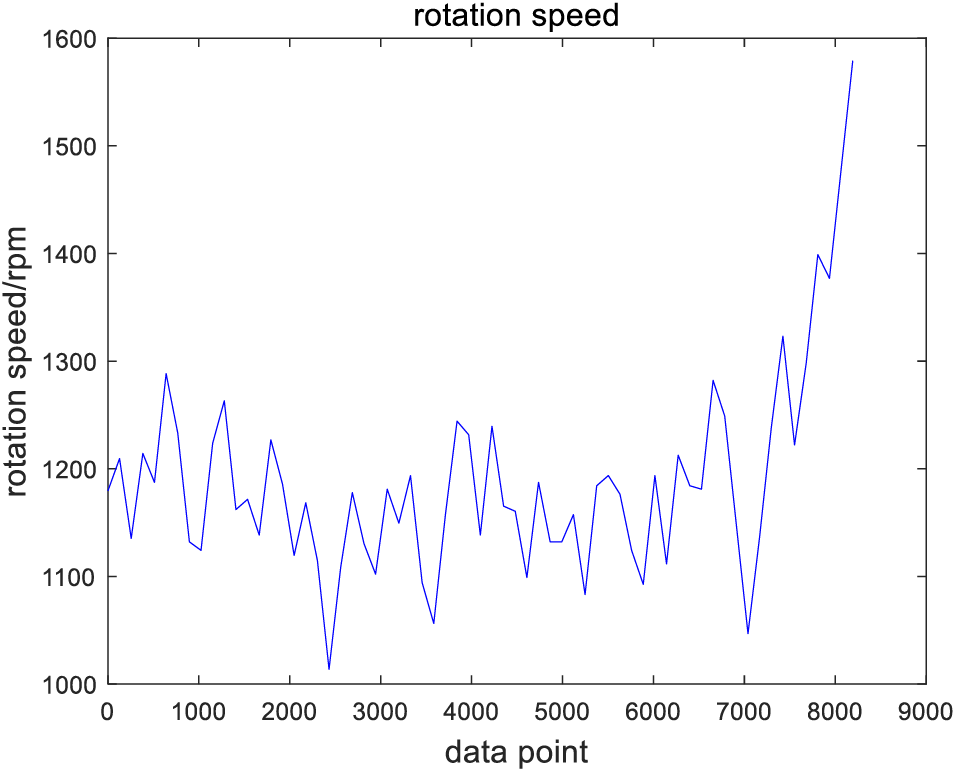
Figure 6: Speed curve by CPP
In order to study the accuracy of the speed curve obtained by CPP, it is compared with the real speed which is shown in Fig. 7.
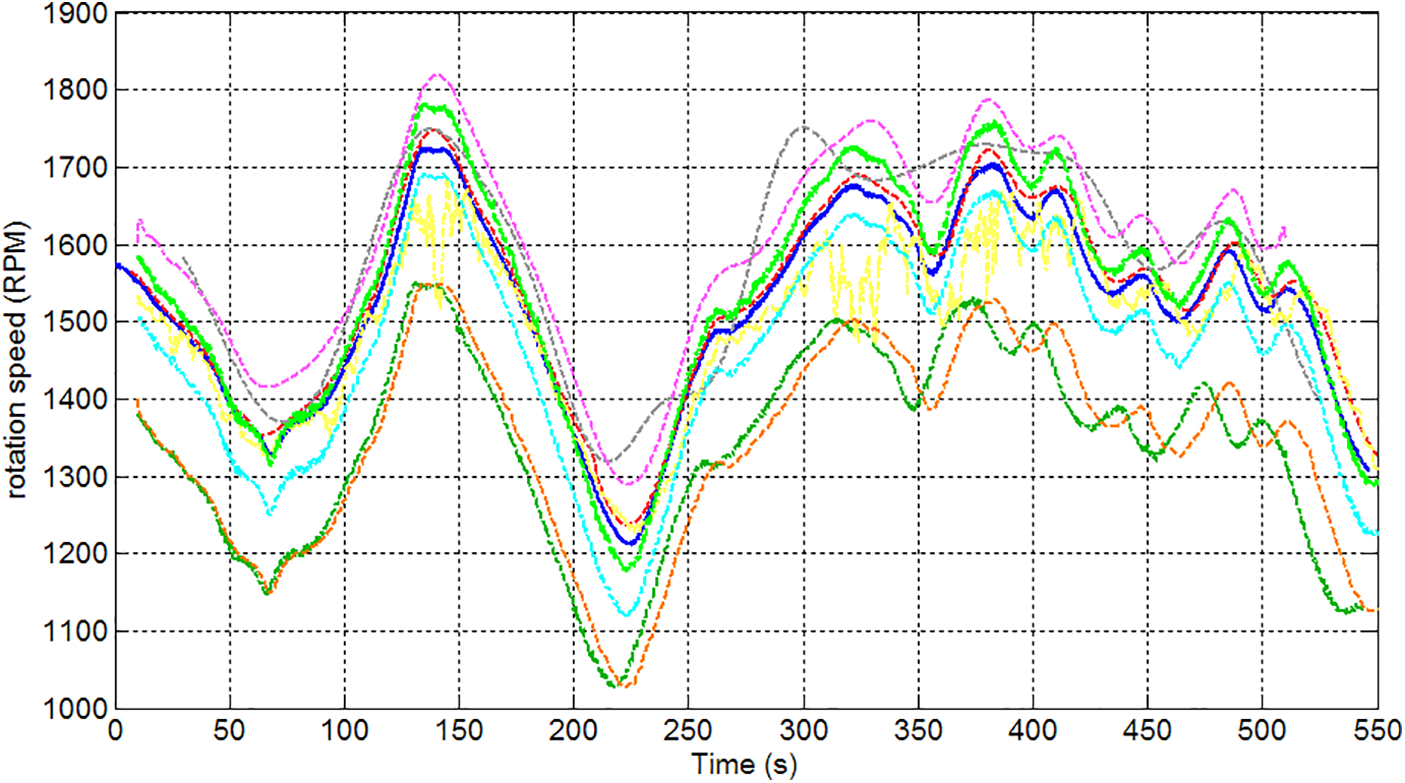
Figure 7: The real rotation speed
In Fig. 7, the deep blue curve represents the real tacho, and the other curves are the extracted results of each competitor in the contest. It can be seen from the comparison of results in Fig. 6 and the real tacho in Fig. 7 that the curve of CPP is closer to the actual speed in shape, and its amplitude is also in the range of 1000 to 1900 rpm, which is the same as that of the real speed. Therefore, the effectiveness of CPP can be verified in extracting the IF of non-stationary signals.
In order to further study the effect of CPP algorithm, it is compared with several existing methods of IF and speed extraction by the signal in Section 3.1.2 yet. Firstly, the speed is calculated by the earliest speed extraction method named five point formula of digital differentiation. The result is shown in Fig. 8.
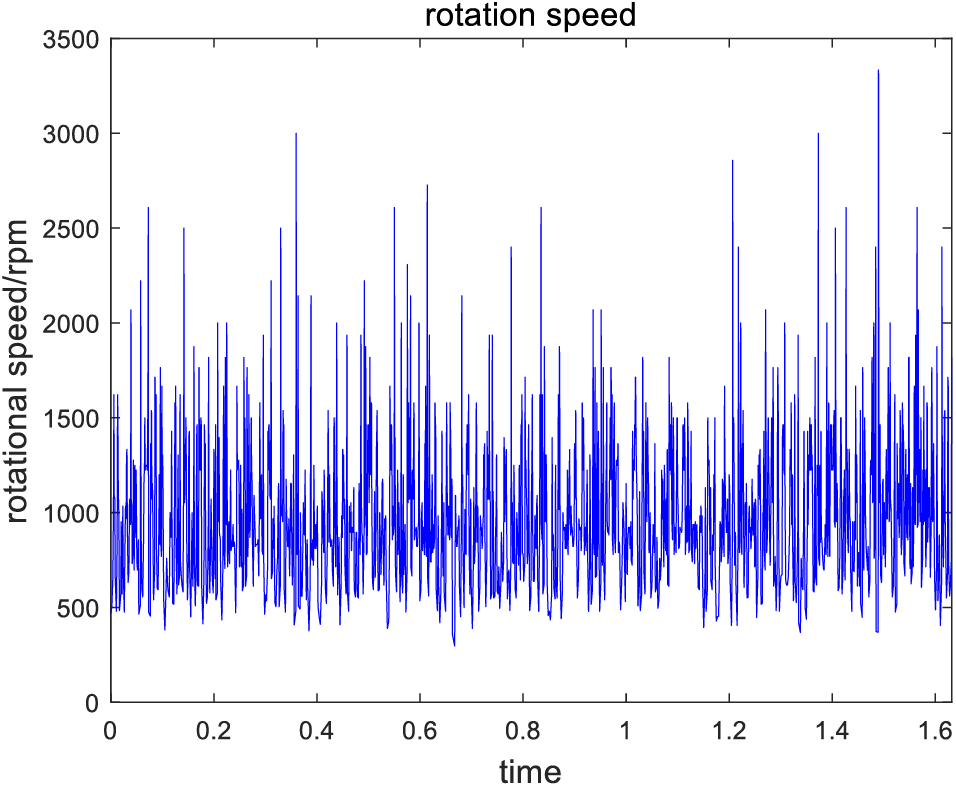
Figure 8: Speed by the five point formula
Then the IF is obtained by local peak search based on STFT. This method first obtains the time-frequency spectrum by STFT, and then extracts the IF curve from the graph by peak search algorithm. The speed is obtained by converting units and dividing by the number of teeth, as shown in Fig. 9.
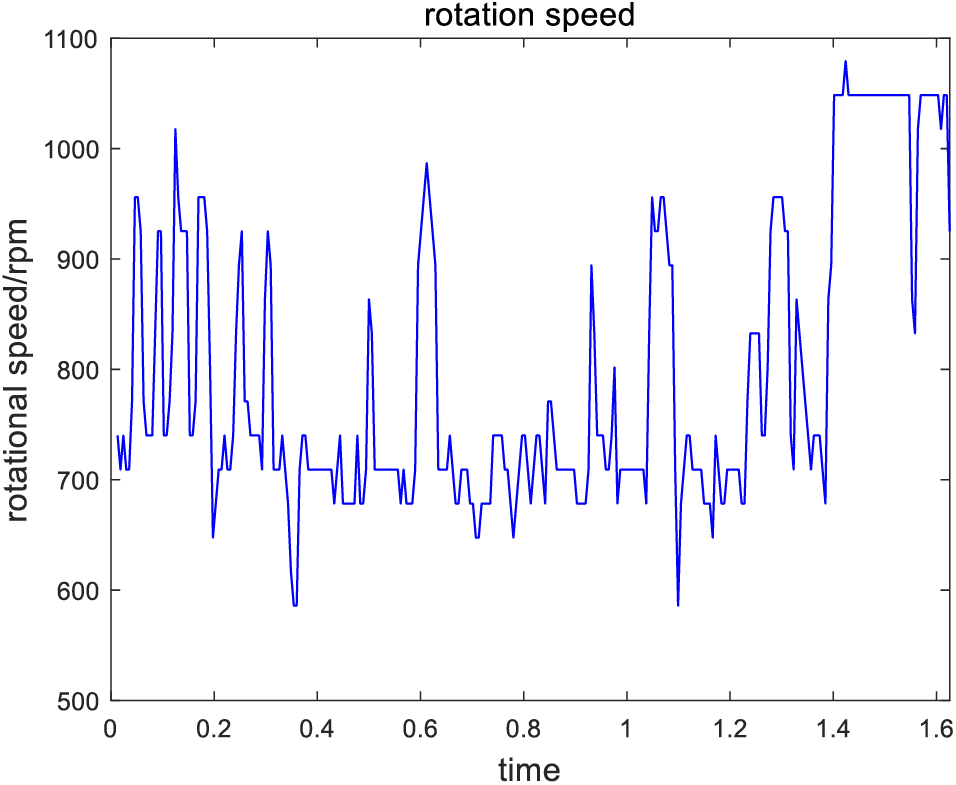
Figure 9: Speed by the local peak search
Viterbi algorithm is a maximum likelihood decoding algorithm proposed by Viterbi for Hidden Markov Model (HMM). The algorithm is applied to IF extraction, and the speed is obtained through processing which is shown in Fig. 10.
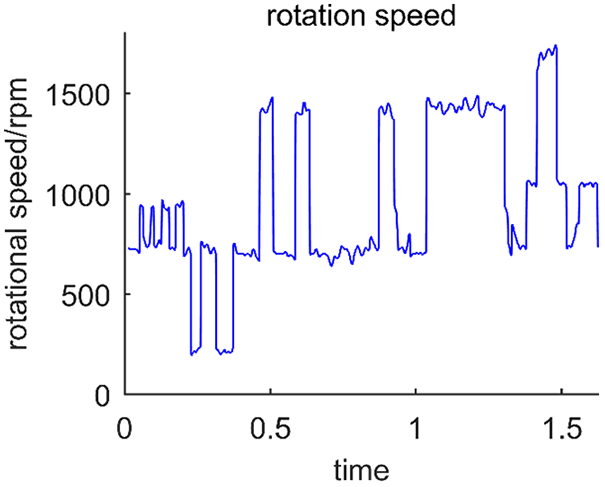
Figure 10: Speed by Viterbi
After comparing the results of the above three algorithms with that of Fig. 6 and the real speed, it is showed that the results of the digital differentiation method are inaccurate and cannot be used for speed extraction of non-stationary signals, the speed extracted by the other two methods is also close to the real speed from the shape, but both of them have burrs. The result of Viterbi algorithm is better than the peak search method whose result is greatly disturbed, and the burr phenomenon has a greater impact. However, the speed obtained by the CPP is almost no burrs, and its non-stationary nature makes it not vulnerable to the impact of variable speed conditions, which reflects the superiority of the algorithm.
3.2.1 Simulation and Experimental Study of COT
In order to study the effect of the COT algorithm, a simulation signal defined
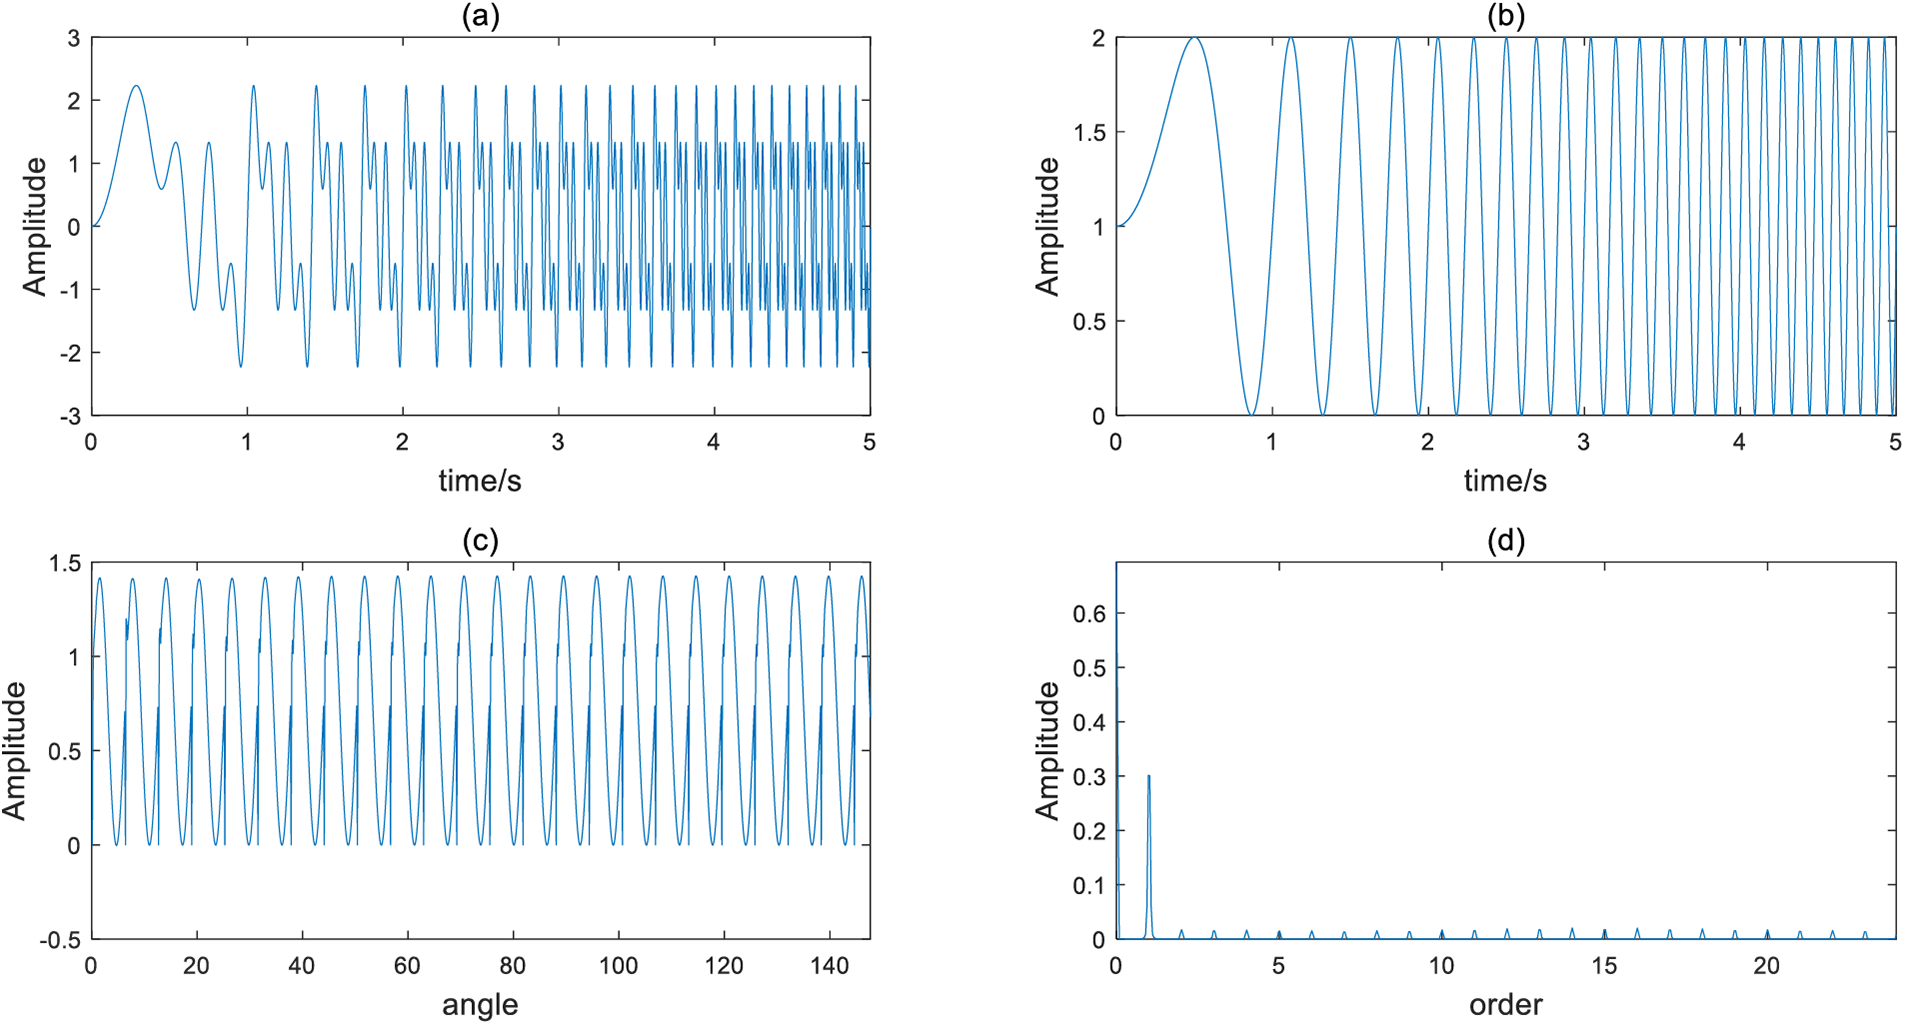
Figure 11: The results of COT simulation
Then the signal in Section 3.1.2 is still used for research object. Since the signal has no synchronous speed pulse, the signal
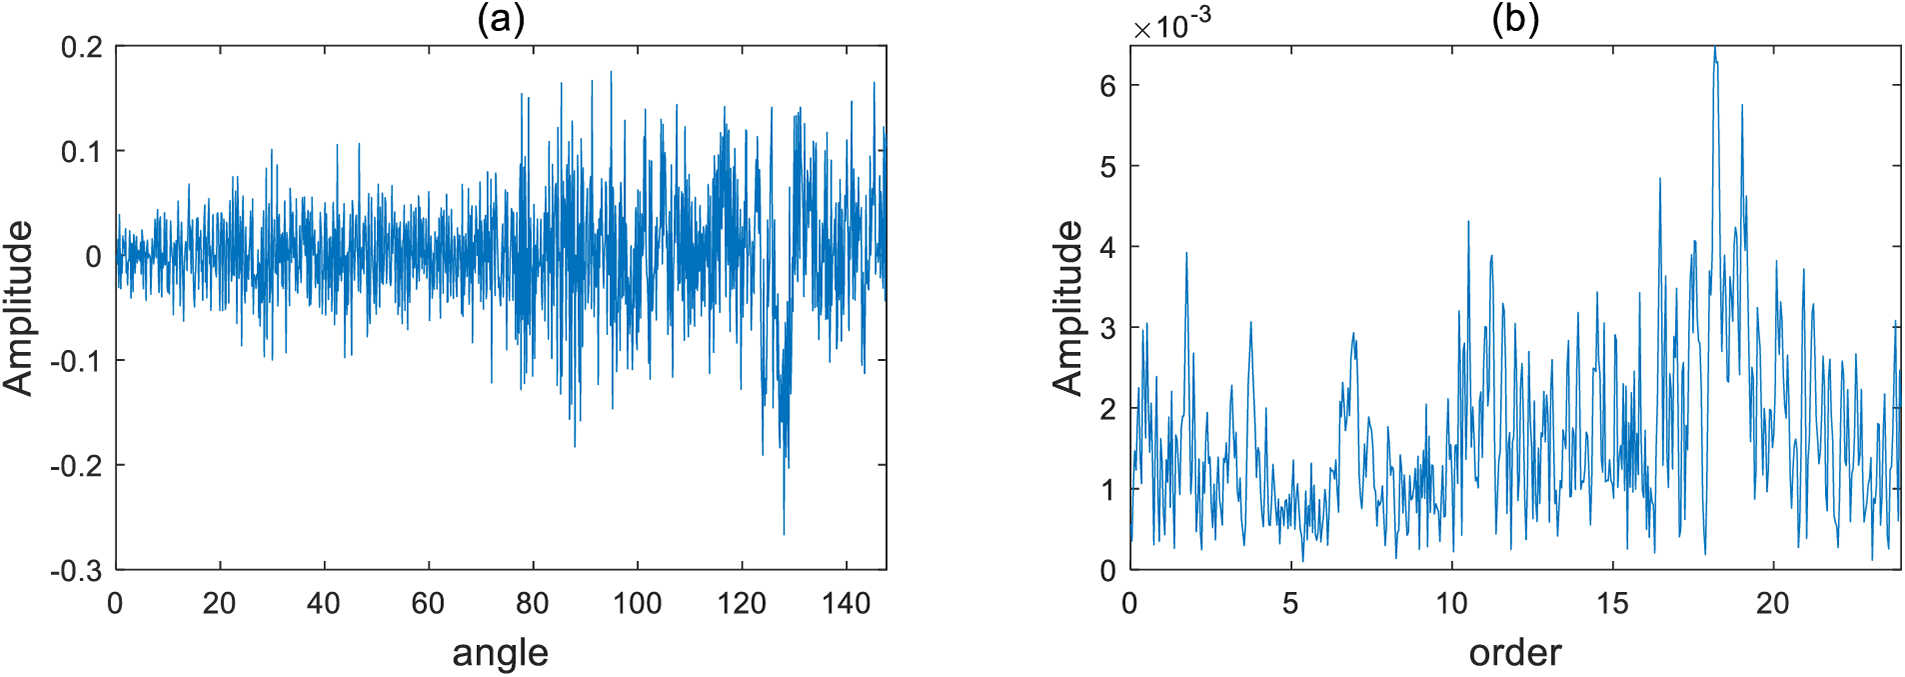
Figure 12: The results of COT experiment
It can be seen from the simulation and experimental results that after the time domain signal is converted to the angle domain, the signal becomes more stable, and many unstable factors are removed. The non-stationary signals that cannot be directly processed by Fourier transform can continue to be processed by Fourier transform after using COT. It shows the superiority of COT in processing non-stationary signals.
3.2.2 Experimental and Compared Verification of COT-DCS
In order to verify the effectiveness of COT-DCS method, the open-source data about gearbox vibration signals collected by Southeast University on the Drivetrain Dynamic Simulator (DDS) [42] is used, as shown in Fig. 13.
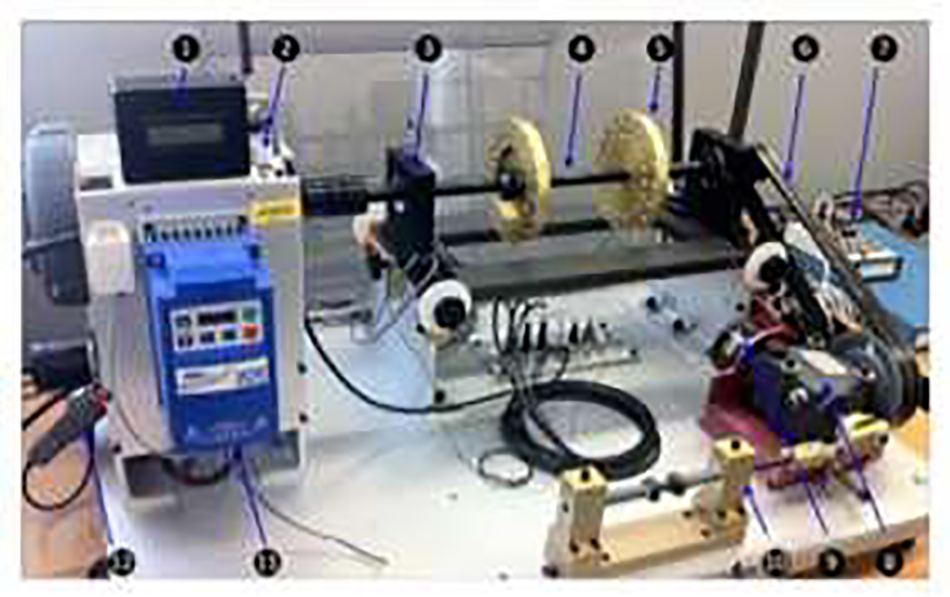
Figure 13: Induction motor test platform
Where: ① Tachometer ② Induction motor ③ Bearing ④ Shaft ⑤ Load ⑥ Drive belt ⑦ Data Acquisition board ⑧ Bevel gear reducer ⑨ Magnetic load ⑩ Crank mechanism ⑪ Transmission ⑫ Current probe. The data platform simulated five bearing operation states under two working conditions, namely, speed 20 Hz (1200 rpm)-no-load 0 V (0 N·m) and speed 30 Hz (1800 rpm)-loaded 2 V (7.32 N·m). The data set of bearing operation is divided into normal operation state, ball fault, inner race fault, outer race fault and inner and outer race compound fault, which respectively represent healthy operation state, ball crack state, inner race crack, outer race crack and inner race outer race crack. The signals of each fault state are collected by two acceleration sensors from x, y and z directions, and the sampling frequency is 20 KHz.
The COT can be divided into two types: COT with tachometer and COT without tachometer, the former can directly collect the speed through tachometer, this method has high reliability and is also widely used in industry. However, in the collection of multiple signals, tachometer equipment for synchronous acquisition of rotational speed is sometimes not installed. In view of this situation, the idea of simulating the speed signal in reference [5] is adopted, and the IF is obtained by using CPP algorithm, and then converted into the simulated speed pulse to realize CPP without tachometer. In order to verify the proposed method, the bearing data set is used to collect the inner race fault data with a speed load configuration of 20-0. Firstly, use CPP to extract the speed of the signal, since the speed obtained by CPP is discrete, the continuous speed curve obtained by polynomial fitting is shown in Fig. 14.
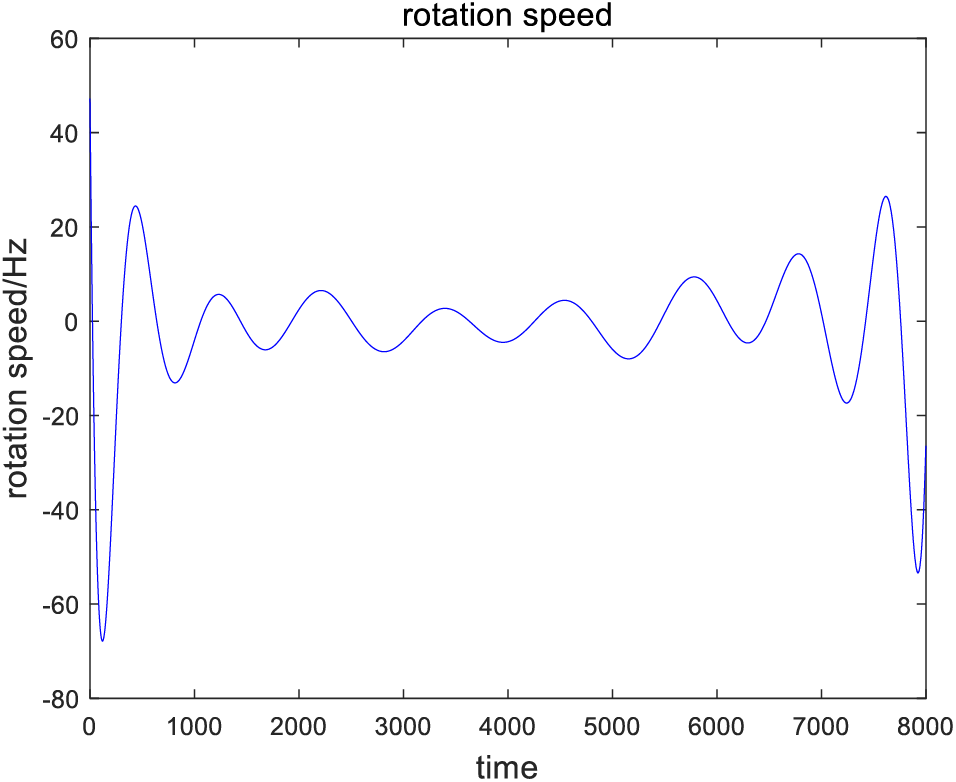
Figure 14: Speed of multi-signals
Then the speed is used to calculate the order tracking of time domain signals in three directions. In order to show the advantages of COT-DCS algorithm, the original signal is also directly denoised using the DCS algorithm. The processing results of using COT and DCS separately are shown in Fig. 15.
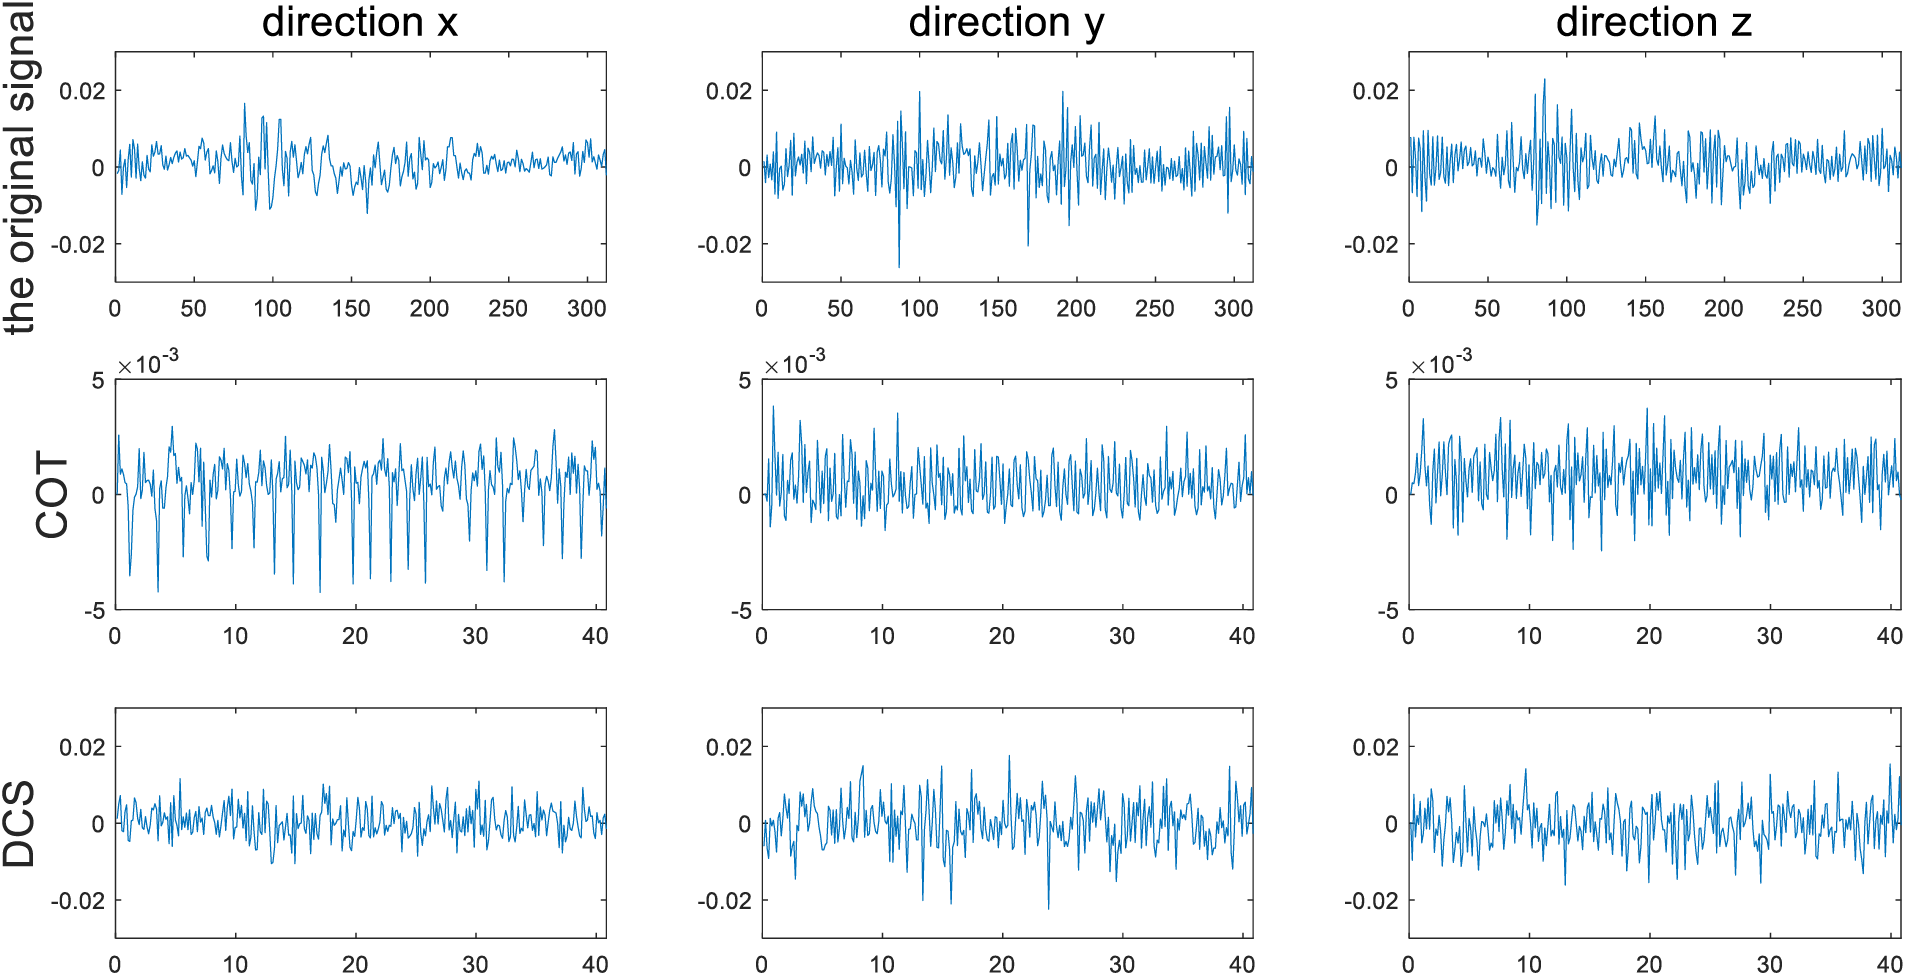
Figure 15: Comparison between the original signal and the signal processing results using COT and DCS alone
In Fig. 15, the first line is the time domain signal in the x, y, z directions, the second line is the angular domain signal by using COT alone, and the third line is the time domain noise reduction signal obtained by using DCS alone. It can be seen from the figure that the amplitude value of the signal processed by COT has been effectively compressed, but since the angle domain resampling is only a change in the variable domain, the noise component in the time domain signal still exists in the angle domain signal. While using DCS to process time domain signals directly, although the noise has been suppressed to some extent, the algorithm has a poor effect on signal non-stationary processing. Therefore, COT-DCS algorithm is used to compress and reconstruct angle domain signals through DCS after angle sampling of time domain signals. Compare the original time domain signal with the noise reduced angle domain signal to see the noise reduction effect, as shown in Fig. 16.
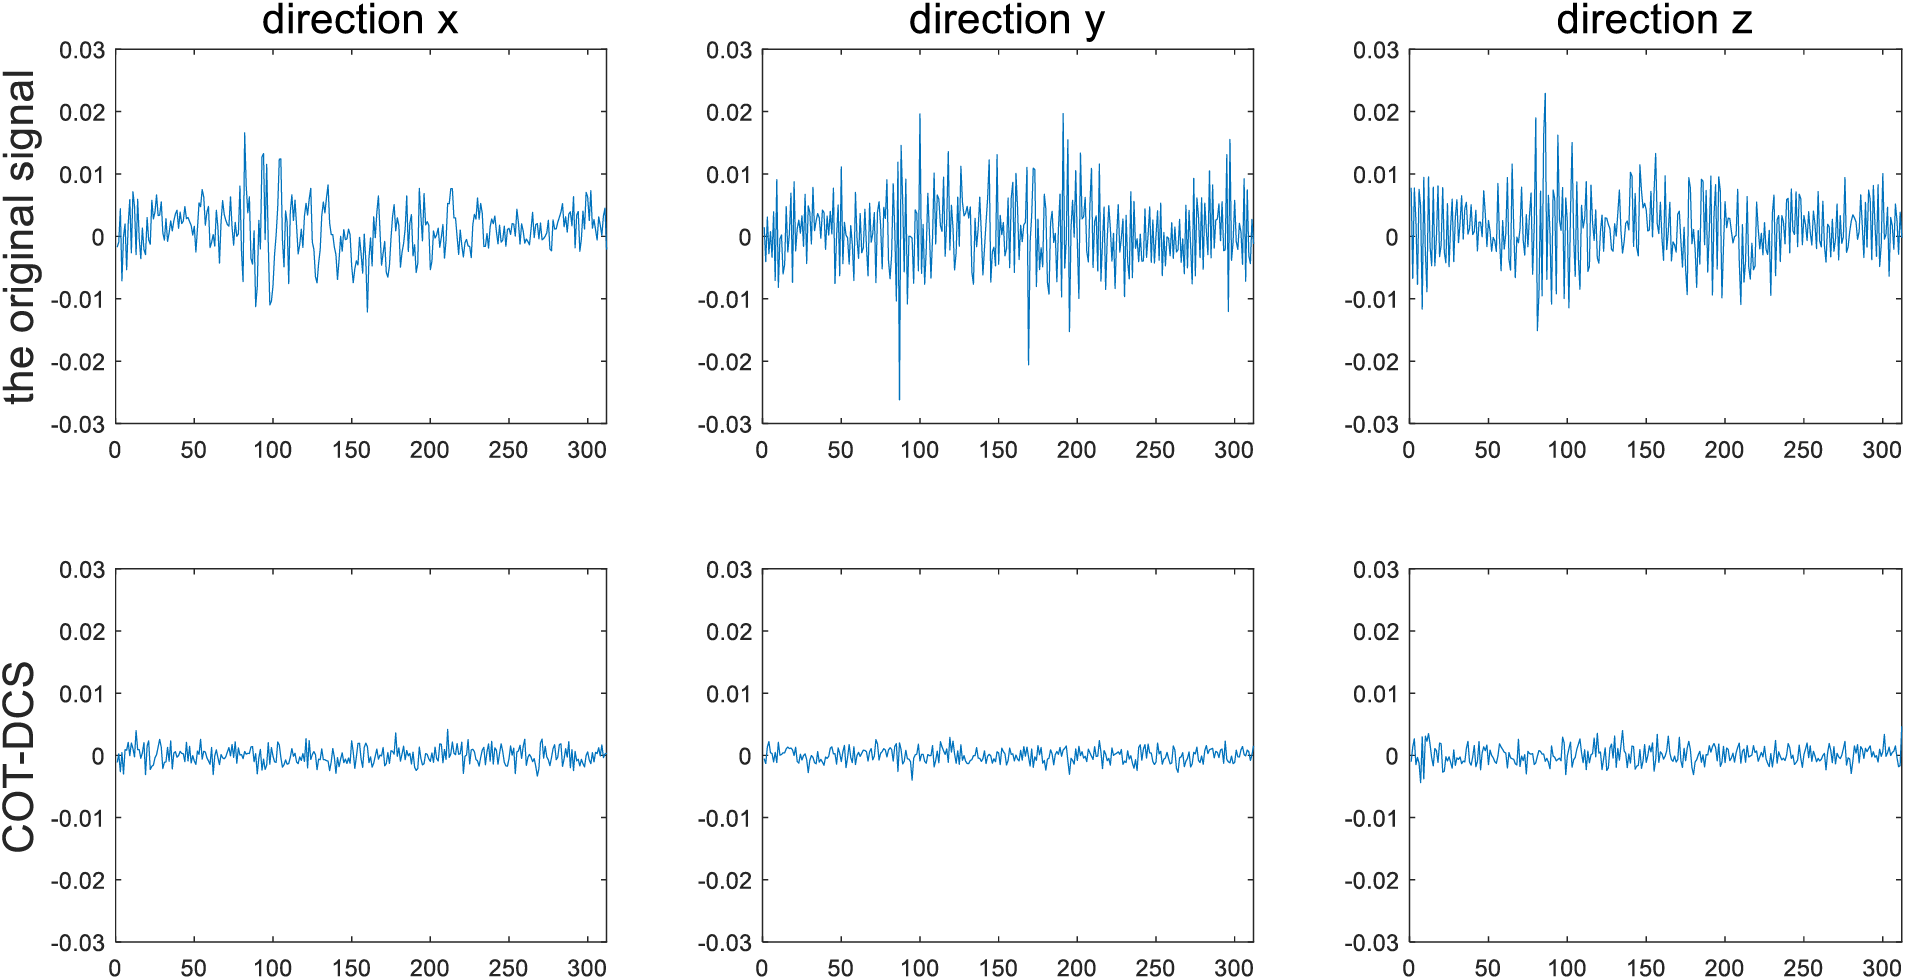
Figure 16: Comparison between the original signal and the processing results after using COT-DCS
Compared with the time-domain signal, it can be seen from Fig. 16 that the signal processed by COT-DCS not only has a certain amplitude compression, but also has a full suppression of noise, which fully combines the advantages of the two algorithms. In order to further test the effect of the algorithm, the results of COT-DCS are compared with the processing results of noise reduction methods based on Singular Value Decomposition and General Linear Chirplet Transform (SVD-GLCT) and Empirical Mode Decomposition and Multi-scale Permutation Entropy (EMD-MPE). The results are shown in Figs. 17 and 18.
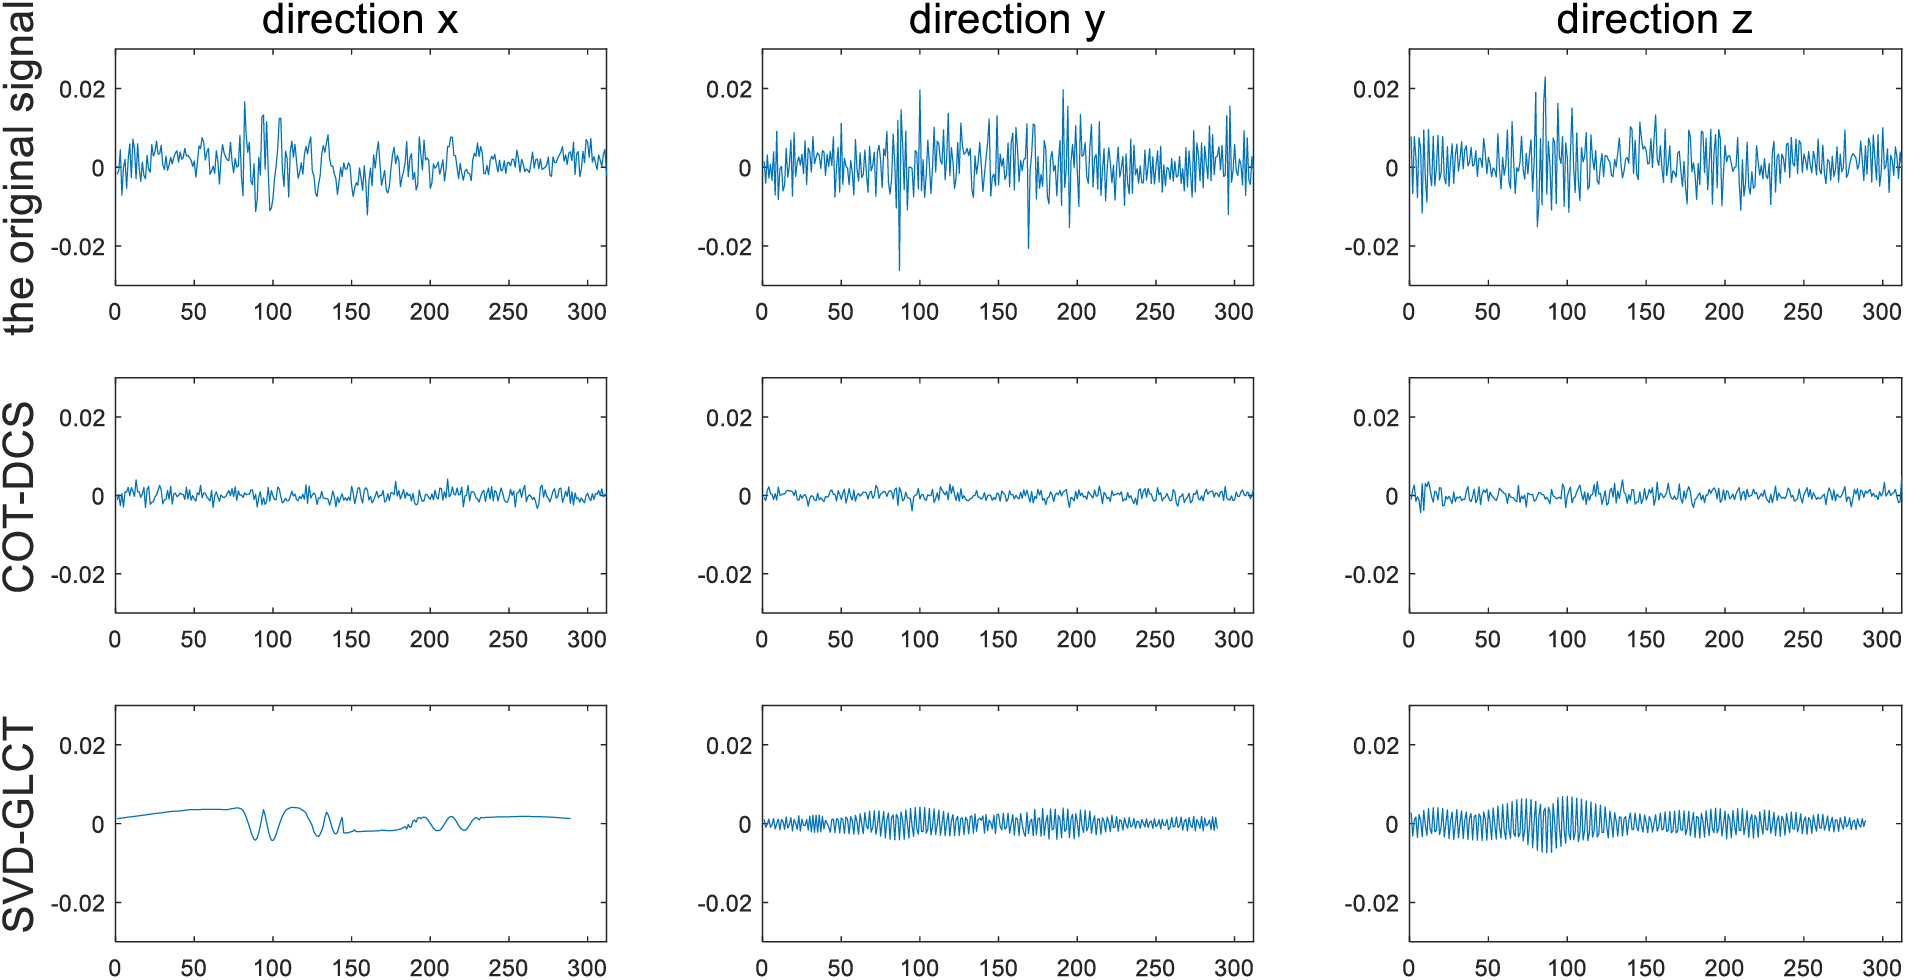
Figure 17: Comparison of noise reduction effects between COT-DCS and SVD-GLCT
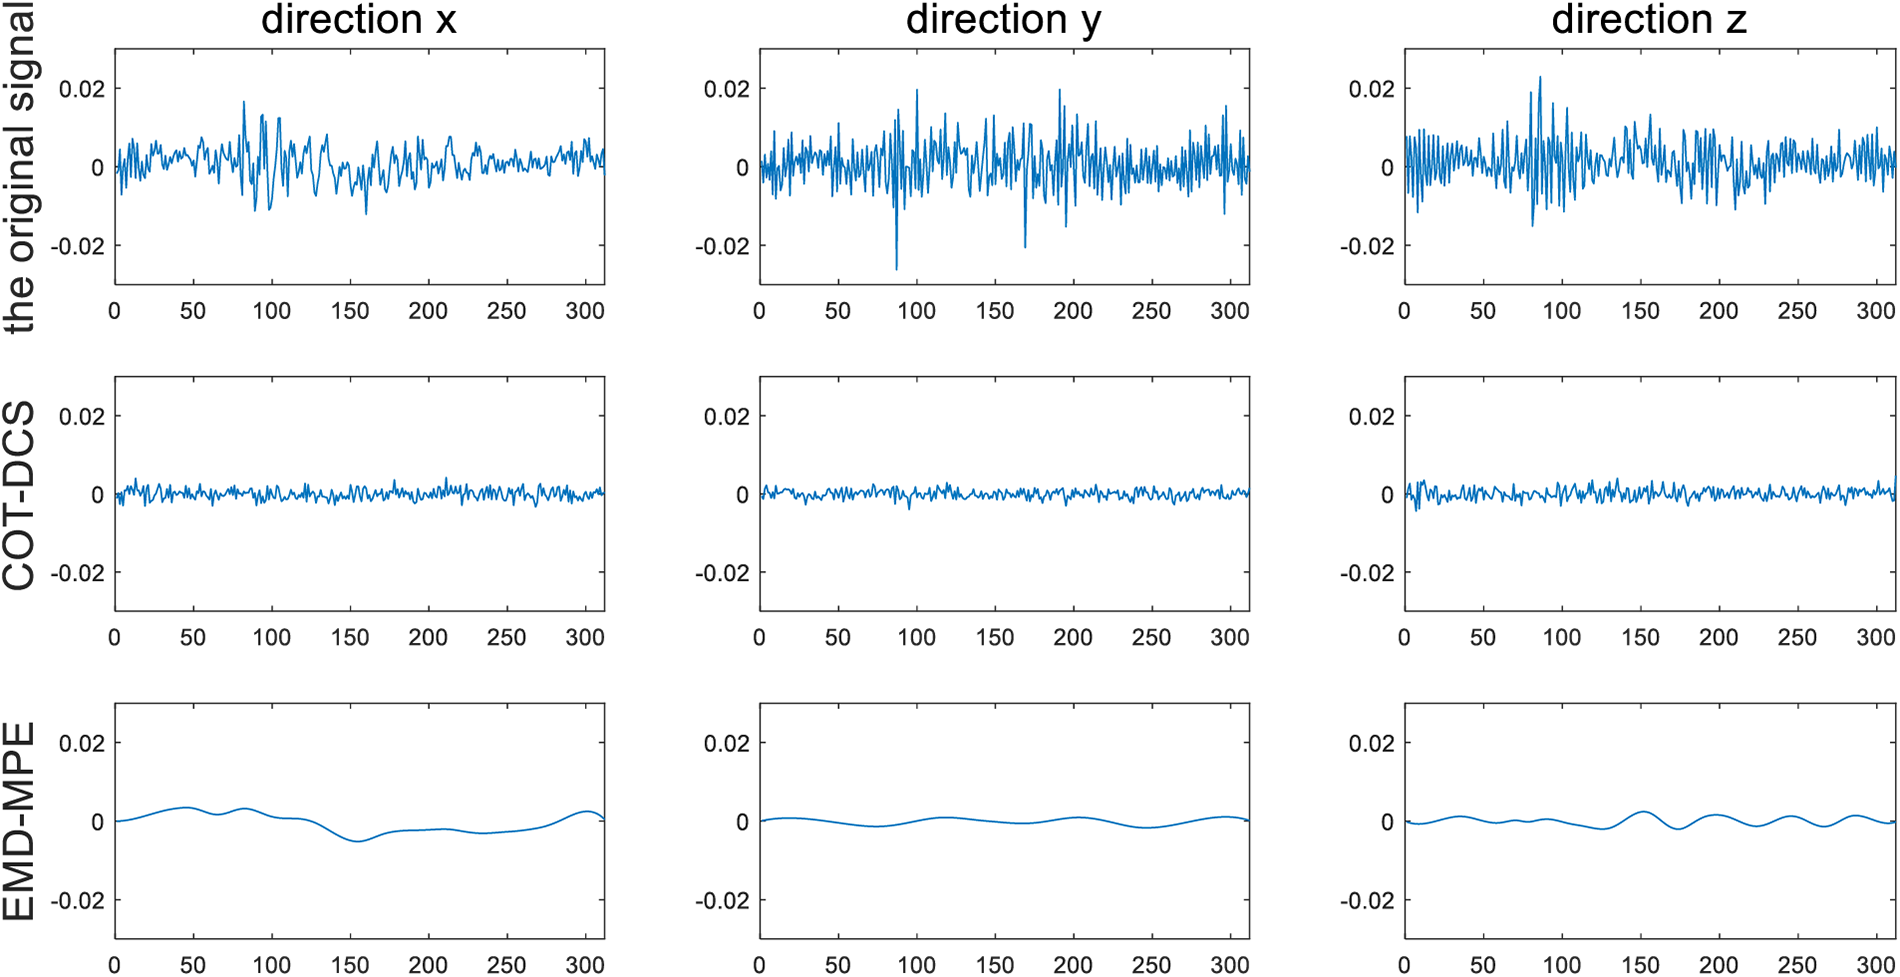
Figure 18: Comparison of noise reduction effects between COT-DCS and EMD-MPE
Comparing the three groups of the noise reduction results of experimental data, SVD-GLCT, EMD-MPE and COT-DCS have all removed part of the noise. Since the three algorithms involve signal reconstruction, in order to compare and analyze the noise reduction effects of the three methods, four new indicators, Reconstructed Standard Deviation (RSD), Root Mean Square Error (RMSE), Root of Variance Ratio (RVR) and Noise Rejection Ratio (NRR), are calculated respectively, as shown in Table 1.

From the RSD, since it is used to evaluate signal fidelity, the smaller the result is, the more signal components are retained. The RSD of the three algorithms are all between 0.0038 and 0.0064, which is at a low level, indicating that the fidelity of the results obtained by the three algorithms is good. The RMSE reflects the similarity between the signal after noise reduction and the original signal, the more obvious the value is, the more similar the two signals are, and the better the noise reduction effect is. Compared with this evaluation index, the RMSE of SVD-GLCT is slightly less than EMD-MPE, while that of COT-DCS is the smallest. RVR reflects the degree of signal smoothness, the smaller the value is, the smoother the signal is. The value processed by COT-DCS method is relatively minimum, closer to 0, and the signal is smoother. The NRR is used to evaluate the ability of signal to suppress noise. The larger the value is, the higher the signal-to-noise ratio will be, and the better the noise reduction effect will be. The NRR of COT-DCS is greater than that of the other two methods, indicating that this method has a strong ability to suppress noise.
To test the treatment effect of the COT-DCS method on different non-stationary working conditions, the bearing data set to collect the inner race fault data with a speed load configuration of 30-2 is used. The results of COT-DCS, SVD-GLCT and EMD-MPE are shown in Figs. 19 and 20.
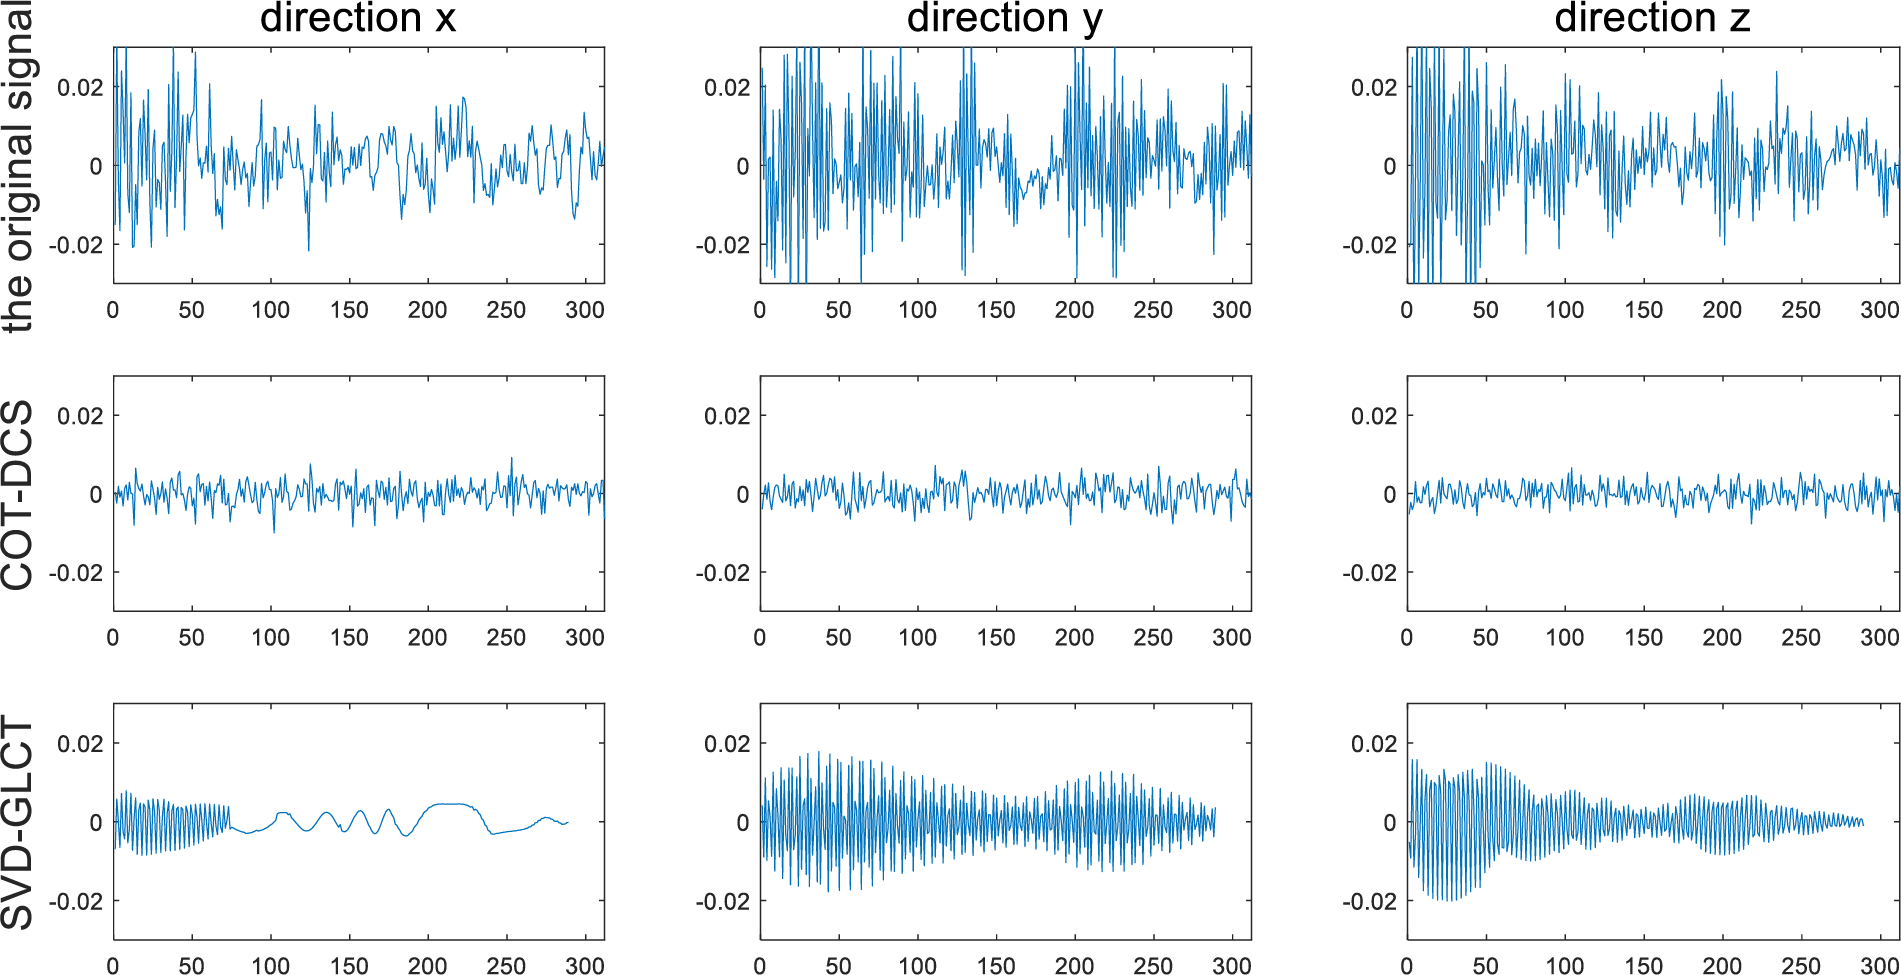
Figure 19: Comparison of noise reduction effects between COT-DCS and SVD-GLCT
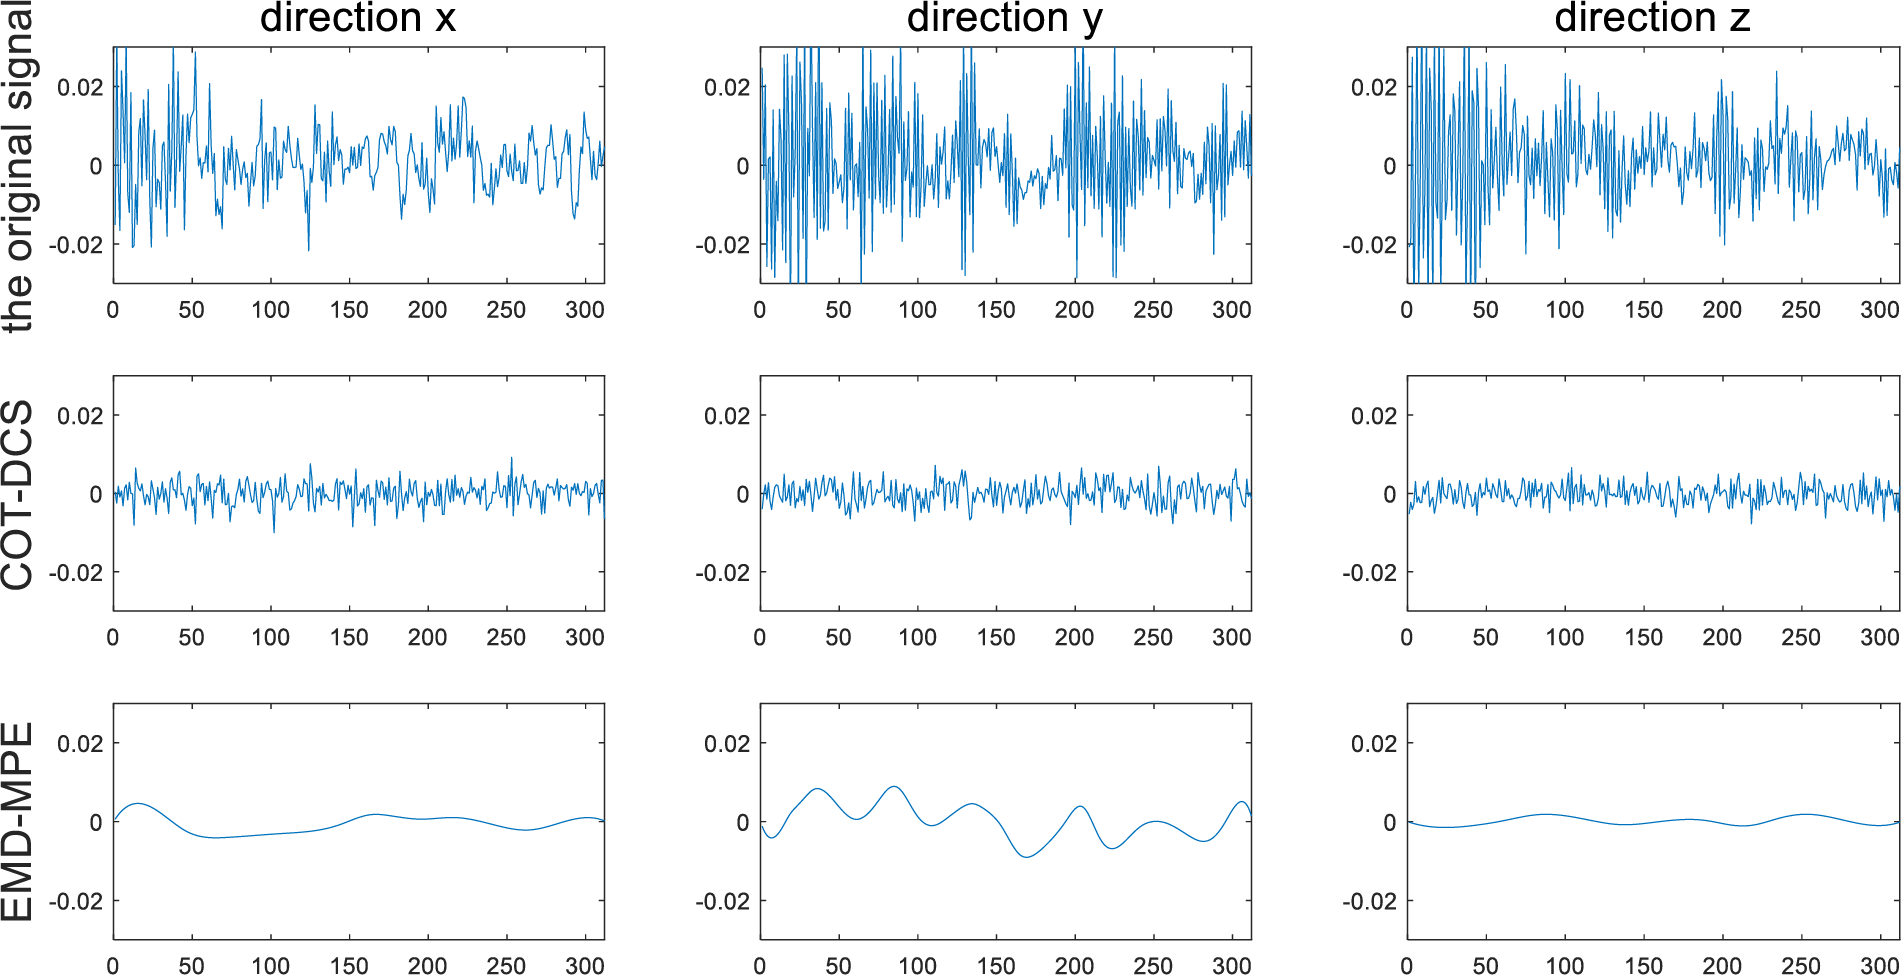
Figure 20: Comparison of noise reduction effects between COT-DCS and EMD-MPE
The four new indicators of them under the working condition are shown in Table 2.

Due to the addition of a 2 V load and an increase in speed to 30 Hz in the second working condition, non-stationary effect of the signal is greater in this working condition. Comparing the processing results of the same fault under different working conditions, the results of comparison of Figs. 17–20 show that the fluctuation of the signal processing results under the second working condition is greater than that under the first working condition, the noise reduction effect of all three methods will be affected by variable working conditions, but the COT-DCS method is less affected by non-stationary factors. By comparing Tables 1 and 2, despite increasing speed and adding load, the COT-DCS method is least affected by non-stationary, and the results of RSD and RMSE indicate that the COT-DCS method still has stronger noise reduction ability, while the noise reduction ability of the other two methods is weakened. The RVR indicates that while ensuring noise reduction capability, COT-DCS can still maintain signal smoothness. From the results of NRR, it is also obvious that COT-DCS has a stronger ability to suppress noise in the second working condition than the other two methods.
Therefore, from the above noise reduction results and noise reduction indicators, the noise reduction effect and the ability to suppress non-stationary of the COT-DCS method is better than the other two algorithms, and it can better filter the noise in the signal while retaining the effective information in the original signal and reflecting its advantages in the noise reduction of multiple signals.
As a key variable speed transmission component of a mechanical system, the smooth operation of the gearbox is related to the safe operation of the entire machinery. With the development of multi-signal monitoring technology, the analysis, processing and denoising of multiple signals under variable working conditions have become an important issue. In order to solve the problem, a COT-DCS method based on CPP is proposed. The IF of the variable speed signal is obtained through the CPP algorithm, and then the speed information is fitted. Through simulation, experimental study and comparison with other three methods which include digital differentiation, local peak search and Viterbi algorithm, it is shown that the IF extracted by CPP is closest to the real speed. Aiming at the non-stationary and nonlinear of the variable speed signal, the time-domain signal is converted into an angle-domain signal through COT, and the simulated and experimental study shows that the algorithm has a good ability to deal with the non-stationary signal. The COT-DCS based on the CPP method is proposed and verified by the actual data. This algorithm combines the advantages of the two algorithms, which not only eliminates the nonstationarity, but also effectively removes the noise embedded in the signal. Compared with using COT and DCS alone, the COT-DCS method has a better noise reduction effect. Moreover, the processing results of this algorithm are compared with SVD-GLCT and EMD-MPE algorithms. The three algorithms all have certain noise reduction effects and signal fidelity, the noise reduction results of the COT-DCS are more stable than those of the others, and the noise reduction effect indicators are also better than SVD-GLCT and EMD-MPE. This shows the superiority and good effect of COT-DCS on multi-signal noise reduction.
Acknowledgement: The authors are grateful for the financial support provided by the National Natural Science Foundation of Hebei Province, Meanwhile, sincere thanks are given to the previous researchers who contributed to the development of deep learning technology, which lay the foundation for this research. Moreover, the authors would like to thank the anonymous reviewers for providing their invaluable comments.
Funding Statement: The authors are grateful for the financial support of this work by the National Natural Science Foundation of Hebei Province China under Grant E2020208052.
Author Contributions: Study conception and design: Guangfei Jia, Zhe Wu, Fengwei Guo; data collection: Zhe Wu, Fengwei Guo; analysis and interpretation of results: Guangfei Jia, Fengwei Guo; draft manuscript preparation: Fengwei Guo, Suxiao Cui, Jiajun Yang. All authors reviewed the results and approved the final version of the manuscript.
Availability of Data and Materials: Readers can get the data in the website shown in references [41] and [42].
Conflicts of Interest: The authors declare that they have no conflicts of interest to report regarding the present study.
References
1. Gu, H., Liu, W. Y., Gao, Q. W., Zhang, Y. (2021). A review on wind turbines gearbox fault diagnosis methods. Journal of Vibroengineering, 23(1), 26–43. [Google Scholar]
2. Guo, S., Yang, T., Hua, H. C., Cao, J. W. (2021). Coupling fault diagnosis of wind turbine gearbox based on multitask parallel convolutional neural networks with overall information. Renewable Energy, 178, 639–650. [Google Scholar]
3. Teng, W., Ding, X., Cheng, H., Han, C., Liu, Y. B. et al. (2019). Compound faults diagnosis and analysis for a wind turbine gearbox via a novel vibration model and empirical wavelet transform. Renewable Energy, 136, 393–402. [Google Scholar]
4. Zou, L., Wang, Z. D., Hu, J., Han, Q. L. (2020). Moving horizon estimation meets multi-sensor information fusion: Development, opportunities and challenges. Information Fusion, 60, 1–10. [Google Scholar]
5. Guo, Y., Chi, Y. L., Huang, Y. Y., Qin, S. R. (2006). Robust IFE based order analysis of rotating machinery in virtual instrument. Journal of Physics: Conference Series, 48, 647–652. [Google Scholar]
6. Zhang, B. H., Zhu, J. H., Lu, X. Q., Gu, Y., Li, J. J. et al. (2021). An infrared dim target detection algorithm based on density peak search and region consistency. Optical and Quantum Electronics, 53(7), 1–18. https://doi.org/10.1007/s11082-021-03056-x [Google Scholar] [CrossRef]
7. Candès, E. J., Charlton, P. R., Helgason, H. (2008). Detecting highly oscillatory signals by chirplet path pursuit. Applied and Computational Harmonic Analysis, 24(1), 14–40. [Google Scholar]
8. Luo, J. S., Yu, D. J., Liang, M. (2012). Application of multi-scale chirplet path pursuit and fractional Fourier transform for gear fault detection in speed up and speed-down processes. Journal of Sound and Vibration, 331(22), 4971–4986. [Google Scholar]
9. Liu, D. D., Cheng, W. D., Wen, W. G. (2019). Demodulation spectrum analysis for multi-fault diagnosis of rolling bearing via chirplet path pursuit. Journal of Central South University, 26, 2418–2431. [Google Scholar]
10. Xu, S. Q., Zhang, K., Chai, Y., He, Y. G., Feng, L. (2018). Gear fault diagnosis in variable speed condition based on multiscale chirplet path pursuit and linear canonical transform. Complexity, 2018, 3904598. [Google Scholar]
11. Peng, F. Q., Yu, D. J., Luo, J. S. (2011). Sparse signal decomposition method based on multi-scale chirplet and its application to the fault diagnosis of gearboxes. Mechanical Systems and Signal Processing, 25(2), 549–557. [Google Scholar]
12. Luo, J. S., Yu, D. J., Liang, M. (2012). Gear fault detection under time-varying rotating speed via joint application of multiscale chirplet path pursuit and multiscale morphology analysis. Structural Health Monitoring, 5(5), 526–537. [Google Scholar]
13. Luo, J. S., Zhang, S. H., Zhong, M. E., Lin, Z. S. (2016). Order spectrum analysis for bearing fault detection via joint application of synchrosqueezing transform and multiscale chirplet path pursuit. Shock and Vibration, 2016, 2976389. [Google Scholar]
14. Wu, C. Y., Liu, J., Peng, F. Q., Yu, D. J., Li, R. (2013). Gearbox fault diagnosis using adaptive zero phase time-varying filter based on multi-scale chirplet sparse signal decomposition. Chinese Journal of Mechanical Engineering, 26(4), 831–838. [Google Scholar]
15. Jiang, H. K., Lin, Y., Meng, Z. Y. (2018). Rolling element bearing fault feature extraction using an optimal chirplet. Measurement Science and Technology, 29(10), 105004. [Google Scholar]
16. Millioz, F., Davies, M. (2012). Sparse detection in the chirplet transform: Application to FMCW radar signals. Institute of Electrical and Electronics Engineers, 60(6), 2800–2813. [Google Scholar]
17. Truong, A., Papamoschou, D. (2015). Harmonic and broadband separation of noise from a small ducted fan. 21st AIAA/CEAS Aeroacoustics Conference, pp. 2015–3282. Dallas, USA. [Google Scholar]
18. Chiang, H. W. D., Hsu, C. N., Tu, S. H. (2004). Rotor-bearing analysis for turbomachinery single-and dual-rotor systems. Journal of Propulsion and Power, 20(6), 1096–1104. [Google Scholar]
19. Li, Y. Z., Ding, K., He, G. L., Jiao, X. T. (2018). Non-stationary vibration feature extraction method based on sparse decomposition and order tracking for gearbox fault diagnosis. Measurement, 124, 453–469. [Google Scholar]
20. Wu, J., Zi, Y. Y., Chen, J. L., Zhou, Z. T. (2018). A modified tacho-less order tracking method for the surveillance and diagnosis of machine under sharp speed variation. Mechanism and Machine Theory, 128, 508–527. [Google Scholar]
21. Schmidt, S., Heyns, P. S., de Villiers, J. P. (2018). A tacholess order tracking methodology based on a probabilistic approach to incorporate angular acceleration information into the maxima tracking process. Mechanical Systems and Signal Processing, 100, 630–646. [Google Scholar]
22. Wang, T. Y., Zhang, L., Qiao, H. H., Wang, P. (2020). Fault diagnosis of rotating machinery under time-varying speed based on order tracking and deep learning. Journal of Vibroengineering, 22(2), 366–382. [Google Scholar]
23. Walker, C., Coble, J. (2018). Wind turbine bearing fault detection using adaptive resampling and order tracking. International Journal of Prognostics and Health Management, 9(2), 1–14. [Google Scholar]
24. Koli, C. R., Pete, D. J., Ashwin, R., Bandyopadhyay, K. (2020). Balancing of a rotating shaft using computed order tracking. 2020 International Conference on Emerging Smart Computing and Informatics (ESCI), pp. 179–183. Pune, India. [Google Scholar]
25. Liu, H., Wang, Z. Q., Liang, L. (2021). Vibration order analysis method utilizing keyphasor signal for rolling mill gearbox diagnosis. 2021 IEEE 4th International Conference on Automation, pp. 438–443. Shenyang, China. [Google Scholar]
26. Yang, T. F., Guo, Y., Wu, X., Na, J., Fung, R. F. (2018). Fault feature extraction based on combination of envelope order tracking and cICA for rolling element bearings. Mechanical Systems and Signal Processing, 113, 131–144. [Google Scholar]
27. Wei, D. D., Wang, K. S., Zhang, M., Zuo, M. J. (2018). Sweep excitation with order tracking: A new tactic for beam crack analysis. Journal of Sound and Vibration, 420, 129–141. [Google Scholar]
28. Ouadine, A. Y., Mjahed, M., Ayad, H., Kari, A. E. (2019). Helicopter gearbox vibration fault classification using order tracking method and genetic algorithm. Automatika, 60(1), 68–78. [Google Scholar]
29. He, J. D., Song, M. Z., Zhang, S. S., Song, P., Shu, X. et al. (2020). Sparse GLONASS signal acquisition based on compressive sensing and multiple measurement vectors. Mathematical Problems in Engineering, 2020, 9654120. [Google Scholar]
30. He, X. Y., Tong, N. N., Hu, X. W., Feng, W. K. (2019). High-resolution ISAR imaging of fast rotating targets based on pattern-coupled Bayesian strategy for multiple measurement vectors. Digital Signal Processing, 93, 151–159. [Google Scholar]
31. Donoho, D. L. (2006). Compressed sensing. IEEE Transactions on Information Theory, 52(4), 1289–1306. [Google Scholar]
32. Slepian, D., Wolf, J. K. (1973). Noiseless coding of correlated information sources. IEEE Transactions on Information Theory, 19(4), 471–480. [Google Scholar]
33. Baron, D., Wakin, M. B., Duarte, M. F., Sarvotham, S., Baraniuk, R. G. (2005). Distributed compressed sensing. Preprint, 22(10), 2729–2732. [Google Scholar]
34. Torkamani, R., Sadeghzadeh, R. A. (2019). Wavelet-based Bayesian algorithm for distributed compressed sensing. Information Systems & Telecommunication, 7(2), 87–95. [Google Scholar]
35. Wen, X. D., Liu, C. W. (2019). Decentralized distributed compressed sensing algorithm for wireless sensor networks. Procedia Computer Science, 154, 406–415. [Google Scholar]
36. Chen, J., Xue, F., Kuo, Y. H. (2018). Distributed compressed video sensing based on key frame secondary reconstruction. Multimedia Tools and Applications, 77, 14873–14889. [Google Scholar]
37. Zheng, S., Chen, J., Kuo, Y. H. (2018). An improved distributed compressed video sensing scheme in reconstruction algorithm. Multimedia Tools and Applications, 77(7), 8711–8728. [Google Scholar]
38. Torkamani, R., Zayyani, H., Sadeghzadeh, R. A. (2021). Model-based decentralized Bayesian algorithm for distributed compressed sensing. Signal Processing: Image Communication, 95, 116212. [Google Scholar]
39. Jahanshahi, J. A., Danyali., H., Helfroush, M. S. (2018). A distributed compressed sensing-based algorithm for the joint recovery of signal ensemble. Radioengineering, 27(2), 587–594. [Google Scholar]
40. Chen, X. Y., Zhang, Y. J., Qi, R. (2019). Block sparse signals recovery algorithm for distributed compressed sensing reconstruction. Journal of Information Processing Systems, 15(2), 410–421. [Google Scholar]
41. Leclère, Q., Hugo, A., Jérôme, A. (2016). PrésentationCMMNOcontestwopicts. https://www.researchgate.net/publication/299437545 [Google Scholar]
42. Shao, S. Y., Mcaleer, S., Yan, R. Q., Baldi, P. (2019). Highly accurate machine fault diagnosis using deep transfer learning. IEEE Transactions on Industrial Informatics, 15(4), 2446–2455. [Google Scholar]
Cite This Article
 Copyright © 2023 The Author(s). Published by Tech Science Press.
This work is licensed under a Creative Commons Attribution 4.0 International License , which permits unrestricted use, distribution, and reproduction in any medium, provided the original work is properly cited.


 Submit a Paper
 Propose a Special lssue
 View Full Text
 Download PDF
 Downloads
 Citation Tools