
 Submit a Paper
 Propose a Special lssue
 Open Access
ARTICLE

Regional Finite-Fault Source Model for Development of Ground Motion Attenuation Relationship in Sichuan, China
1 College of Civil Engineering and Water Conservancy, Heilongjiang Bayi Agricultural University, Daqing, 163319, China
2 Key Laboratory of Earthquake Engineering and Engineering Vibration, Institute of Engineering Mechanics, China Earthquake Administration, Harbin, 150080, China
3 School of Civil Engineering, Harbin Institute of Technology, Harbin, 150090, China
4 School of Civil Engineering, Hebei University of Engineering, Handan, 056038, China
* Corresponding Author: Wei Jiang. Email:
Structural Durability & Health Monitoring 2023, 17(1), 37-54. https://doi.org/10.32604/sdhm.2022.013444
Received 06 August 2020; Accepted 25 December 2020; Issue published 02 March 2023
 View Full Text
 Download PDF
Abstract
The attenuation relationship of ground motion based on seismology has always been a front subject of engineering earthquake. Among them, the regional finite-fault source model is very important. In view of this point, the general characteristics of regional seism-tectonics, including the dip and depth of the fault plane, are emphasized. According to the statistics of regional seism-tectonics and focal mechanisms in Sichuan, China, and the sensitivity of estimated peak ground acceleration (PGA) attenuation is analyzed, and the dip angle is taken as an average of 70°. Based the statistics of the upper crustal structure and the focal depth of regional earthquakes, the bottom boundary of the sedimentary cover can be used as the upper limit for estimating the depth of upper-edge. The analysis shows that this value is sensitive to PGA. Based on the analysis of geometric relations, the corresponding calculation formula is used, and a set of concepts and steps for building the regional finite-fault source model is proposed. The estimation of source parameters takes into account the uncertainty, the geometric relationship among parameters and the total energy conservation. Meanwhile, a set of reasonable models is developed, which lay a foundation for the further study of regional ground motion attenuation based on seismology.Keywords
The near-field strong ground motions of synthetic large earthquakes are mostly based on the source model of finite faults, which need to be predicted by empirical parameter scaling law of statistical source parameters of the occurred earthquakes. The empirical attenuation relationship cannot be established directly in the areas without strong earthquake records. Two methods are commonly used to establish the regional attenuation relationship, which are based on seismology (simplified random vibration method for ground motion estimation) [1] and modifying attenuation relationship for other regions [2]. The modification methods included three correction methods based on the difference of ground motion attenuation relationship between the two places [3], the limited observation data of local and reference area [4], and the attenuation of seismic intensity in the two places [5,6]. In the Central and Eastern US, the first two modification methods were also used to establish nine groups of attenuation relations [1]. The weighted average of the seismic hazard curve of each attenuation relation is calculated by the logic tree. The weight coefficient is determined by expert consultation, and the weight coefficient only reflects the recognition degree of each attenuation relationship by experts. The disadvantage is that there is no difference in the reliability and applicability of each attenuation relation at different magnitudes and distances, and it is popular in China. Although the intensity distance method and the mapping method were later put forward to improve the transformation correction method [4] and they were logically insufficient, inconsistent with the actual observation data and also questioned [7]. In order to make up for the shortcomings of the above methods and solve the problem of establishing a regional finite fault source model in the areas lacking strong earthquake observation data, a new synthetic regional finite fault source model based on seismology is proposed in this paper. The seismology method is a good solution of attenuation relation. According to the characteristics of two attenuation relations in seismology, a new weighted scheme is put forward, which represents the applicable range of point source and finite fault source, respectively. It emphasizes the important consensus that “point source model is suitable for medium and small earthquakes as well as far-field ground motion estimation, while the finite fault model is suitable for predicting near-field strong ground motion” [8], and a regional hybrid attenuation relation is established. The point source model used in this study has carried out a lot of relevant researches on the attenuation relationship of regional small and medium-sized earthquakes, which lays the foundation of mixed attenuation relationship [9]. In fact, it is more important to study and establish of the source model of regional strong earthquake finite fault, which is also the main content of this paper. Different from the previous studies on the finite fault source model of an active fault or an earthquake with a given magnitude in one segment [10], the regional finite source model in the mixed attenuation relationship should be able to reflect the overall structural characteristics of regional strong earthquake sources. For example, the location of the rupture surface of earthquake source should be selected to represent the dip angle and buried depth reflecting the overall characteristics of regional seism-tectonics. According to the above points, this paper takes Sichuan region, China, as an example to establish a regional finite-fault source model for regional attenuation relationship.
2 Parameter Scaling Law of Finite Fault Source Model
Earthquakes mainly occur in the deformation accumulation area of plate boundary and the release of huge kinetic energy. In order to express the influence of source spatial scale on ground motion, it is necessary to establish a focal model based on finite fault. There are two kinds of source parameters need to be estimated in the process of model establishment. The first is global parameters reflecting the macro characteristics of the seism-genic rupture, including the location, occurrence and burial depth of the rupture plane, in which the size and the average slip, are all related to the magnitude. The higher is the magnitude, and the greater is the parameter values. The relationship between the area, length, width, average slip and moment magnitude of the rupture plane is called the global parameter scaling law. Thingbaijam et al. [11] published the earthquake source models in a wide magnitude range (Mw 5.4–9.2) and events of various faulting styles. Based on the latest data of Next Generation Attenuation Model (NGA) Project of the Pacific Earthquake Engineering Research Center (PEER) [12,13] has revised and supplemented the basic data of global parameters of source, and a new global parameter scaling law was established. Other parameters are local ones, which mainly describe the distribution characteristics of the slip on the rupture plane of the source. Sianipar et al. [14] proposed an asperity model for earthquake source simulation, where the slip on the fracture surface is 1.5 or more times larger than that of other parts. Based on the statistical analysis of the slip distribution data of the 2002–2009 Sumbawa (Indonesia) earthquakes, the roughness parameters are extracted and the scaling law of local source parameters is established. Jiang et al. [15] proposed the k–2 model for the randomness of the slip distribution on the fracture surface. Ruiz et al. [16] studied the method of generating the physical slip velocity function in the kinematic k−2 source model. Irikura et al. [17] developed the hybrid source model. The asperity model is used to estimate the long wavelength slip characteristics, and the k−2 model is used to estimate the short ones. Combining these two methods, the spatial wavenumber spectrum of source slip is obtained, and the spatial distribution of slip on the fracture surface is generated. The local source parameters from the source slip distribution data of 211 global earthquakes collected by SRCMOD [18] was also extracted, and the total amount is 6 times more than that of Jiang et al. [19]. A new local parameter scaling law is obtained by distinguishing two different types of seism-tectonic areas, namely interpolate zone and seduction zone [20]. The magnitude range is from Mw 4.11 to Mw 9.29, and the depth range is 6.5–608.0 km. 126 is the dip-slip and 85 is the strike-slip. The earthquakes used in this study are distributed in the whole world.
3 Dip Angle and Buried Depth of Source Model of Regional Finite Fault
In addition to using the scaling law of source parameters to estimate global and local values, the location of regional source model is very important. The trend is restricted by the range and extension direction of potential source area. The dip angle and buried depth play a controlling role, which also has a global impact on the seismic attenuation relationship. Although these two kinds of parameters have certain relationship with magnitude, they are mainly controlled by regional crustal structure and regional seismic tectonic stress field, thus special research and analysis are needed. According to the present seismic zoning method, the attenuation relationship of regional ground motion should be adopted for every potential source area and various magnitudes in the attenuation zoning of a country or region. Accordingly, the dip angle and buried depth of the source model for establishing the regional attenuation relationship should reflect the overall characteristics of the regional seism-tectonics, and parameters selection should comprehensively reflect the representative values of regional characteristics.
In the attenuation relationship of zoning map of the Central and Eastern US in 2014, the dip angle of the earthquake is counted, or the median value of the range is taken [5], or randomly generated in the range of the mean value plus minus the standard deviation [21]. According to the geometric relationship between the average values of focal depth, width and dip angle, the buried depth of the upper edge of the fracture surface is calculated. Based on the above methods, this paper summarizes and counts the dip angle of fault structure and earthquake in Sichuan, analyzes their correlation with rupture type, discusses the selection method of dip angle, analyzes regional crustal structure, studies the effect of sedimentary cover on the buried depth of the upper edge of the rupture plane, and puts forward the estimation scheme. Through sensitivity analysis, two parameters are determined.
3.1 The Dip Angle of Source Model in Sichuan
There are nine main fault zones in Sichuan, including Anning River (Q4 in the latest active age), Litang (Q3), Longquan Mountain (Q3), Daliang Mountain (Q4), Yingjing-Mabian-Yanjin (Q3), Yunongxi (Q4), Lijiang-xiaojinhe (Q4), Longmenshan fault zone (Q4) in the northeast and Xianshuihe fault zone (Q4) in the northwest [8] in Fig. 1. The rupture types and dip angles of the main active faults in Sichuan are shown in Table 1. The dip-slip and strike-slip ruptures are shorted as DS and SS, respectively.

Figure 1: Structural map of main faults in Sichuan, China

From Table 1, five fault zones (F1, F2, F4, F6, and F10) in Sichuan are mainly SS and others are DS rupture. Most fault zones have a dip angle of 50°−80°, and DS is small.
Using the moment tensors in CMT catalogue, the focal mechanism solutions of 99 major earthquakes [22,23] with MS ≥ 5.0 in Sichuan from 1850 to 2019 are collected. According to the distribution direction of aftershocks and the occurrence of regional seism-tectonics, the rupture planes are selected from the two nodes of the mechanism solutions to determine the dip angle; the rupture types of each earthquake are determined according to the classification standard in Table 2 [8], and the ones of the main rupture areas and comparative analysis of inclination range.

In order to deeply analyze the rupture types and change rules of dip angle, the relationship between dip angle and magnitude of two rupture types in Sichuan is drawn as shown in Fig. 2. The open circle and plus sign are DS and SS, respectively.

Figure 2: Relationship of dip angle and magnitude Ms for earthquakes in Sichuan
From Fig. 2, most of the earthquakes in Sichuan are high dip angle, mainly in the range of 50°–80°, which is basically consistent with the dip angle results of the fault zones summarized in Table 1. According to statistics, the median values of dip angles of DS, SS and all earthquakes are 60°, 75° and 70°, respectively.
Further distinguish the magnitude segment and make statistics on the proportion of two rupture types, which are shown in Table 3. In the table, the number or proportion of DS earthquakes is on the left side of “/”, and SS is on the right.

From Table 3, DS and SS earthquakes in Sichuan accounts for 39.4% and 60.6% of the total, respectively. The number of SS earthquakes below 7.0 is large and DS above 7.0 are slightly more.
Distinguishing SS and DS to establish regional attenuation relationship will increase the complexity of application, and makes it more convenient to use the attenuation relationship of all earthquakes with different rupture types. This kind of attenuation relation expresses the overall characteristics of regional strong ground motion, and it has a wide application range. It is very hard to specify dip angles for different fault zones, rupture types and earthquake magnitudes. Thus the average dip angle of 70° is selected for the calculation of all earthquakes. The feasibility of this idea will be demonstrated through the sensitivity analysis in Section 3.4.
3.2 Value of Upper-Edge Depth of Seismic Rupture Plane
The thickness of the weak sedimentary cover on the crustal surface in Sichuan is about several kilometers, and earthquakes rarely occur. The crystalline basement under the cover is mainly composed of hard and brittle rocks [8]. In the process of plate movement, it is easy to accumulate energy and generate strong earthquakes. Table 4 shows the thickness of sedimentary cover in each part of Sichuan.

The total number of earthquakes (including main shocks and aftershocks) with M ≥ 5.0 occurred in Sichuan before November 25, 2019 is 229 [22], and this study calculates the focal depth for each event.
The focal depth of more than 90% earthquakes is in 5–35 km, with an average of 16 km. Compared with Table 4, most of the earthquakes occurred in the crystalline basement, which is consistent with the regional crustal structure. The actual seismic data also shows that the basement is a seismicity layer. In this paper, the bottom of the sedimentary cover is considered as the upper boundary of seismic rupture plane of the regional finite-fault source model.
According to the location diagram of rupture plane, the geometric relationship between the three parameters of focal depth, rupture width and dip angle and the upper-edge depth of rupture plane is analyzed, as shown in Fig. 3. The width of the rupture plane is estimated by the scaling law, and the buried depth of the upper edge is calculated by Eq. (1).
where, HT is the buried depth of the upper edge; HD is the focal depth, taking the average focal depth of 16 km; ys is the distance of the source to its upper edge along dip, which is about half of the rupture width (W) based on Jiang et al. [20], and W is estimated by the scaling law [13]. Dip is the dip angle, 70°. Some of the results are shown in Table 5, which is consistent with the burial depth of the above-mentioned crystalline basement.

Figure 3: Relationship of geometric parameters and focal depth in rupture plane

3.3 Establishing Finite Fault Source Model and Ground Motion Attenuation Relationship
1. Establishing finite fault source models are shown as below:
(1) The moment magnitude is substituted into the global parameter scaling law to estimate the expected values of global parameters, and then the global parameters are substituted into the corresponding equations of local parameter scaling law to estimate the expected values of local parameters.
(2) Considering the discreteness of the statistical relation of source data, the expected values of source parameters and the corresponding standard deviations obtained in Step 1 are substituted into the probability density function of the truncated normal distribution to generate 30 random numbers.
where, x is the source parameter, such as rupture area and width;
(3) By substituting each random number into Eq. (3), 30 sets of source parameters of corresponding magnitude can be calculated [8].
where, xi is the ith value of the parameter, and ξi is the ith random number.
Due to the control of the total slip of each earthquake, the rupture area and the average slip also have a potential relationship. With the increase of rupture area, the average slip will decrease in accordance with Eq. (4).
where, Di is the average slip of the ith model;
(4) For k−2 model, the rupture plane is discretized into 2M * 2N small micro-grids. With the same method, the asperity slip is allocated into each micro-grid, and the slip of each micro-grid is obtained by interpolation and smoothness.
(5) By means of Fourier transform, the slip distribution of the deterministic part is transformed from the spatial domain to the wavenumber domain, that is, the long-wavelength (low wavenumber) slip feature, which is called deterministic part.
(6) The numerical value of spatial corner wave in two directions is substituted into Eq. (5) to calculate the wavenumber spectrum of k−2 model, i.e., short-wavelength (high wavenumber) slip feature, which is called random part.
where,
(7) The combination of deterministic part and random part forms the total wavenumber spectrum.
(8) By means of inverse Fourier transform, the slip distribution on the rupture plane can be transformed from the wavenumber domain to the spatial domain.
2. Establishing the ground motion attenuation relationship:
Each sub-source in the finite fault source model can be regarded as a point source. Based on seismology, the Fourier amplitude spectrum of ground motion caused by point source can be calculated by Eq. (6).
where, C is the scale coefficient; S(M0,f) is the source spectrum; G(R) is the geometric attenuation term; D(R,f) is the viscous attenuation term; A(f) is the amplitude amplification factor near the surface; P(f) is the high-frequency cut-off filter near the surface; I(f) is the ground motion type factor, and the ground motion acceleration is expressed as I(f) = (2πf)2.
Regional parameters in Sichuan are from Jiang [8]. Regional finite fault source models are established to synthesize the PGA attenuation relationship of strong earthquakes. Based on the statistics of the general characteristics of regional seismic structures, the representative values of dip angle and buried depth are selected. According to the scaling law of source parameters and considering the uncertainty, the source parameters are estimated and the regional finite fault source models are established. The PGA sites with the same distance are synthesized one by one from Eq. (6), and the PGA attenuation relationship of Sichuan is established.
3.4 Sensitivity Analysis of Dip Angle and Upper Edge Depth of Rupture Plane
The main range of fault dip angle in Sichuan is from 50° to 80°. It is difficult to establish and use attenuation relationship by multiple dip angles. In order to analyze the influence of dip angle on the attenuation of ground motion, the burial depth of the upper edge of rupture plane is temporarily taken as 5 km, and the same values of shear wave velocity and medium density of the crust media in Sichuan are selected [8]. Four magnitudes of Mw 6.0, 6.5, 7.0 and 7.5 are set and four dip angles of 50°, 60°, 70° and 80° respectively are selected for each magnitude. 30 source models are established and the ground motion is synthesized. The attenuation relationship of PGA mean value is taken, wherein the PGA of epicenter is taken from the seismic action of surface points with epicenter distance of 1 km [5] and 3 km [21] from the zoning map of the United States in 2014. Take the median of them to estimate the epicenter distance. The average PGA of 2 km surface point is shown in Fig. 4. In the figure, each map corresponds to a magnitude, and the four curves in each map correspond to four dip values.

Figure 4: Effect comparisons on PGA attenuation of 4 magnitudes of 4 dip angles
It can be seen from Fig. 4 that the attenuation characteristics of PGA are not different for each magnitude with different dip angles, and the attenuation characteristics of different magnitudes are quite different. The influence of four dip angles on epicenter PGA of each magnitude earthquake is compared, as shown in Table 6.

When the buried depth of the upper edge of rupture plane is taken as a fixed value, the change of dip angle of the finite fault source model will make the upper edge of the whole rupture plane rotate as an axis. The steeper the dip angle is, the deeper the whole rupture plane is, and the smaller the surface PGA is, but the relative difference with 70° is less than 5%. It can be seen that the change of dip angle is not sensitive to the synthetic PGA, and it is feasible to select the mean value of 70° to establish the source model of regional finite fault in Sichuan, which can meet the needs of engineering.
The dip angle is 70° and the buried depth of the upper edge is 4, 5, 6, 7 and 8 km, respectively. The regional source parameters, magnitude and synthetic ground motion method are the same as the above. The average PGA attenuation characteristics are studied, and PGA attenuation curves corresponding to four magnitudes and five different buried depths are obtained, as shown in Fig. 5. In the figure, each map corresponds to a magnitude, and the five curves in each map correspond to five upper edge values. The corresponding epicenter mean PGA results are shown in Table 7.

Figure 5: Effect comparisons on PGA attenuation of 4 magnitudes at different upper edge depths of rupture plane

It can be seen from Fig. 5 that under the same dip angle and magnitude, PGA decreases with the increase of the buried depth of the upper edge of rupture plane. The value within 30 km has a significant impact on the attenuation of PGA, especially the difference within 15 km. With the increase of distance, the difference gradually decreases, and the farther the distance, the less obvious the difference.
From the Figures and Tables, the composite epicenter and short-distance PGA are sensitive to the buried depth of the upper edge of rupture plane, and the difference between the epicenter area is 20%–40%, thus the selection of fixed value cannot meet the engineering requirements. Therefore, the buried depth of the upper edge of the regional finite-fault model established is reasonable according to Table 5.
4 Establishing Source Model of Regional Finite Fault
4.1 The Steps of Establishing Regional Finite-Fault Source Model
Aiming at 26 magnitudes of 6.0 ≤ Mw ≤ 8.5 and 0.1 intervals, 30 regional finite-fault source models of each magnitude in Sichuan are studied and established based on the FORTRAN program developed by us, and the specific steps are as follows:
(1) According to the regional crustal structure and focal depth distribution, the average value of the regional focal depth is determined, and then the rupture width corresponding to each magnitude is estimated according to the scaling law with the dip angle of 70°, and the burial depth of the upper edge is calculated by Eq. (1).
(2) For each magnitude, the expected values of the global parameters of the three sources are estimated according to the global parameter scaling law, which are substituted into the local parameter scaling law to estimate the expected values of the asperity parameters and the coordinates of the rupture starting point. They are replaced with the corresponding standard deviation and substituted into the truncated normal distribution to generate 30 groups of source parameter values, which are placed in the determined part of the slip distribution of the rupture plane.
(3) The spatial corner wave numbers kcx and kcy of each group are estimated. The high wave number sliding wave number spectrum is generated by k−2 two-dimensional sliding model formula. The slip distribution is generated by transforming the part together with the determined part back to the space domain [8].
4.2 Estimation of Global Parameters
According to the above steps, the expected values of some magnitude global parameters of the regional source model obtained are shown in Table 8, in which the rupture length is obtained from the ratio of rupture area to width without standard deviation.

In order to express the discreteness of source parameter data, 30 random numbers are generated by substituting
4.3 Estimation of Local Parameters
Referring to the local parameter scaling law, the maximum asperity parameter can only be estimated when Mw ≤ 6.5, and other asperity parameters can be estimated when Mw > 6.5 [8]. According to the results in Table 8, the corresponding local parameters estimated by the scaling law include the maximum asperity area Sm, width Wm, length Lm, average slip Dm, center coordinate along strike Xm and dip Ym, other asperity area S0, width W0, length L0, average slip D0, center coordinate along strike X0 and dip Y0, the rupture starting point coordinate along strike Xs and dip Ys. The wave numbers of spatial corners are shown in Table 9. The asperity width is determined by the ratio of asperity area. The corresponding coordinates are calculated according to the positions of other asperities. There is no estimation of standard deviation, which are listed in “/” left and right respectively. In order to consider the uncertainty of the estimation, 30 sets of local parameter values are generated for each magnitude according to Eqs. (2)–(4).

4.4 The Process and Steps of Generating Regional Finite-Fault Source Model
Taking the M7.0 earthquake as an example, according to a set of global and local parameters, the process and steps of source model generation can be simply summarized into the following six steps: Put the maximum and other asperities on the rupture plane, assign the corresponding fault slip; further divide the rupture plane into 29 × 29 grids, interpolate and smooth to obtain the corresponding fault slip; transform it into wavenumber domain through Fourier transform; combined with the wavenumber spectrum of k−2 model to form the total wavenumber spectrum; transform it from the wavenumber domain to the space domain. Then the staggered distribution is generated as shown in Fig. 6.

Figure 6: Slip distribution of one rupture plane
4.5 Finite Fault Source Model of Three Magnitudes
According to the above ideas and steps, 30 source model parameters of 26 magnitudes are obtained, and the slip distribution of Mw6.0, 7.0 and 8.0 are shown in Figs. 7–9, respectively.

Figure 7: Slip distributions of Mw6.0 three source models
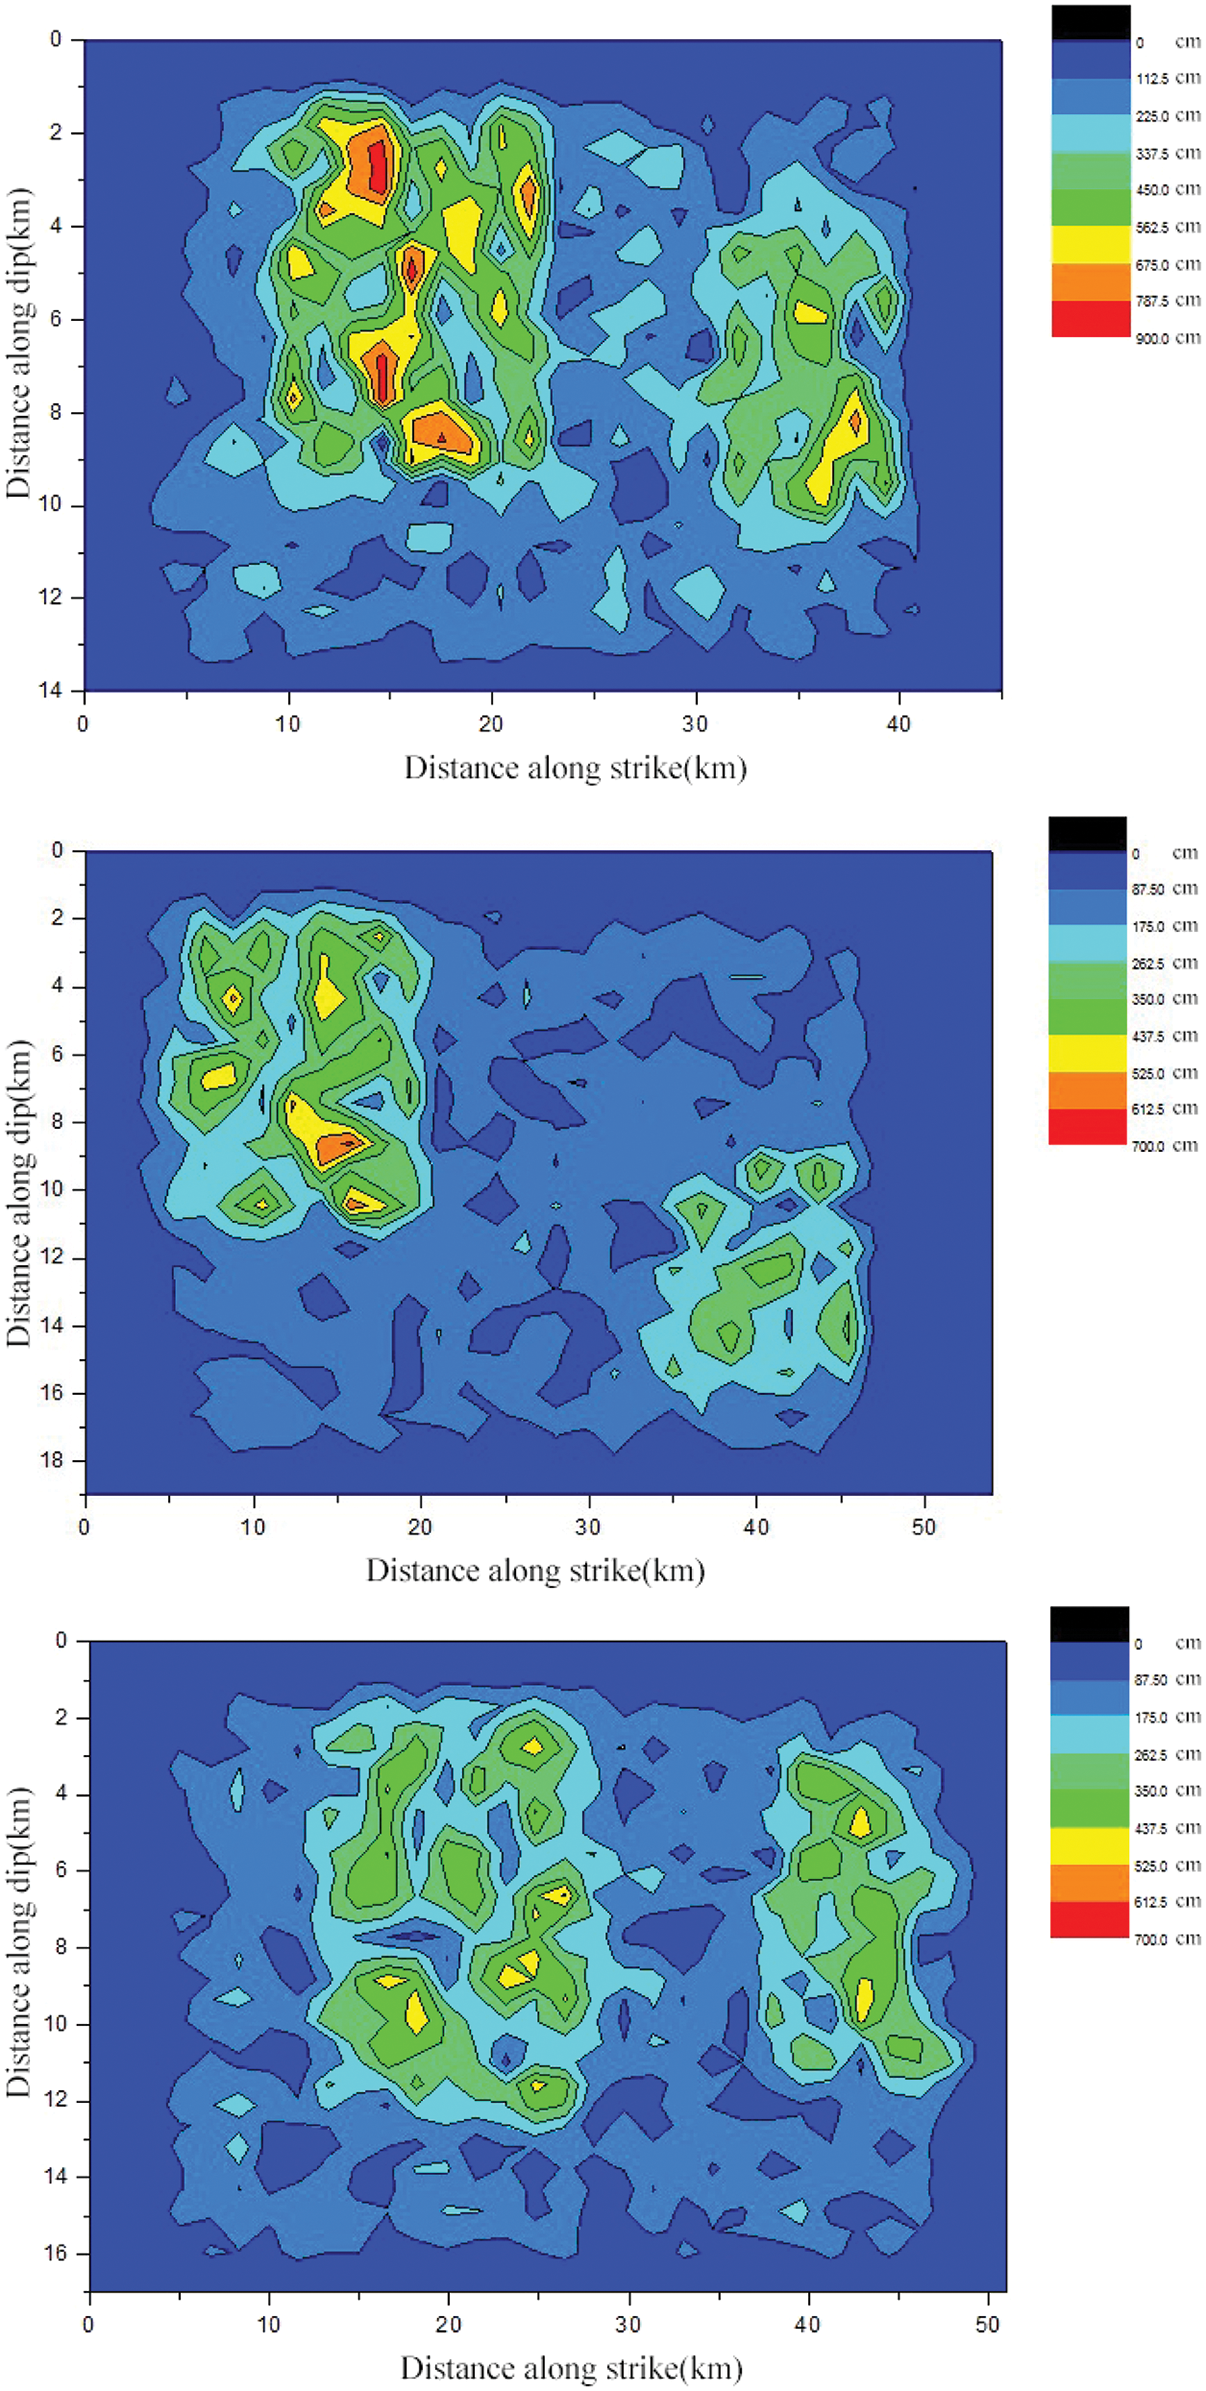
Figure 8: Slip distributions of Mw7.0 three source models

Figure 9: Slip distributions of Mw8.0 three source models
4.6 Discussion of Source Models
Fig. 7 shows that each source model of Mw6.0 earthquake has only one asperity, and most of them live in the middle of the rupture plane. Because the uncertainty of source parameters is considered in these models, the size and position of roughness are changed. In addition, due to the randomness of k−2 model, the original rectangular asperity boundary becomes very complex.
Figs. 8 and 9 show that each source model of the large earthquakes has two asperities and similar characteristics. Most of other asperities are located on the right side of the maximum one, which are consistent with the expected values of source parameters in Table 8. To some extent, the complex staggered distribution reflects the randomness of the position and size of the largest and other asperities, as well as the influence of K−2 model.
Figs. 6–9 show that the empirical relationship reflecting the basic physical characteristics of earthquake sources. The source parameter relationship established by previous seismic data is feasible for the prediction of future earthquakes. In general, the regional finite fault source model of Sichuan synthesized by this method can comprehensively reflect the regional source characteristics.
In this paper, a set of regional finite-fault source model of Sichuan, China is established for the research and development of regional ground motion attenuation relationship. The main results and work novelties are as follows:
(1) Different from the source model of given magnitude on active fault, in order to establish a finite fault source model with regional attenuation relationship, this paper emphasizes that the dip angle and buried depth of the source rupture plane should reflect the overall characteristics of regional seism-tectonics. The comprehensive representative values of the parameters are selected, and the results of regional seism-tectonics and focal mechanism solution are summarized. It is pointed out that the overall average value of dip angle is 70°. Based on the sensitivity analysis of the dip angle, the attenuation characteristics of PGA are estimated. A fixed value of 70° is determined, which is simpler and more practical than the zoning map method of the United States in 2014. According to the statistical analysis of the upper crustal structure and the focal depth of Sichuan earthquake, the thickness of the sedimentary cover restricts the burial depth of the upper edge of rupture plane. Through the sensitivity analysis of PGA attenuation characteristics of buried depth, it is pointed out that the sensitivity is high. Based on the analysis of geometric relationship, the concept and calculation formula of buried depth can be calculated. It avoids the instability of PGA attenuation characteristics caused by the random value of buried depth on the upper edge of the zoning map of the United States.
(2) In order to develop the attenuation relationship of regional ground motion in Sichuan, the general characteristics of regional seism-tectonics are emphasized. Considering the characteristics of regional crustal structure and focal depth, the maximum value of rupture plane width is calculated, and a set of concepts and steps for establishing the source model of regional finite fault are put forward. The specific estimation methods of two kinds of source parameters and the problems that should be paid attention to are introduced. In the process of 30 groups of source parameters generation for each magnitude, the coordination of geometric relations among parameters, such as the area, length and width, is emphasized. In order to ensure the total energy conservation of each magnitude, the relationship between the asperity area and the average slip is coordinated by formulas. The expected values of source parameters, standard deviations and the slip distribution of some source models of several earthquakes are listed. These are all new concrete processing methods, which are practical and make up for the possible loopholes in logic. The regional finite-fault source models established lay a foundation for the further study of regional ground motion attenuation based on seismology.
Funding Statement: This work was supported by the National Natural Science Foundation of China (51678540; 51778197); Heilongjiang Province Key Research and Development Program Guidance Project of China (GZ20220028); Heilongjiang Bayi Agricultural University Support Program for San Heng San Zong (ZRCPY202225); Heilongjiang Bayi Agricultural University Project of Scientific Research Initiation Plan for Learning and Introducing Talents of China (XYB2014-06) and Daqing Science and Technology Plan Project of China (zd-2021-86).
Conflicts of Interest: The authors declared that there is no conflict of interest in the paper.
References
1. Tao, Z. R., Zhang, M., Wang, L. Y., Tao, X. X., Chen, W. J. (2022). Two technical paths for testing of PSHA map. China Civil Engineering Journal (in press). https://doi.org/10.15951/j.tmgcxb.21111104 [Google Scholar] [CrossRef]
2. Hu, J. J., Zheng, X., Xie, L. L. (2018). Derivation of ground motion attenuation relation for earthquake in the South China Sea areas based on a hybrid method. China Civil Engineering Journal, 4(1), 1–11. https://doi.org/10.15951/j.tmgcxb.2018.07.005 [Google Scholar] [CrossRef]
3. Atkinson, G. M. (2008). Ground-motion prediction equations for eastern North America from a referenced empirical approach: Implications for epistemic uncertainty. Bulletin of the Seismological Society of America, 98(3), 1304–1318. https://doi.org/10.1785/0120070199 [Google Scholar] [CrossRef]
4. Yu, Y. X. (2016). Establishment and characteristic analysis of attenuation relationship of ground motion parameters in new generation seismic zoning map. City and Disaster Reduction, (3), 34–38. https://doi.org/10.3969/j.issn.1671-0495.2016.03.009 [Google Scholar] [CrossRef]
5. Campbell, K. W. (2003). Prediction of strong ground motion using the hybrid empirical method and its use in the development of ground-motion (attenuation) relations in Eastern North America. Bulletin of the Seismological Society of America, 93(3), 1012–1033. https://doi.org/10.1785/0120020002 [Google Scholar] [CrossRef]
6. Tavakoli, B., Pezeshk, S. (2005). Empirical-stochastic ground-motion prediction for Eastern North America. Bulletin of the Seismological Society of America, 95(6), 2283–2296. https://doi.org/10.1785/0120050030 [Google Scholar] [CrossRef]
7. Cao, Z. L., Tao, X. X. (2018). Review on broadband ground motion simulation based on frequency-wavenumber Greens function. Earthquake Engineering and Engineering Dynamics, 38(5), 33–40. https://doi.org/10.13197/j.eeev.2018.05.33.caozl.004 [Google Scholar] [CrossRef]
8. Jiang, W. (2018). Seismology-based hybrid attenuation relationship of PGA on rock site (Ph.D. Thesis). Institute of Engineering Mechanics, China Earthquake Administration, China. [Google Scholar]
9. Tao, Z. R., Tao, X. X. (2017). Ground motion attenuation relationships based on seismology. Journal of Harbin Institute of Technology, 49(6), 171–177. https://doi.org/10.11918/j.issn.0367-6234.201602009 [Google Scholar] [CrossRef]
10. Cao, Z. L., Tao, X. X., Tao, Z. R., Tang, A. P. (2019). Kinematic source modeling for the synthesis of broadband ground motion using the f-k approach. Bulletin of the Seismological Society of America, 109(5), 1738–1757. https://doi.org/10.1785/0120180294 [Google Scholar] [CrossRef]
11. Thingbaijam, K. K. S., Martin Mai, P., Goda, K. (2017). New empirical earthquake source-scaling laws. Bulletin of the Seismological Society of America, 107(5), 2225–2246. https://doi.org/10.1785/0120170017 [Google Scholar] [CrossRef]
12. Ancheta, T. D., Darragh, R. B., Stewart, J. P., Seyhan, E., Silva, W. J. et al. (2013). PEER NGA-West2 database. PEER Report. https://peer.berkeley.edu/research/data-sciences/databases. [Google Scholar]
13. Jiang, W., Tao, X. X., Zhao, K. (2017). Statistical scaling laws of global parameters of source model from NGA data. China Earthquake Engineering Journal, 39(2), 221–226+247. https://doi.org/10.3969/j.issn.1000-0844.2017.02.0221 [Google Scholar] [CrossRef]
14. Sianipar, D., Huang, B. S., Ma, K. F., Hsieh, M. C., Chen, P. F. et al. (2022). Similarities in the rupture process and cascading asperities between neighboring fault patches and seismic implications: The 2002–2009 Sumbawa (Indonesia) earthquakes with moment magnitudes of 6.2–6.6. Journal of Asian Earth Sciences, 229(6), 105167. https://doi.org/10.1016/j.jseaes.2022.105167 [Google Scholar] [CrossRef]
15. Jiang, W., Tao, X. X., Tao, Z. R. (2022). Seismology-based hybrid ground motion prediction models of PGA in Sichuan, China. Soil Dynamics and Earthquake Engineering, 156(6), 107220. https://doi.org/10.1016/j.soildyn.2022.107220 [Google Scholar] [CrossRef]
16. Ruiz, J., Baumont, D., Bernard, P., Berge-Thierry, C. (2007). New approach in the kinematic k−2 source model for generating physical slip velocity functions. Geophysical Journal International, 171(2), 739–754. https://doi.org/10.1111/j.1365-246X.2007.03503.x [Google Scholar] [CrossRef]
17. Irikura, K., Miyake, H. (2011). Recipe for predicting strong ground motion from crustal earthquake scenarios. Pure and Applied Geophysics, 168(1–2), 85–104. https://doi.org/10.1007/s00024-010-0150-9 [Google Scholar] [CrossRef]
18. Mai, P. M., Thingbaijam, K. K. S. (2014). SRCMOD: An online database of finite-fault rupture models. Seismological Research Letters, 85(6), 1348–1357. https://doi.org/10.1785/0220140077 [Google Scholar] [CrossRef]
19. Jiang, W., Tao, X. X., Tao, Z. R. (2020). Stability of scaling laws for global parameters of finite fault source model. Earthquake Engineering and Engineering Dynamics, 40(1), 133–140. https://doi.org/10.13197/j.eeev.2020.01.133.jiangw.013 [Google Scholar] [CrossRef]
20. Jiang, W., Tao, X. X., Tao, Z. R., Cao, Z. L., Wang, L. Y. (2017). Scaling laws of local parameters of finite fault source model. Earthquake Engineering and Engineering Dynamics, 37(6), 23–30. https://doi.org/10.13197/j.eeev.2017.06.23.jiangw.003 [Google Scholar] [CrossRef]
21. Atkinson, G. M., Boore, D. M. (2006). Ground motion prediction equations for earthquakes in Eastern North America. Bulletin of the Seismological Society of America, 96(6), 2181–2205. https://doi.org/10.1785/0120050245 [Google Scholar] [CrossRef]
22. China Earthquake Networks Center (2019). National earthquake data center. http://data.earthquake.cn. [Google Scholar]
23. Global CMT (2019). Global CMT catalog search. http://www.globalcmt.org/CMTsearch.html. [Google Scholar]
24. Wang, Q. S., Teng, J. W., Zhang, Y. Q., Pi, J. L. (2015). Gravity anomalies and deep crustal structure of the Ordos basin-middle Qinling orogen-eastern Sichuan basin. Chinese Journal of Geophysics, 58(2), 532–541. https://doi.org/10.6038/cjg20150216 [Google Scholar] [CrossRef]
25. Wang, H. Y., Gao, R., Lu, Z. W., Li, W. H., Guo, H. et al. (2017). Deep crustal structure in Sichuan basin: Deep seismic reflection profiling. Chinese Journal of Geophysics, 60(8), 2913–2923. https://doi.org/10.ssss/j.issn.0001-5733.2017.8.000 [Google Scholar] [CrossRef]
Cite This Article
 Copyright © 2023 The Author(s). Published by Tech Science Press.
This work is licensed under a Creative Commons Attribution 4.0 International License , which permits unrestricted use, distribution, and reproduction in any medium, provided the original work is properly cited.
 Downloads
 Citation Tools