
 Submit a Paper
 Propose a Special lssue
 Open Access
ARTICLE

Vibration-Based Fault Diagnosis Study on a Hydraulic Brake System Using Fuzzy Logic with Histogram Features
1 School of Mechanical Engineering, Vellore Institute of Technology, Chennai, 600127, India
2 Centre for Automation, School of Mechanical Engineering, Vellore Institute of Technology, Chennai, 600127, India
* Corresponding Author: Jegadeeshwaran Rakkiyannan. Email:
Structural Durability & Health Monitoring 2022, 16(4), 383-396. https://doi.org/10.32604/sdhm.2022.011396
Received 06 May 2020; Accepted 06 December 2021; Issue published 03 January 2023
 View Full Text
 Download PDF
Abstract
The requirement of fault diagnosis in the field of automobiles is growing higher day by day. The reliability of human resources for the fault diagnosis is uncertain. Brakes are one of the major critical components in automobiles that require closer and active observation. This research work demonstrates a fault diagnosis technique for monitoring the hydraulic brake system using vibration analysis. Vibration signals of a rotating element contain dynamic information about its health condition. Hence, the vibration signals were used for the brake fault diagnosis study. The study was carried out on a brake fault diagnosis experimental setup. The vibration signals under different fault conditions were acquired from the setup using an accelerometer. The condition monitoring of the hydraulic brake system using the vibration signal was processed using a machine learning approach. The machine learning approach has three phases, namely, feature extraction, feature selection, and feature classification. Histogram features were extracted from the vibration signals. The prominent features were selected using the decision tree. The selected features were classified using a fuzzy classifier. The histogram features and the fuzzy classifier combination produced maximum classification accuracy than that of the statistical features.Keywords
The brake is an essential control component that is responsible for the stability of the vehicle. The primary function of a brake system is to decrease the speed of the vehicle and also to stop the vehicle within a minimum distance under unfavorable conditions. An efficient brake system must ensure the safety of the vehicle as well as the person driving the vehicle and people moving on the road. The brake becomes faulty, due to various reasons like an air leak, mechanical fade, pad wear, reservoir leak, etc. When such adverse things occur, the reliability of brake reduces, which results in accidents. Hence, it must be monitored continuously.
The condition monitoring process is used for continuous monitoring and performing necessary actions to avoid the consequences of failure. Controlling failures in the early stages of deterioration is much more cost-effective and life-saving than after the brake failure. Many physical parameters like vibration signals [1,2], sound signals [3], acoustic emission [4], thermal imaging [5], oil particle analysis [6], etc. have been used for the fault diagnosis study. Among them, vibration signals are commonly recommended for condition monitoring studies. Vibration signals of a fault condition, as well as the excellent condition of the brake, can be used for making a decision when intervention is required for maintenance.
As the faults grow, the characteristics of the vibration signal change. Thus, the analysis cannot be done using conventional techniques to predict the brake faults accurately. The vibration signals can be analyzed using advanced processing techniques like Fourier Transform (FT) [7], wavelet analysis [7], etc. The result of such analysis is used to predict the main cause of the fault. In this study, the acquired vibration signals were analyzed using a machine learning approach. Fault diagnosis through the Machine learning approach can be implemented through the following sequential steps; feature extraction, selection, and classification [8]. Features can be statistical [9], wavelet [1], and histogram [10], etc. In this study, histogram features were extracted from the vibration signals. Feature selection is necessitated to reduce the computational complexity. The contributing features must be selected for the classification through feature selection approaches. In the feature selection process, a decision tree was used [11]. The main advantage of the decision tree algorithm is that the decision tree can be used for both feature selection and rule generation. The selected features were classified using a feature classifier. There are various types of feature classifiers for diagnosing brake faults. Some prominent examples are best first tree classifier [12], support vector machine [13], fuzzy classifier [14–16], Naive Bayes classifier [17], Bayes net classifier [18], decision tree [19], K star algorithm [20], etc. However, the histogram, with fuzzy logic, has not been reported for brake fault diagnosis. The combinations of histogram features and fuzzy logic give a better result than the statistical features and fuzzy logic method. Hence, the fuzzy classifier was chosen for this study.
This paper demonstrates the feature classification using fuzzy logic. The faults in the brake system occur due to the frequent application of the brakes. During the gradual progression of the defects, it is very difficult to identify the fault condition. Hence an effort has been initiated for an investigation using the fuzzy logic approach to diagnose the brake faults. Fig. 1 shows the methodology flowchart of the proposed brake fault diagnosis study. The paper has been structured as follows.

Figure 1: Flow chart—brake fault diagnosis using fuzzy logic
1. The experimental study and the experimental procedures have been described in Section 2.
2. Section 3 explains the feature extraction process.
3. Feature selection has been described in Section 4.
4. Section 5 details the feature classification procedure using Fuzzy.
5. The obtained results were discussed in Section 6.
The commercial vehicle hydraulic brake system with branded vehicle parts was fabricated, as shown in Fig. 2. To experiment with the components used in the real world, brand new brake elements were used for acquiring the vibration signals.

Figure 2: Experimental setup–brake fault diagnosis
The piezoelectric type accelerometer (100 mV/g sensitivity and 40 Hz resonant frequency) was used as a transducer for obtaining vibration signals. The accelerometer was coupled to a signal conditioning unit, which consists of an inbuilt charge amplifier and an analog-to-digital converter (ADC). The vibration signals were taken from ADC, and a set of different features was extracted from the acquired vibration signals. Fig. 3 shows the LabVIEW programme used for acquiring the required vibration signals. Initially, the brake component is in good condition. From that, the vibration signals were acquired by using an accelerometer with the following specifications [12].
1. Sample length–1024 (Arbitrarily selected).
2. Sampling frequency-24 kHz.
3. Number of samples per class is 55.

Figure 3: LabVIEW graphical program
The seven fault conditions namely atmospheric air present in the brake liquid, spill of brake oil over the disc, pad wear even and uneven inner, pad wear even and uneven inner & outer pad were simulated onto the brake system. The sample vibration signals acquired under each fault condition are shown in Figs. 4a–4j.
a) Reservoir leak: The airtight seal of the reservoir is opened.
b) Drum brake mechanical fade: Brake fade means the stopping power of the brake is reduced due to the continuous application of brakes, especially under high load or high-speed conditions. Already used brake drums were chosen for this test.


Figure 4: Vibration signal with (a) Good condition, (b) Air present in the brake liquid, (c) Spill of brake oil on the disc, (d) Inner brake pad wear (even), (e) Inner & outer brake pad wear (even), (f) Inner brake pad wear–uneven, (g) Inner and outer brake pad wear-uneven, (h) Mechanical fade on the drum brake,(i) Drum brake pad wear, (j) Reservoir leak
The vibration signals of both good and faulty brake conditions were considered, and the minimum value and maximum value of all the signals were computed. Each signal may have a different minimum value and maximum value. The difference between the maximum values and minimum values was considered as the range. The range is divided into a suitable number of bins. For example, dividing a range into two sub-ranges results in two bins. The number of data points of a vibration signal that fall within each bin forms a bin value. The bins are named as ‘‘H1’’ ,‘‘H2’’, etc. If the range is divided into three sub-ranges, then three bins will be there with names ‘‘H1’’, ‘‘H2’’, ‘‘H3’’, and so on. Totally 70 bin ranges were extracted from the raw vibration signals. Figs. 5a–5j shows the sample histogram bins extracted from the raw vibration signals. Fig. 6 shows the visual basic code used for extracting the histogram bins from the raw vibration signals.


Figure 5: Histogram of vibration signal with (a) Good condition, (b) Air present in the brake liquid, (c) Spill of brake oil on the disc, (d) Inner brake pad wear (even), (e) Inner & outer brake pad wear (even), (f) Inner brake pad wear-uneven, (g) Inner and outer brake pad wear-uneven, (h) Mechanical fade on the drum brake,(i) Drum brake pad wear, (j) Reservoir leak

Figure 6: Classification accuracy vs. number of bins
Feature selection is picking out the best features from the collected set. The main objective of feature selection is to specify a group of input variables through features with negligible information. Manual feature selection leads to time-consuming, and the in-effectiveness. Hence, an algorithmic approach is used in the study for selecting features.
The range of the vibration signal was segregated into several bins. The classification accuracy was computed with several bins (up to 70 bins). Fig. 6 shows the classification accuracy for each bin ranges. Referring to Fig. 6, the decision tree classifier produces maximum accuracy at 59th bin range.
The histogram features of the fifty-ninth bin were used as input to the decision tree algorithm. The decision tree, as shown in Fig. 7, was the output. Referring Fig. 7, the top six contributors (H22, H24, H27, H28, H29, H30, and H33) were identified as dominant features. The theory of entropy and information gain was used for selecting the features.

Figure 7: Decision tree with histogram features
5 Feature Classifications Using Fuzzy Logic
Fuzzy logic is a principle that has been developed to meet the need of uncertainty in day-to-day applications [21,22]. In the real world, most of the data do not have sharp boundaries, and there was always a problem analyzing those kinds of data sets. After the introduction of fuzzy logic, there has been a revolution in the field of classification [23,24]. The fuzzy logic can be defined as a logic that will allow us to classify parameters into or within a range. The fuzzy logic will usually be taking a few inputs like input vector, some set of rules, and assigns values to an output vector. The rules are the ‘‘if and then’’ statements, which can also be called conditional statements of that particular data. The order of rules is considered insignificant. For the problem under study, the condition of the brakes is good or faulty is fuzzy. All the faults do not occur in the brake instantly. Most of them come gradually. The problems of this kind can be modeled using fuzzy logic more closely. A membership function is a curve that defines how each point in the input space is mapped to a membership value between 0 and 1. Trapezoidal membership functions were used in this study. The rules generated from the decision tree algorithm were used for the classification [25]. The membership functions of the selected features are shown in Figs. 8–14 show the membership function of the output condition.

Figure 8: Membership function plot of frequency H24

Figure 9: Membership function plot of frequency H27

Figure 10: Membership function plot of frequency H28
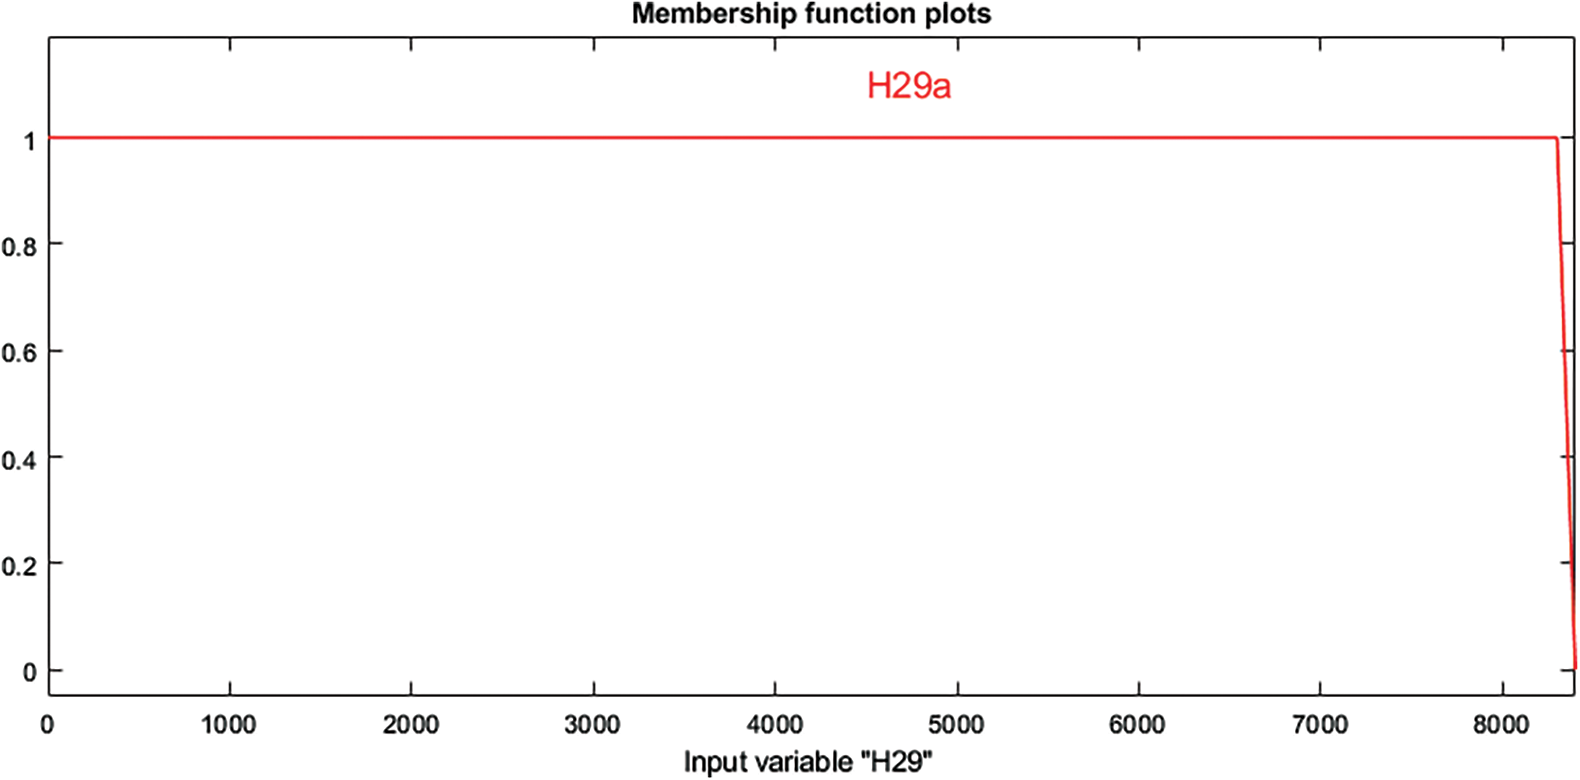
Figure 11: Membership function plot of frequency H29

Figure 12: Membership function plot of frequency H30

Figure 13: Membership function plot of frequency H33
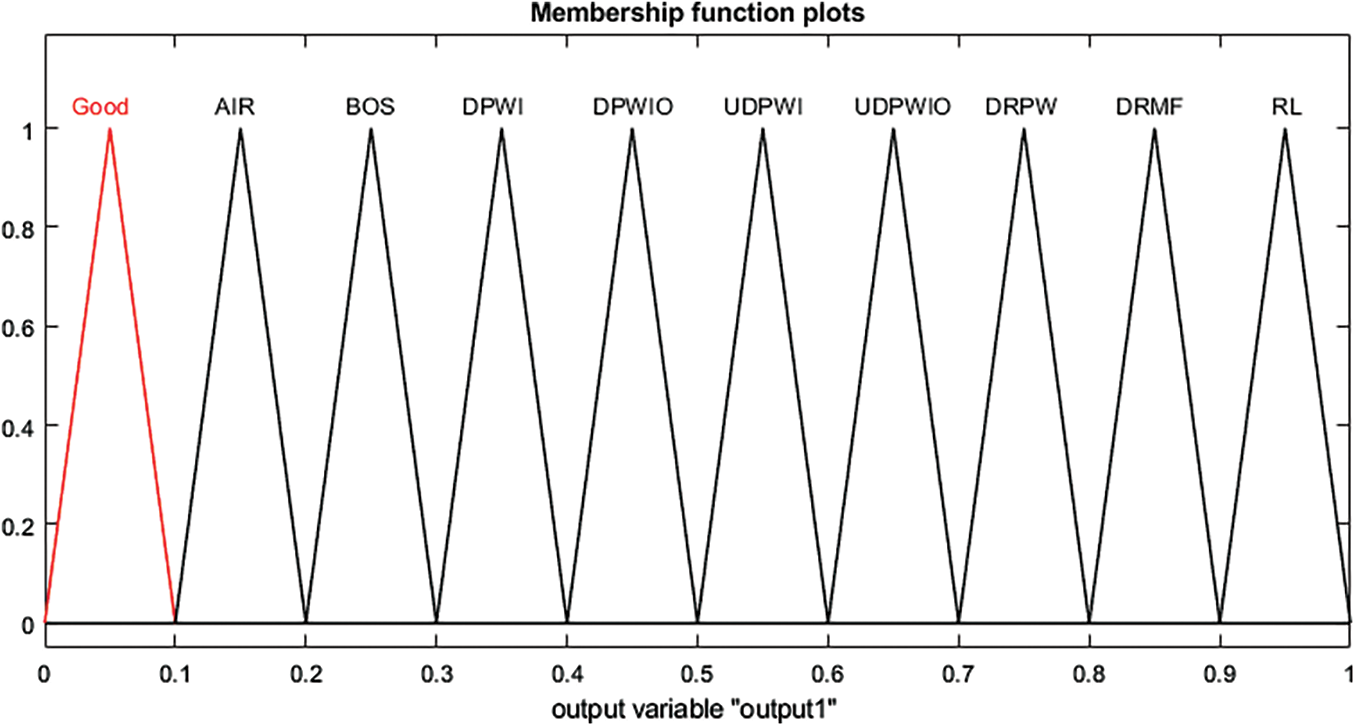
Figure 14: Membership function plots of the output
From the experimental setup, vibrations signals were acquired under different fault conditions. From the extracted vibration signal, relevant histogram features were obtained. Using a decision tree, the most important features were selected. The selected features were classified using Fuzzy logic.
6.1 Rule Generation from Decision Tree
The decision tree shows the relation between features and the condition of the brakes. Tracing a branch from the root node leads to a condition of the brakes (Refer Fig. 6) and decoding the information available in a branch in the form of ‘if-then’ statement gives the following rules:
Rule 1: If (H29 <= 8366) and (H28 <= 1815) and (H33 <= 0) then GOOD (1)
Rule 2: If (H29 <= 8366) and (H28 <= 1815) and (H 33 <= 0) then the condition is AIR (1)
Rule 3: If (H29 <= 8366) and (H28 <= 1181) and (H24 <= 0) and (H27 <= 2) and(H30 > 566) then the condition is UDPWI (1)
Rule 4: If (H29 <= 8366) and (1181 < H28 <= 1815) and (H24 <= 0) then the condition is DPWI (1)
Rule 5: If (H29 <= 8366) and (H28<= 1815) and (H24 <= 0) then the condition is DPWIO (1)
Rule 6: If (H29 <= 8366) and (H28 <= 290) and (H30 <= 80) then the condition is DRPW (1)
Rule 7: If (H29 <= 8366) and (H28 <= 290) and (80 < H30 <= 263) then the condition is DRMF (1)
Rule 8: If (H29 <= 8366) and (H28 <= 290) and (H30 > 80) then the condition is RL (1)
Rule 9: If (H29 <= 8366) and (290 < H28 <= 588) and (H27 <= 2) then the condition is UDPWIO (1)
Rule 10: If (H29 <= 8366) and (H28 > 588) and (H30<= 516) then the condition is BOS (1)
Rule 11: If (H29 <= 8366) and (H28 > 588) and (H30<= 516) then the condition is UDPWIO (1)
Rule 12: If (H29 <= 8366) and (H28 <= 89) and (263 < H30 <= 287) then the condition is RL (1)
Rule 13: If (H29 <= 8366) and (89 < H28 <= 290) and (263 < H30 <= 287) then the condition is DRMF (1)
Rule 14: If (H29 <= 8366) and (290 < H28 <= 588) and (H27 <= 2) then the condition is DRMF (1)
At the end of the rules, the number in the parenthesis indicates the weight or strength of the rule. It varies from ‘0’ to ‘1’. This is a useful direction from designer to fuzzy inference engine, especially when it encounters a situation where the given data set satisfies two rules simultaneously (can be classified into two different classes). This happens when two rules are met by input simultaneously. The weight will help the fuzzy inference engine to choose a particular rule based on its strength or significance.
The fuzzy inference engine was built after defining membership functions and generating the if-then rules. Each rule was given as input to the fuzzy inference engine. The rules were derived from the decision tree. Using the training/testing data, the fuzzy inference engine was evaluated and the result was presented as a confusion matrix, as shown in Table 1.

GOOD: Brake with Good Condition; AIR: Air present in the brake liquid BOS: Spill of brake oil on the disc; DPWI: Inner brake pad wear (even); DPWIO: Inner & outer brake pad wear (even); UDPWI: Inner brake pad wear-uneven; UDPWIO: Inner & outer brake pad wear-uneven; DRPW: Drum brake pad wear; DRMF: Mechanical fade on the drum brake; RL: Reservoir leak.
The misclassification and classification details were identified using the confusion matrix. The diagonal elements represent the correctly classified data, and the non-diagonal elements represent the misclassified data. The first element in the first row represents the signal under good condition. The other elements in the first row represent the miscategorized elements. In the first row of Table 1, among the 55 data, all were correctly classified. Similarly, the fourth element in the fourth row, belongs to Inner brake pad wear (even) (DPWI). Among the 55 data, 53 were correctly classified. The remaining 2 data were misclassified as Inner brake pad wear–uneven (UDPWI) condition. In the same way, all the conditions can be identified. It was found that 3.09% of faulty brake conditions were misclassified as other faulty brakes. Hence, the overall classification accuracy is 96.91% (533 data points out of 550). This classification accuracy with histogram is more than that of the classification accuracy with the statistical features (95.09%) [26]. However, misclassification is only 3.09%, which is good enough for many practical applications.
Classification summary:
Total Number of Instances 550
Correctly Classified Instances 533 96.91%
Incorrectly Classified Instances 17 3.09%
The result of fuzzy classifier with histogram features has been compared with various ML algorithms such as rough set, best first tree, fuzzy rough nearest neighbor as summarized in Table 2. Referring to Table 2, one can easily understand that, the fuzzy classifier with histogram outperforms the other classifiers. Fuzzy has shown improved generalization capability along with enhanced computational performance. Based on the categorization accuracy, a set of rules suggested by fuzzy was used for classification. Using these rules a graphical user interface based on the LabVIEW model can be developed.

The best feature classifier model will be used for designing an onboard diagnostic tool (OBD) which can be used to show the condition of the brake system during operation. The OBD model can be developed using python coding, which is an ongoing development. Hence, this study suggests a suitable methodology for making an OBD model for displaying the results instantly. The entire learning process can be programmed in the existing engine control module through any suitable programming methods. The study encourages to extend this study on a real vehicle with on-road conditions for monitoring the brake condition. This will help the driver to know about the condition of the brake system without any prior knowledge.
An algorithm-based calculation method for feature extraction, feature selection, and feature classification has been presented in this paper. The decision tree was used to derive the rules for the fuzzy classifier. The fault diagnosis of Hydraulic brake utilizing the combination of histogram features along with the fuzzy classifier has brought out positive and encouraging results. As this particular combination has not been tried for the fault diagnosis of Hydraulic brake, this paper will act as an option that could be confidently selected for implementation in the field of fault diagnosis. Individually, the fuzzy classifier with the histogram feature extraction has been widely used for the study of fault diagnosis in various mechanical systems. As the results are encouraging, it can be used for developing an electronic fault diagnosis module for diagnosing brake faults. The study can be extended under all possible speeds and the same can be coded in the existing ECM. This gives the scope for future enhancement with the auto component manufacturers.
Acknowledgement: The authors acknowledged the Vellore Institute of Technology for providing technical assistance and support for the study.
Funding Statement: The authors received no specific funding for this study.
Conflicts of Interest: The authors declare that they have no conflicts of interest to report regarding the present study.
References
1. Manghi, A., Jegadeeshwaran, R. (2019). Vibration based brake health monitoring using wavelet features: A machine learning approach. Journal of Vibration and Control, 25(18), 2534–2550. DOI 10.1177/1077546319859704. [Google Scholar] [CrossRef]
2. Li, Z., Yan, X., Tian, Z., Yuan, C., Peng, Z. et al. (2013). Blind vibration component separation and nonlinear feature extraction applied to the non-stationary vibration signals for the gearbox multi-fault diagnosis. Measurement, 46(1), 259–271. DOI 10.1016/j.measurement.2012.06.013. [Google Scholar] [CrossRef]
3. Henríquez, P., Alonso, J. B., Ferrer, M. A., Travieso, C. M., Gómez, G. (2012). Fault diagnosis using audio and vibration signals in a circulating pump. Journal of Physics: Conference Series, 364(1), 1–12. DOI 10.1088/1742-6596/364/1/012135. [Google Scholar] [CrossRef]
4. Lu, W., Jiang, W., Yuan, G., Yan, L. (2013). A gearbox fault diagnosis scheme based on near-field acoustic holography and spatial distribution features of the sound field. Journal of Sound and Vibration, 323(10), 2593–2610. DOI 10.1016/j.jsv.2012.12.018. [Google Scholar] [CrossRef]
5. Glowacz, A. (2021). Fault diagnosis of electric impact drills using thermal imaging. Measurement, 171, 108815. DOI 10.1016/j.measurement.2020.108815. [Google Scholar] [CrossRef]
6. Kattelus, J., Miettinen, J., Lehtovaara, A. (2018). Detection of gear pitting failure progression with on-line particle monitoring. Tribology International, 118, 458–464. DOI 10.1016/j.triboint.2017.02.045. [Google Scholar] [CrossRef]
7. Zhang, Z., Wang, Y., Wang, K. (2013). Fault diagnosis and prognosis using wavelet packet decomposition, Fourier transform and artificial neural network. Journal of Intelligent Manufacturing, 24, 1213–1227. DOI 10.1007/s10845-012-0657-2. [Google Scholar] [CrossRef]
8. Patange, A. D., Jegadeeshwaran, R. (2021). A machine learning approach for vibration-based multipoint tool insert health prediction on vertical machining centre (VMC). Measurement, 173, 108649. DOI 10.1016/j.measurement.2020.108649. [Google Scholar] [CrossRef]
9. Dhamande, L. S., Chaudhari, M. B. (2018). Compound gear-bearing fault feature extraction using statistical features based on time-frequency method. Measurement, 125, 63–77. DOI 10.1016/j.measurement.2018.04.059. [Google Scholar] [CrossRef]
10. Saravanan, N. (2017). Vibration signal analysis using histogram features and support vector machine for gear box fault diagnosis. International Journal of Systems, Control and Communications, 8(1), 57–71. DOI 10.1504/IJSCC.2017.081542. [Google Scholar] [CrossRef]
11. Ajayram, K. A., Jegadeeshwaran, R., Sakthivel, G., Sivakumar, R., Patange, A. D. (2021). Condition monitoring of carbide and non-carbide coated tool insert using decision tree and random tree–A statistical learning. Materials Today: Proceedings, 46, 1201–1209. [Google Scholar]
12. Jegadeeshwaran, R., Sugumaran, V. (2013). Comparative study of decision tree classifier and best first tree classifier for fault diagnosis of automobile hydraulic brake system using statistical features. Measurement, 46(9), 3247–3260. DOI 10.1016/j.measurement.2013.04.068. [Google Scholar] [CrossRef]
13. Sethy, P. K., Barpanda, N. K., Rath, A. K., Behera, S. K. (2020). Deep feature based rice leaf disease identification using support vector machine. Computers and Electronics in Agriculture, 175, 105527. DOI 10.1016/j.compag.2020.105527. [Google Scholar] [CrossRef]
14. Hameed, S. S., Muralidharan, V., Ane, B. K. (2021). Comparative analysis of fuzzy classifier and ANN with histogram features for defect detection and classification in planetary gearbox. Applied Soft Computing, 106, 107306. DOI 10.1016/j.asoc.2021.107306. [Google Scholar] [CrossRef]
15. Wang, J., Hu, H. (2006). Vibration-based fault diagnosis of pump using fuzzy technique. Measurement, 39(2), 176–185. DOI 10.1016/j.measurement.2005.07.015. [Google Scholar] [CrossRef]
16. Rodríguez-Ramos, A., da Silva Neto, A. J., Llanes-Santiago, O. (2018). An approach to fault diagnosis with online detection of novel faults using fuzzy clustering tools. Expert Systems with Applications, 113, 200–212. DOI 10.1016/j.eswa.2018.06.055. [Google Scholar] [CrossRef]
17. Natarajan, S. (2019). Condition monitoring of bevel gear box using morlet wavelet coefficients and naïve Bayes classifier. International Journal of Systems, Control and Communications, 10(1), 18–31. DOI 10.1504/IJSCC.2019.097412. [Google Scholar] [CrossRef]
18. Liu, R., Yang, B., Zio, E., Chen, X. (2018). Artificial intelligence for fault diagnosis of rotating machinery: A review. Mechanical Systems and Signal Processing, 108, 33–47. DOI 10.1016/j.ymssp.2018.02.016. [Google Scholar] [CrossRef]
19. Krishnakumari, A., Elayaperumal, A., Saravanan, M., Arvindan, C. (2017). Fault diagnostics of spur gear using decision tree and fuzzy classifier. The International Journal of Advanced Manufacturing Technology, 89(9–12), 3487–3494. DOI 10.1007/s00170-016-9307-8. [Google Scholar] [CrossRef]
20. Ravikumar, S., Kanagasabapathy, H., Muralidharan, V. (2019). Fault diagnosis of self-aligning troughing rollers in belt conveyor system using k-star algorithm. Measurement, 133, 341–349. DOI 10.1016/j.measurement.2018.10.001. [Google Scholar] [CrossRef]
21. Husain, Z. (2018). Fuzzy logic expert system for incipient fault diagnosis of power transformers. International Journal on Electrical Engineering and Informatics, 10(2), 300–317. DOI 10.15676/ijeei. [Google Scholar] [CrossRef]
22. Qu, F., Liu, J., Zhu, H., Zhou, B. (2020). Wind turbine fault detection based on expanded linguistic terms and rules using non-singleton fuzzy logic. Applied Energy, 262, 114469. DOI 10.1016/j.apenergy.2019.114469. [Google Scholar] [CrossRef]
23. Gougam, F., Rahmoune, C., Benazzouz, D., Merainani, B. (2019). Bearing fault diagnosis based on feature extraction of empirical wavelet transform (EWT) and fuzzy logic system (FLS) under variable operating conditions. Journal of Vibroengineering, 21(6), 1636–1650. DOI 10.21595/jve.2019.20092. [Google Scholar] [CrossRef]
24. Joodaki, M., Dowlatshahi, M. B., Joodaki, N. Z. (2021). An ensemble feature selection algorithm based on PageRank centrality and fuzzy logic. Knowledge-Based Systems, 233, 107538. DOI 10.1016/j.knosys.2021.107538. [Google Scholar] [CrossRef]
25. Yan, H., Xu, Y., Cai, F., Zhang, H., Zhao, W. et al. (2018). PWM-VSI fault diagnosis for a PMSM drive based on the fuzzy logic approach. IEEE Transactions on Power Electronics, 34(1), 759–768. DOI 10.1109/TPEL.2018.2814615. [Google Scholar] [CrossRef]
26. Shantisagar, K., Jegadeeshwaran, R., Sakthivel, G., Manghai, A. (2019). Vibration based tool insert health monitoring using decision tree and fuzzy logic. Structural Durability & Health Monitoring, 13, 303–316. DOI 10.32604/sdhm.2019.00355. [Google Scholar] [CrossRef]
Cite This Article
 Copyright © 2022 The Author(s). Published by Tech Science Press.
This work is licensed under a Creative Commons Attribution 4.0 International License , which permits unrestricted use, distribution, and reproduction in any medium, provided the original work is properly cited.
 Downloads
 Citation Tools