
 Submit a Paper
 Propose a Special lssue
 Open Access
ARTICLE

Experimental Investigation of Performance Characteristics of PZT-5A with Application to Fault Diagnosis
1
Department of Mechanical Engineering, University of Engineering and Technology Lahore, Narowal Campus, Narowal, 51600, Pakistan
2
Institute of Vibration, Shock and Noise, State Key Laboratory of Mechanical System and Vibration, Shanghai Jiao Tong University,
Shanghai, 200240, China
3
Department of Mechanical Engineering, National Fertilizer Cooperation (NFC), Institute of Engineering and Technology, Multan,
61000, Pakistan
4
Institute of Refrigeration and Cryogenics, Shanghai Jiao Tong University, Shanghai, 200240, China
5
Department of Electrical Engineering, University of Engineering and Technology Lahore, Narowal Campus, Narowal, 51600, Pakistan
6
The School of Informatics, Xiamen University, Xiamen, 361005, China
* Corresponding Authors: Zulkarnain Abbas. Emails: ;
Structural Durability & Health Monitoring 2022, 16(4), 307-321. https://doi.org/10.32604/sdhm.2022.015266
Received 05 December 2020; Accepted 29 November 2021; Issue published 03 January 2023
 View Full Text
 Download PDF
Abstract
In the previous couple of decades, techniques to reap energy and empower low voltage electronic devices have received outstanding attention. Most of the methods based on the piezoelectric effect to harvest the energy from ambient vibrations have been revolutionized. There’s an absence of experiment-based investigation which incorporates the microstructure analysis and crystal morphology of those energy harvest home materials. Moreover, the impact of variable mechanical and thermal load conditions has seldom been studied within the previous literature to utilize the effectiveness of those materials in several practical applications like structural health monitoring (SHM), etc. In the proposed research work, scanning electron microscope (SEM) and energy dispersive x-ray (EDX) analysis are performed to examine the inside crystal morphology of PZT-5A and ensure the quality of the piezoelectric ceramic. Further, the performance of piezoelectric vibration-based energy harvester has been investigated in the second phase of current research work under the variable mechanical and thermal load conditions through a regular series of experiments. It’s been found that the output voltage of piezoelectric sensors will increase by increasing the applied load, whereas a decreasing trend in output voltage is noticed by increasing the applied temperature, resistance and frequency. Within the third part, a measuring setup is developed in the laboratory to further investigate the effectiveness of PZT-5A in practical applications such as electromechanical impedance (EMI) based structural health monitoring under the controlled heating environment. Therefore, this analysis not only evaluates the performance of PZT sensors under the variable operating conditions but also encourages developing a temperature compensation approach in EMI-based SHM.Keywords
Piezoelectric energy harvesters have the capability to convert the strain energy that is generated by some external source into electrical energy and in a similar way these materials change the electric potential into mechanical energy because of their crystalline structure [1]. This distinguished aspect of these materials enables them to absorb the ambient vibrations available in the surrounding in the form of mechanical energy. This mechanical energy is converted into an electrical charge that is used to empower the low voltage electronic devices [2]. There are also some alternative methods to extract the energy besides piezoelectric energy harvesters such as the magnetic force device method. Piezoelectric materials are considered a better choice for some practical applications because of their usefulness as compared to other energy harvesting techniques. These energy harvesters can be adjusted into many microelectromechanical systems (MEMS) due to their small dimensions. Moreover, the working capability of the system can be enhanced when the external parameters like temperature and load are within the suitable limit of piezoelectric energy harvesters. The mechanical potential that is required for the transformation is obtained from the surrounding. Despite possessing ideal specifications, however, piezoelectric materials have not earned so much attention in the field of energy scavenging because of the small output voltage. Piezoelectric energy harvesters are adaptable because most of the dynamic systems are based on the phenomenon of vibration. These piezoelectric energy harvesters have low noise and a broad dynamic range [3–5]. These vibrations based piezoelectric energy harvesters are classified into thirty-two types. There are twenty piezoelectric crystals that show a direct piezoelectric effect [6]. The most famous piezoelectric materials are Lead Zirconate Titanate, Barium Titanate, Lithium Tantalite, Lead Potassium Niobate and Sodium Tungstate. The research conducted in 2014 revealed that piezoelectric materials that were developed through circular arrays produce output voltage over the wide range of frequency and load resistance [7]. It has been observed that the resonance frequency has a negative impact on the output voltage of the piezoelectric specimen [8]. The temperature has a significant impact on the performance of piezoelectric materials in many practical applications. Many piezoelectric properties are temperature-dependent and these properties play a vital role in the performance of piezoelectric energy harvesters [9]. Since the output voltage obtained from piezoelectric material is minute, so this voltage is rectified and regulated to charge the batteries [10,11]. Experimental research on piezoelectric materials has revealed that these materials show non-linear response when subjected to the large electric field. This non-linearity has a vital role in the design stage of piezoelectric devices [12]. The concept of functionally graded piezoelectric materials has been introduced to enhance the performance of conventional piezoelectric materials [13]. As described earlier that these materials have small dimensions so they are fitted into any electronic system without affecting its stability [14]. Considering the limitations of other types of sensors, structural health-monitoring systems based on embedded PZTs are now widely used in real-time inspections. These surface-bonded piezoelectric ceramics can perform the function of both actuator and sensor simultaneously. Because of small size, light in weight and high sensing capability, PZTs have a significant role in ultrasonic guided wave inspections. PZT sensors have less impact on the host structure and they are considered more suitable for the integration of health monitoring systems than any other type of sensors. However, to inspect the large surface area, a sensor network is required consists of multiple PZT sensors. The main benefit of such type of sensors’ arrangement is that there exists no difficulty of extracting echo signals. However, all the configurations of PZT sensor networks contain the definite number of sensors. It will not only significantly increase the monitoring cost, but also makes the maintenance work of a large number of sensors more complicated. These two major challenges reduce the practical implementation of PZT sensor networks for the inspection of large surface areas and complex structures. These materials have high polarization rates under the applied vibrating load conditions and as a result, the electric potential is increased [15]. Piezoelectric materials have been applied in electromechanical devices as sensors and actuators. These materials contain many microscopic crystal grains and domains. Because of their asymmetrical crystal structures, such as cubic, tetragonal, and rhombohedran, all domains display anisotropic mechanical and electrical behaviors, and the macroscopic properties of these materials rely heavily on this microscopic crystal morphology. Therefore, it is essential to study the microstructural characteristics of these polycrystalline materials using SEM and EDX [16]. Scanning electron microscopes use concentrated beams of electrons that by interacting with materials at their atomic levels produce signals regarding the materials’ surface composition and topography to generate microscopic images [17]. Clarification of the current environmental sources of variations is also essential to enhance the reliability of other damage inspection techniques, such electromechanical impedance (EMI), etc. [18–23]. The piezoelectric energy harvesters have limited practical applications, so advanced scientific research is essential in this field to investigate their characteristics.
This research work aims to investigate the performance characteristics of PZT-5A under variable mechanical and thermal loading conditions. Firstly, to examine the inside crystal morphology of PZT-5A and ensure the quality of the piezoelectric ceramics, the scanning of electron microscope (SEM) and energy dispersive x-ray (EDX) analysis are carried out. Further, the performance of piezoelectric vibration-based energy harvester has been investigated in the second phase of current research work under the variable mechanical and thermal load conditions through a regular series of experiments. In the next phase, a calculation arrangement is developed to inspect the effectiveness of PZT-5A in electromechanical impedance (EMI) under the controlled conditions.
The research work is arranged into the following sections. Section 2 will cover experimental test procedure and research methodology including material selection. In Section 3, results are discussed in detail. Section 4 will represents the conclusions of the experimental investigation.
Lead Zirconate Titanate is selected in the current research due to its high strain constants, coupling constants, permittivity and high Curie temperature [24,25]. The following equations are derived through the Gibbs free energy:
where
Suppose the influence of the temperature and the magnetic field is neglected, Eqs. (1) and (2) can be written as:
Eq. (5) elaborates the electrical impedance of sensor [26]:
2.2 Microstructure and Crystal Morphology
To verify the elemental composition of the specimen, the morphological investigation of polycrystalline PZT has been carried out using a scanning electron microscope (SEM) operating at 20.0 KV as shown in Fig. 1.
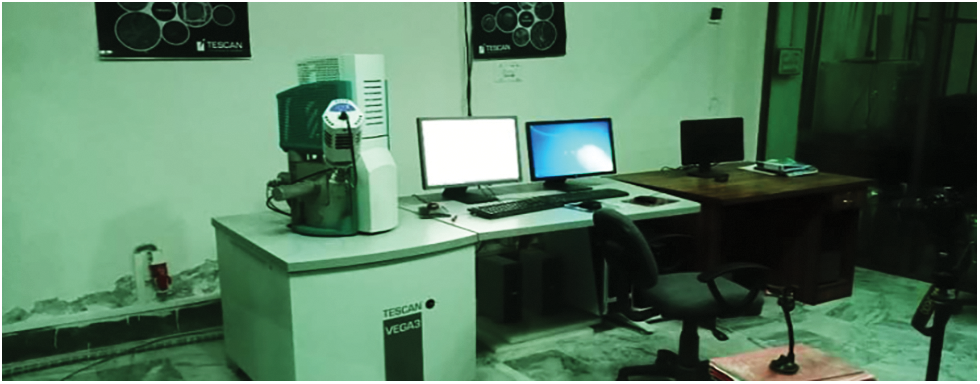
Figure 1: SEM for morphological investigation of PZT sample
The specimen was initially electrically poled in the thickness direction and then cracked with a thin gold layer in the evaporator to charge the electron before scanning. Fig. 2 shows the microstructure of piezoelectric material (PZT-5A). It can be analyzed that the crystal grains are non-uniformly distributed and agglomerated with the large particles all over the substrate.
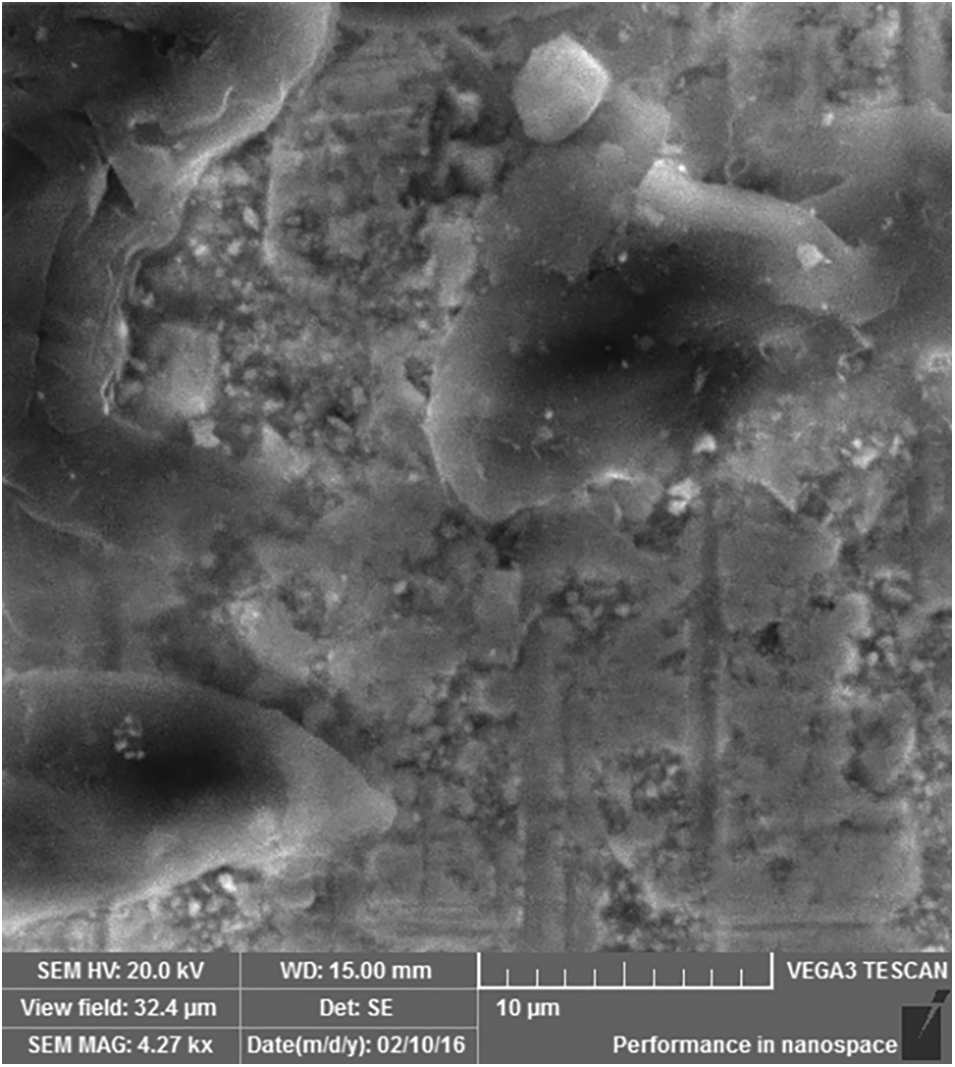
Figure 2: Crystal morphology of PZT-5A
Energy-Dispersive X-ray analysis (EDX) was also doneto verify the elemental percentage of the sample at multiple selected spots. Fig. 3 shows the four spectrums on the PZT-5A sample with the grain size 5 μm to evaluate the material composition.
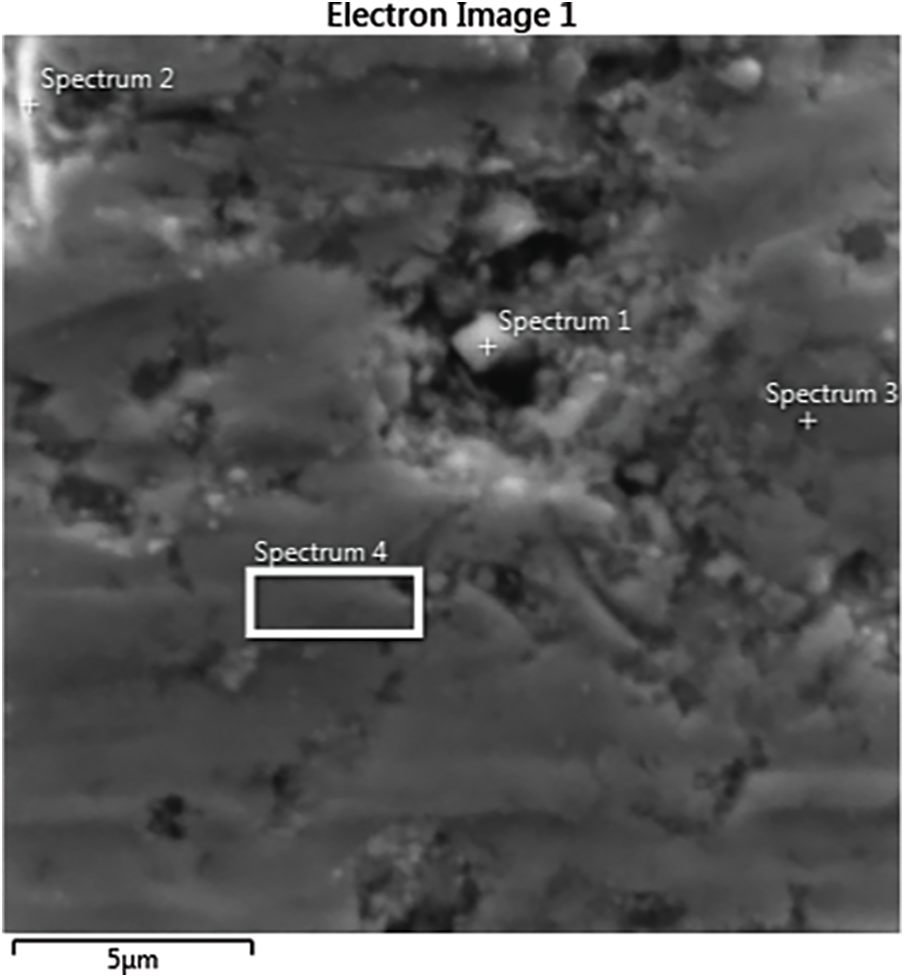
Figure 3: Electron image of PZT-5A with grain size 5 μm
Fig. 4 reveals the elemental composition of the PZT-5A in spectrum 4. It can be noticed that there are no impurities found in the specimen and the EDX shows a clear peak of all elements. Hence the EDX analysis depicts the purity of PZT-5A used for current research work.
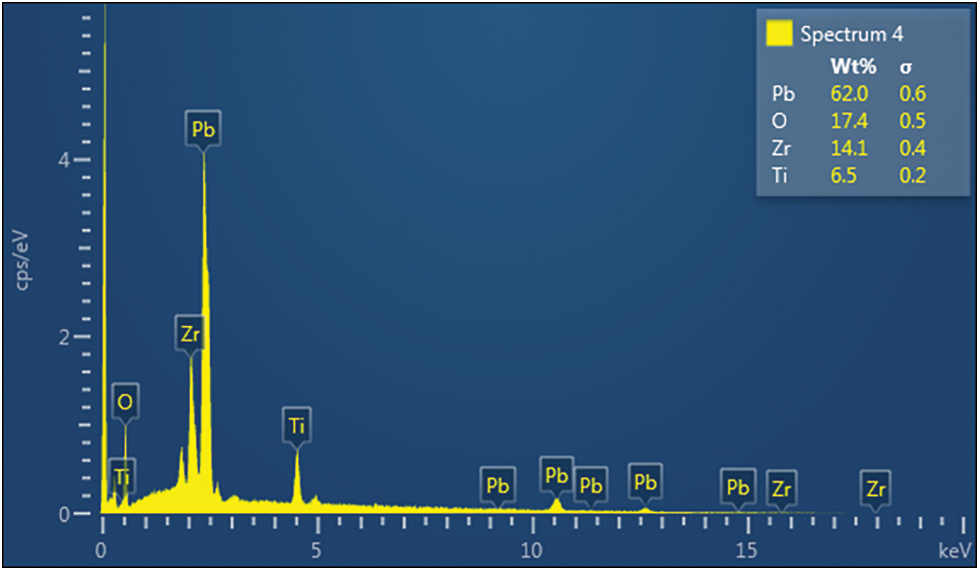
Figure 4: The weight percentage of elements in PZT-5A in spectrum 4
2.3 Experiment Testing Procedure
The experimental setup consists of a load cell to determine the connection between frequency and peak to peak DC output voltage at different loading parameters. Surfaces of the piezoelectric specimen are covered with copper electrodes because these electrodes generate extremely low magnetic permeability and can be operated over a wide range of temperature. The specimen is fitted on a load cell in such a sequence that copper electrodes appear on their top and bottom surfaces. Loading conditions are provided by a 100 N electro-mechanical shaker which is well suited for applications with small strokes and high forces. A function generator is used to adjust the frequency of sinusoidal voltage and electrically shock the piezoelectric specimen. To examine the effect of temperature on the specimen, a heater is placed in an insulating temperature chamber to change the room temperature up to the required high-temperature condition. Particular resistance is provided by two crocodile probes which are connected in series through a decade resistor. To measure peak DC voltage, the electrodes are connected to a digital oscilloscope. The output voltage is analyzed on a digital oscilloscope. The investigational equipment is demonstrated in Fig. 5.
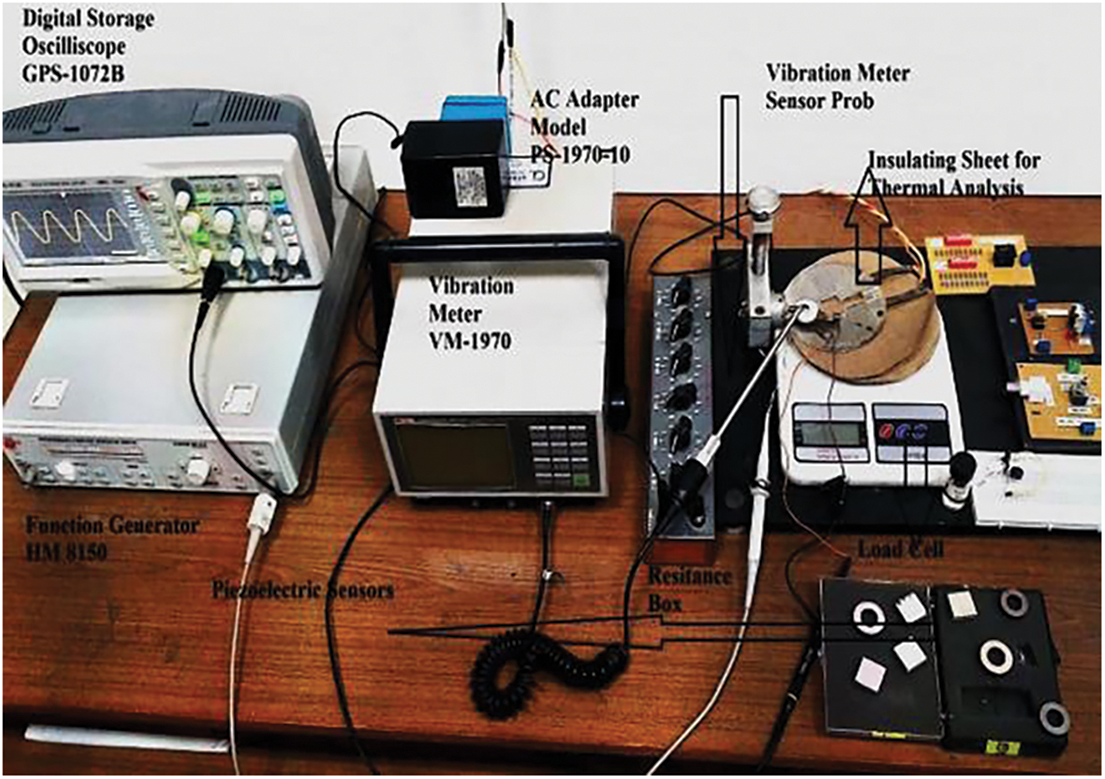
Figure 5: Investigational test setup
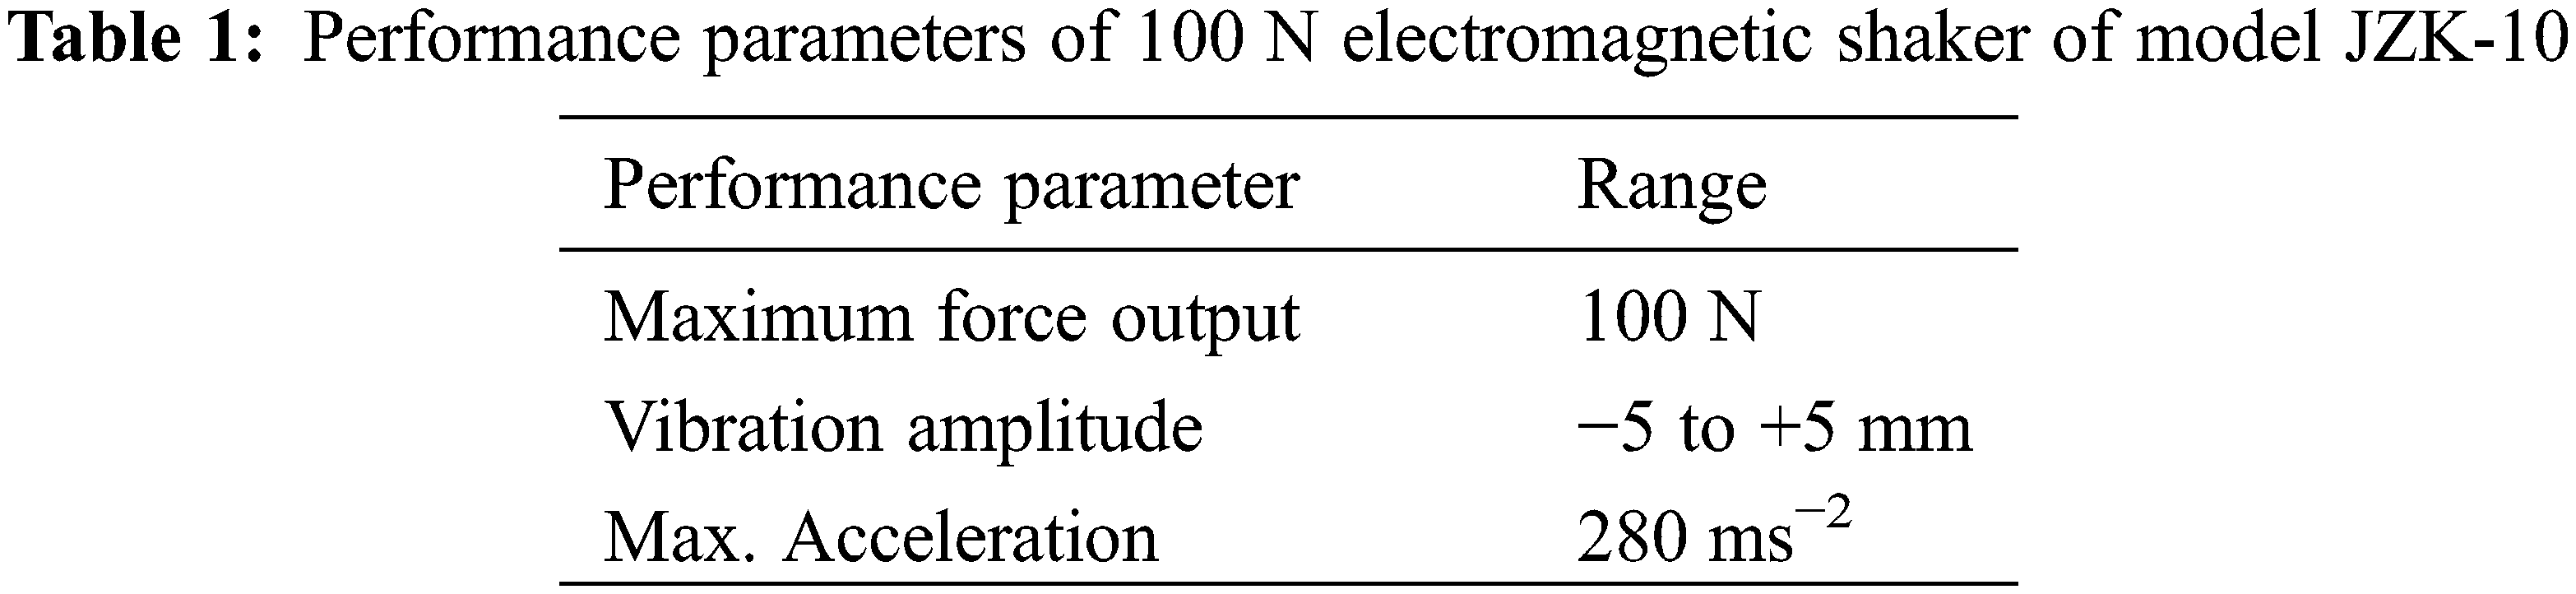
Fig. 6 shows the 100 N electromagnetic shaker of model JZK-10 used in the current experimental setup. It consists of a small vibration table, connecting rod, mounting screws and power cable. It can compute the powerful reaction, regular recurrence and mechanical impedance for medium and enormous size structures at a wide recurrence range. Its performance parameters are described in Table 1.
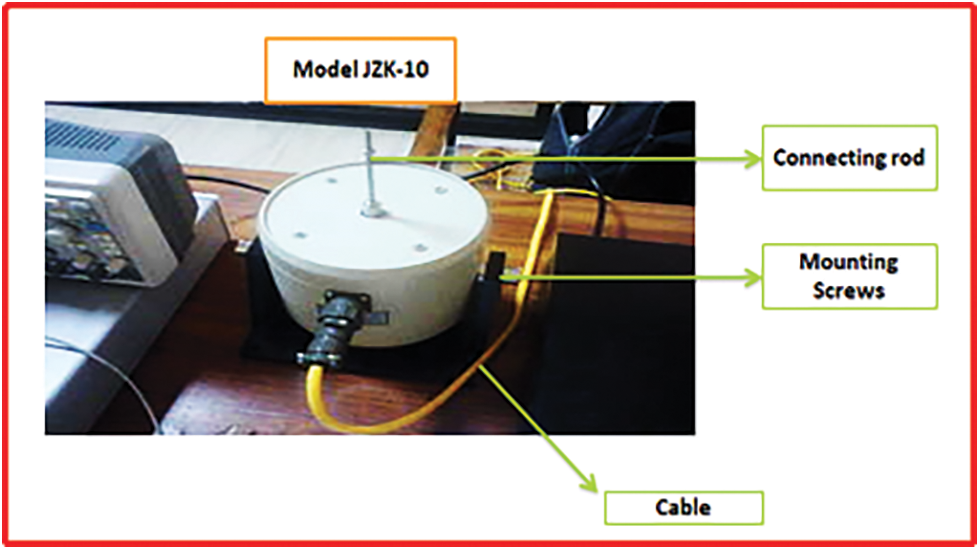
Figure 6: 100 N electromagnetic shaker
In the next phase, a standardized measurement setup is developed in the laboratory to further investigate the effectiveness of PZT-5A in EMI based structural health monitoring or (SHM) under the controlled heating environment. The wide-ranging laboratory equipment is demonstrated in Fig. 7.
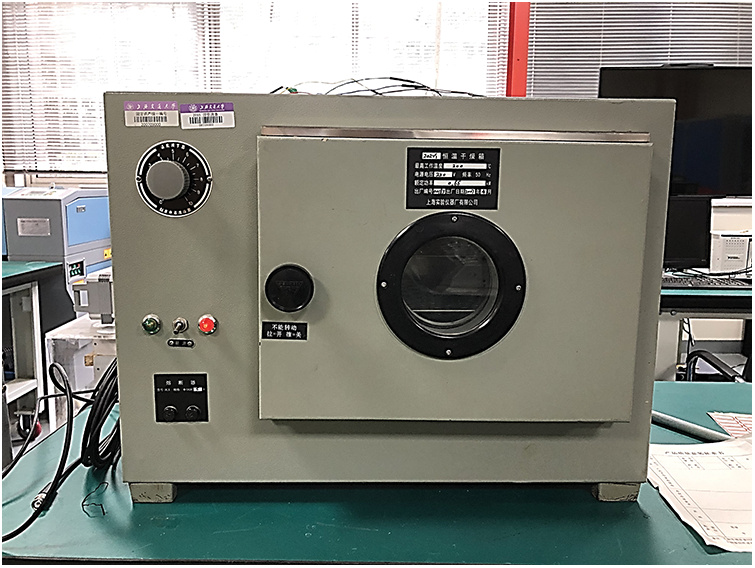
Figure 7: Laboratory equipment
Some significant aspects of the electric thermostatic drying oven chamber are following:
• Elegant design and easy handling;
• Digital temperature controller;
• Stainless steel heating structure and internal shelves;
• Air exhaust mechanism at the top surface;
• Uniform temperature distribution.
The following steps should be performed to operate this chamber:
1. The box should be placed horizontally on a dry work surface in the laboratory.
2. After turning on the electrical power supply, first, check the electrical performance of the box, and pay attention to whether there are open circuits or short circuits.
3. In the next step, the heating switch is turned on immediately, and the temperature regulator knob is turned clockwise from the “0” position to the “10” index. At this time, the temperature inside the box starts to rise and the heating indicator lights up.
4. When the temperature has risen to the required working condition (it can be observed on the thermometer inserted into the vent hole), immediately turn the temperature regulator knob counterclockwise until the heating indicator stops lightening, and then adjust it to light up the heating indicator again. Repeat this adjustment setting at least two to three times till the constant temperature of the box is achieved. If the thermometer shows that the temperature is still rising during the initial stage of the constant temperature, it is caused by the inertia of the working room’s temperature. This phenomenon will be stabilized within half an hour. If the thermometer reading exceeds or falls below the required temperature value, the temperature regulator can be adjusted slightly as described before to achieve the desired temperature.
A beam is shown in Fig. 8 with a slight evident fatigue crack of 10 mm and the bonded location of the PZT sensors.
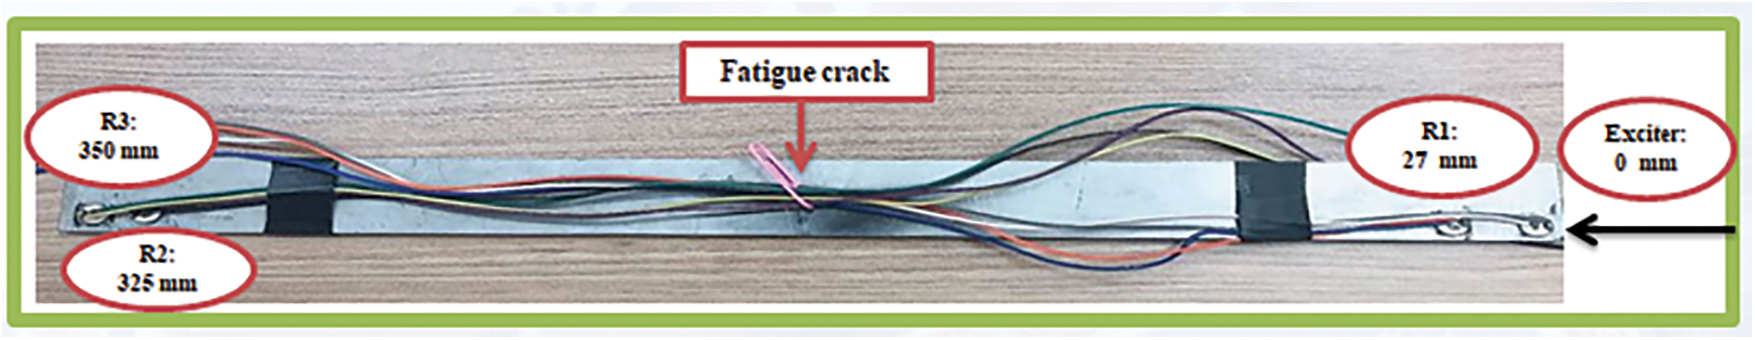
Figure 8: Beam geometry with the exact location of bonded PZTs
To generate the electrical waveforms, an arbitrary function generator is recognized as a significant part of an electronic test setup. Depending on the application, these waveforms are generated in different shapes such as single-shot or repetitive. The required waveform is passed through the examined specimen and analyzed as it propagates to identify the structural abnormality. By utilizing the voltage-controlled oscillator, such kind of function generators is capable of automatically adjusting the frequency of the output signal. This characteristic is very useful to estimate the frequency response of the developed electronic test setup. The practical applications of the function generator are electronic test, sensor simulation and functional test.
An amplifier is a type of electronic equipment which is usually used to boost up the amplitude of the applied signal. To this purpose, its electronic circuit consists of two-ports to receive the power supply for the signal provided to its input terminals and generate a comparatively greater amplitude signal at its output terminals. The range of signal amplification is estimated by its gain that is the ratio of the output voltage to the input voltage. It has the following practical applications:
• Piezoelectric transducer driving
• Meter calibrations
• Low distortion AC power source
To actuate the Hanning window and the amplification of the guided wave signal, an AFG3022B arbitrary/Function generator with an external amplifier (KROHN-HITE-7602M) was used in the current experimental series. To obtain the numerous measurements, the excitation signal was provided continuously while allowing the previous signal to disappear before the propagation of the next signal.
The schematic of these devices is shown in Fig. 9.
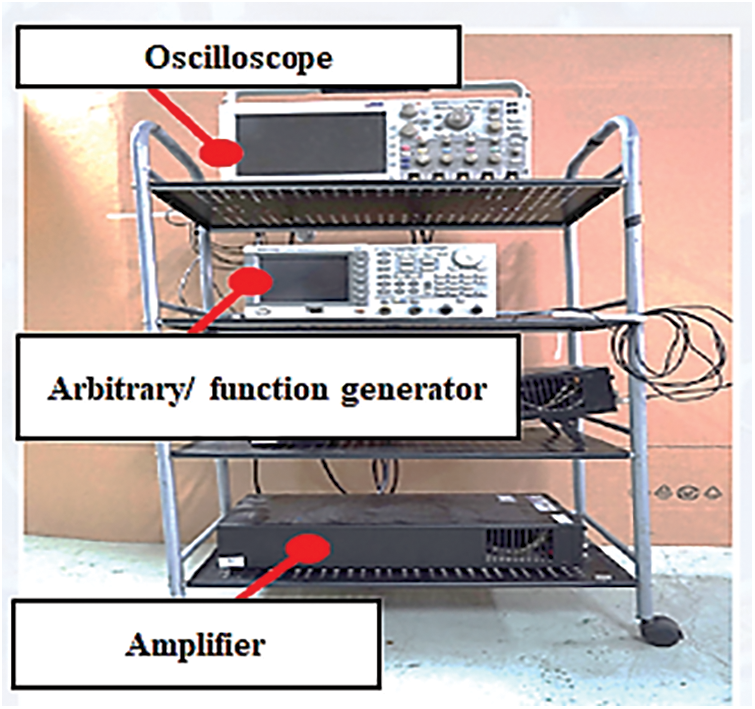
Figure 9: Measuring instruments to deal with signal behaviour
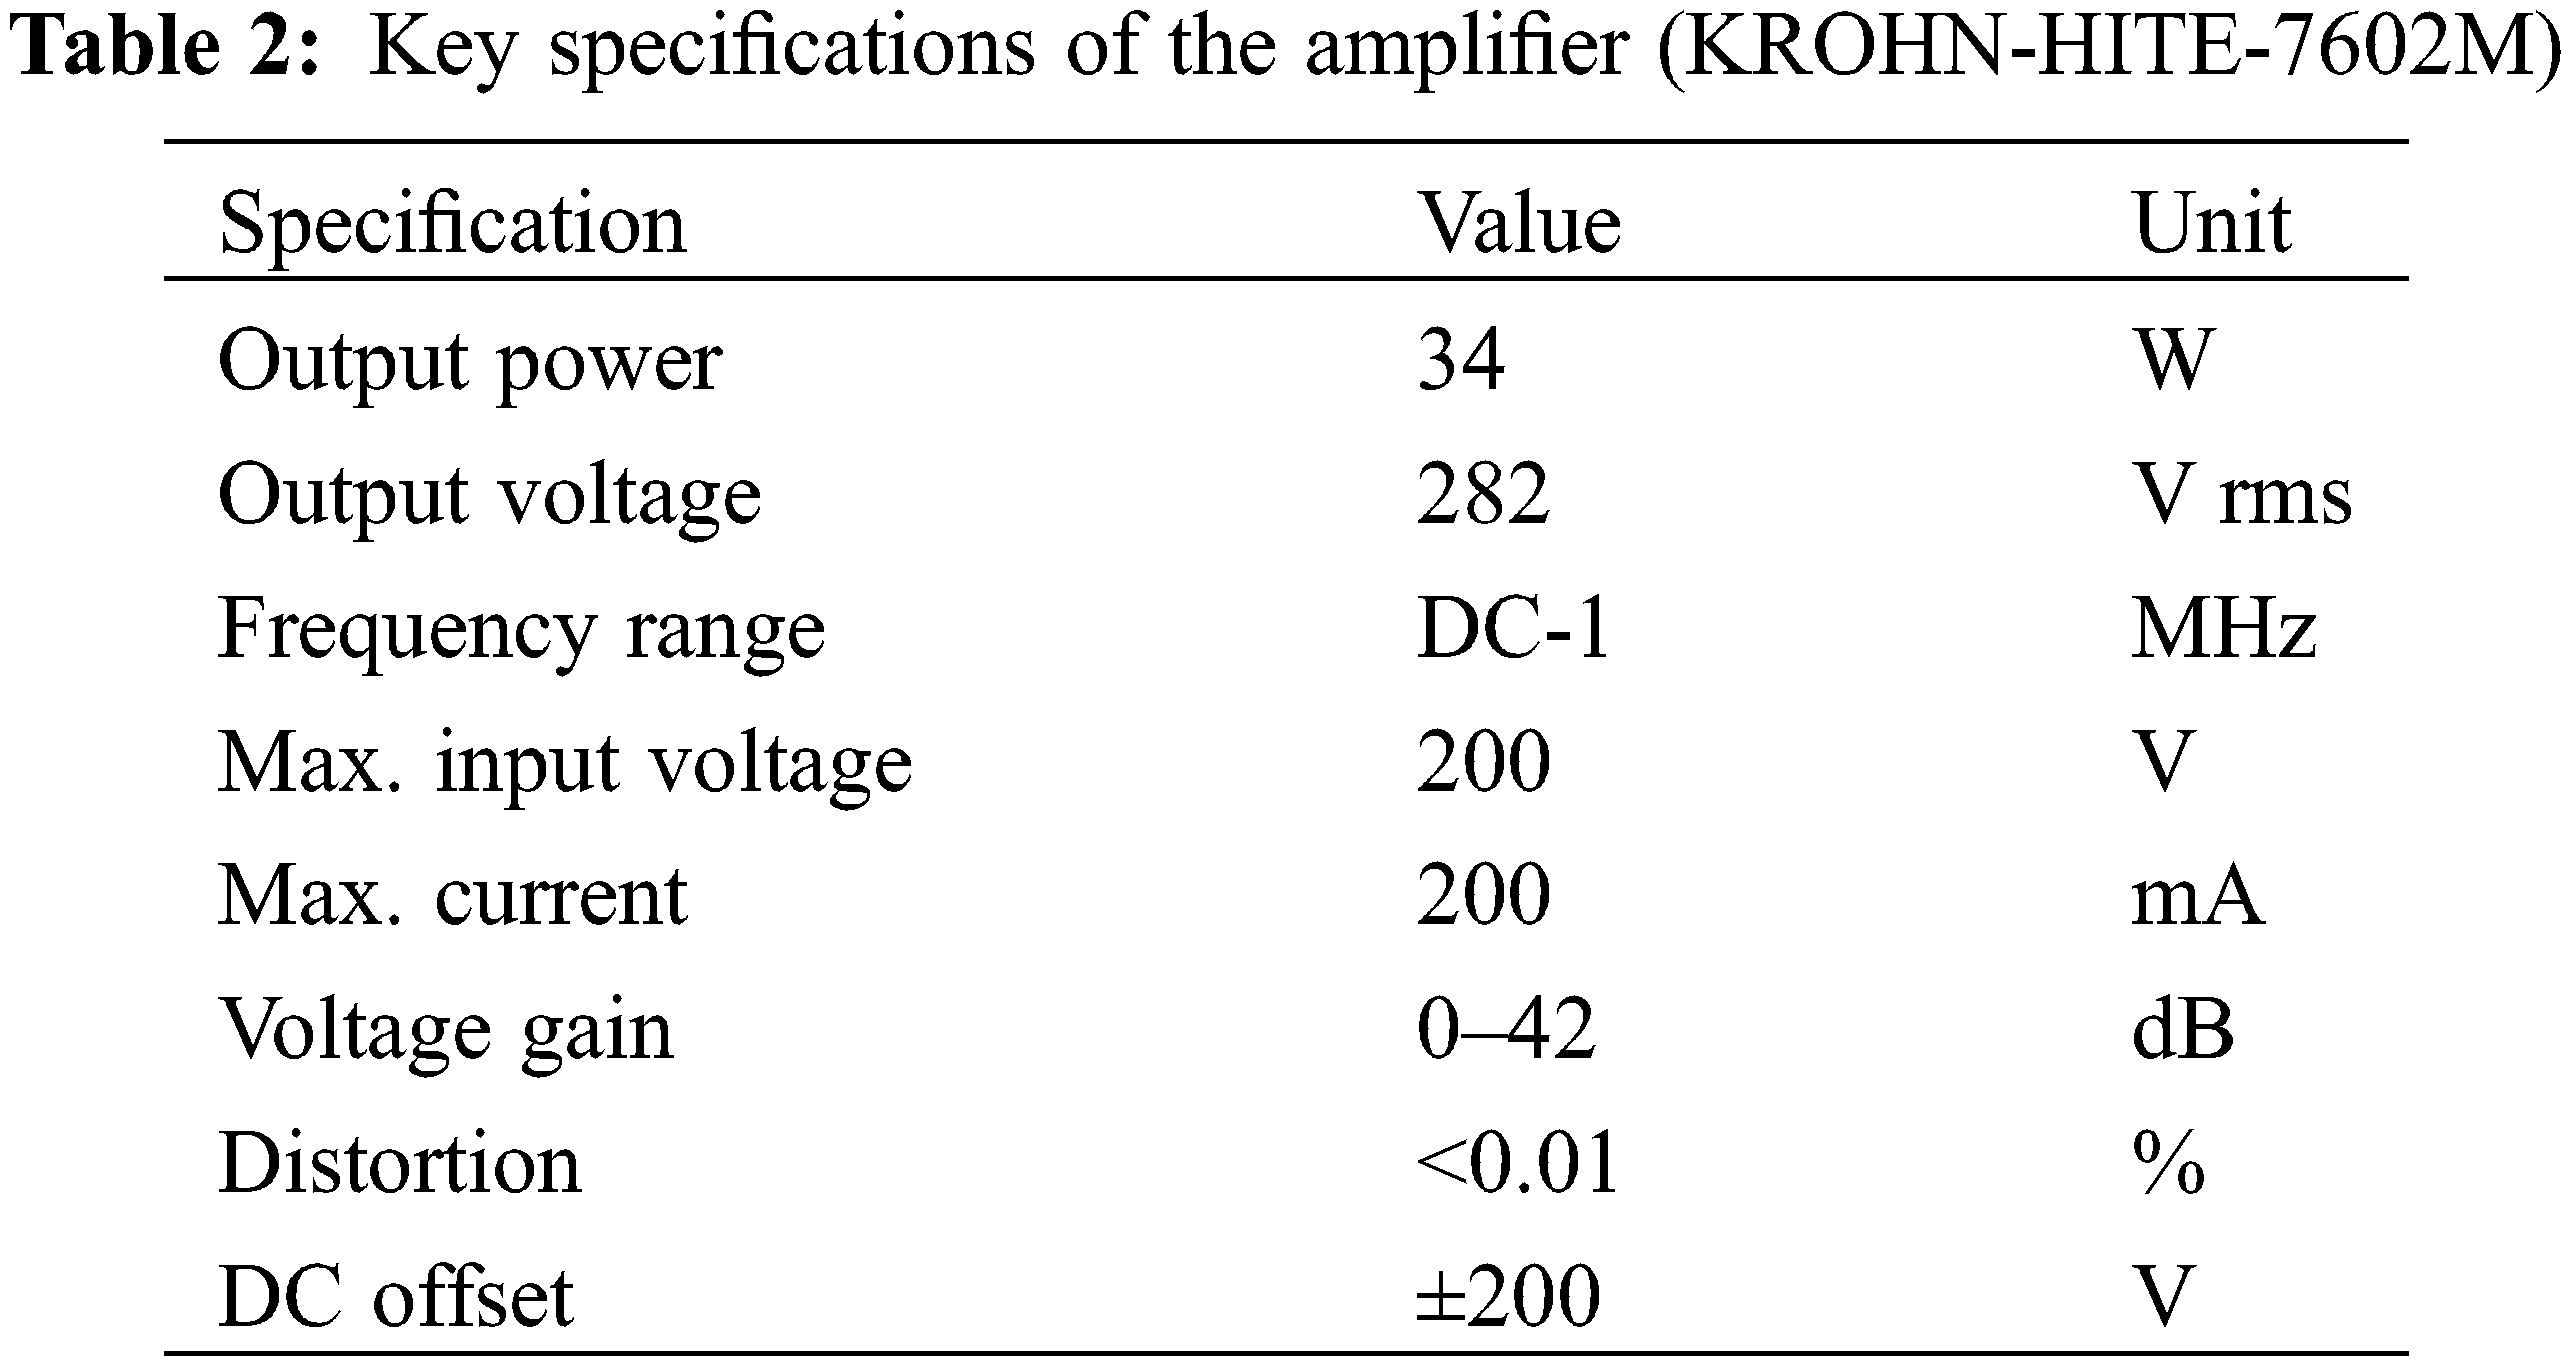
Key specifications of the amplifier (KROHN-HITE-7602M) are represented in Table 2.
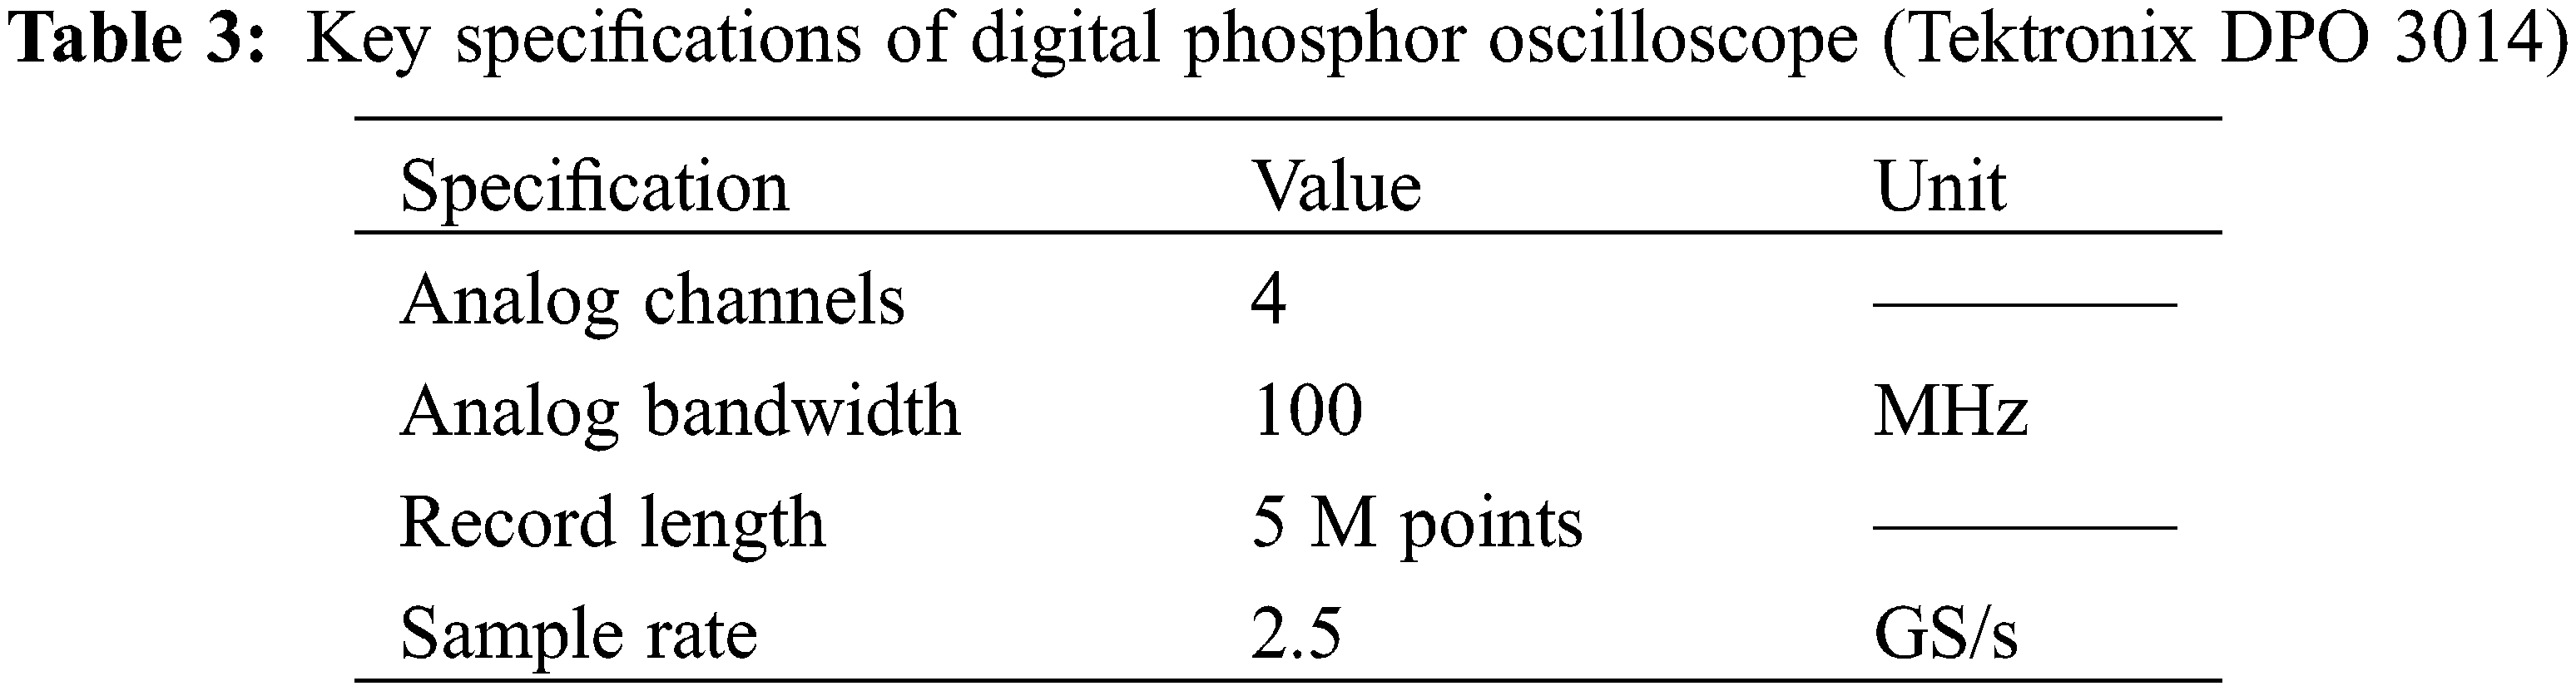
To graphically illustrate the fluctuating signal voltages, a specific kind of electronic test instrument named oscilloscope is utilized in the laboratory experiments. It transforms the sound or vibration signals into the voltages and then displays these signal voltages in the form of the two-dimensional plot as a function of time. On the graphical scale, it illustrates the variation of an electronic signal over time in terms of voltage on Y-axis and time on X-axis, respectively. The corresponding waveform signal is then interpreted to evaluate some significant properties such as frequency, time interval, amplitude, distortion, etc. In the earlier time, the real values of these properties were calculated manually by analyzing the signal waveforms against the scales set into the screen of the measuring device. In this research work, the digital phosphor oscilloscope named Tektronix DPO 3014 is used to save all the measured signals. Its key specifications are demonstrated in Table 3. It has several advanced analysis modules.
Experimental observations and obtained results are interpreted in this section.
3.1 Effect of Mechanical Loading Conditions
By applying the variable loading conditions on the specimen (PZT-5A), it has been analyzed that the maximum peak voltage of 2.9 V is obtained at the applied frequency and mechanical load of 2−5 Hz and 60 kN/m2, respectively. The results are shown in Fig. 10.
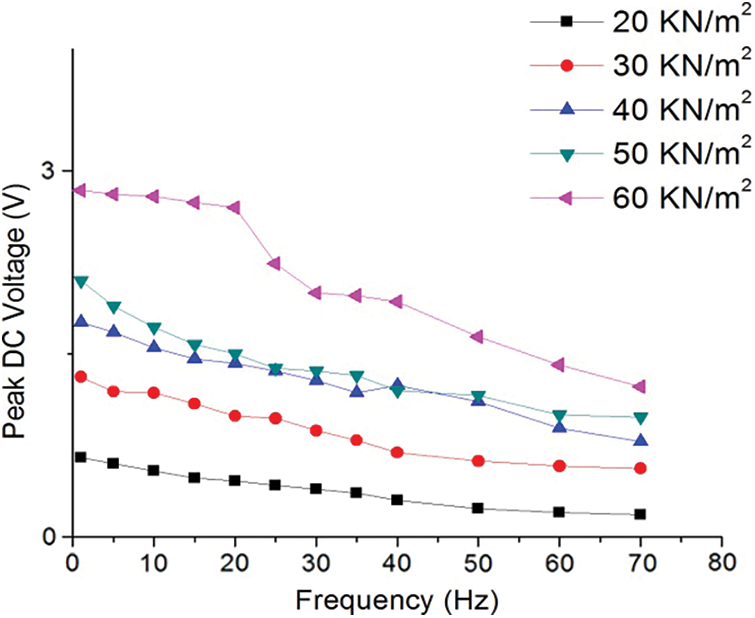
Figure 10: Mechanical load vs. peak DC voltage
It has been found that the maximum peak voltages are obtained at high vibrating load and low-frequency conditions because the rate of polarization of PZT-5A increases at higher vibrating load conditions, while at low frequency there are excellent dielectric, piezoelectric and ferroelectric properties of the examined specimen with less characteristic energy losses. So, piezoelectric materials are suitable for low-frequency range and high loading conditions.
3.2 Effect of Thermal Loading Conditions
Fig. 11 shows that on increasing the temperature the output voltage decreases under operational vibrating loading conditions. In the current analysis, the maximum peak dc voltage of 4.78 V is measured at 120 kN/m2 and 50°C. So, it can be deduced that the piezoelectric materials show good performance when the applied temperature is less than the Curie temperature of the material. Further increment in temperature causes the depolarization in the materials because the piezoelectric properties of materials are disturbed due to highly induced mechanical stresses.
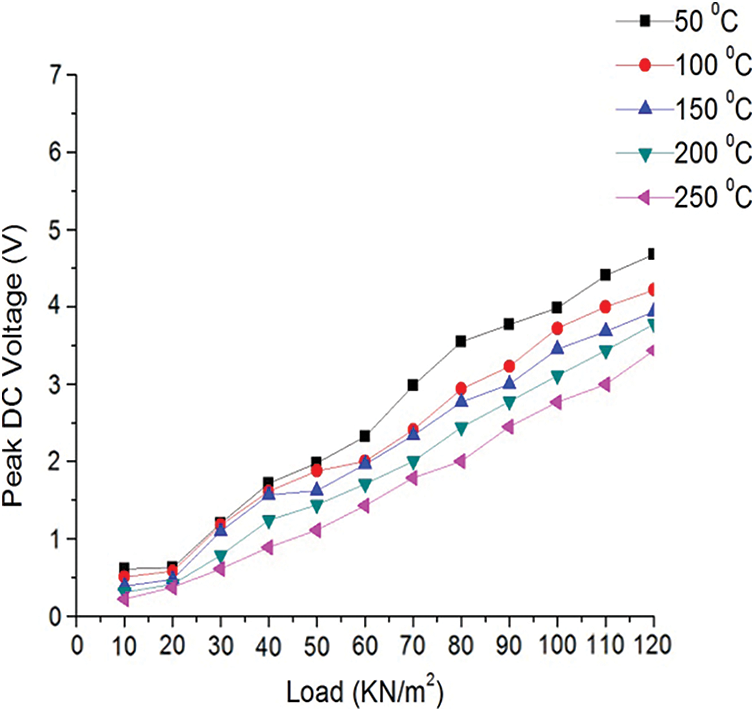
Figure 11: Thermal load vs. peak DC voltage
3.3 Effect of Applied Resistance
To evaluate the effect of the resistance on PZT-5A at constant room temperature 25°C by varying the frequency from 30 to 120 Hz, an experiment is conducted and results are shown in Fig. 12.
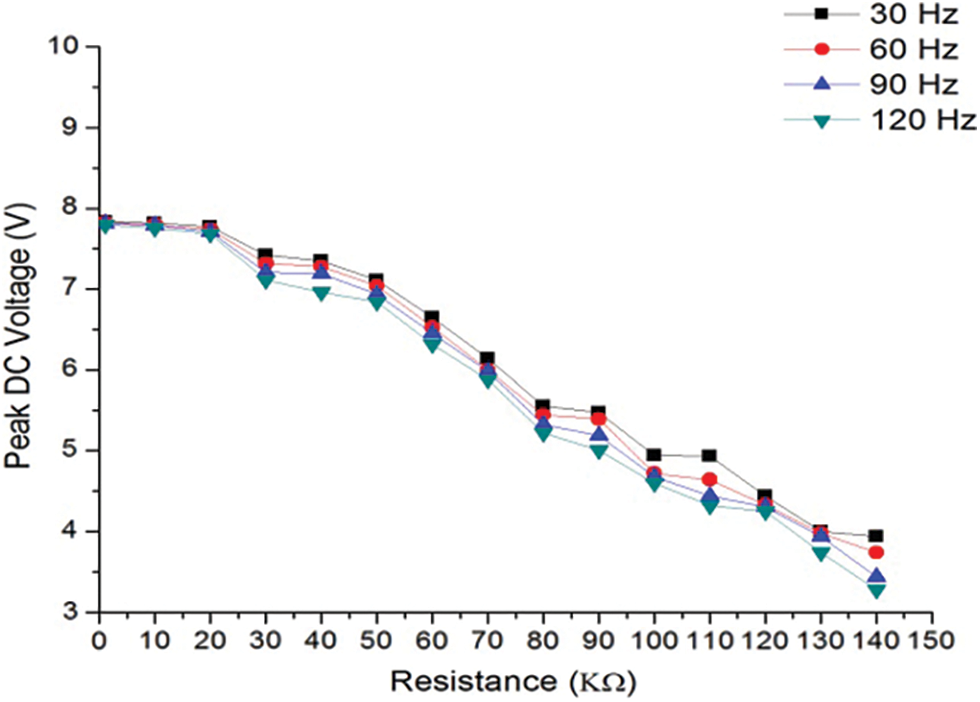
Figure 12: Peak DC voltage vs. resistance
In Fig. 11, we can assume that the output voltage decreases by increasing the value of resistance at a constant temperature as the rate of polling decreases at higher resistance values. According to analysis, the minimum output voltage of 3.2 V is obtained at the applied frequency and resistance of 120 Hz, 140 kΩ, respectively. The output voltage and power of PZT-5A are also examined at constant mechanical loading conditions and varying resistance, the results are shown in Fig. 13.
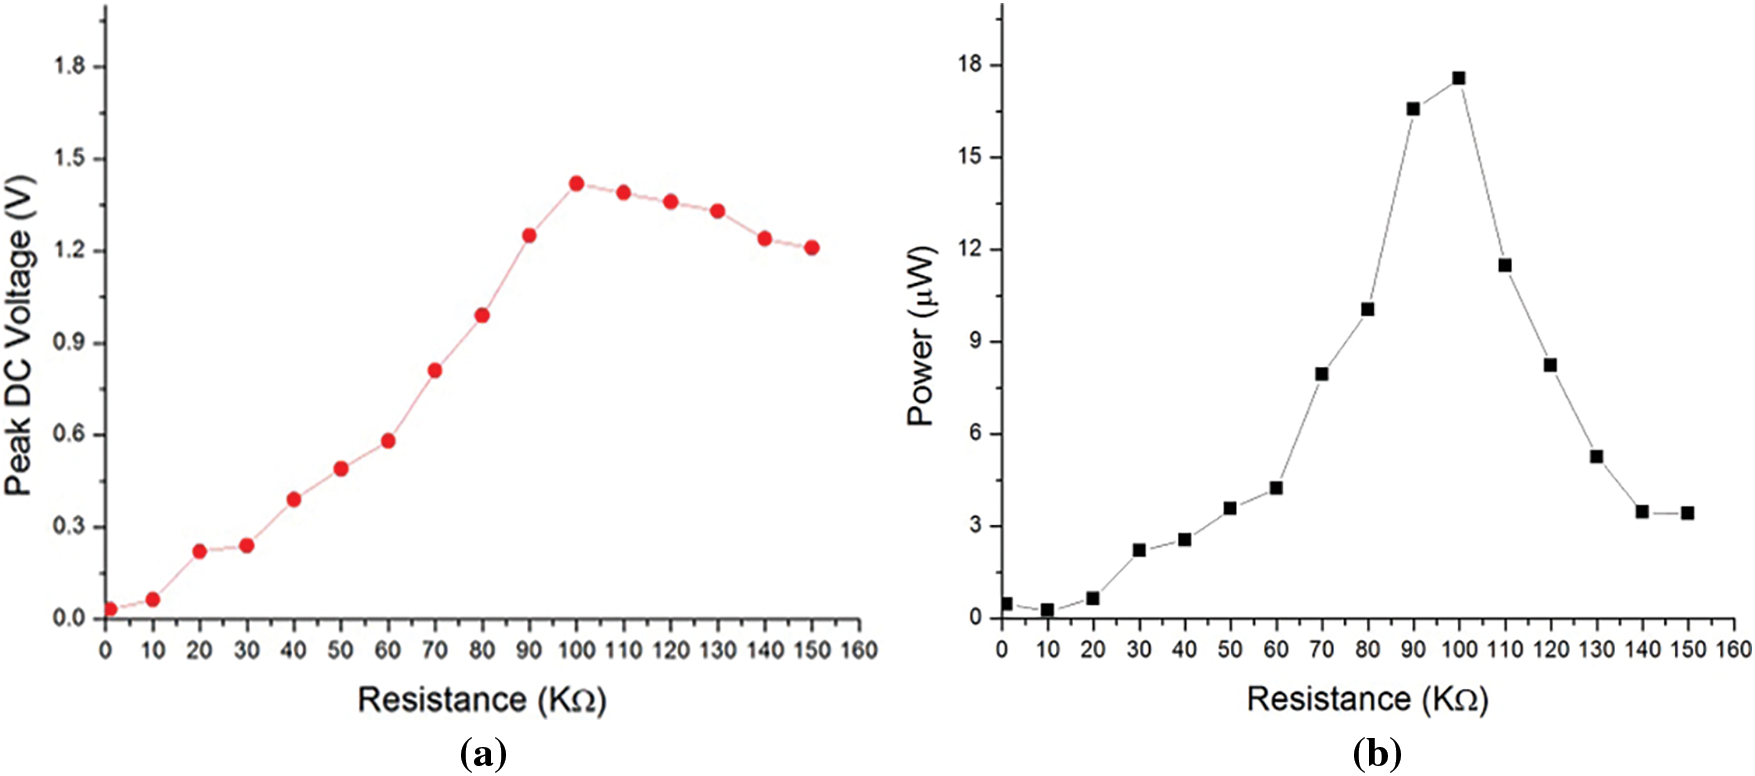
Figure 13: (a) Resistance vs. peak DC voltage (b) Resistance vs. Power
From Fig. 12, obviously the resultant voltage and power first increases and afterward diminishes with applied resistance. Extreme output voltage and power can be achieved at 100 kΩ resistance. At high resistance values, the rate of poling in piezoelectric material decreases and the mechanical quality factor also decreases which cause the reduction in the overall power of PZT-5A. Hence, piezoelectric materials exhibit optimum voltage and power at specific values of applied resistance and frequency.
3.4 Impact of Temperature on the Frequency Shifts
In addition, the normal frequency of the monitored structure is also affected by the temperature variations and its value declines [27]. The frequency shifts (
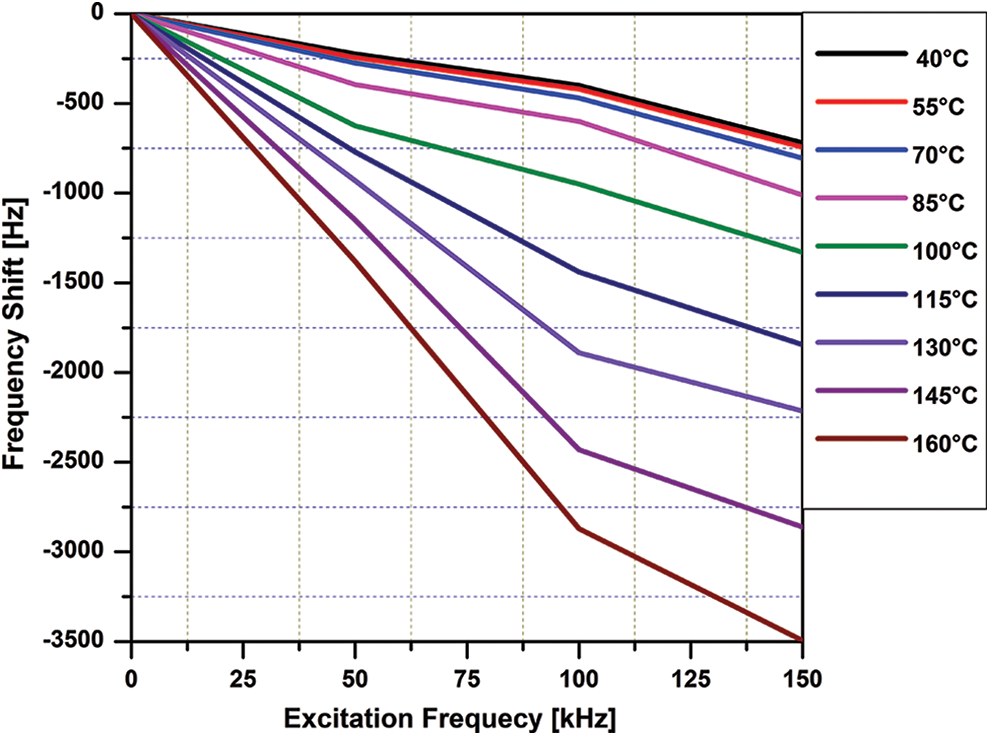
Figure 14: The magnitude of frequency shifts under operational conditions
It can be noticed that the change in (
Ailete 502 adhesive is utilized to fix the sensors on beam surface and its elastic properties are mentioned in [28]. Fig. 15 demonstrates the percentage of the sensor’s bonding strength with temperature.
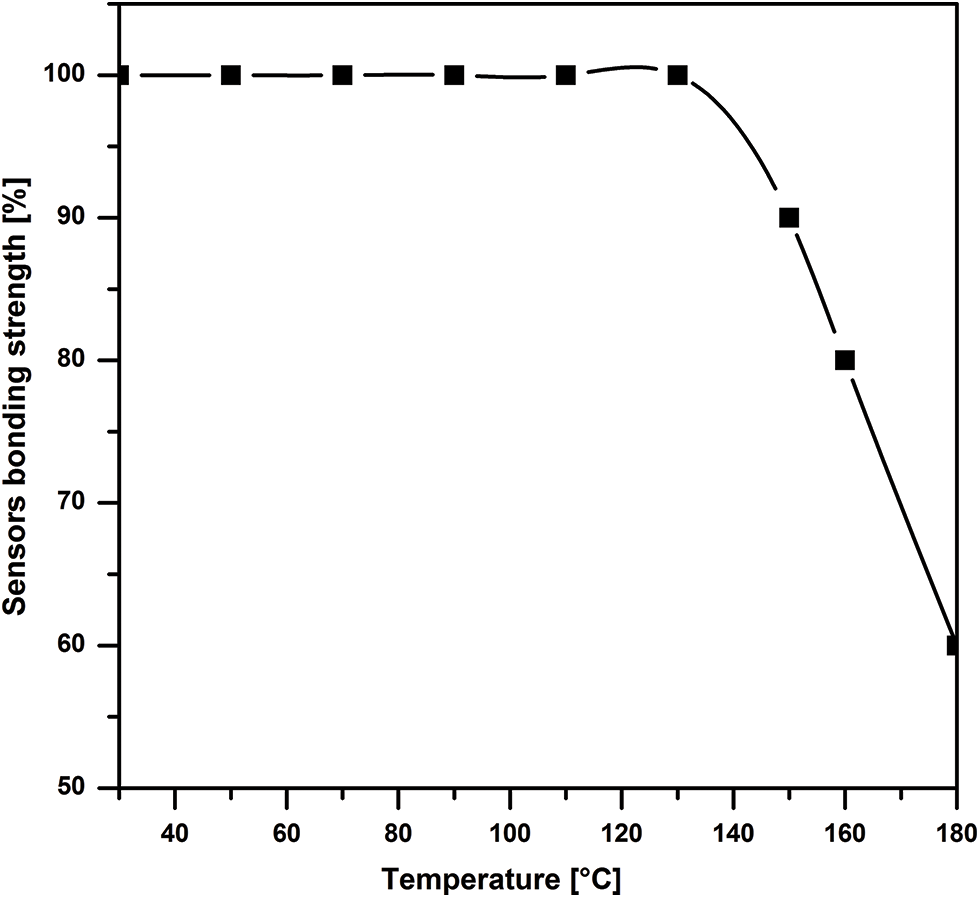
Figure 15: Percentage of sensor’s bonding strength with temperature
It is pretty clear from Fig. 15 that the sensor’s bonding strength is impacted after 130°C and turns out to be practically 60% at 180°C. Therefore, the execution of an appropriate temperature recompense procedure is essential to control the impedance signature of PZT sensors. Moreover, the effect of damping is not considered in current research because the ultrasonic guided wave has a low attenuation rate towards the damping phenomenon. The author has only analyzed the guided wave signals with tens of microseconds which have not occurred to attenuation because of damping under the operating conditions.
In the proposed research, thermal and mechanical analysis is performed for the piezoelectric energy harvester (PZT-5A) to examine its performance characteristics. The conclusions are as follows:
1. Microscopic analysis of piezoelectric energy harvester has indicated the heterogonous distribution of grains all over the substrate and the occurrence of certain agglomeration. Energy-dispersive X-ray (EDX) results have revealed that there are no impurities in the piezoelectric energy harvester.
2. In view of experimental results, piezoelectric materials exhibit maximum performance when subjected to low frequency and peak vibrating load conditions. Hence, these materials are highly recommended for low frequency and maximum vibrating load applications.
3. Also, it has been investigated that the temperature and external resistance has a negative impact on the output voltage of piezoelectric energy harvesters.
4. The experiment outcomes have revealed that the dielectric constant
5. Hence, the current research has not only evaluated the performance characteristics of PZT-5A but also indicated its effectiveness in practical applications such as EMI-based SHM under varying environmental and operating conditions (EOCs). The proposed research recommends developing an optimized temperature compensation approach to omit the basic reasons for false fault diagnosis in EMI-based structural health monitoring.
The proposed research results can be implemented to different material components in complex configurations such as cylindrically shaped Aluminum material parts with alternative material properties and the multiple numbers of modes. The piezoelectric transducer’s configuration adopted in the current study can be further improved in terms of specific angles or degrees between the inspected specimens and applied loading conditions. The measurement system can be upgraded to further enhance the practicality of the temperature compensation approach. There is still a need for its verification in real-time industries such as transportation, power plants and architectural applications.
Funding Statement: The authors offer their best gratitude to Shanghai Jiao Tong University, China; University of Engineering and Technology Lahore, Pakistan; and NFC IET Multan, Pakistan for financial and technical support to complete the current research work.
Conflicts of Interest: The authors declare that they have no conflicts of interest to report regarding the present study.
References
1. Covaci, C., Gontean, A. (2020). Piezoelectric energy harvesting solutions: A review. Sensors, 20, 3512. DOI 10.3390/s20123512. [Google Scholar] [CrossRef]
2. Morrisey, T. G., Mitchell, S. K., Jaros, A. T., Ambos, E., Keplinger, C. (2019). Mechanical-to-electrical energy conversion with variable electric double layers. Energy Technology, 7, 1801007. DOI 10.1002/ente.201801007. [Google Scholar] [CrossRef]
3. Roundy, S., Wright, P. K., Rabaey, J. (2004). Energy scavenging for wireless sensor networks with special focus on vibrations. Boston, MA: Kluwer Academic Publishers. [Google Scholar]
4. Roundy, S., Wright, P. K., Rabaey, J. (2003). A study of low level vibrations as a power source for wireless sensor nodes. Computer Communications, 26, 1131–1144. DOI 10.1016/S0140-3664(02)00248-7. [Google Scholar] [CrossRef]
5. Roundy, S. (2003). Energy scavenging for wireless sensor nodes with a focus on vibration to electricity conversion in mechanical engineering. Berkley: University of California Berkley. [Google Scholar]
6. Vijatović, M., Bobić, J., Stojanović, B. D. (2008). History and challenges of barium titanate: Part II. Science of Sintering, 40(3), 235–244. DOI 10.2298/SOS0803235V. [Google Scholar] [CrossRef]
7. Zhao, X., Yang, T. Q., Dong, Y., Wang, X. (2014). Energy harvester array using piezoelectric diaphragm for broad band vibration. Applied Physics Letters, 104, 22–39. [Google Scholar]
8. Chen, X. R., Yang, T. Q., Wang, W., Yao, X. (2012). Vibration energy harvesting with clamped piezoelectric circular diaphragm. Ceramics International, 38, S271–S274. [Google Scholar]
9. Shen, D., Choe, S. Y., Kim, D. J. (2007). Analysis of piezoelectric materials for energy harvesting devices under high-g vibration. Japanese Journal of Applied Physics, 46, 6755–6760. DOI 10.1143/JJAP.46.6755. [Google Scholar] [CrossRef]
10. VO, T. T., Nguyen, T. T., Nguyen, H. Y., Dang, A. T. (2013). Evolution of electro mechanical coupling factor for piezoelectric materials using finite element modeling. Journal of Material and Chemistry, 3(3), 59–63. [Google Scholar]
11. Boyle, G. (1996). Renewable energy: Power for a sustainable future. USA: Oxford University Press. [Google Scholar]
12. Paliwal, N., Mukhija, N., Bhatia, D. (2015). Design and optimization of high quality factor MEMS piezoelectric resonator with pseudo electrodes. 2015 4th International Conference on Reliability, Infocom Technologies and Optimization (ICRITO) (Trends and Future Directions), pp. 1–5. IEEE. [Google Scholar]
13. Erturk, A., Vieira, W. G. R., Marqui Jr, C. D., Inman, D. J. (2010). On the energy harvesting potential of piezoaeroelastic systems. Applied Physics Letters, 96(18),184103. DOI 10.1063/1.3427405. [Google Scholar] [CrossRef]
14. Liu, G., Zhang, S., Jiang, W., Cao, W. (2015). Losses in ferroelectric materials. Materials Science and Engineering, 89, 1–48. DOI 10.1016/j.mser.2015.01.002. [Google Scholar] [CrossRef]
15. Butt, Z., Shafiq, A., Pasha, R. A., Elahi, H., Mehmood, S. et al. (2017). Characterizing barium titanate piezoelectric material using the finite element method. Transactions on Electrical and Electronic Materials, 18(3),163–168. [Google Scholar]
16. Wu, X., Pan, X., Stubbins, J. F. (2007). Analysis of notch strengthening of 316l stainless steel with and without irradiation-induced hardening using EBSD and FEM. Journal of Nuclear Materials, 361, 228–238. DOI 10.1016/j.jnucmat.2006.12.033. [Google Scholar] [CrossRef]
17. Khalid, O., Butt, Z., Tanveer, W., Rao, H. I. (2017). Design and experimental analysis of counter-flow heat and mass exchanger incorporating (M-cycle) for evaporative cooling. Heat and Mass Transfer, 53(4), 1391–1403. DOI 10.1007/s00231-016-1914-2. [Google Scholar] [CrossRef]
18. Williams, D., Haddad, K. H., Jiffri, S., Yang, C. (2019). Active vibration control using piezoelectric actuators employing practical components. Journal of Vibration and Control, 25(21–22), 2784–2798. DOI 10.1177/1077546319870933. [Google Scholar] [CrossRef]
19. Zuo, C., Feng, X., Zhang, Y., Lu, L., Zhou, J. (2017). Crack detection in pipelines using multiple electromechanical impedance sensors. Smart Materials and Structures, 26(10), 104004. DOI 10.1088/1361-665X/aa7ef3. [Google Scholar] [CrossRef]
20. Zhu, J., Wang, Y., Qing, X. (2019). A real-time electromechanical impedance-based active monitoring for composite patch bonded repair structure. Composite Structures, 212, 513–523. DOI 10.1016/j.compstruct.2019.01.035. [Google Scholar] [CrossRef]
21. Park, G., Sohn, H., Farrar, C., Inman, D. (2003). Overview of piezoelectric impedance-based health monitoring and path forward. Shock and Vibration, 35(6), 451–463. DOI 10.1177/05831024030356001. [Google Scholar] [CrossRef]
22. Zhao, X., Gao, H., Zhang, G., Ayhan, B., Yan, F. et al. (2007). Active health monitoring of an aircraft wing with embedded piezoelectric sensor/actuator network: I. Defect detection, localization and growth monitoring. Smart Material and Structure, 16(4), 1208–1217. [Google Scholar]
23. Abbas, S., Li, F., Abbas, Z., Ur, T., Tu, X. et al. (2021). Experimental study of effect of temperature variations on the impedance signature of PZT sensors for fatigue crack detection. Sound & Vibration, 55(1), 1–18. DOI 10.32604/sv.2021.013754. [Google Scholar] [CrossRef]
24. Butt, Z., Pasha, R. A., Qayyum, F., Anjum, Z., Ahmad, N. et al. (2016). Generation of electrical energy using lead zirconate titanite (PZT-5A) piezoelectric material: Analytical, numerical and experimental verifications. Journal of Mechanical Science and Technology, 30, 3553–3558. DOI 10.1007/s12206-016-0715-3. [Google Scholar] [CrossRef]
25. Elahi, H., Munir, K., Eugeni, M., Atek, S., Gaudenzi, P. (2020). Energy harvesting towards self-powered IoT devices. Energies, 13(21), 5528. DOI 10.3390/en13215528. [Google Scholar] [CrossRef]
26. Baptista, F. G., Vieira, F. J. (2010). Transducer loading effect on the performance of PZT-based SHM systems. IEEE Transactions on Ultrasonics, Ferroelectrics and Frequency Control, 57, 933–941. DOI 10.1109/TUFFC.2010.1497. [Google Scholar] [CrossRef]
27. Sattar, M. E., Mehdi, S., Aazam, G. (2017). Effect of the multiple damages and temperature changes on the naturalfrequency. Journal of Theoretical and Applied Mechanics, 55(3), 813–822. [Google Scholar]
28. Abbas, S., Li, F., Zhu, Y., Tu, X. (2019). Experimental investigation of the impact of environmental temperature and optimal baseline for thermal attenuation in structural health monitoring based on ultrasonic guided waves. Wave Motion, 93, 102474. DOI 10.1016/j.wavemoti.2019.102474. [Google Scholar] [CrossRef]
Cite This Article
 Copyright © 2022 The Author(s). Published by Tech Science Press.
This work is licensed under a Creative Commons Attribution 4.0 International License , which permits unrestricted use, distribution, and reproduction in any medium, provided the original work is properly cited.
 Downloads
 Citation Tools