| Structural Durability & Health Monitoring |
DOI: 10.32604/sdhm.2022.0271
ARTICLE
Single Point Cutting Tool Fault Diagnosis in Turning Operation Using Reduced Error Pruning Tree Classifier
1School of Mechanical Engineering (SMEC), VIT University, Chennai, 600127, India
2Department of Mechanical Engineering, SNS College of Technology, Coimbatore, 641035, India
*Corresponding Author: V. Sugumaran. Email: v_sugu@yahoo.com
Received: 23 February 2018; Accepted: 02 August 2018
Abstract: Tool wear is inevitable in daily machining process since metal cutting process involves the chip rubbing the tool surface after it has been cut by the tool edge. Tool wear dominantly influences the deterioration of surface finish, geometric and dimensional tolerances of the workpiece. Moreover, for complete utilization of cutting tools and reduction of machine downtime during the machining process, it becomes necessary to understand the development of tool wear and predict its status before happening. In this study, tool condition monitoring system was used to monitor the behavior of a single point cutting tool to predict flank wear. A uniaxial accelerometer was attached to a single point cutting tool under study. The accelerometer acquires vibrational signals during turning operation on a lathe machine. The acquired signals were then used to extract statistical features such as standard error, variance, skewness, etc. The substantial features were recognized to reduce the utilization of computing resources. They were used to classify the signals as good and three different measures of flank wear by a decision tree algorithm. Frequency domain features were also extracted and shown to be less effective in classification in comparison to statistical features. REPTree (Reduced Error Pruning Tree) algorithm was used in this study. REPTree decision tree algorithm achieved a maximum classification accuracy of 72.77% for all signals combined. When spindle speed and feed rate are considered as the variables the accuracy is about 86.25%. When spindle speed is the only variable parameter the accuracy is about 82.71%. When depth of cut, feed rate and speed of the spindle are considered as variable parameters, the accuracy of the decision tree is around 93.51%. This study demonstrates the performance of REPTree classifier in tool condition monitoring. It can be utilized for tool wear identification and thus improve surface finish, dimensional accuracy of the work piece and reduce machine downtime. Any additional research on the work may involve analysis of different classifier algorithms which could potentially predict tool wear with greater accuracy.
Keywords: Fault diagnosis; tool condition monitoring; REPTree; decision tree; statistical feature extraction
Nomenclature
| REPTree | Reduced Error Pruning Tree |
| FFT | Fast Fourier Transform |
| TP | True Positive |
| FP | False Positive |
| TPR | True Positive Rate |
| FPR | False Positive Rate |
Manufacturing industries are constantly looking for ways that can boost their production without affecting any output factors negatively. This can prove fruitful for the economy of a developing nation. Conventional metal cutting and machining processes are a vital part in production systems [1]. In mass production, the machine tool tends to shear or wear off due to abrasion and fatigue under long machining periods inevitably. Nearly 79.6% of machine downtime is instigated because of such tool failures [2]. Researchers have suggested employing tool condition monitoring systems which can detect cutting tool wear prior any damage to the work piece. It would decrease machine downtime, reduce the chance for dimensional errors, improve tolerance and surface finish and also improve productivity. This can also achieve manufacturing automation. Flank wear is a common kind of tool wear seen in turning operations and leads to several disadvantages like loss of dimensional accuracy and surface finish. Tool condition monitoring can be used to identify and predict such failure and hence prevent the hindrances it would post [3].
Many scientists, engineers and analysts have attempted to design a condition monitoring system with high accuracy. Past research on tool condition monitoring for milling operation was reported by Zhou et al. [4]. Hocheng et al. [5] found the correlation between the scattering intensity of light when laser is incident on the workpiece and the nose radius of a single point cutting tool. Bhuiyan et al. [6] inferred that acoustic and vibration signals can effectively change with respect to tool wear in turning operation. Flank wear was predicted in a single point cutting tool using acoustic emissions by Sundaram et al. [7]. The condition monitoring of tool by examining surface roughness, vibration and material removed from the specimen was presented in [8]. Measuring the vibration of a process is one of the most valuable in tool condition monitoring. Krishnakumar et al. [9] has used vibration signals from the high-speed machining of titanium alloy to predict the tool wear condition. They have used J48 decision tree classifier and artificial neural network algorithm to diagnose the tool wear. Teli et al. [10] surveyed several decision tree based approaches in data mining. A different study inferred that acoustical data is useful for sub-surface irregularities and tool tip breakages while vibration signals is a better choice for tool wear studies [11]. The estimation of remaining healthy tool life using support vector regression is presented in a paper [12]. Wang et al. [13] found that the use of SVM can make the training faster without losing the classification accuracy. The prediction of sharp or worn tool by utilization of wavelet packet decomposition feature extraction technique on the vibration and sound signals of machining process was presented in another paper [14].
The use of statistical features like mean, median, mode, variance, etc. extracted from the vibration signal of turning operation and K-star classification algorithm was found to be helpful in predicting the blunt tool [15]. Gangadhar et al. [16] studied the vibration signal in a turning operation by using Decision Tree Algorithm for feature reduction as well as classification. In another study, Gangadhar et al. [17] investigated vibration signals by obtaining descriptive statistical features for classification purpose. Gierlak et al. [18] devised a method for the processing and analyzing of signals during diagnosing the state of a manipulator’s tool of a robot. The usage of REPTree proves to be best among the many other popular classifiers for the detection of a user in a social network system [19]. Here accelerometer was used to acquire the cutting tool vibration during the machining in lathe machine. The statistical features are extracted from the acquired vibration signal and unwanted features are removed from the dataset. Then the dataset is classified with REPTree algorithm to evaluate the performance of the classifier on the prediction of the tool wear level. REPTree stands for Reduced Error Pruning Tree. It belongs to one of the two standard classes of pruning methods, specifically backward or post pruning. Post-pruning initially over-fits the data followed by pruning of the tree [20]. Reduced Error Pruning is a post-pruning method decision tree [21].
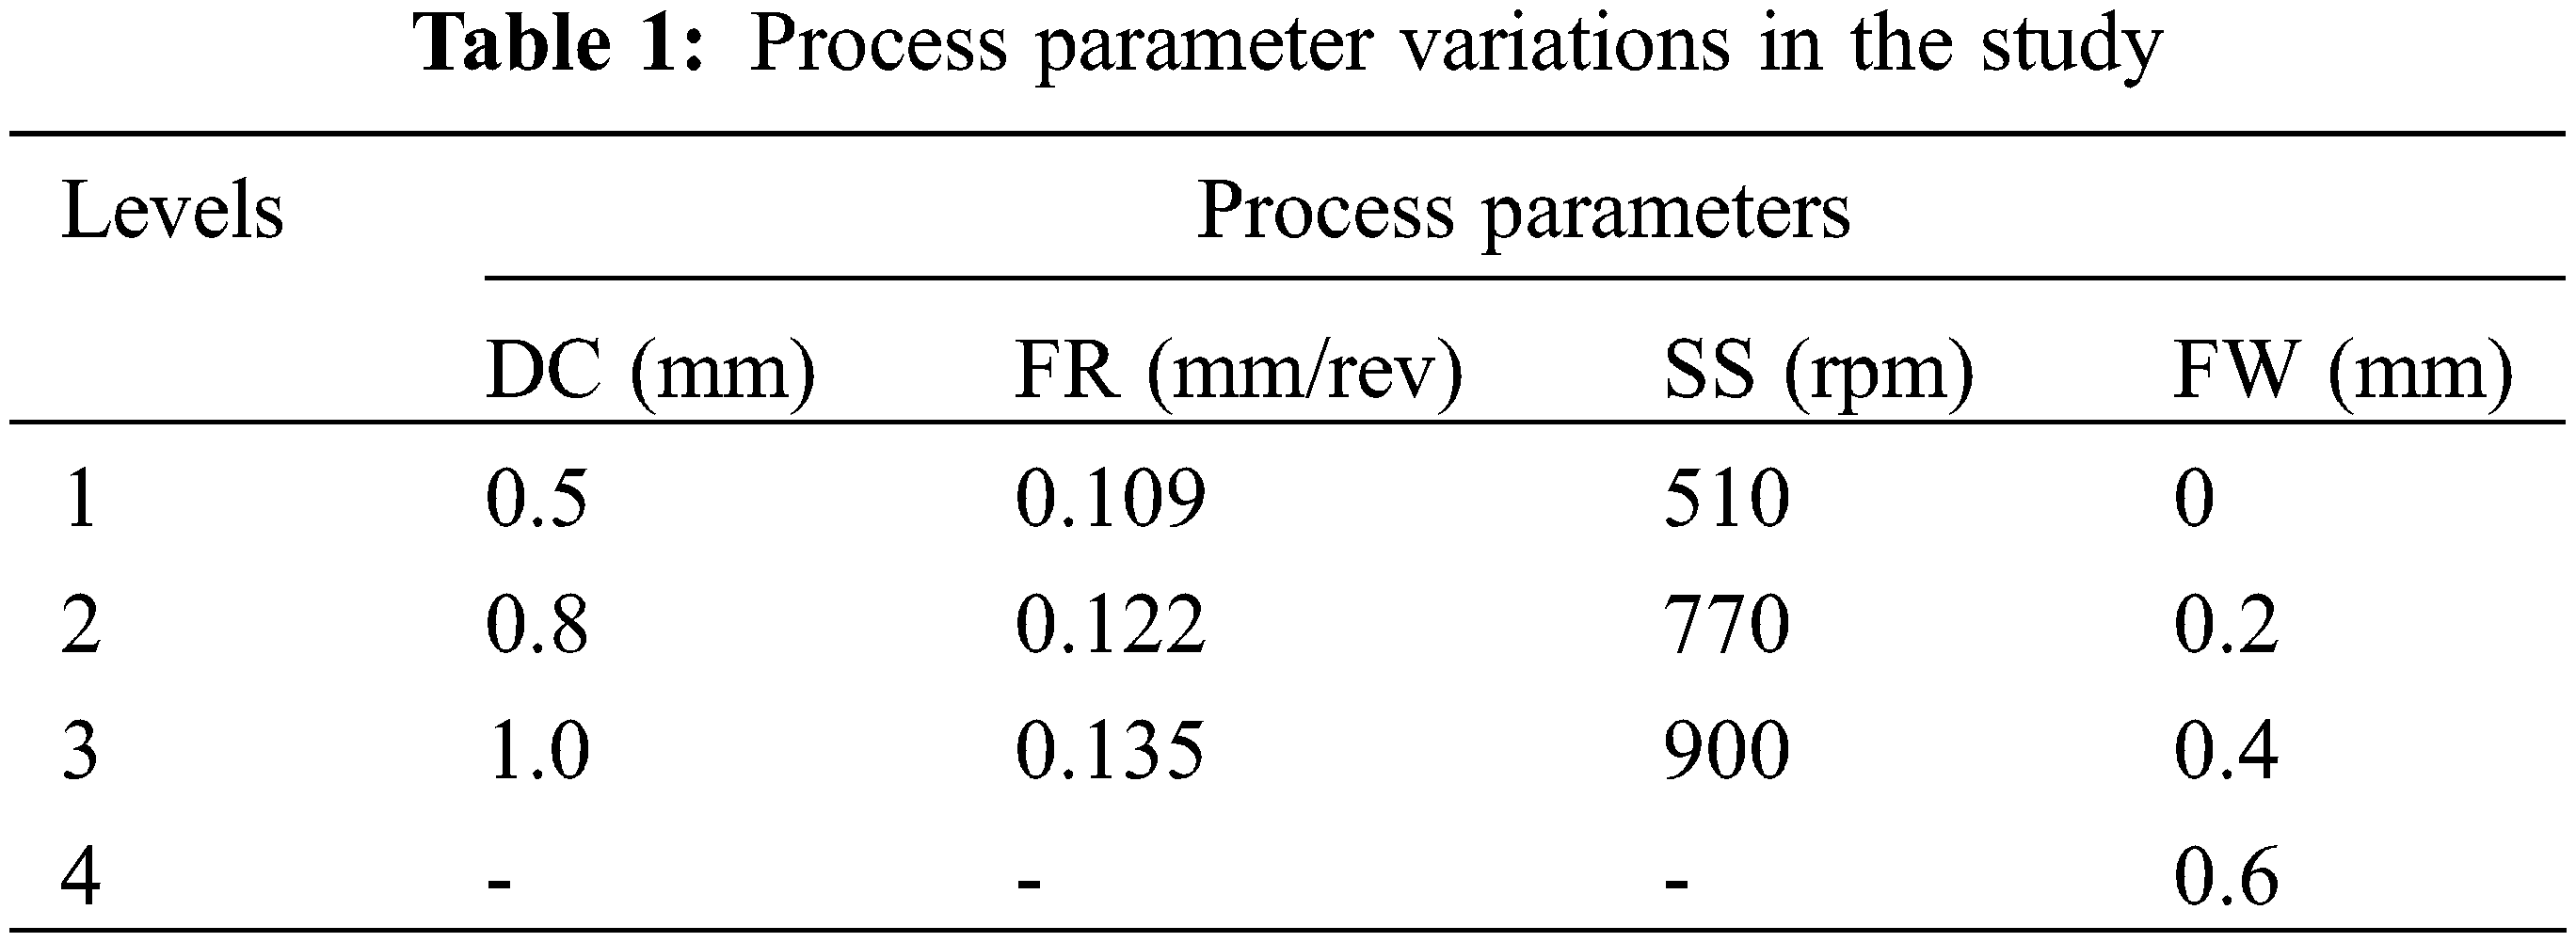
A lathe machine performing a turning operation was used to conduct the experimental study. The workpiece used was a steel bar of diameter 25 mm and a brazed carbide tip cutting tool was used as cutting tool. A Dytran Uniaxial accelerometer was mounted on a single point cutting tool using adhesive mounting. A data acquisition device manufactured by National Instruments (USB type) NIVIB 4432, was connected to the accelerometer in which the analog signal was converted into digital signal. LABVIEW software was used to obtain the signals. The experimental setup comprising of the cutting tool, accelerometer and work piece is presented in Figs. 1 and 2 depicts the data acquisition device and computer. Table 1 describes the machining parameters taken into consideration for this experimental study. Vibration signals corresponding to all combinations of feed rate (FR), speed of the spindle (SS), flank wear (FW) and depth of cut (DC) are acquired.
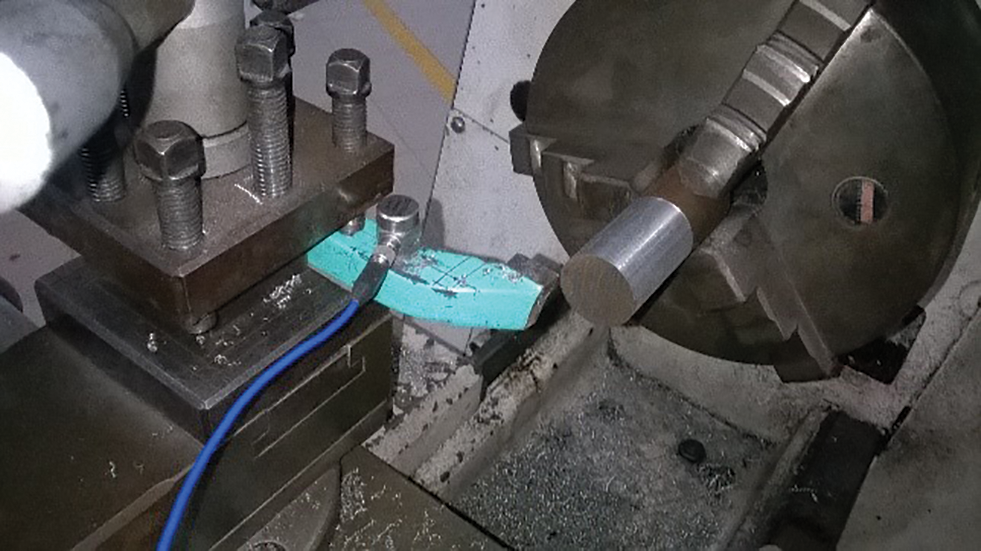
Figure 1: Adopted experimental setup comprising of work piece, cutting tool and accelerometer
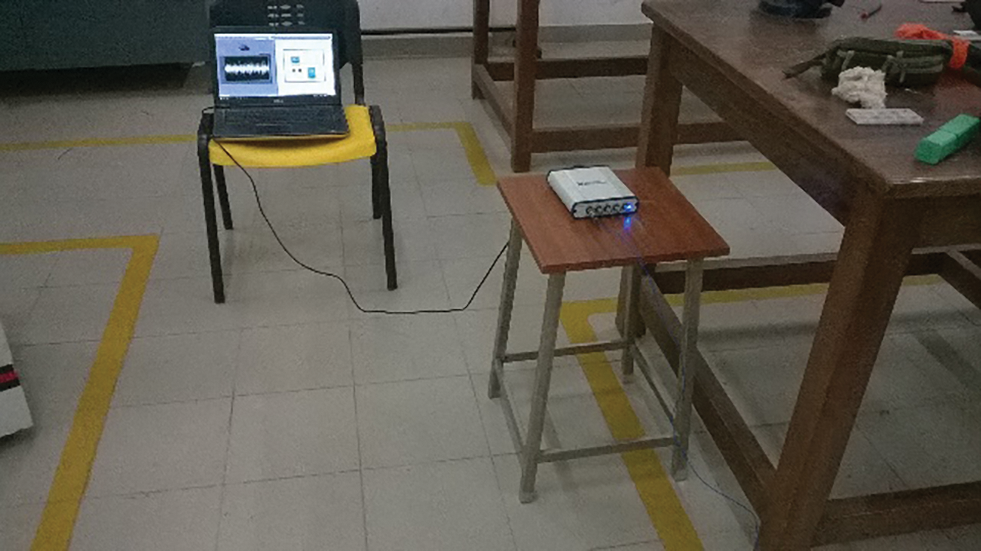
Figure 2: Overall setup for experimentation
2.1.1 Baseline Signal Acquisition
Vibrational signals are acquired from the single point cutting tool through the accelerometer attached over the tool. The maximum frequency that was obtained was 6 kHz. Based on Nyquist sampling theorem, the frequency during sampling must be twice or thrice the observed maximum frequency of the system. Agreeing to this theorem, the sampling signal was taken as 20 kHz. The specimen was securely affixed to the chuck of the lathe. To remove any irregularities on the surface of the work specimen, a rough turning operation was done. After this, a uniform turning was done to record the signal but the first few seconds are dropped to eliminate randomness in the vibration signals. When the turning operation was stable, the vibration signals were collected.
Flank wear fault was induced manually on the single point cutting tool with the aid of cutter grinding machine and tool. Before inducing the flank wear, line for reference was marked tangential to the cutting tool nose radius and the intermediate distance from the line and the foremost tip of the nose radius was recorded. The same procedure was repeated after fault simulation and the difference between the two lengths gives the actual wear of the cutting tool.
2.1.3 Acceleration Signal Acquisition
The accelerometer acquires the vibration signals from the lathe during the machining operation after stabilization. The signal acquisition parameters were fixed at 2000 sample length and 20 kHz sampling frequency for all machining conditions. Figs. 3–6 represent plots of time domain corresponding to different tool wear condition.
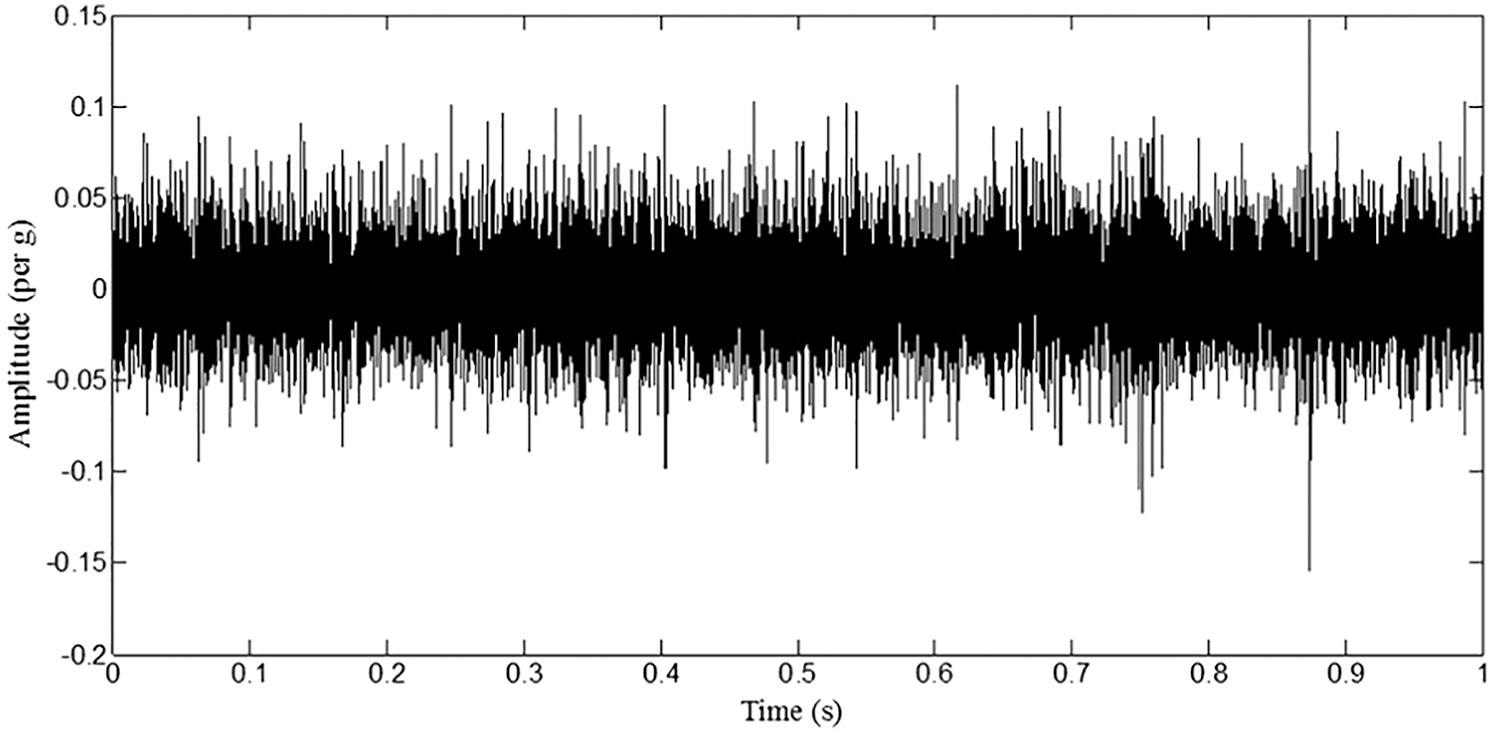
Figure 3: Plot representing 0.2 mm tool wear
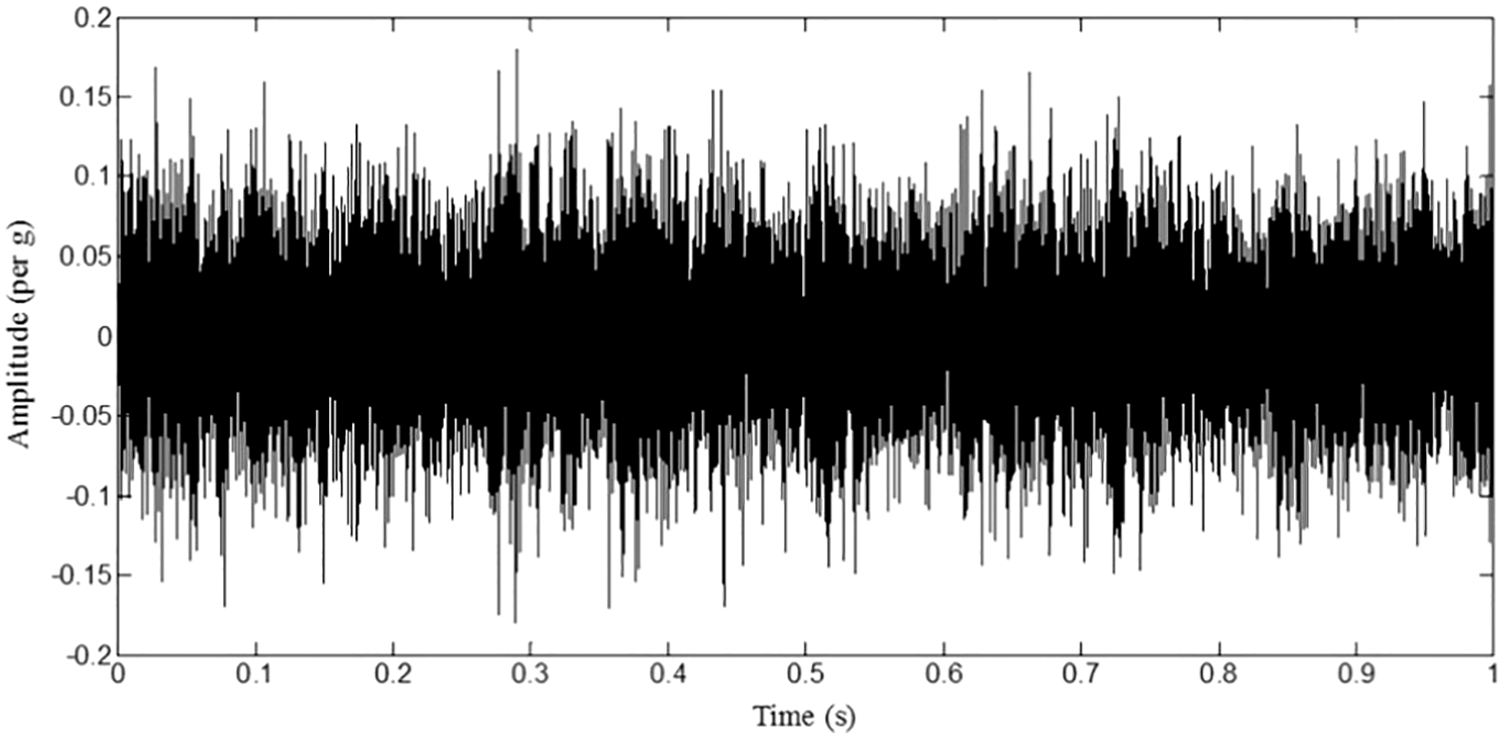
Figure 4: Plot representing 0.4 mm tool wear
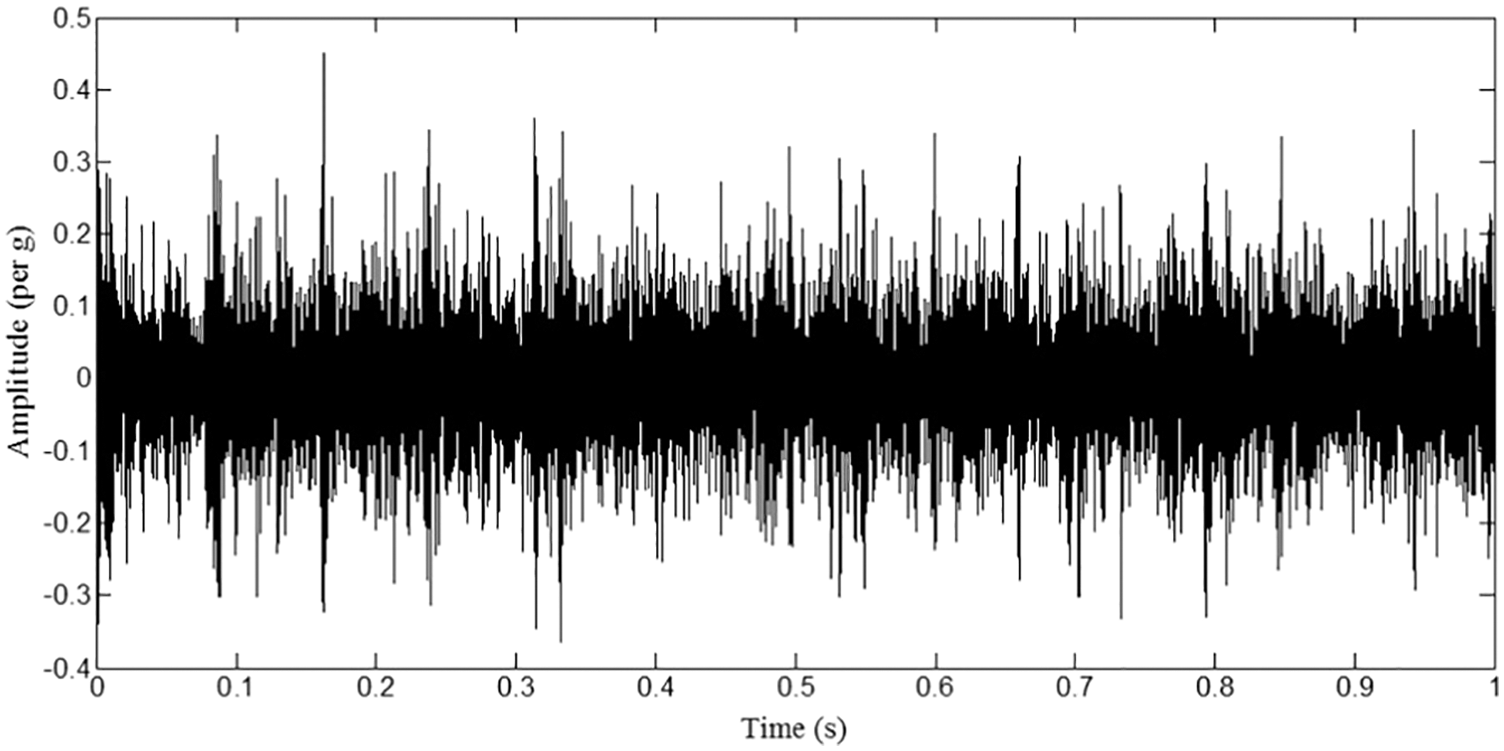
Figure 5: Plot representing 0.6 mm tool wear
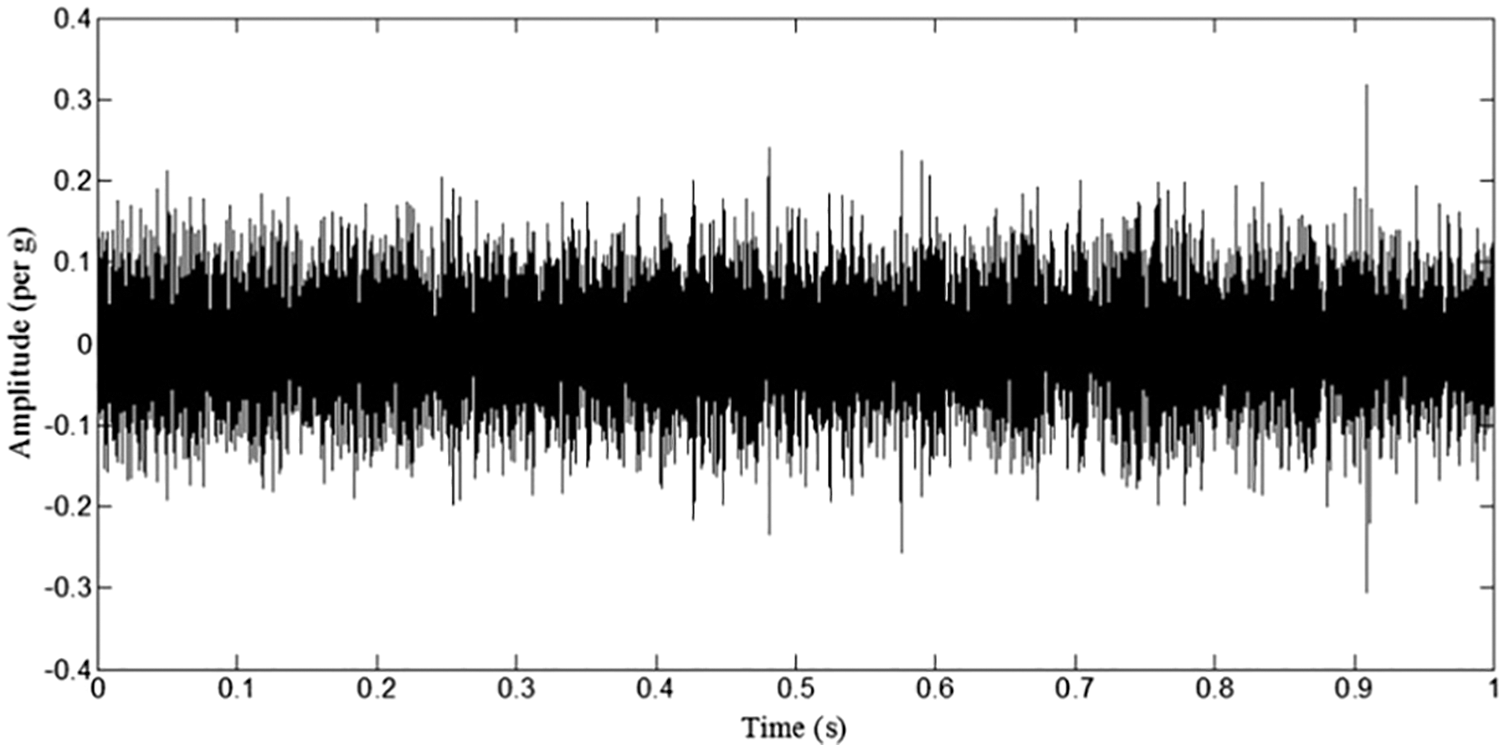
Figure 6: Plot representing healthy tool
Feature extraction was implemented to extract features that has some significance and is useful for classification from the measured data. These features include important information which can be used to reduce the initial set of data and classification can be done on this reduced data. Here, data corresponds to the acceleration signals obtained using the data acquisition device. Statistical features such as mean, median, mode, maximum, minimum, range, sum, standard error, standard deviation, kurtosis and skewness were taken into consideration for this experiment. Statistical features allow us to compute a huge range of phenomena or attributes, allowing the study of fault diagnosis from an objective perspective. Statistical methods possess the ability to predict deviations in a particular problem as they are classified with different constraints. Features that possessed no or irrelevant information for the classification were discarded. A decision tree classifier was used to reduce the data and REPTree classifier was used for classification of the same. Frequency domain features were also extracted and used for classification to compare and validate the choice of statistical features for the particular problem. The Fast Fourier Transform (FFT) of a signal is visualized in Fig. 7. Imaginary parts of the transform are neglected. The absolute value of the transform is shown in Fig. 8, where four peaks of frequency is observed. The value of each of the peak is taken as a distinct frequency domain feature. These features were used to classify tool wear using REPTree and their corresponding classification accuracy is discussed in a following section.
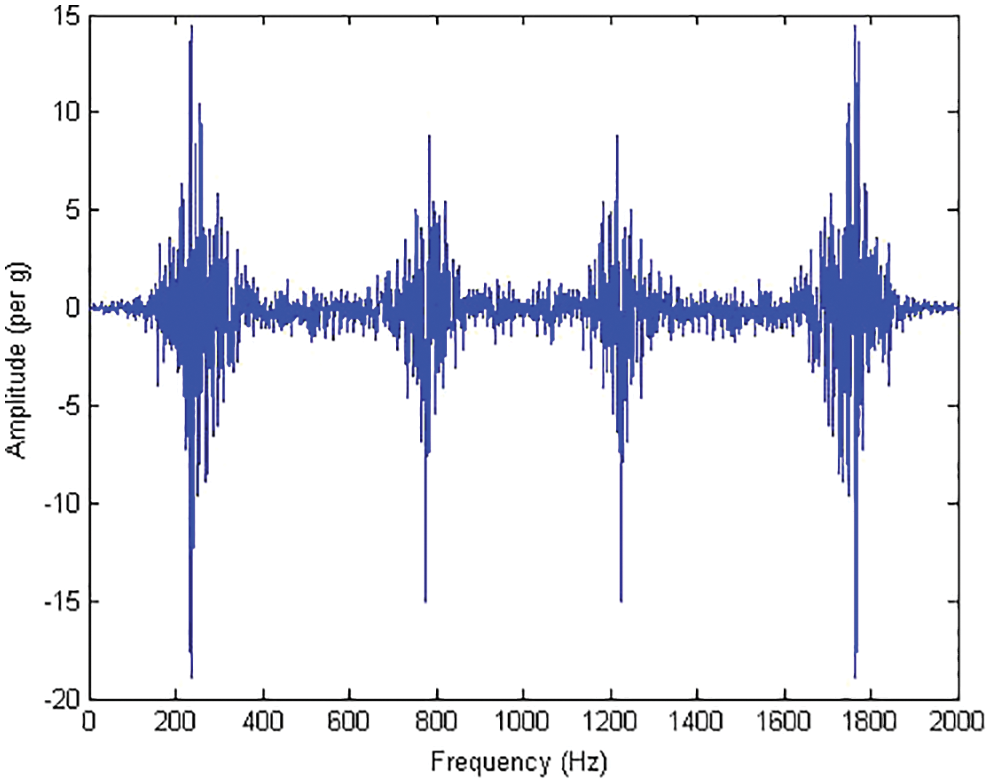
Figure 7: Fast fourier transform plot of good tool signal
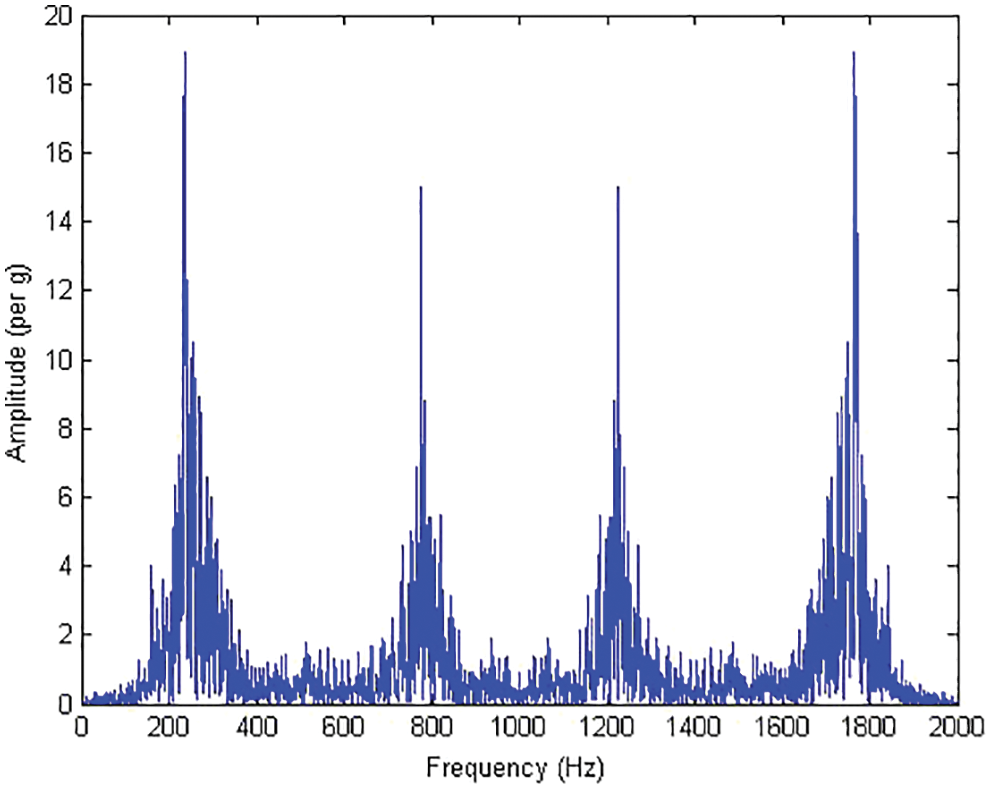
Figure 8: Absolute fast fourier transform plot of good tool signal
3.1 Decision Tree Based Feature Reduction
The extracted features (statistical) were arranged in order of their significance by the decision tree classifier. The features present at the topmost position carries vital information whilst the feature in the lower portion offers relatively less amount of relevant information. The features at the lowest position in the tree can be neglected to increase accuracy during classification.
4 Brief Description of Machine Learning Classifiers
A decision tree is a common tool used for data mining. It creates a tree structure based on classification factors or regression models. This tree comprises of several nodes, leaves and a single root linked together through branches. The structure of the tree decomposes the dataset into smaller subsets and develops an association decision tree. It can handle both numerical and categorical data. The resulting tree structure comprises of decision nodes and leaf nodes. A decision node can divide into two or more branches while a leaf node represents a decision. A relevant estimation criterion forms the basis for classification at each node. Processes like information gain and entropy reduction is the main principle behind selecting the most significant feature for classification. The decision tree flow descends from the most significant to the least significant feature initiating from the root node. The root node handles the division of data into homogeneous subsets. Homogeneity of the data set can be calculated from entropy. Zero entropy denotes a completely homogenous and entropy value of one denotes a uniformly and equally divided set.
where pi is the division of s belonging to class i and n is the number of classes.
The division of the data set based on a feature or attribute decreases the entropy and becomes a ground for information gain. Information gain calculates the difference of entropy before and after the system acquires information. Information gain
where Value(x) corresponds to all attribute values x and feature x has a value of
REPTree or Reduced Error Pruning Tree is a fast decision tree learning algorithm. REPTree is a decision tree classifier that uses regression tree logic and concludes in a final predicted function value than a classification. A decision tree along with linear regression is called a regression tree. It gives piecewise relationship between dependent and independent variables [22]. REPTree creates multiple regression trees based on the given model in various iterations and then selects the best one out of the lot by utilizing entropy as a measure of impurity [23]. The selected tree is considered as the representative. The measure used is the mean square error on the predictions when pruning the tree. It performs reduced error pruning on a decision tree made based on information gain. It only sort values of numeric attributes once. C4.5’s method of fractional instances is used to work with missing values, that is by splitting the corresponding instances into pieces. The example of REP Tree algorithm is applied on UCI repository and the confusion matrix is generated [24].
The performance of REPTree classifier in classifying single point cutting tool wear level was done as follows:
• Reduction of the data obtained from the monitoring the machining operation by selecting relevant and significant statistical features
• Determination of classification accuracy using REPTree classifier for the acquired signals
• Classifier validation through thorough analysis of confusion matrices
Feature selection methods are used to decrease the dimensionality of the data by removing unnecessary and irrelevant attributes in the data set [25]. Reduction of initial data was carried out using J48. The statistical features with less or no contributing data were discarded and the rest were arranged in order of their significance. Initially, the decision tree returned a classification accuracy of 71.11% with 680 leaves. Post reducing the errors on the same, the classification accuracy increased to 72.86% with 186 leaves. Additionally, the classification accuracy reached 72.31% during adjustments made in the minimum number of objects corresponding to 34 leaves.
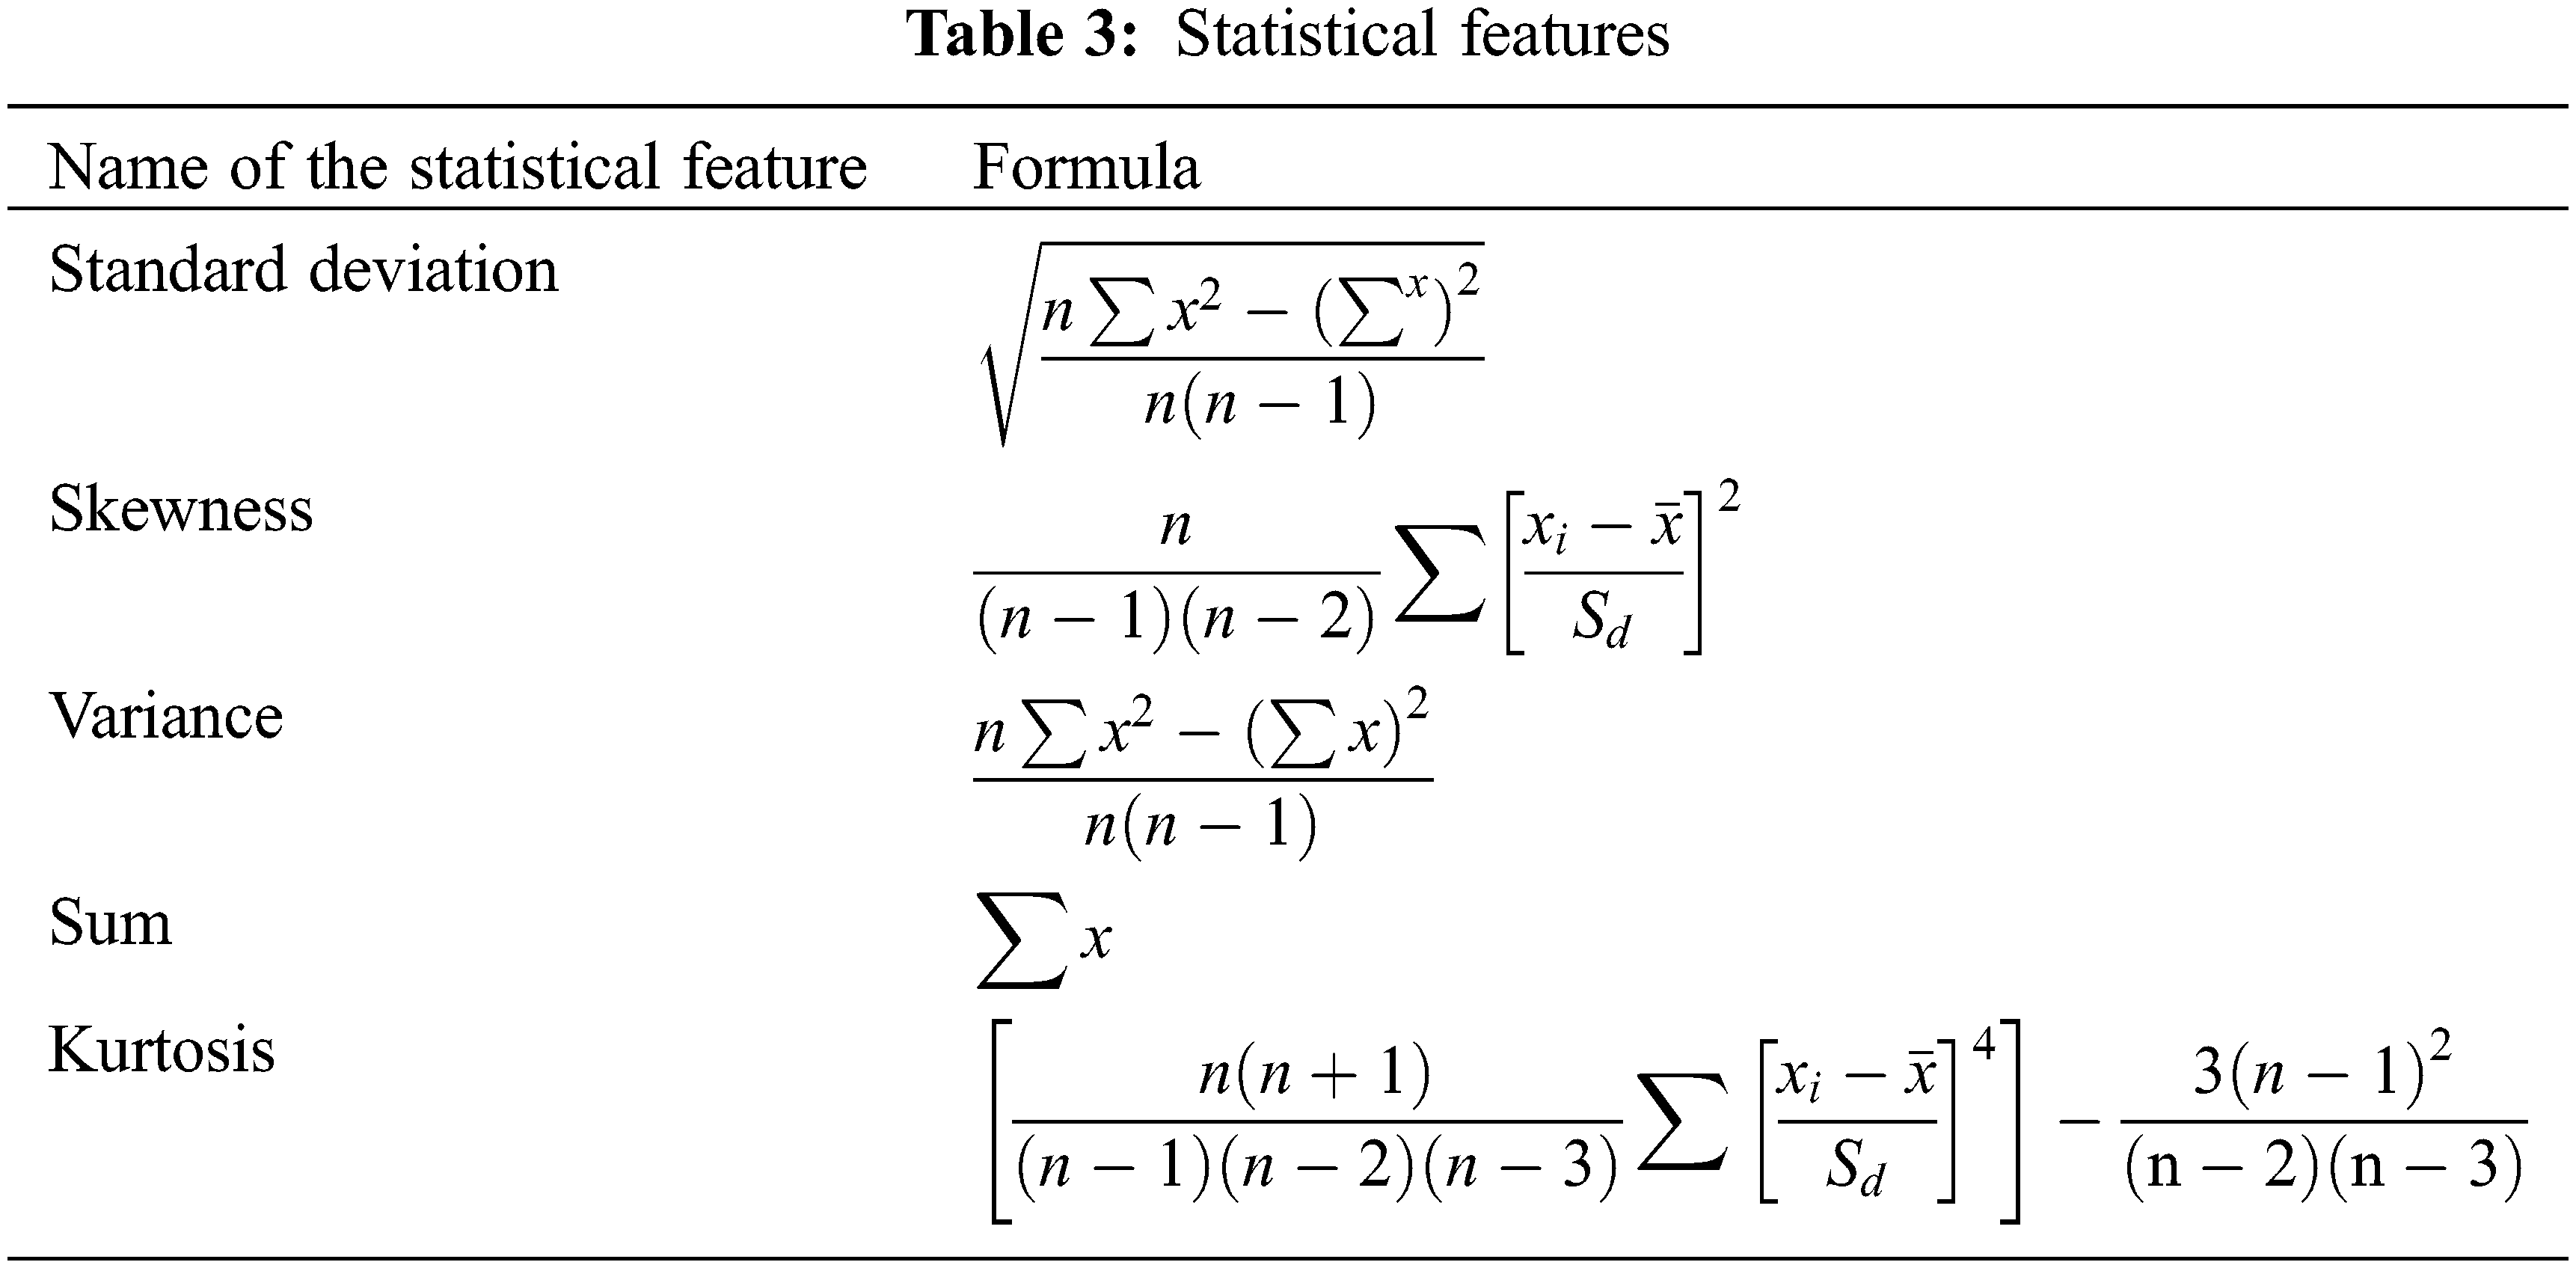
The effect of feature combination on the accuracy is displayed in Table 2. The features skewness, standard deviation, sum, range, variance, maximum and kurtosis were significant for the classification while other features were neglected in future calculations. This reduced the computational burden required for classifying the signals. From Fig. 9, one can observe the classification accuracy to be maximum for a combination with five features. This combination was chosen for further classification. Table 3 shows the formulae for extracting the features whose combination gave the best results.
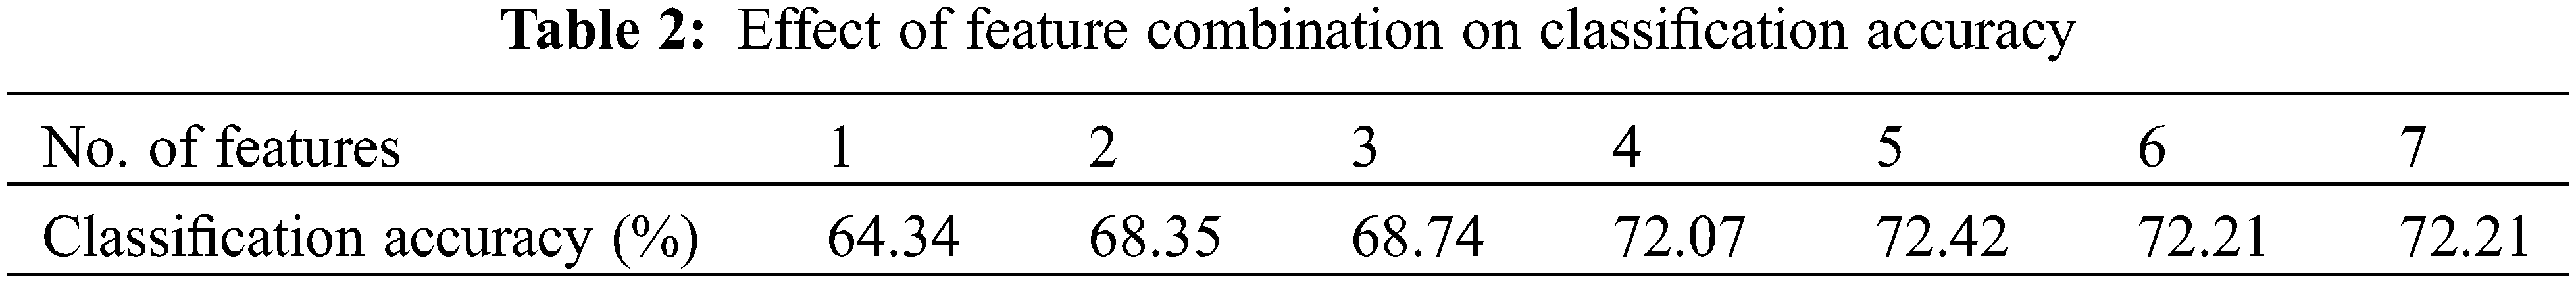
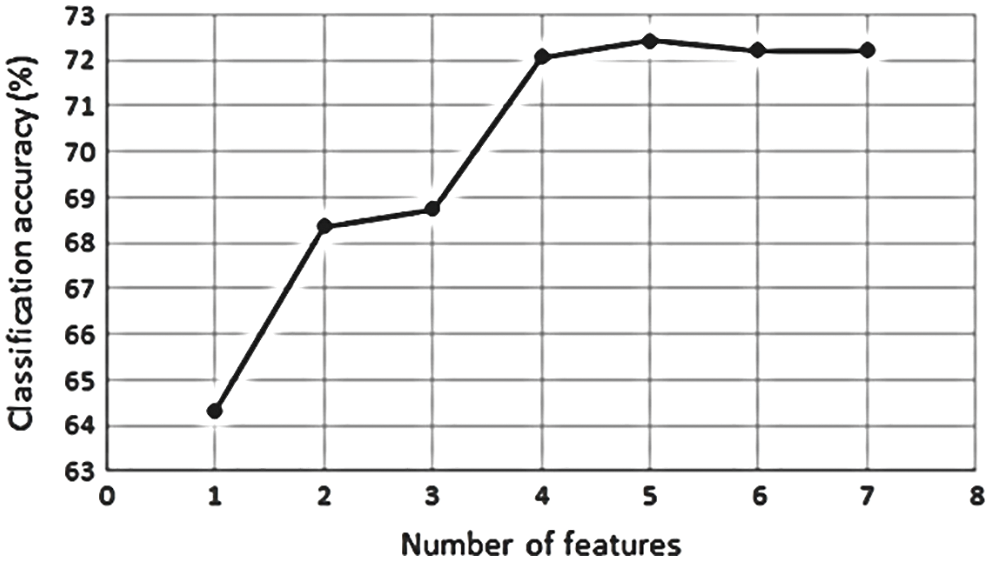
Figure 9: Effect of features on classification accuracy
5.2 Performance Evaluation of REPTree Classifier
The overall accuracy for classifying tool wear during turning operation using lathe for different combinations of spindle speed (SS), feed rate (FR) and depth of cut (DC) combined was found to be 72.77% using REPTree classifier. By reducing the complexity or fixing one or two of the variables, the classification accuracy can be improved. When spindle speed was fixed as a constant, the classification accuracy obtained was 8%–14% better than the combined accuracy of classification (all signals combined) as presented in Table 4. The same is graphically represented in Fig. 10.
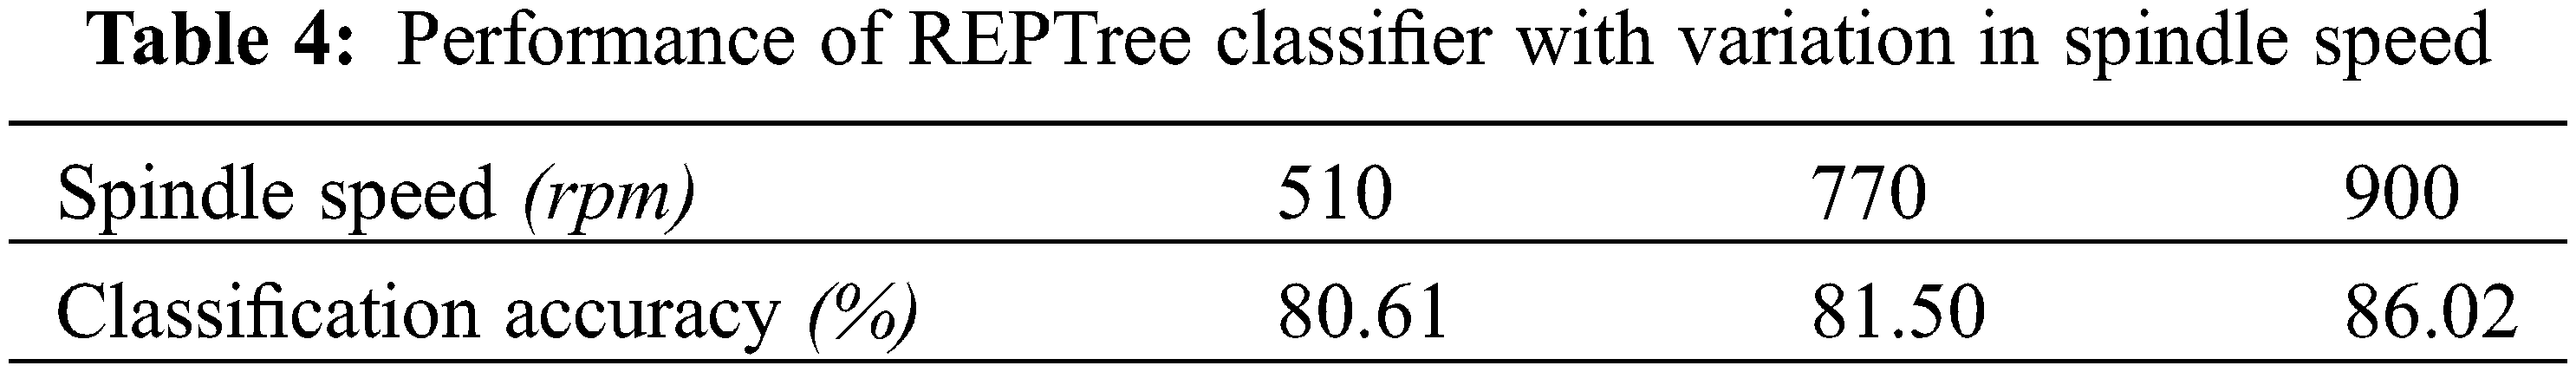
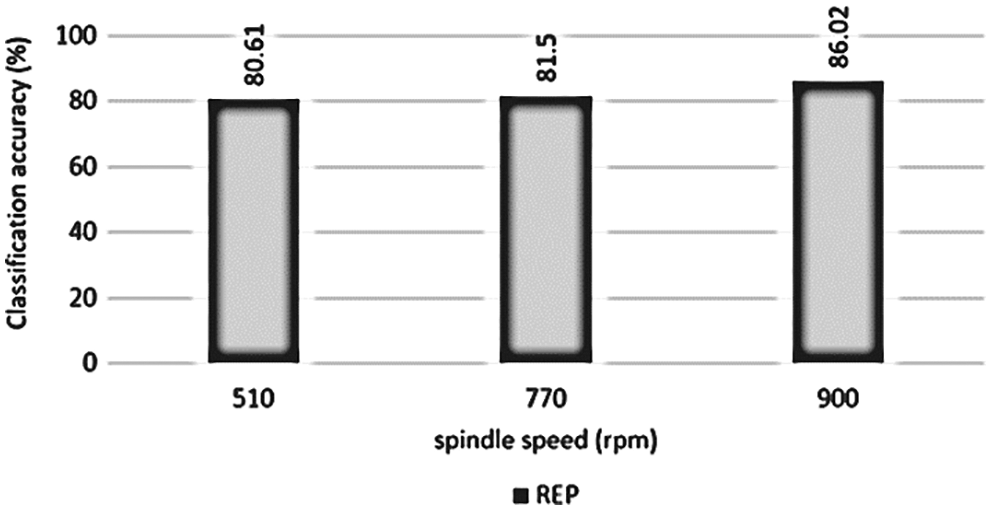
Figure 10: Performance of REPTree classifier with variation in spindle speed
We can achieve better classification accuracy if the complexity is reduced more by making feed rate and spindle speed as distinct factors. The accuracy for classifying tool wear thus obtained is given in Table 5 and a graphical comparison is given in Fig. 11.
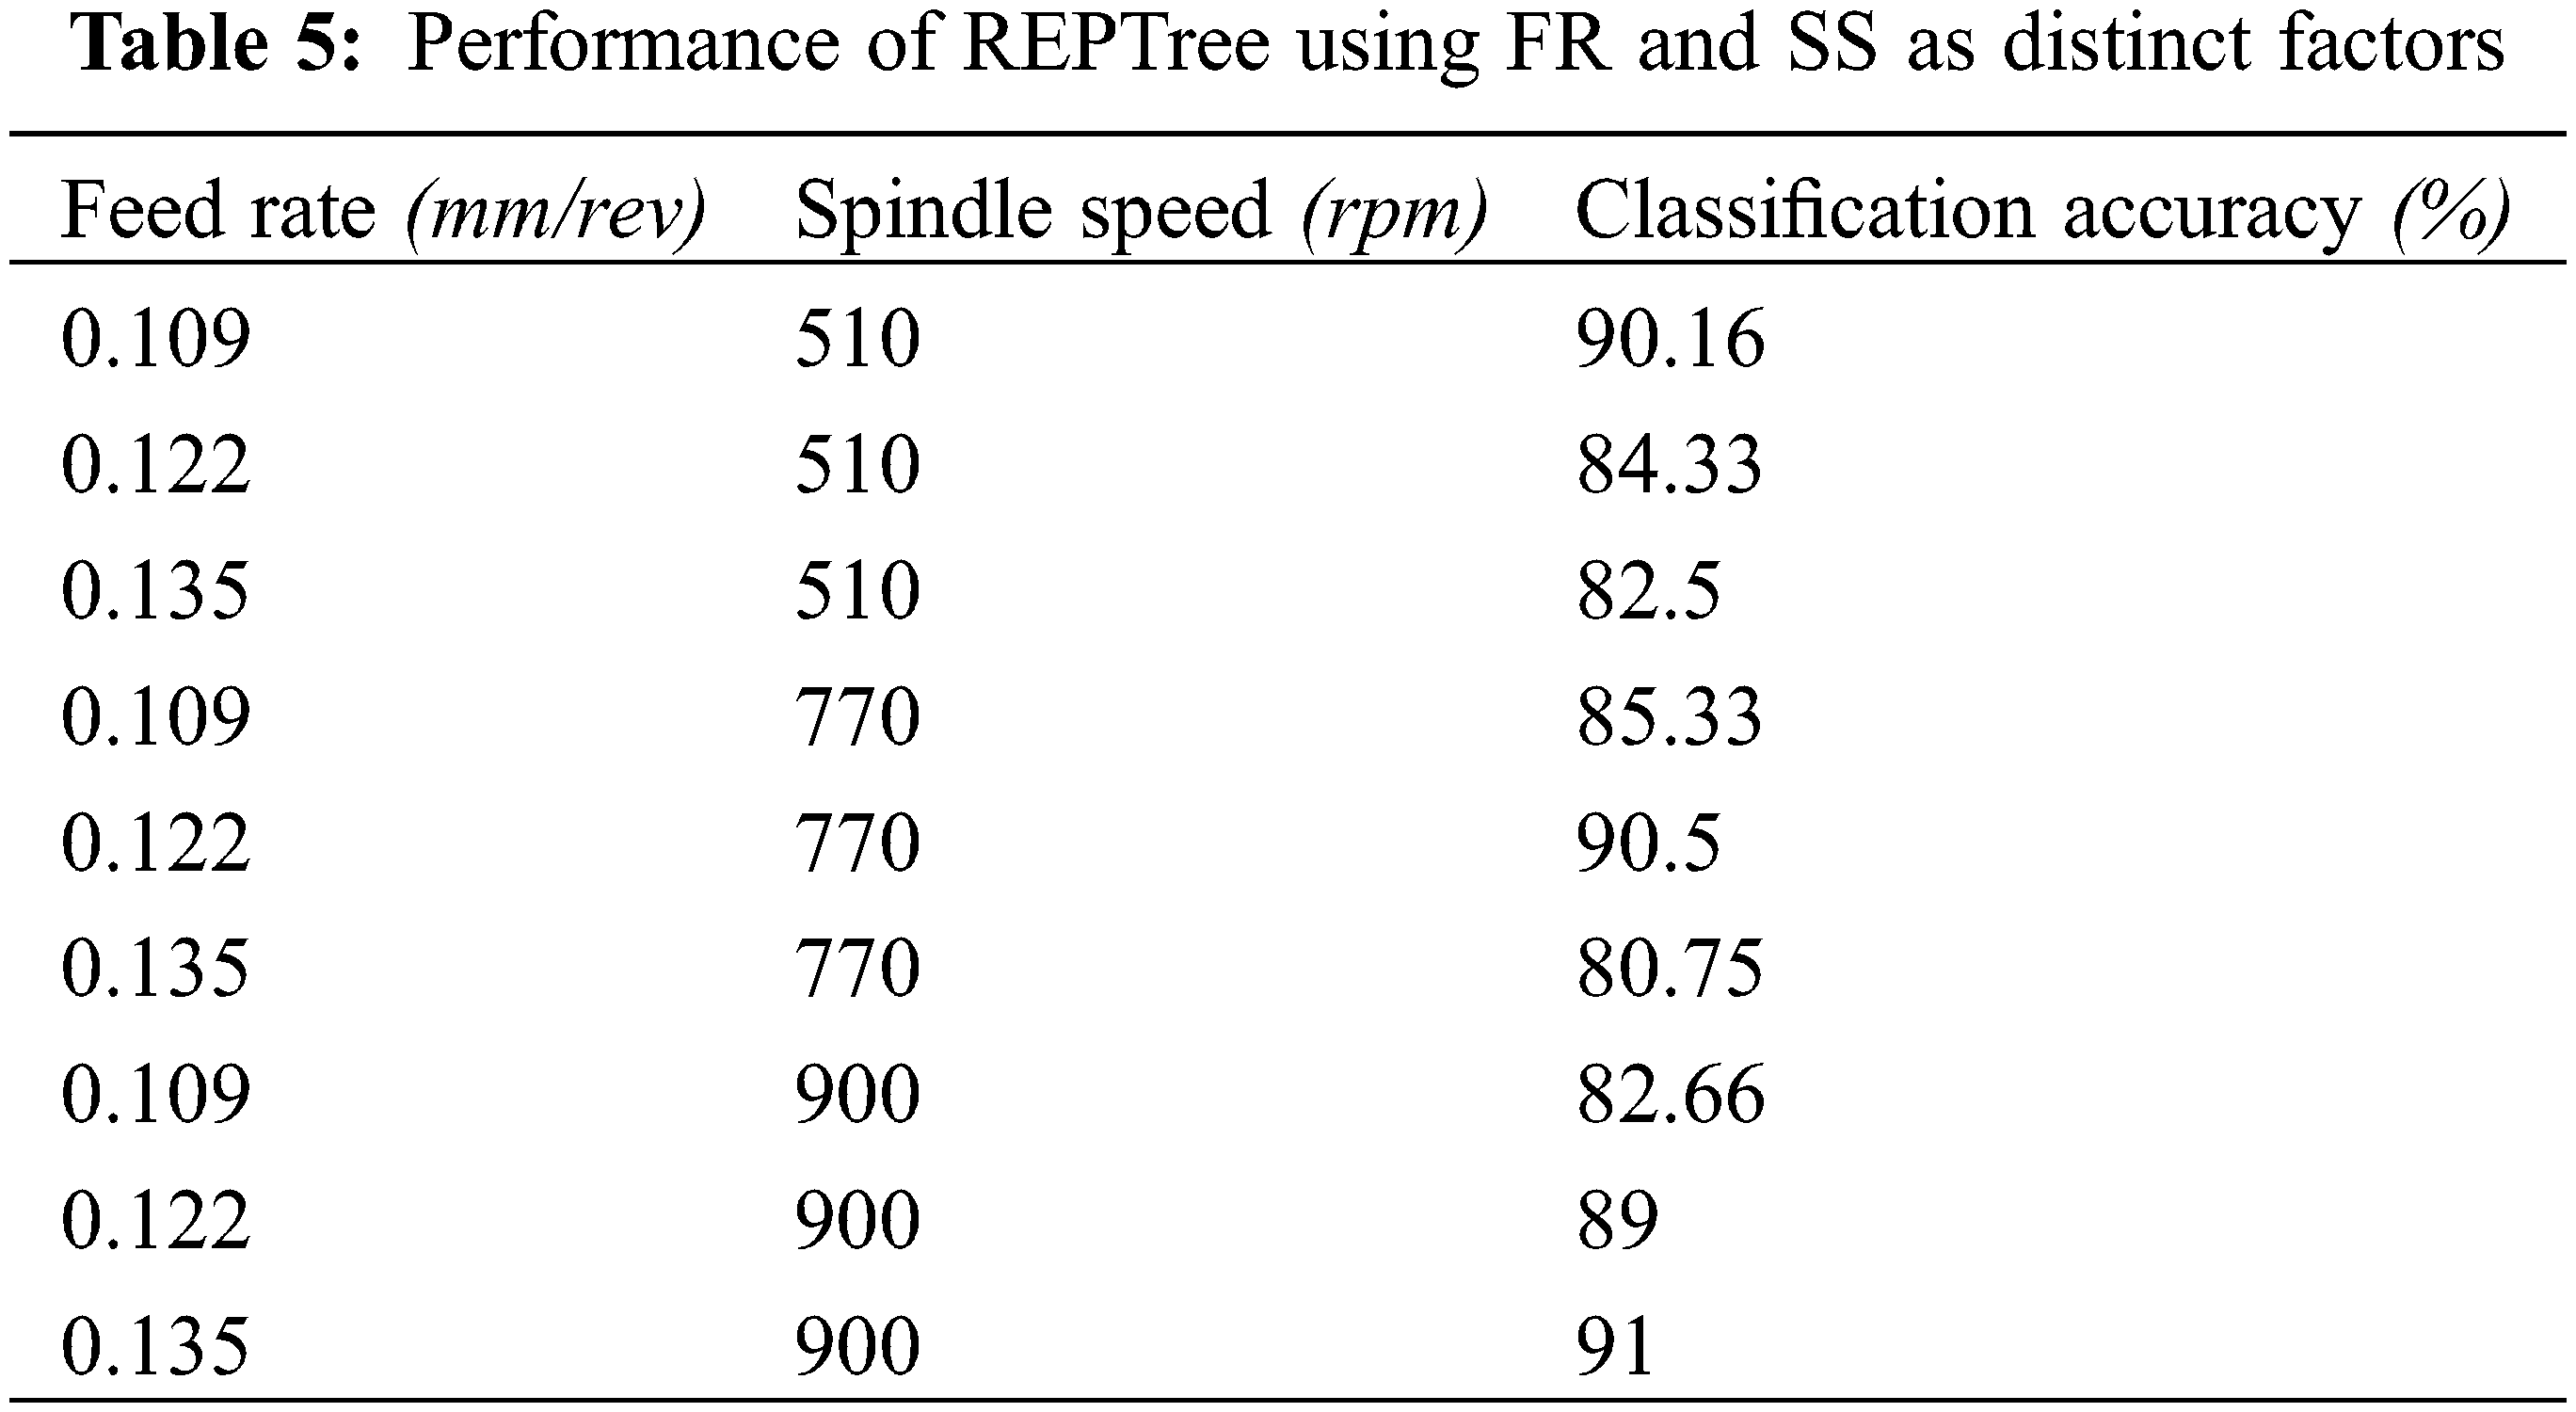
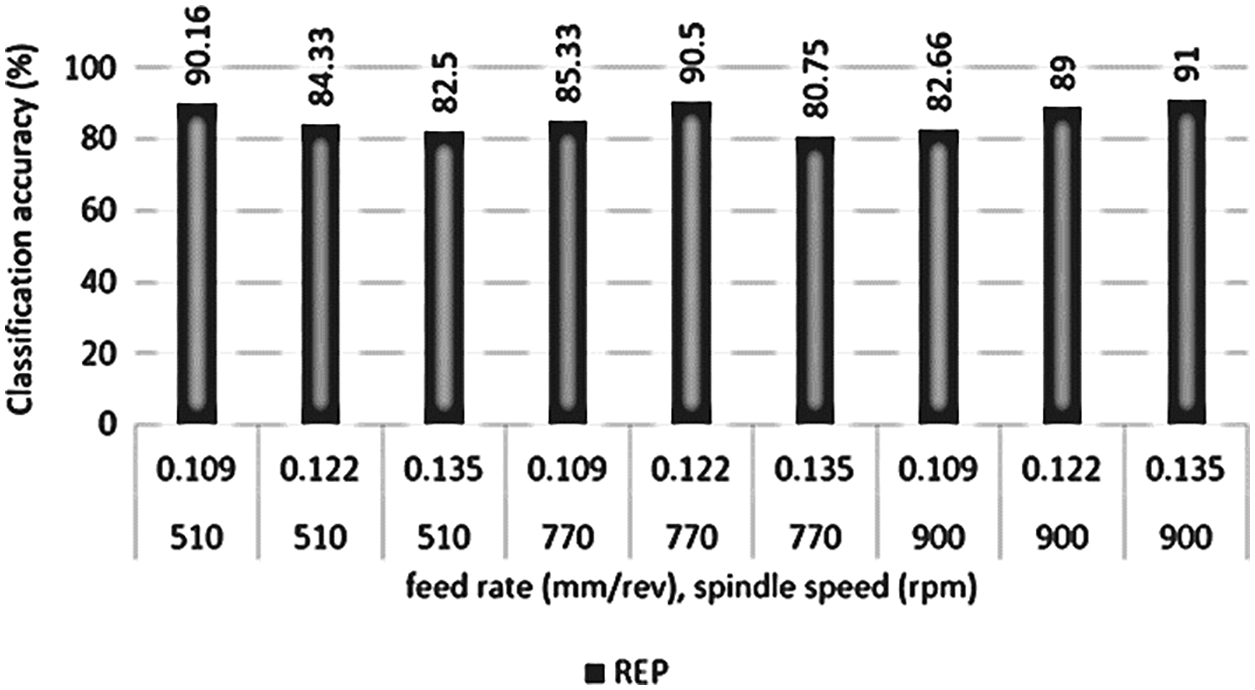
Figure 11: Performance of REPTree using FR and SS as distinct factors
Similarly, by considering DC, FR and SS as distinct factors, the classification accuracy is improved by around 7%. But for some combinations the classification accuracy obtained was less than the previous observations. The accuracy for classifying tool wear is displayed in Table 6 along with comparison in Fig. 12.
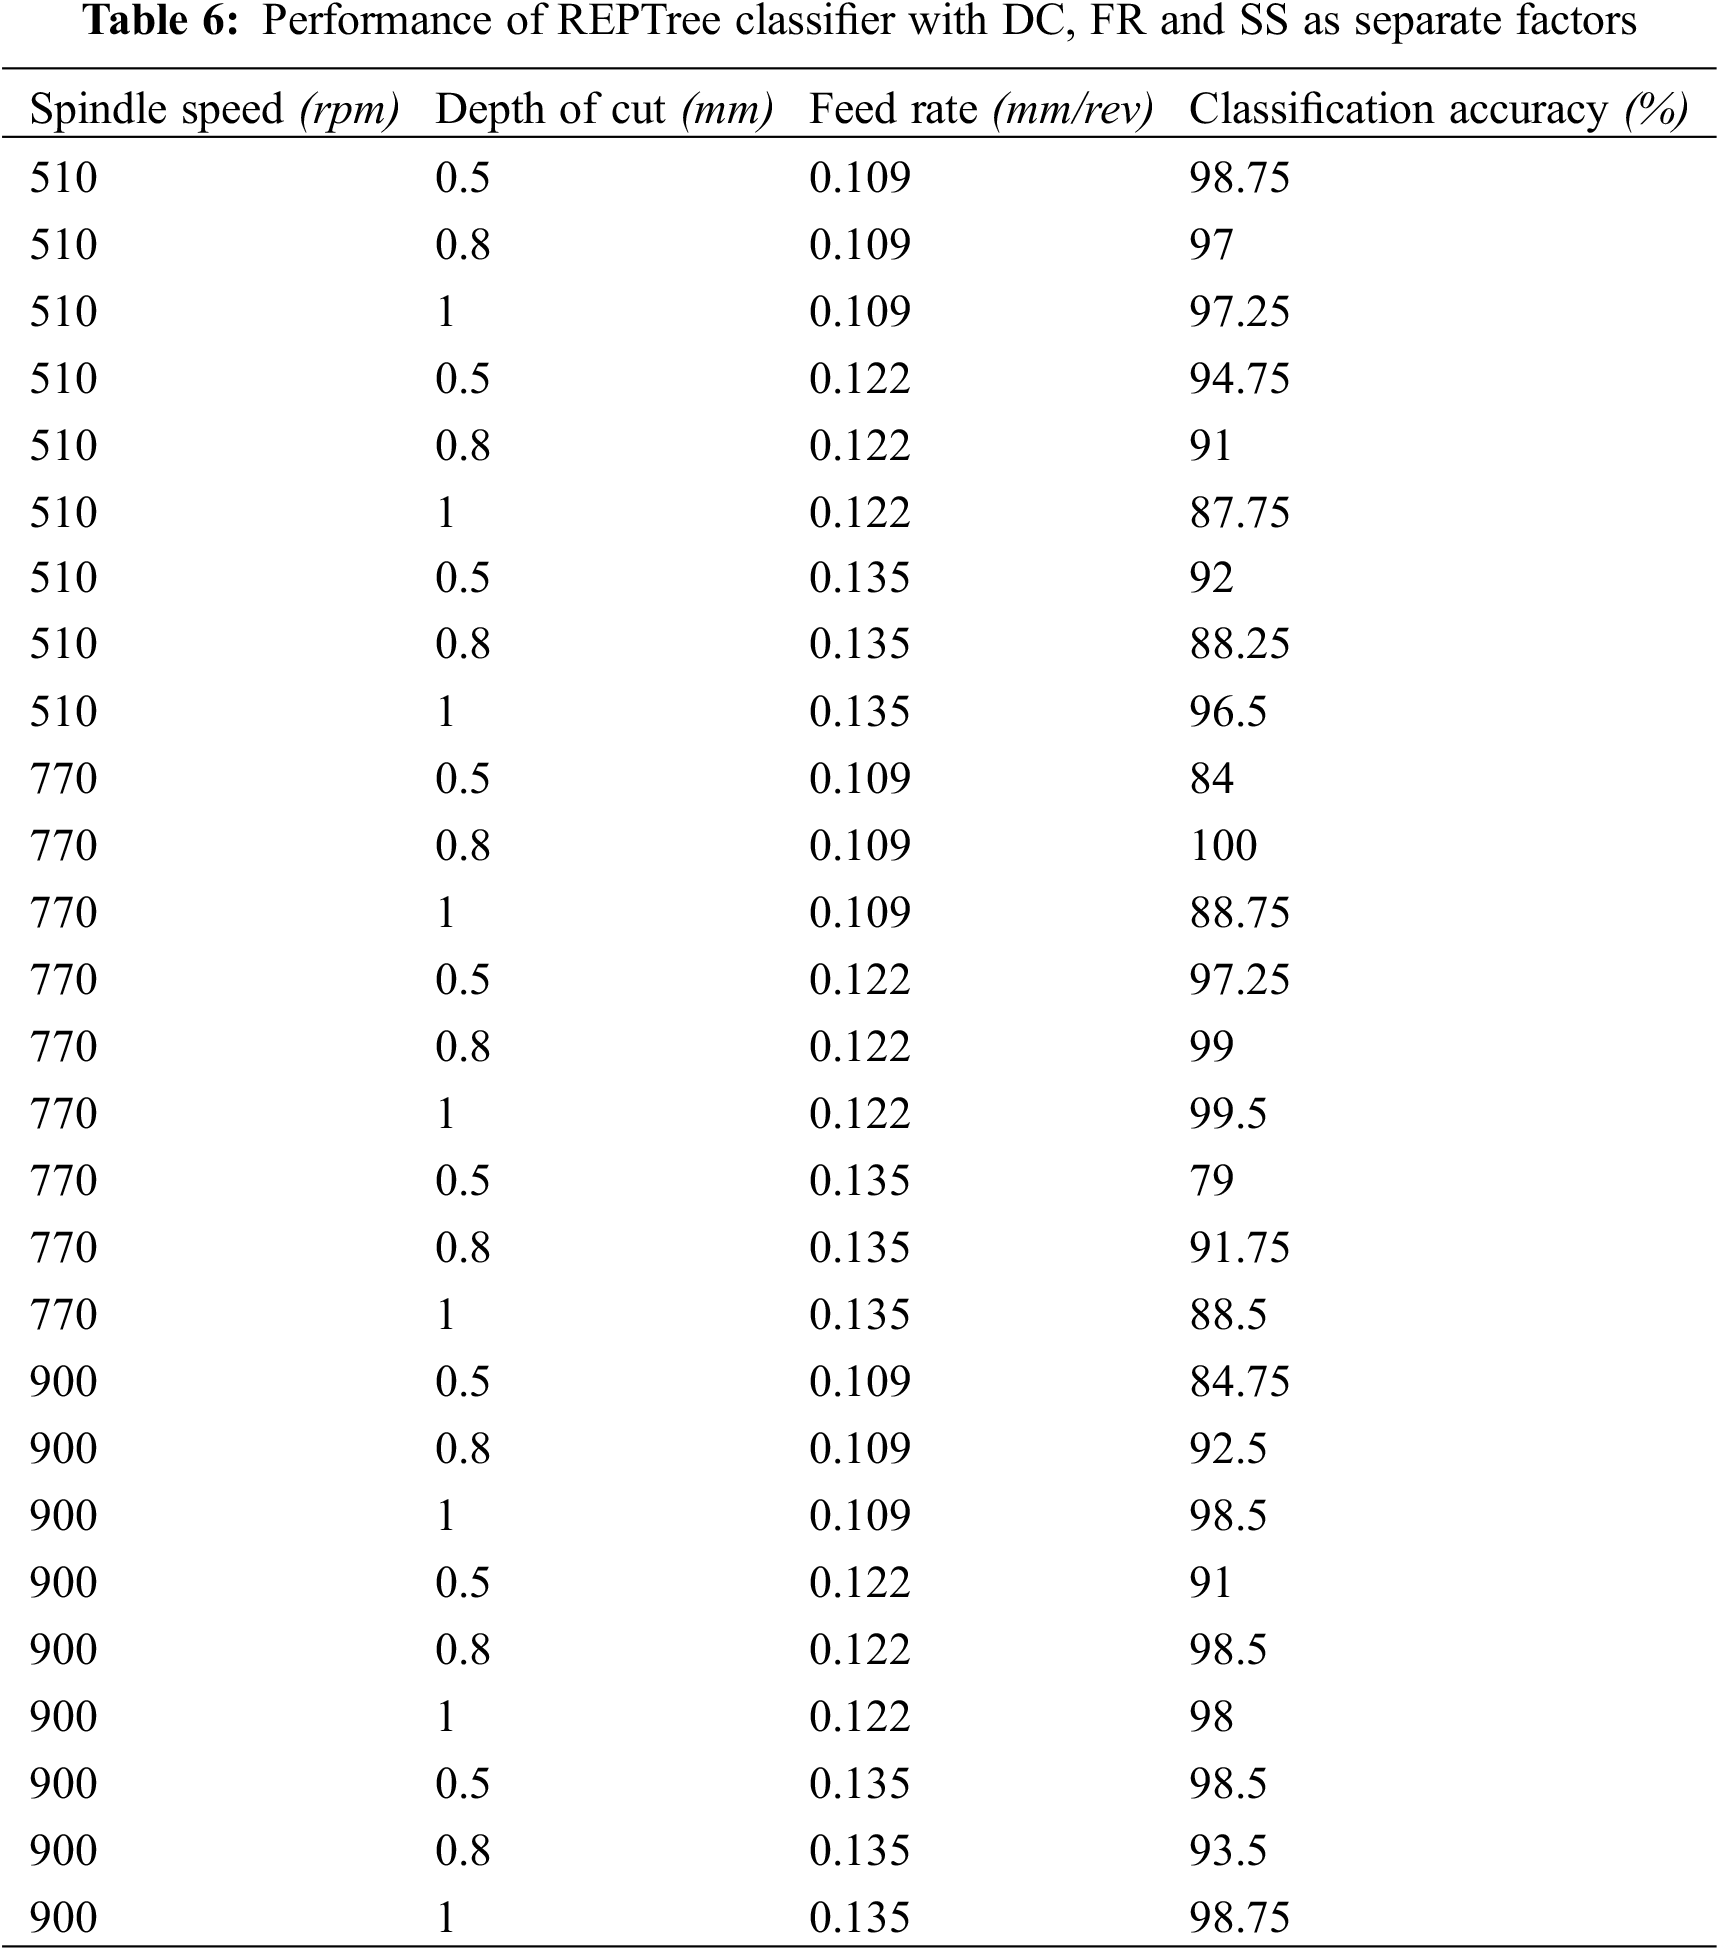
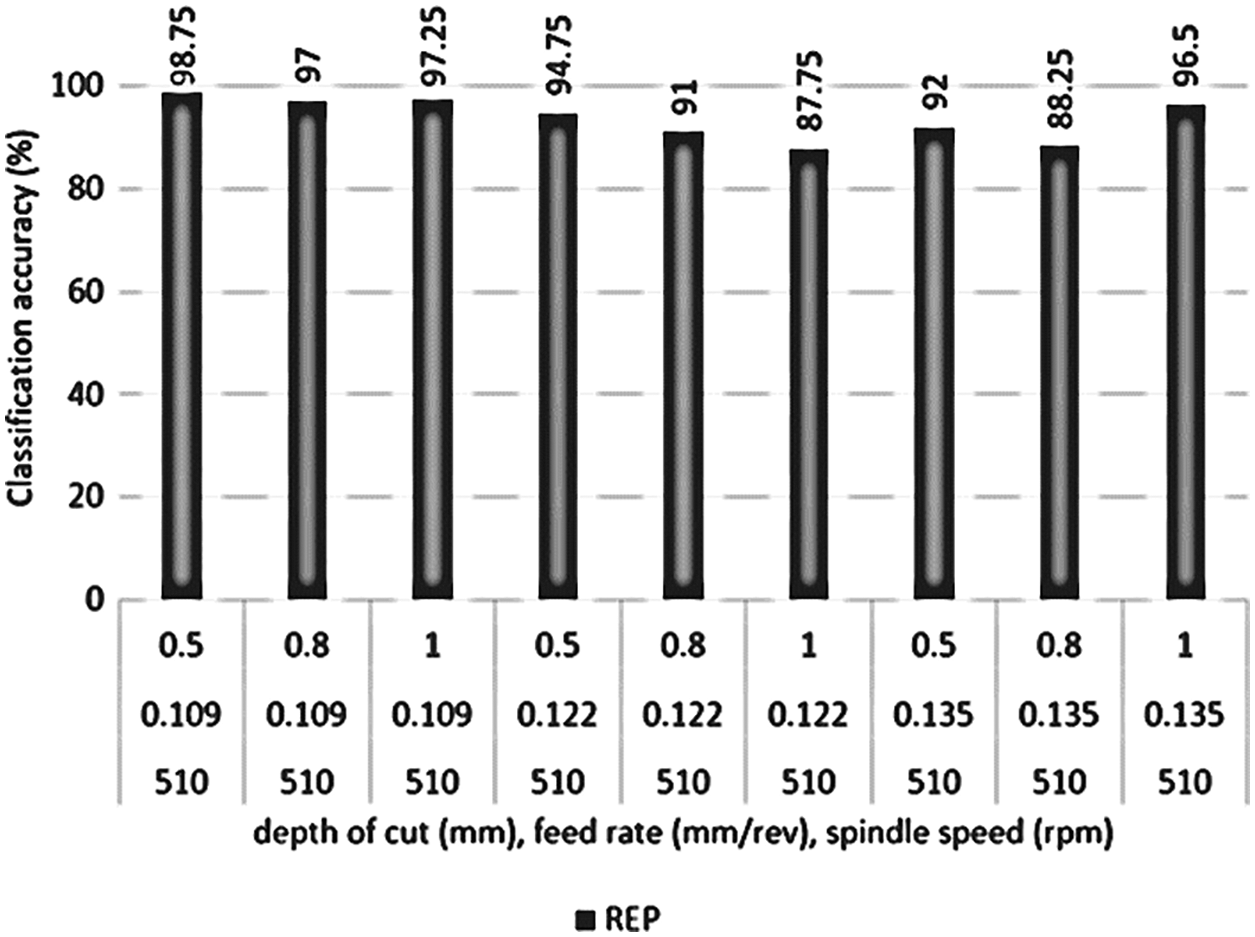
Figure 12: Performance of REPTree classifier with DC, SS and FR as separate factors
If frequency domain features are used instead of statistical domain features while considering DC, FR and SS as distinct factors, the classification accuracies were observed to be less than the statistical feature model in majority of the cases. The comparison between the classification accuracies of the statistical feature model and the frequency domain model is shown in Figs. 13–15.
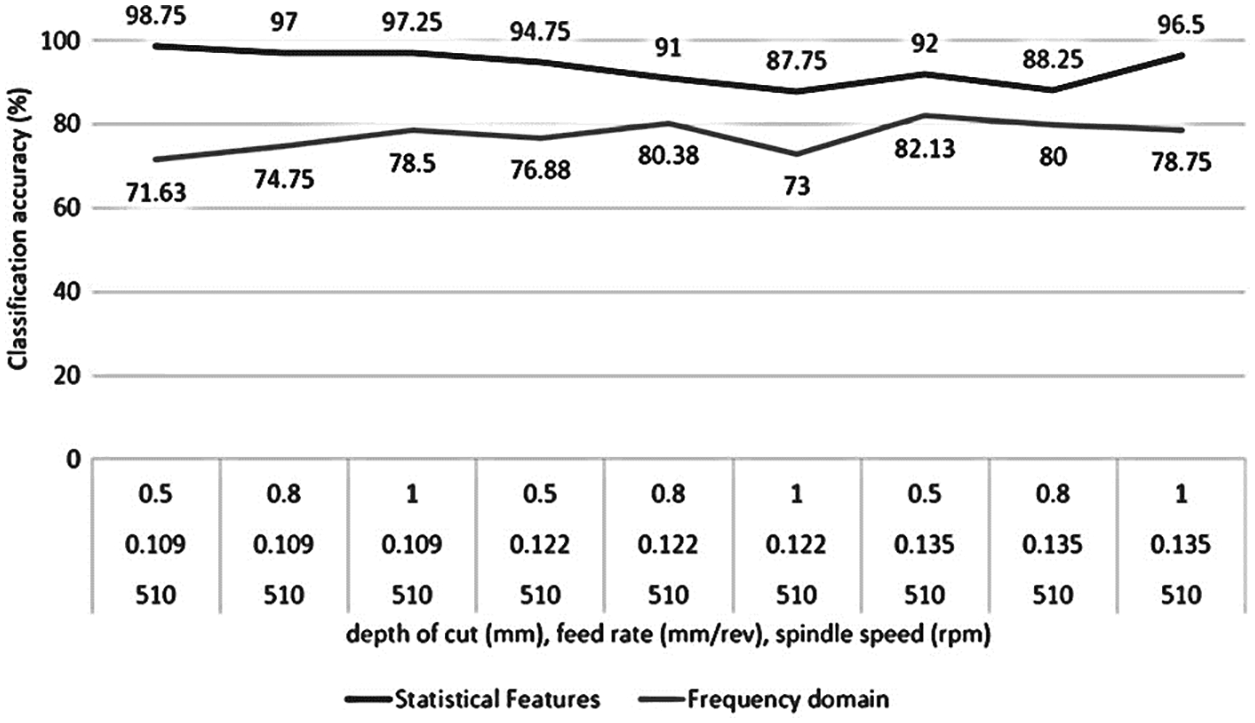
Figure 13: Classification accuracy comparison of REPTree classifier using statistical features and frequency domain features considering DC, FR as distinct factors and 510 rpm SS
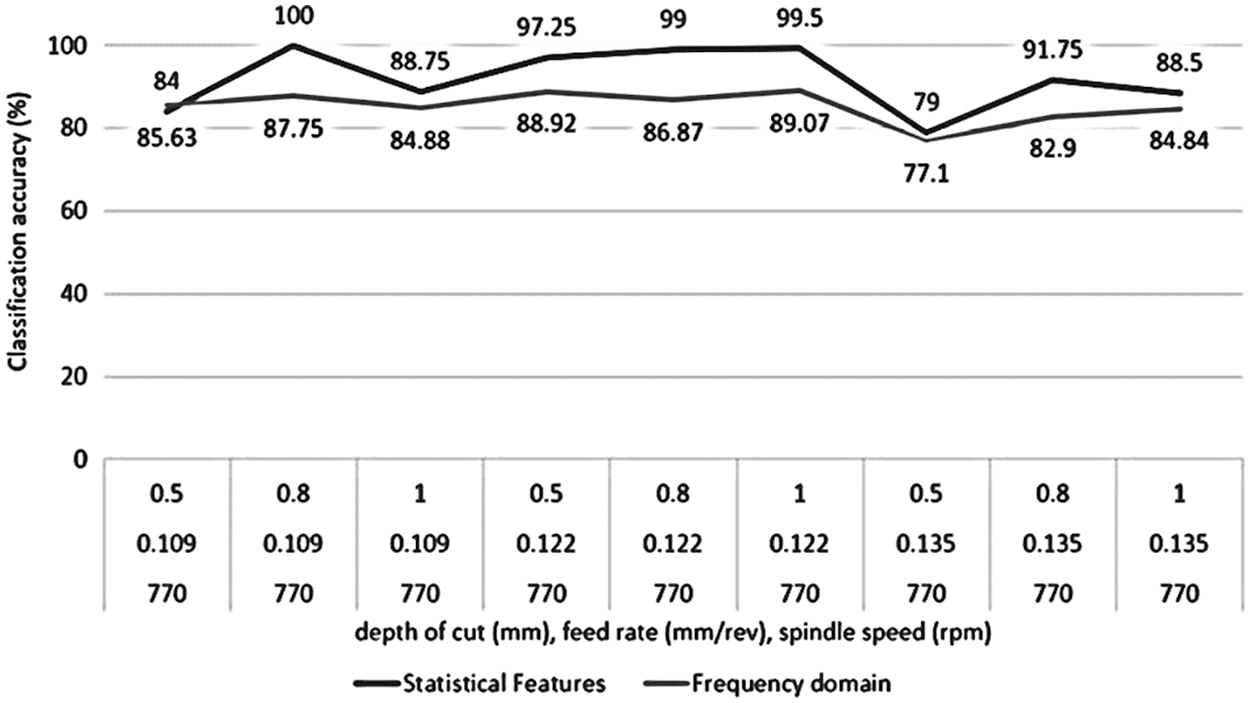
Figure 14: Classification accuracy comparison of REPTree classifier using statistical features and frequency domain features considering DC, FR as distinct factors and 770 rpm SS
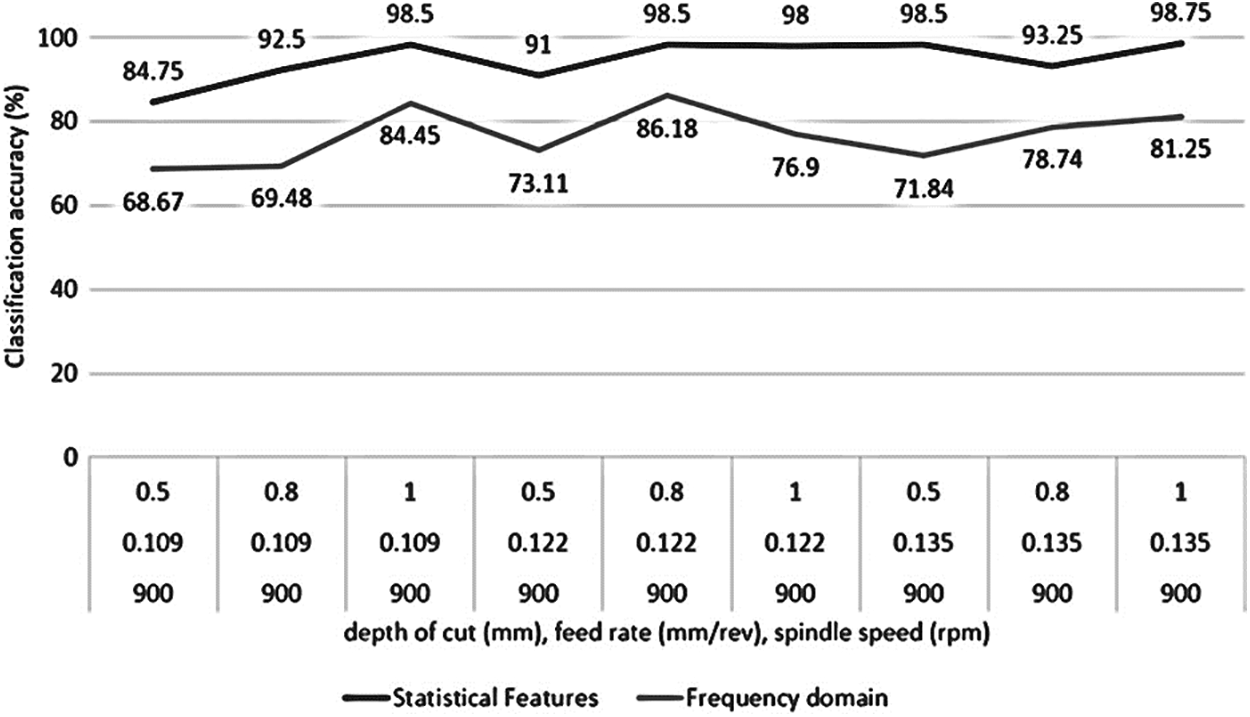
Figure 15: Classification accuracy comparison of REPTree classifier using statistical features and frequency domain features considering DC, FR as distinct factors and 900 rpm SS
It can be observed that the classification accuracies from the classifier trained with statistical features are considerably higher than that trained with frequency domain features, hence they are advantageous. It can be observed that when separate models are considered, the classification accuracy of REPTree classifier shows an increasing trend. Therefore, REPTree classifier can be used for monitoring and classification of various depth of cut, speed of spindle and feed rate while the accuracy for classifying tool wear of 72.77% is acceptable (for all signals combined).
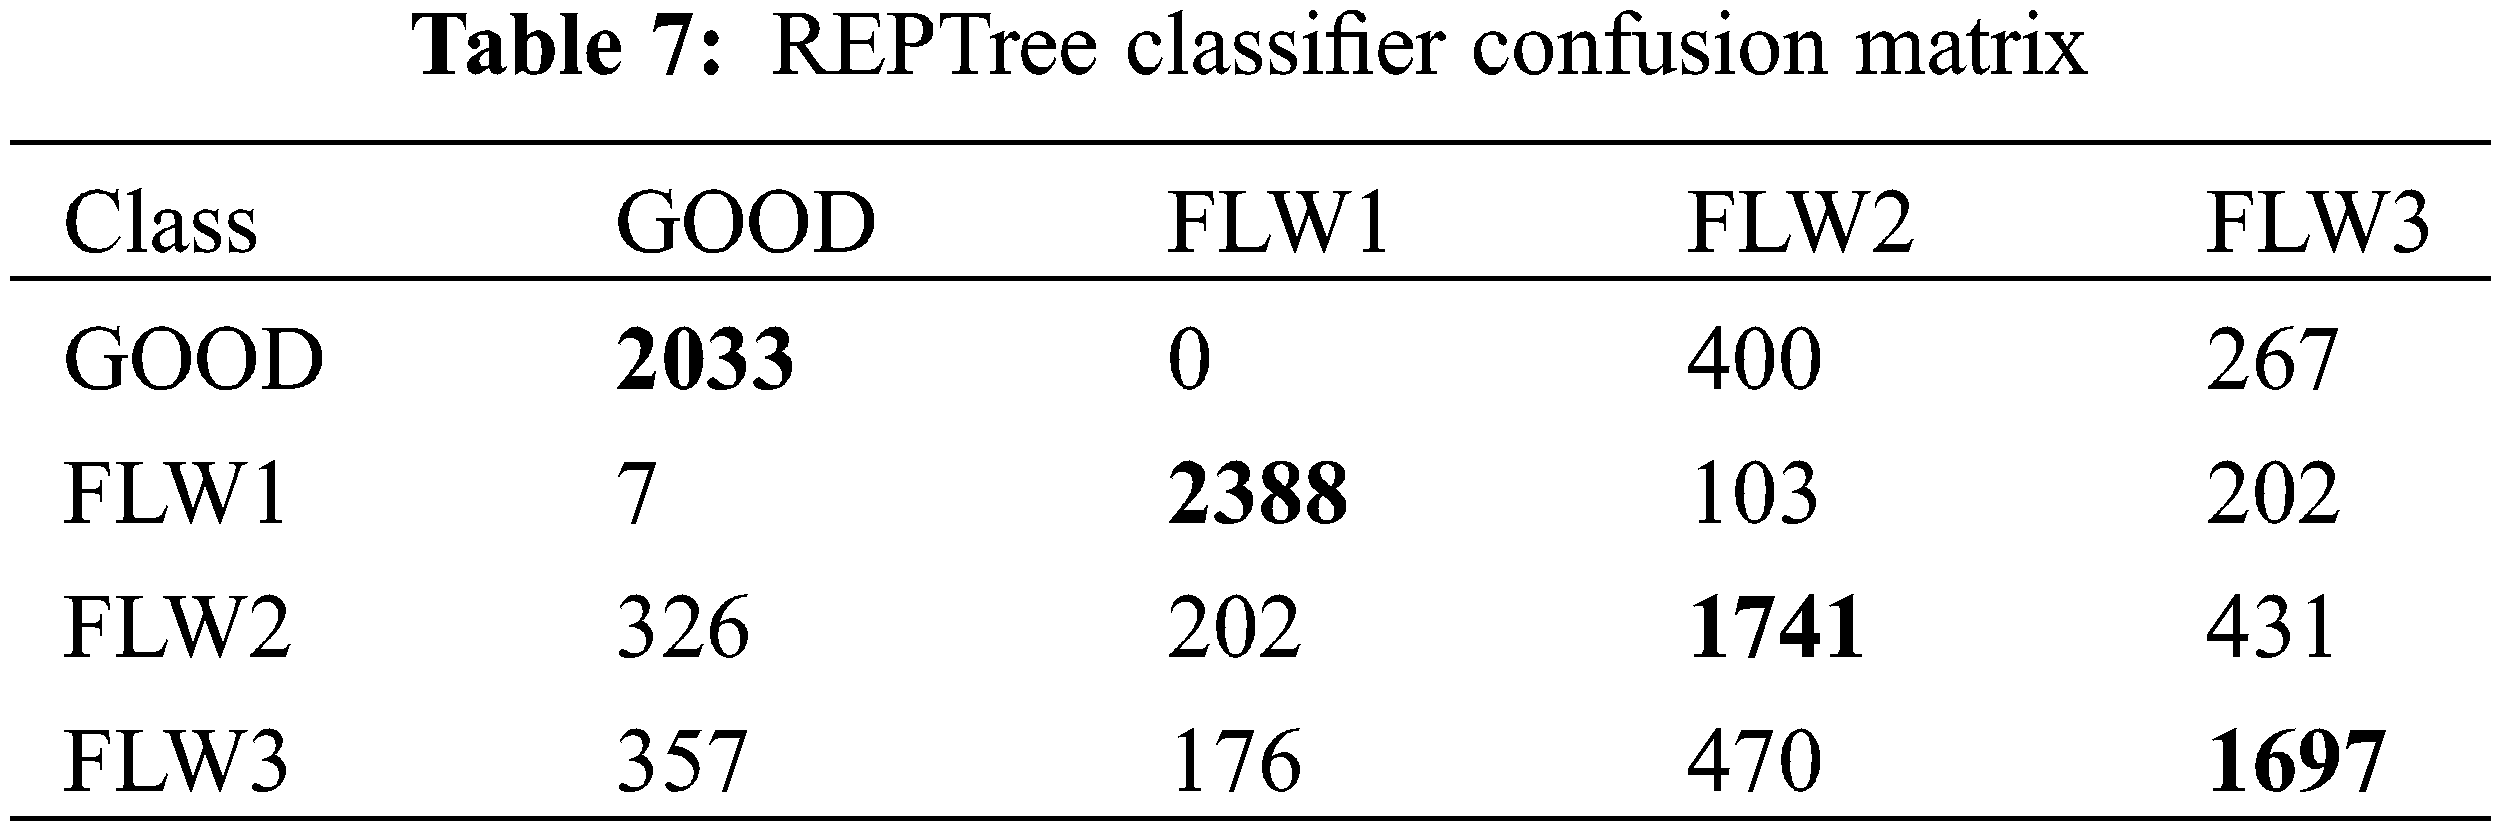
The conventional method to predict fault rate of a learning procedure given a singular, fixed sample of data is a stratified tenfold cross-validation. Every class is embodied in about the same amounts as in the complete dataset with the data being divided into ten parts. Each part is granted orderly and the learning structure is trained on the residual parts. The error rate is calculated on the holdout set. Therefore, the learning technique is executed 10 times on different training sets giving 10 error estimates. An average of the error estimates is taken to get overall error estimate. This makes sure that the fault rate is calculated resourcefully in an unbiased way. The performance of REPTree classifier can be evaluated with the aid of a confusion matrix as represented in Table 7. The tool wear conditions that are correctly (diagonal elements) and incorrectly (non-diagonal elements) classified are represented as the rows and columns of the matrix. The first element of the confusion matrix denotes the number of signals that were obtained from a tool having good condition being classified as GOOD. The second element corresponds to the number of signals obtained from a tool of good condition misclassified as a tool having 0.2 mm flank wear (FLW1). Likewise, the third and fourth element of the first row are the number of signals that were obtained from a tool that should be classified as GOOD but is misclassified as 0.4 mm (FLW2) and 0.6 mm (FLW3) respectively. The others rows are interpreted in the same way. The diagonal elements of the confusion matrix show the correctly classified instances and the other elements signify misclassified instances. The presence of misclassified instances might be due to signals resembling that of the other conditions for some machining parameters.
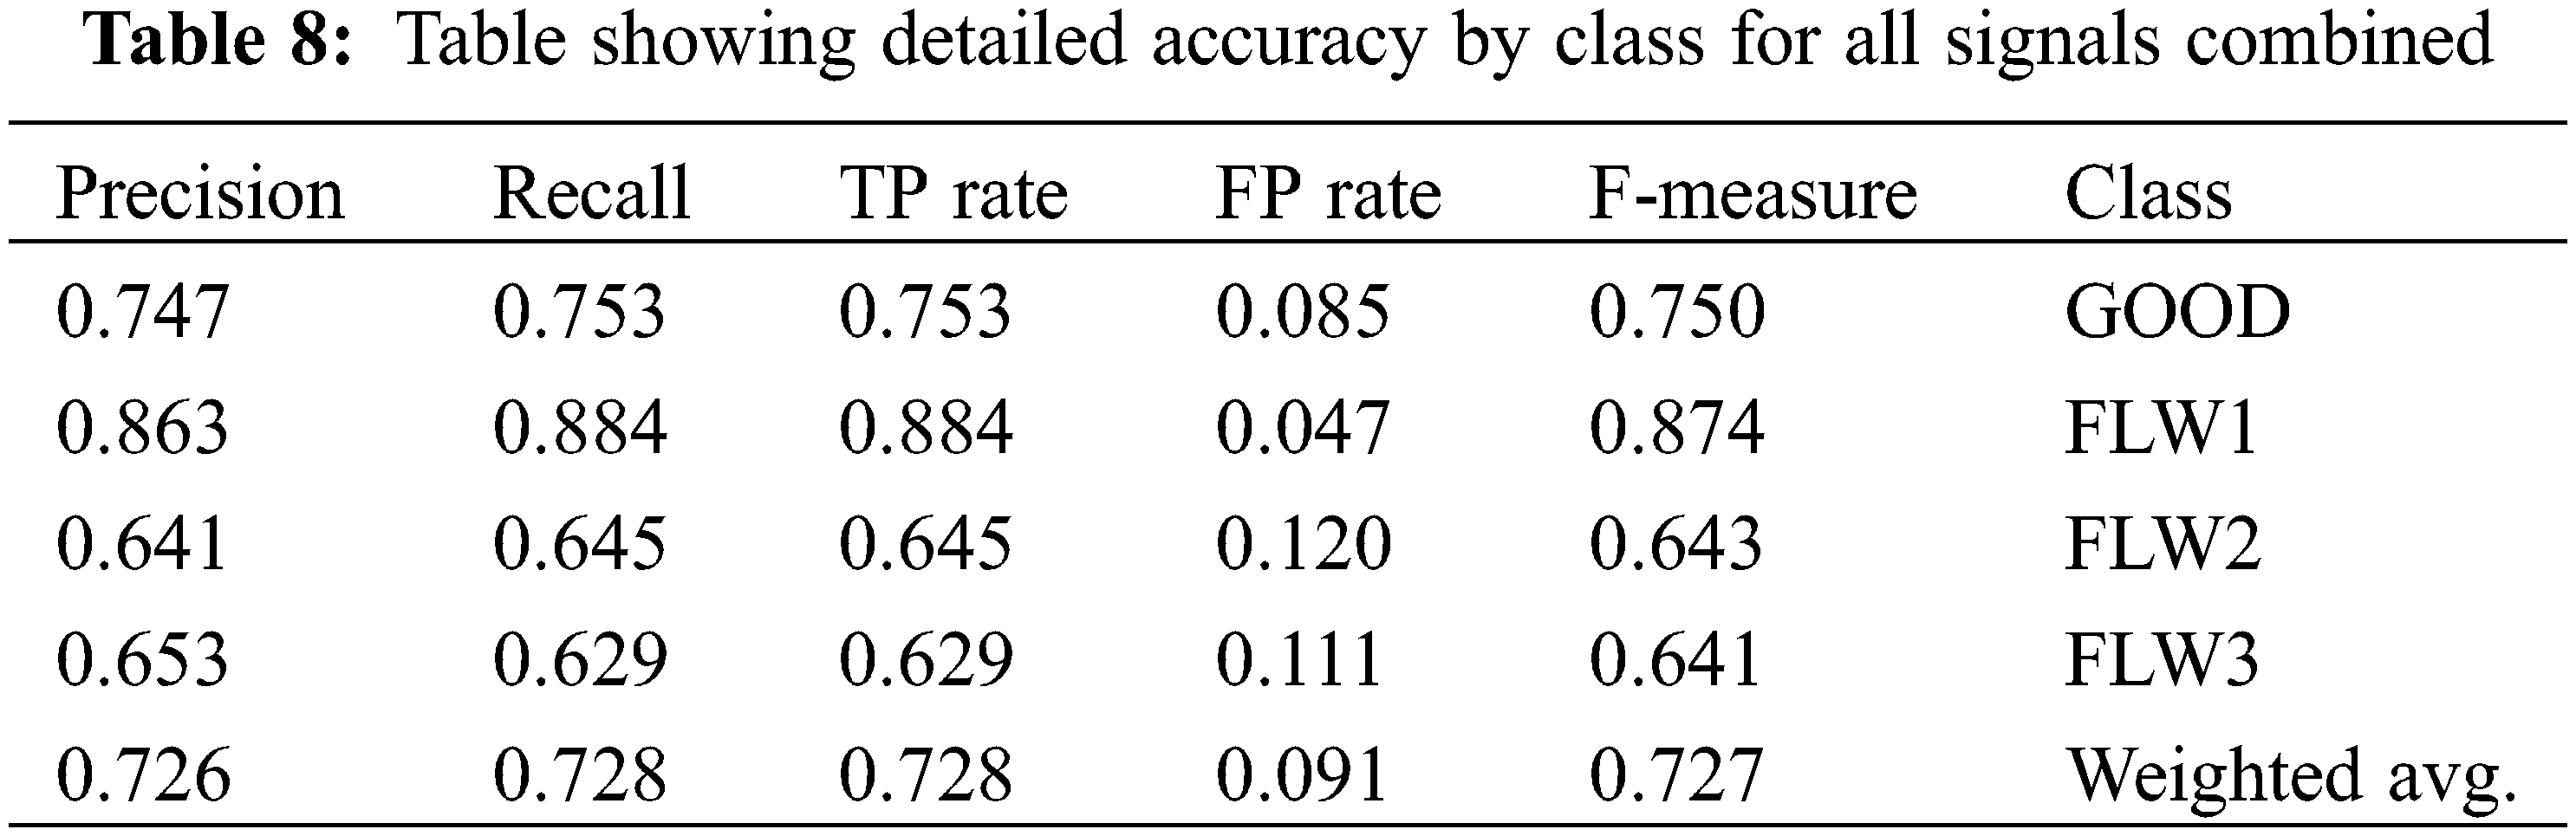
The class wise accuracy is expressed by measures such as the true positive rate (TPR), false positive rate (FPR), precision, recall and F-measure. The amount of cases following the rule that were correctly classified is True Positives (TP). The number of cases following the rule that were wrongly classified is called False Positives (FP). The cases not following the rule but whose class does not meet the expected result class constitute True Negatives (TN). Cases not following the rule but whose class meets the expected result class constitute False Negatives (FN). For a good classifier, the true positive (TP) rate should approach 1 and the false positive (FP) rate should approach 0. From Table 8, most TP rates are close to 1 and most FP rates are close to 0. This confirms the result presented by confusion matrix in Table 7. Precision is the likelihood of retrieved cases that are suited for the class. Mathematically, precision is the ratio of true positive (TP) to the retrieved instances (TP+FP). Precision or the positive predictive value can be called a measure of correctness or quality. Recall which is a measure of completeness or quantity is the information retrieval portraying the likelihood of the errors related to the classification which were retrieved. It is the ratio of true positive (TP) to the overall cases (TP+FN). False negative (FN) is considered as type 2 error, meaning the cases indicate misclassification but is actually correctly classified. F-measure is the harmonic mean of recall and precision.
This study analyses the efficiency of REPTree classifier for monitoring and classifying the tool wear conditions of single point carbide cutting tool. Statistical features and frequency domain features were drawn from the signals obtained for various machining parameters and J48 decision tree algorithm was used to select features significant for the classification. This feature reduction resulted in reduction of computing time and effort. REPTree classifier yielded a classification accuracy of 72.77% for all signals combined and hence can be used for all DC, SS and FR. The classification accuracy was greatly improved when the complexity was reduced by considering the said parameters separately. Misclassifications can be reduced by increasing the training data, so as to prepare the classifier to have better accuracy when classifying a newly acquired signal.
Funding Statement: The authors received no specific funding for this study.
Conflicts of Interest: The authors declare that they have no conflicts of interest to report regarding the present study.
References
1. Rehorn, A. G., Jiang, J., Orban, P. E. (2005). State-of-the-art in methods and results in tool condition monitoring: A review. The International Journal of Advanced Manufacturing Technology, 26, 693–710. DOI 10.1007/s00170-004-2038-2. [Google Scholar] [CrossRef]
2. Teti, R., Jemielniak, K., O’Donnell, G., Dornfield, D. (2010). Advanced monitoring of machining operations. CIRP Annals, 59, 717–739. [Google Scholar]
3. Siddhpura, A., Paurobally, R. (2013). A review of flank wear prediction methods for tool condition monitoring in a turning process. The International Journal of Advanced Manufacturing Technology, 65(1–4), 371–393. DOI 10.1007/s00170-012-4177-1. [Google Scholar] [CrossRef]
4. Zhou, Y., Xue, W. (2018). Review of tool condition monitoring methods in milling processes. The International Journal of Advance Manufacturing Technology, 96(5–8), 2509–2523. DOI 10.1007/s00170-018-1768-5. [Google Scholar] [CrossRef]
5. Hocheng, H., Tseng, H. C., Hsieh, M. L., Lin, Y. H. (2018). Tool wear monitoring in single-point diamond turning using laser scattering from machined workpiece. Journal of Manufacturing Processes, 31, 405–415. DOI 10.1016/j.jmapro.2017.12.007. [Google Scholar] [CrossRef]
6. Bhuiyan, M. S. H., Choudhury, I. A., Dahari, M. (2014). Monitoring the tool wear, surface roughness and chip formation occurances using multiple sensors in turning. Journal of Manufacturing Systems, 33(4), 476–487. DOI 10.1016/j.jmsy.2014.04.005. [Google Scholar] [CrossRef]
7. Sundaram, S., Senthilkumar, P., Kumaravel, A., Manoharan, N. (2008). Study of flank wear in single point cutting tool using acoustic emission sensor techniques. ARPN Journal of Engineering and Applied Sciences, 3(4). [Google Scholar]
8. Rao, K. V., Murthy, B. S., Rao, N. M. (2013). Cutting tool condition monitoring by analyzing surface roughness, work piece vibration and volume of metal removed for AISI 1040 steel in boring. Measurement, 46(10), 4075–4084. DOI 10.1016/j.measurement.2013.07.021. [Google Scholar] [CrossRef]
9. Krishnakumar, P., Rameshkumar, K., Ramachandran, K. I. (2015). Tool wear condition prediction using vibration signals in high speed machining (HSM) of titanium (Ti-6Al-4 V) alloy. Procedia Computer Science, 50, 270–275. DOI 10.1016/j.procs.2015.04.049. [Google Scholar] [CrossRef]
10. Teli, S., Kanikar, P. (2015). A survey on decision tree-based approaches in data mining. International Journal of Advanced Research in Computer Science and Software Engineering, 5(4). [Google Scholar]
11. Elangovan, ., Ramachandran, K. I., Sugumaran, V. (2010). Studies on Bayes classifier for condition monitoring of single point carbide tipped tool based on statistical and histogram features. Expert Systems with Applications, 37(3), 2059–2065 DOI 10.1016/j.eswa.2009.06.103. [Google Scholar] [CrossRef]
12. Benkedjouh, T., Medjaher, K., Zerhouni, N., Rechak, S. (2015). Health assessment and life prediction of cutting tools based on support vector regression. Journal of Intelligent Manufacturing, 26(2), 213–223. DOI 10.1007/s10845-013-0774-6. [Google Scholar] [CrossRef]
13. Wang, G. F., Yang, Y. W., Zhang, Y. C., Xie, Q. L. (2014). Vibration sensor-based tool condition monitoring using ν support vector machine and locality preserving projection. Sensors and Actuators A: Physical, 209, 24–32. DOI 10.1016/j.sna.2014.01.004. [Google Scholar] [CrossRef]
14. Rafezi, H., Akbari, J., Behzad, M. (2012). Tool condition monitoring based on sound and vibration analysis and wavelet packet decomposition. 8th International Symposium in Mechatronics and its Applications (ISMA), pp. 1–4. American University of Sharjah, Shāriqah, United Arab Emirates. [Google Scholar]
15. Painuli, S., Elangovan, M., Sugumaran, V. (2012). Tool condition monitoring using K-star algorithm. Expert Systems with Applications, 41(6), 2638–2643. DOI 10.1016/j.eswa.2013.11.005. [Google Scholar] [CrossRef]
16. Gangadhar, N., Kumar, H., Narendranath, S. (2014). Fault diagnosis of single point cutting tool through vibration signal using decision tree algorithm. Procedia Material Science, 5, 1434–1441. DOI 10.1016/j.mspro.2014.07.462. [Google Scholar] [CrossRef]
17. Gangadhar, N., Kumar, H., Narendranath, S. (2015). Condition monitoring of a single point cutting tool through vibration signals using decision tree algorithm. Journal of Vibration Analysis, 3(1), 34–43. [Google Scholar]
18. Gierlak, P., Burghardt, A., Szybicki, D., Szuster, M., Muszynska, M. (2017). Online manipulator tool condition monitoring based on vibration analysis. Mechanical Systems and Signal Processing, 8, 14–26. [Google Scholar]
19. Dev, P., Singh, K., Dhawan, S. (2015). Classification of malicious and legitimate nodes for analysing the users’ behaviour in heterogeneous online social networks. 2015 International Conference in Futuristic Trends on Computational Analysis and Knowledge Management (ABLAZE), pp. 359–363. Institute of Electrical and Electronics Engineers, Noida, India. [Google Scholar]
20. Mohamed, W. N. H. W., Salleh, M. N. M., Omar, A. H. (2012). A comparative study of reduced error pruning method in decision tree algortihms. International Conference on Control System, Computing and Engineering, Penang, Malaysia. [Google Scholar]
21. Esposito, F., Malerba, D., Semeraro, G., Tamma, V. (1999). The effects of pruning methods on the predictive accuracy of induced decision trees. Applied Stochastic Models in Business and Industry, 15(4), 277–299. DOI 10.1002/(ISSN)1526-4025. [Google Scholar] [CrossRef]
22. Surendar, S., Elangovan, M. (2017). Comparison of surface roughness prediction with regression and tree-based regressions during boring operation. Indonesian Journal of Electrical Engineering and Computer Science, 7, 887–892. DOI 10.11591/ijeecs.v7.i3.pp887-892. [Google Scholar] [CrossRef]
23. Witten, I. H., Frank, E. (2005). Data mining: practical machine learning tools and techniques, 2nd ed. Morgan Kaufmann Publishers Inc., San Francisco, CA, USA. [Google Scholar]
24. Srinivasan, B., Mekala, P. (2014). Mining social networking data for classification using reptree. International Journal of Advance Research in Computer Science and Management Studies, 2(10). [Google Scholar]
25. Al Janabi, K. B. S., Kadhim, R. (2018). Data reduction techniques. A comparative study for attribute selection methods. International Journal of Advanced Computer Science and Technology, 8(1), 1–13. [Google Scholar]
 | This work is licensed under a Creative Commons Attribution 4.0 International License, which permits unrestricted use, distribution, and reproduction in any medium, provided the original work is properly cited. |