| Structural Durability & Health Monitoring |
DOI: 10.32604/sdhm.2022.022241
ARTICLE
Sensor Layout of Hoisting Machinery Vibration Monitoring Based on Harmony Genetic Search Algorithm
1Jiangsu Key Laboratory of Engineering Mechanics, School of Civil Engineering, Southeast University, Nanjing, 211189, China
2China Special Equipment Inspection and Research Institute, Beijing, 100029, China
*Corresponding Authors: Keqin Ding. Email: Kqding@sina.com; Hui Jin. Email: jinhui@seu.edu.cn
Received: 28 February 2022; Accepted: 07 March 2022
Abstract: With the construction of automated docks, health monitoring technology as a parallel safety assurance technology for unmanned hoisting machinery has become a hot spot in the development of the industry. Hoisting machinery has a huge structure and numerous welded joints. The complexity and nonlinearity of the welded structure itself makes the structural failure parts random and difficult to arrange for monitoring sensors. In order to solve the problem of effectiveness and stability of the sensor arrangement method for monitoring the structure of hoisting machinery. Using the global and local search capabilities enhanced by the complementary search mechanism, a structural vibration monitoring sensor placement algorithm based on the harmony genetic algorithm is proposed. Firstly, the model is established for modal analysis to obtain the displacement matrix of each mode. Secondly, the optimal parameter combination is established through parameter comparison, and the random search mechanism is used to quickly search in the modal matrix to obtain the preliminary solution, and then the preliminary solution is genetically summed The mutation operation obtains the optimized solution, and the optimal solution is retained through repeated iterations to realize the decision of the vibration sensor layout of the crane structure monitoring. Combining the comparison test of harmony genetic algorithm, harmony search algorithm and genetic algorithm, the fitness of harmony genetic algorithm in X, Y and Z directions were 0.0045, 0.0084 and 0.0058, respectively, which were all optimal. And the average probability of deviating from the optimal path is 1.10%, 19.34%, and 54.43%, which are also optimal. Harmony genetic algorithm has the advantages of simplicity, fastness and strong global search ability, and can obtain better fitness value and better search stability.
Keywords: Lifting machinery; vibration monitoring; sensor arrangement; harmony genetic search algorithm
Hoisting machinery is an important infrastructure in the construction of the national economy, an important equipment in the construction of major national projects, and also a pioneer in the implementation of major national strategic plans. As of the end of 2020, my country has registered 2.5384 million units of cranes in use, accounting for 15.40% of the total amount of special equipment. The development of my country’s lifting machinery industry started late and its design concepts are backward. The lifting machinery industry has congenital “inadequate design” and acquired “maintenance disorder” and other outstanding problems. In 2020, a total of 107 special equipment accidents and related accidents occurred nationwide, with 106 deaths, of which 27 were crane accidents, accounting for 25.23%, and 31 deaths, accounting for 29.25%. Crane accidents have been ranked as special equipment for many consecutive years. At the forefront of equipment accidents [1]. In recent years, in order to strengthen the safety management of lifting machinery, the research and application of lifting machinery health monitoring has gradually developed. For example, Ding et al. [2,3] have developed a large-scale crane health monitoring system and conducted demonstration applications in Beihai Port and Qingdao Port in Guangxi. Li et al. [4] have studied the use of optical fiber sensing technology in crane metal structure health monitoring application. Ding et al. [5] studied the basic theory of the lifting machinery health monitoring system and carried out the demonstration application of the system. With the construction of automated terminals such as Xiamen Ocean Terminal, Yangshan Port, Qingdao Port and Shenzhen Mawan Port, the demand for unmanned cranes is increasing. As a parallel safety system for unmanned cranes, the health monitoring system can make up for the loss of personnel. Due to the lack of equipment perception caused by the movement, the health monitoring of lifting machinery has become a key area of industry development. Deploying sensors in key parts of the structure is the key to the success of the crane’s health monitoring. Due to the complexity and nonlinearity of the welding structure of the crane itself, too few sensor arrangements and inappropriate arrangements will not be able to obtain the response of the key parts of the structure. Lead to problems such as ineffective or insufficient monitoring. Too many sensor arrangements can obtain as many structural responses as possible, but the monitoring investment cannot be afforded by large enterprises. A large number of sensor layouts will bring difficulties to the remote transmission, storage and analysis of data. At the same time, a large number of sensor layouts will affect the reliability and stability of the monitoring system itself [6–8].
Sensor optimal placement methods and evaluation criteria are affected by multiple factors such as the complexity of the analyzed object’s structure, the number of nodes, the number of units, the order of structural vibration response, and the number of expected sensors to be deployed, and each has its own characteristics. Representative methods include Fisher information matrix method [9], effective independence method [10–14], motion energy method [15], Guyan model condensation method [16–18], QR decomposition method [19,20], GA genetic algorithm [21,22], SAA simulated annealing method [23,24], PSO particle swarm algorithm [25–27], HS harmony search method [28,29], Risk analysis [30] and other methods [31,32]. In general, the sensor optimal placement methods include static response method, dynamic response method and intelligent algorithm. The static response method uses finite element simulation, combined with simulated stress cloud diagram and deformation cloud diagram, to lay out the maximum stress point and maximum deformation position of the structure. The disadvantage is that the finite element simulation simplifies details such as chamfers and welds in the modeling stage, resulting in the stress cloud map and the deformation cloud map being incompletely consistent with the actual situation. In addition, due to factors such as processing technology, installation technology, and service conditions, the structure actually appears to be damaged. The position of does not match the dangerous point calculated by the finite element. The dynamic response method, such as the effective independent method and the minimum modal confidence method, can combine the structural model mode shape and mode vector, and comprehensively analyze the points with larger structural mode response and larger structural mode displacement points, and finally Obtain the only structural monitoring point. The disadvantage is that with the complexity of the structural model and the increase in the number of grid nodes, it is difficult to quickly analyze the final measurement points for models with more than 100, 000 nodes. Therefore, this type of method is usually used for models with less than 100,000 nodes. Intelligent search algorithms such as genetic algorithm, harmony search algorithm, simulated annealing algorithm and other methods have good search performance and high search efficiency, can quickly realize the search calculation of a large number of node models, and determine the convergence function based on the given evaluation criteria. The local optimal solution under this evaluation criterion can be obtained. The disadvantage is that under the influence of variable selection and optimization gradient, the intelligent search algorithm is easy to fall into the local optimum to obtain the non-global optimum solution, and the result of multiple runs is relatively large.
With the development of intelligent technology, the methods of intelligent optimization algorithm, multi-dimensional sensor parameter fusion algorithm and multi-optimization algorithm cross fusion have been used for sensor arrangement optimization. For example, the Euclidean distance derived from analytic geometry by Cao et al. [33] based on the principle of information entropy, constructed an optimized objective function and proposed a distance coefficient-multi- objective information fusion algorithm. Niu et al. [34] combined QR decomposition method and genetic algorithm to realize the optimal arrangement of hydraulic structure health monitoring sensors. Hua et al. [35], etc., combined the effective independent transmission of EFI and MAC method to realize the optimal placement of composite wing box sensors. Liu et al. [36] studied the distribution estimation algorithm and the harmony search algorithm, introduced the estimation probability model idea of the distribution estimation algorithm, and took a certain steel structure as an example to select the optimal placement of sensors. Based on the analysis of various methods, this paper uses the global search advantage of the harmony search algorithm and the local search advantage of the genetic algorithm to propose a Harmony Genetic Search Algorithm (HGSA) that integrates intelligent algorithms, using complementary search mechanisms The global and local search capabilities of the algorithm are improved, and the research on the layout method of the vibration sensor of the crane structure monitoring is realized.
In the traditional harmony search algorithm, each tonal variable in a group of harmony is the value of the independent variable corresponding to the problem. However, in the optimization problem of measuring point layout based on the modal matrix, the harmony needs to be converted into measuring points. Harmony elements are encoded. When the number of selectable measuring points in the system is n, the length of the harmony is n, where each element in the harmony represents the decision variable of the corresponding coded measuring point. When the element value is 1, it means that the measuring point is selected, and vice versa 0 means it is not selected. HGSA combines the ideas of harmony search algorithm and genetic algorithm. On the basis of the harmony search algorithm quickly obtains the local optimal solution, the genetic algorithm introduces the idea of survival of the fittest. Through selection operation, crossover operation, mutation operation, etc., first through selection and crossover, So that high-quality genes (elements) are retained and inherited to the next generation (the next set of harmony), and then based on a certain genetic mutation probability, new genes are obtained through genetic mutation to form a new next generation, increasing genetic diversity (overall Search ability) to get a better solution.
According to the geometric dimensions of the model to be analyzed, a finite element model is established, the mesh is divided, the boundary conditions of the structure are defined, and the modal analysis is performed. Enter the finite element post-processing to obtain the m-order modal results of the structure, extract the n node numbers and the x-direction, y-direction, z-direction displacements Ux, Uy, Uz of each node in each mode, and use each mode displacement to construct the model The modal displacement matrix φ is the total solution space HM. The solution space is shown in Eq. (1).
In the formula, snm represents the displacement of the n-th node in the m-th order mode.
Randomly extract j groups of node combinations from the full set solution space as the harmony memory bank, which is shown in Eq. (2).
In the formula, s represents the number of sensors, and represents the displacement of the m-th order mode corresponding to the randomly selected node.
Randomly generate a variable r1 between [0, 1], and compare r1 with HMCR, and execute Eq. (3). That is, when r1 < HMCR, a group of harmony will be randomly obtained in the initialized harmony memory. When r1 ≥ HMCR, a group of harmony is obtained randomly from the solution space.
Randomly generate a variable r2 between [0, 1], perform local fine-tuning of the harmony obtained from the harmony memory bank, and execute Eq. (4). That is, when r2 < PAR, use the fine-tuning bandwidth W to adjust the harmony to obtain a set of new harmony; when r2 ≥ PAR, no adjustment is made.
Modal Assurance Criterion (MAC) reflects the correlation between the two modal mode vectors. When Mij = 1(i ≠ j), it shows that the angle between the i-th mode vector and the j-th mode vector is 0, the two are indistinguishable; at that time, Mij = 0(i ≠ j) shows that the i-th mode vector and the j-th mode vector are orthogonal, and the two can be distinguished [37]. Therefore, MAC can be used as a fitness function to judge the optimization algorithm. Calculate the fitness of each group of new harmony according to formula (5), and then execute formula (6). That is, when f(Xnew) < f(Xworst), use f(Xnew) instead of f(Xworst), and Xnew instead of Xworst; otherwise, no modification is made.
In the formula, φi represents the i-th order mode vector, φj represents the j-th order mode vector, φi and φj are column vectors. The values of i and j depend on the mode order of the analysis model, and E is the identity matrix.
Using the idea of roulette selection algorithm, select the appropriate selection operator according to formula (7), select one from the initial elite population to replace the global optimal position, and pass it to the next generation as the parent through cross-matching.
The two parents determined have a certain probability (crossover probability CRO) to cross, that is, refer to Fig. 1 for exchange to obtain a new offspring individual.
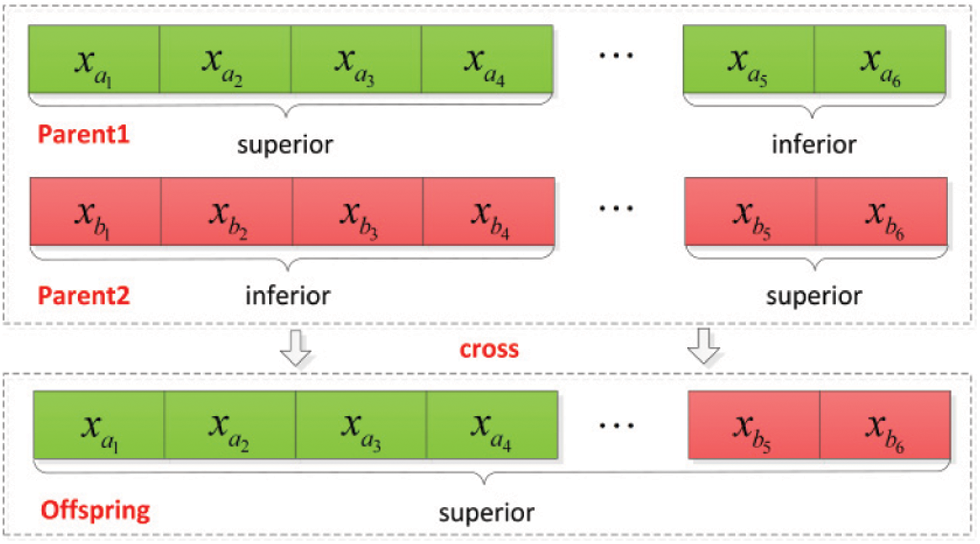
Figure 1: Genetic crossover diagram
The offspring individuals have a certain probability (variation probability VAR) to mutate in the genetic process, so the offspring individuals will further mutate to form new individuals according to Fig. 2 The probability of mutation is given, generally small, and the individual coding changes after the mutation Thereby creating new individuals.
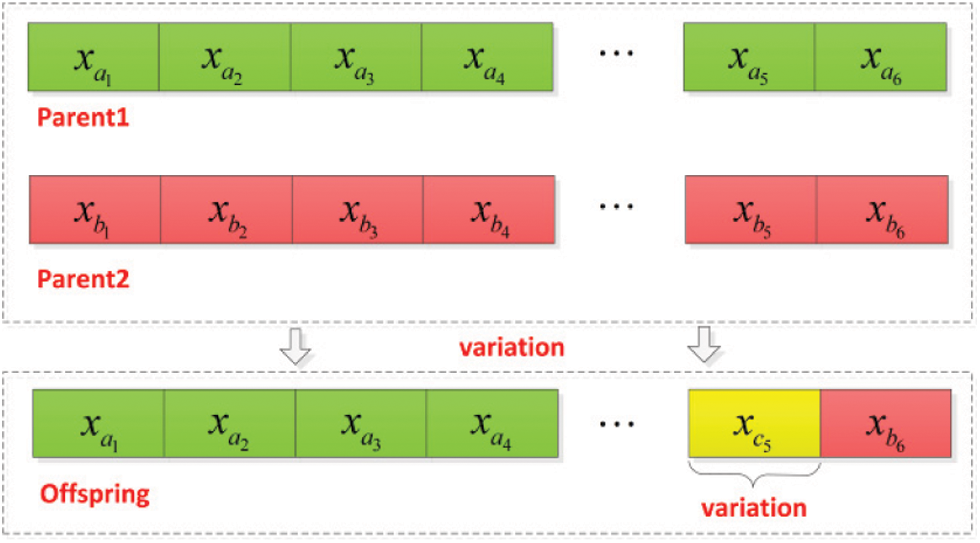
Figure 2: Genetic variation diagram
Cycles in turn until the specified number of iterations Tmax is reached, and the optimal individual and fitness value are output. The node coordinates corresponding to the optimal individual are the installation positions of the sensors.
3 HGSA-Based Vibration Monitoring Sensor Layout for Main Beam
3.1 Hoisting Machinery Modeling and Modal Analysis
Taking the single main beam hoisting machinery as the analysis object, the overall length of the main beam structure is 2000 mm, the width is 190 mm, and the height is 230 mm. The thickness of the steel plate is 6 mm. The material is Q345 steel, and the overall connection method is welding. The three-dimensional model of the hoisting machinery is shown in Fig. 3.
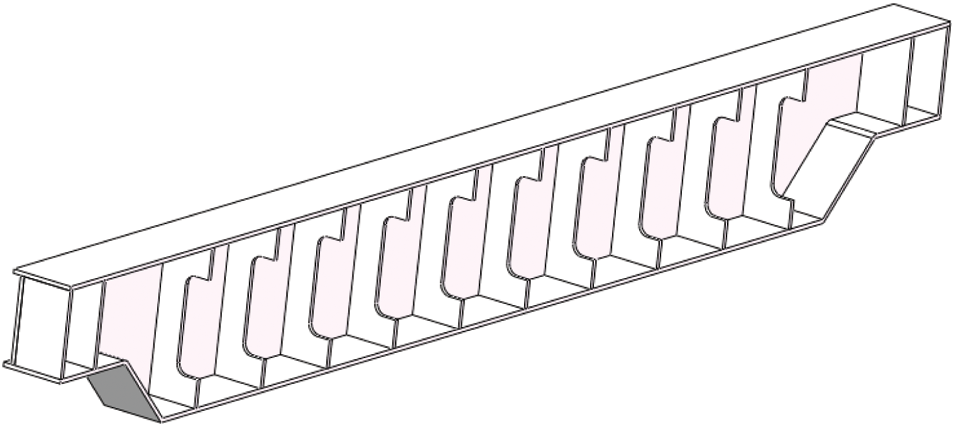
Figure 3: Three dimensional model of crane (sectional view)
The modal deformation cloud diagram of each order of the single main beam hoisting machinery is shown in Fig. 4. The frequency analysis comparison of solid and shell elements is shown in Table 1, and the displacement analysis comparison table of solid and shell elements is shown in Table 2.
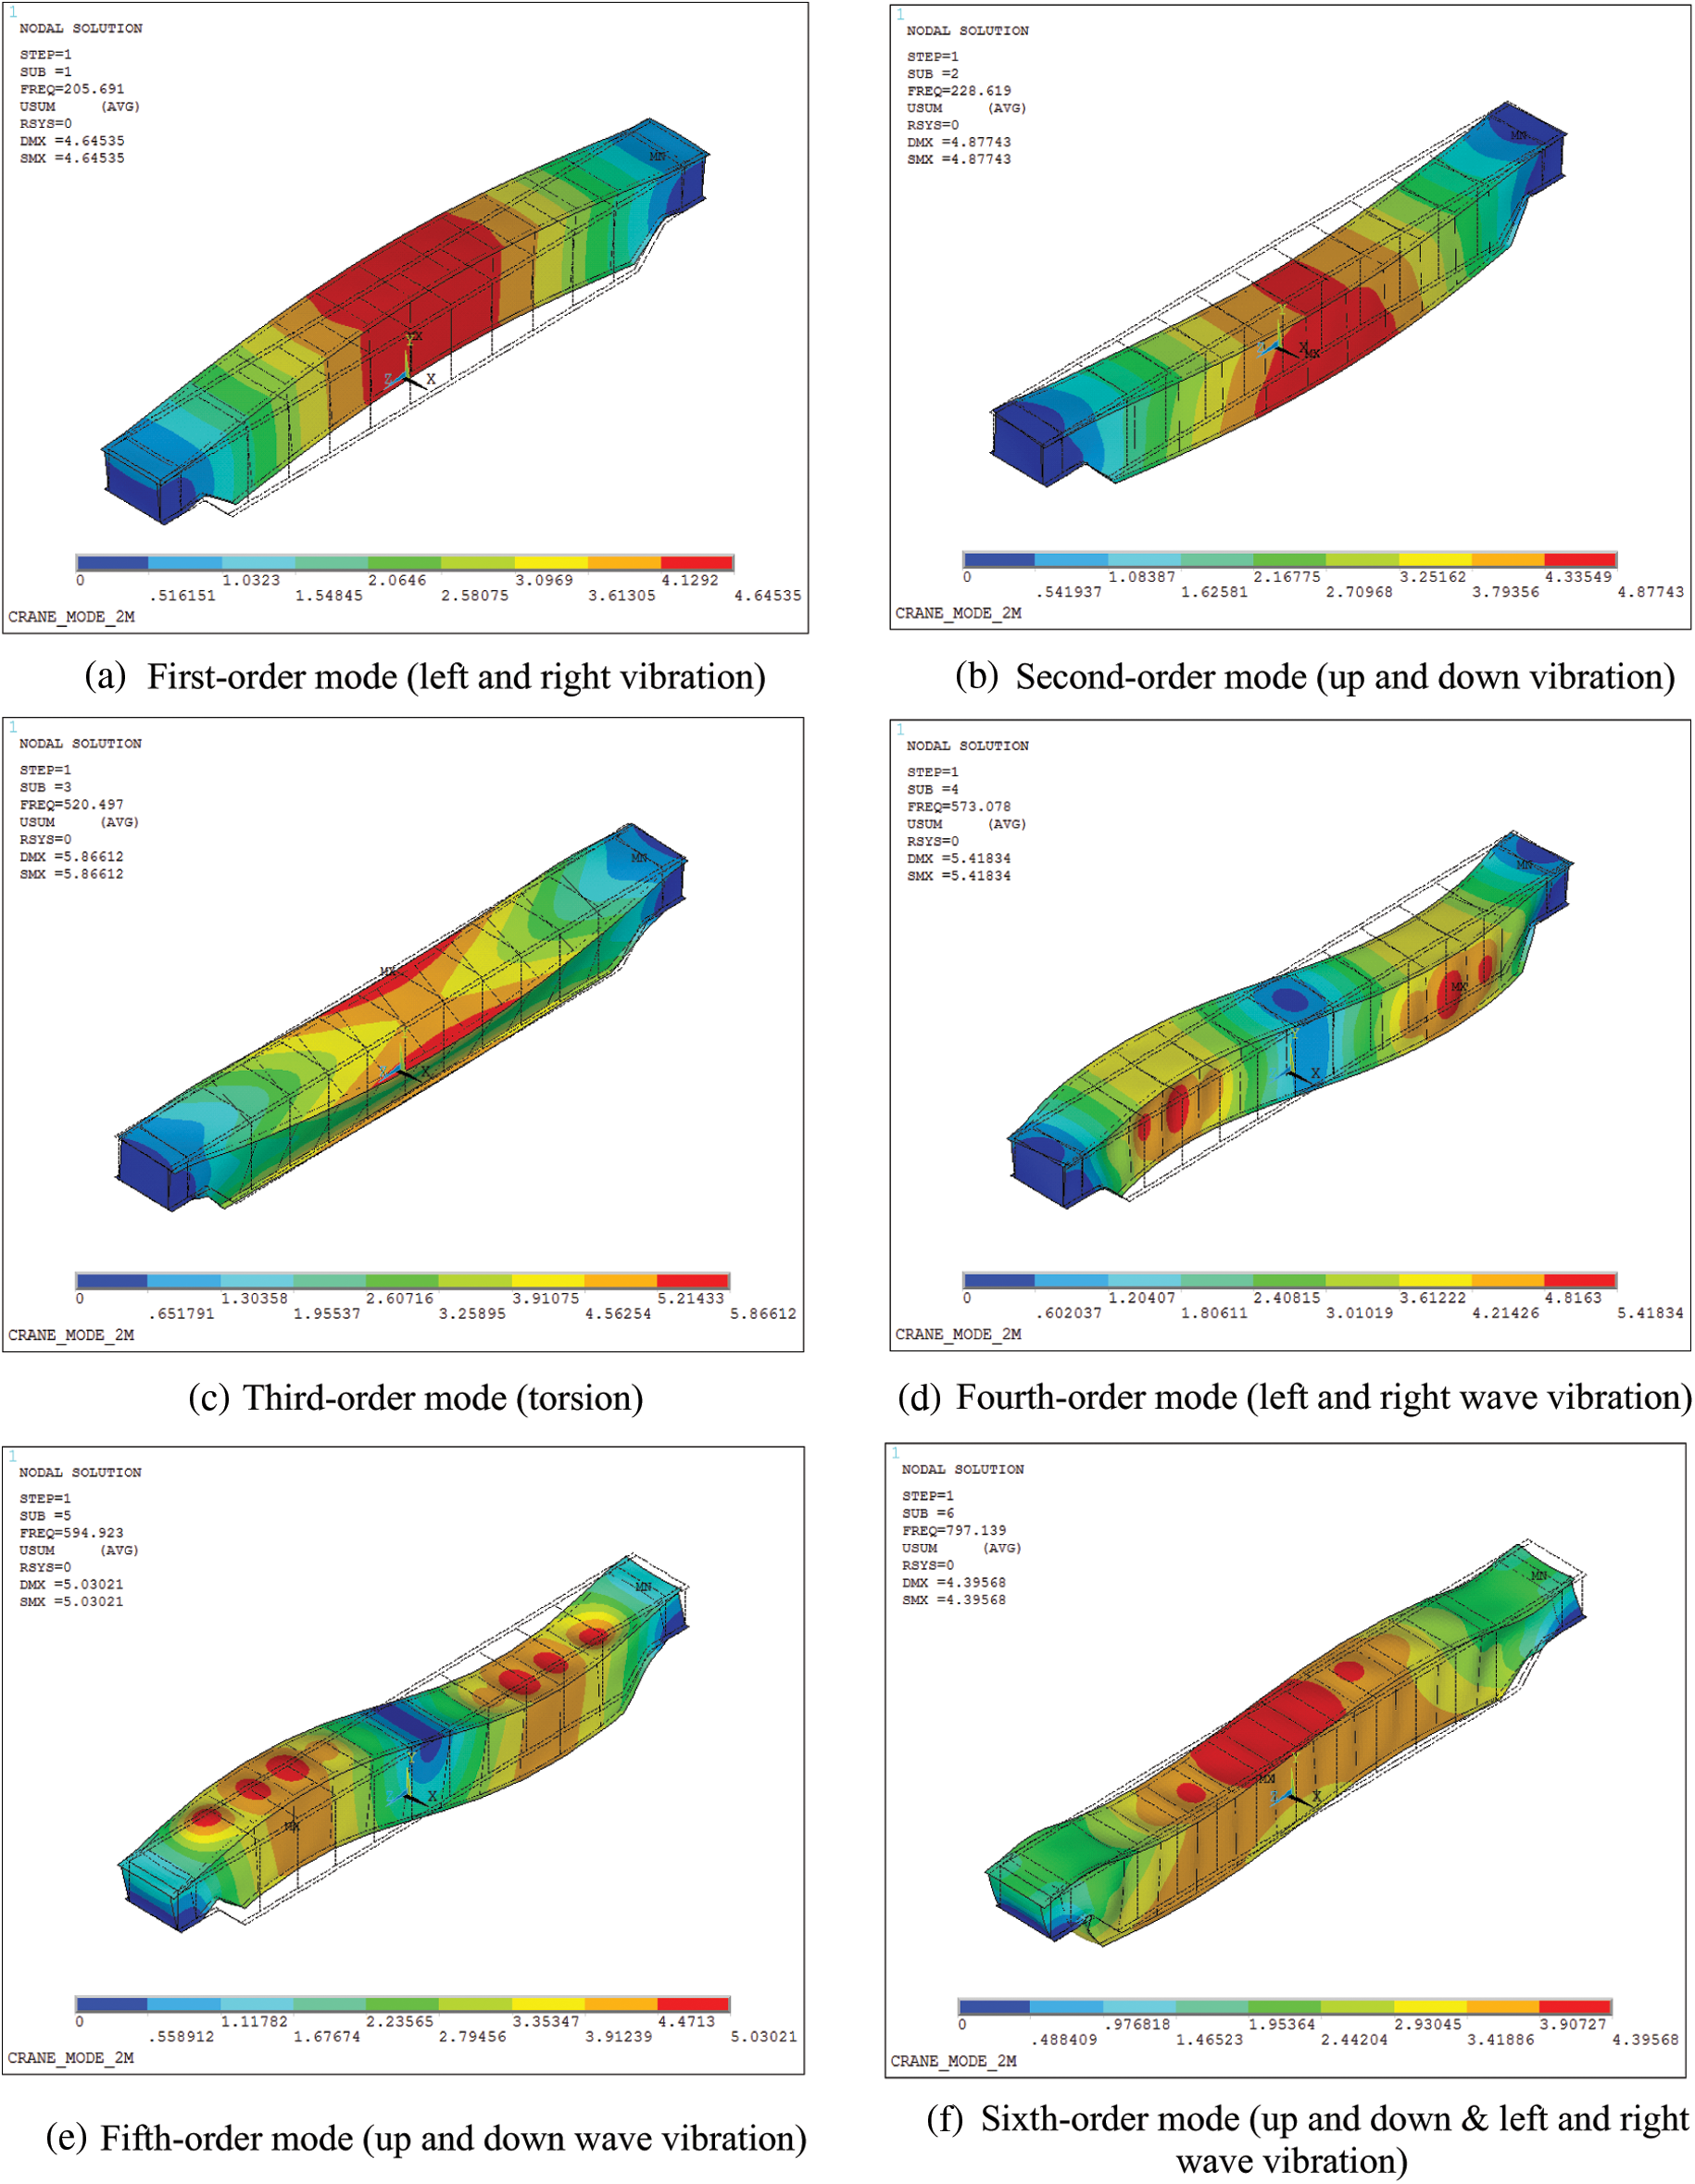
Figure 4: Modal analysis of main girder
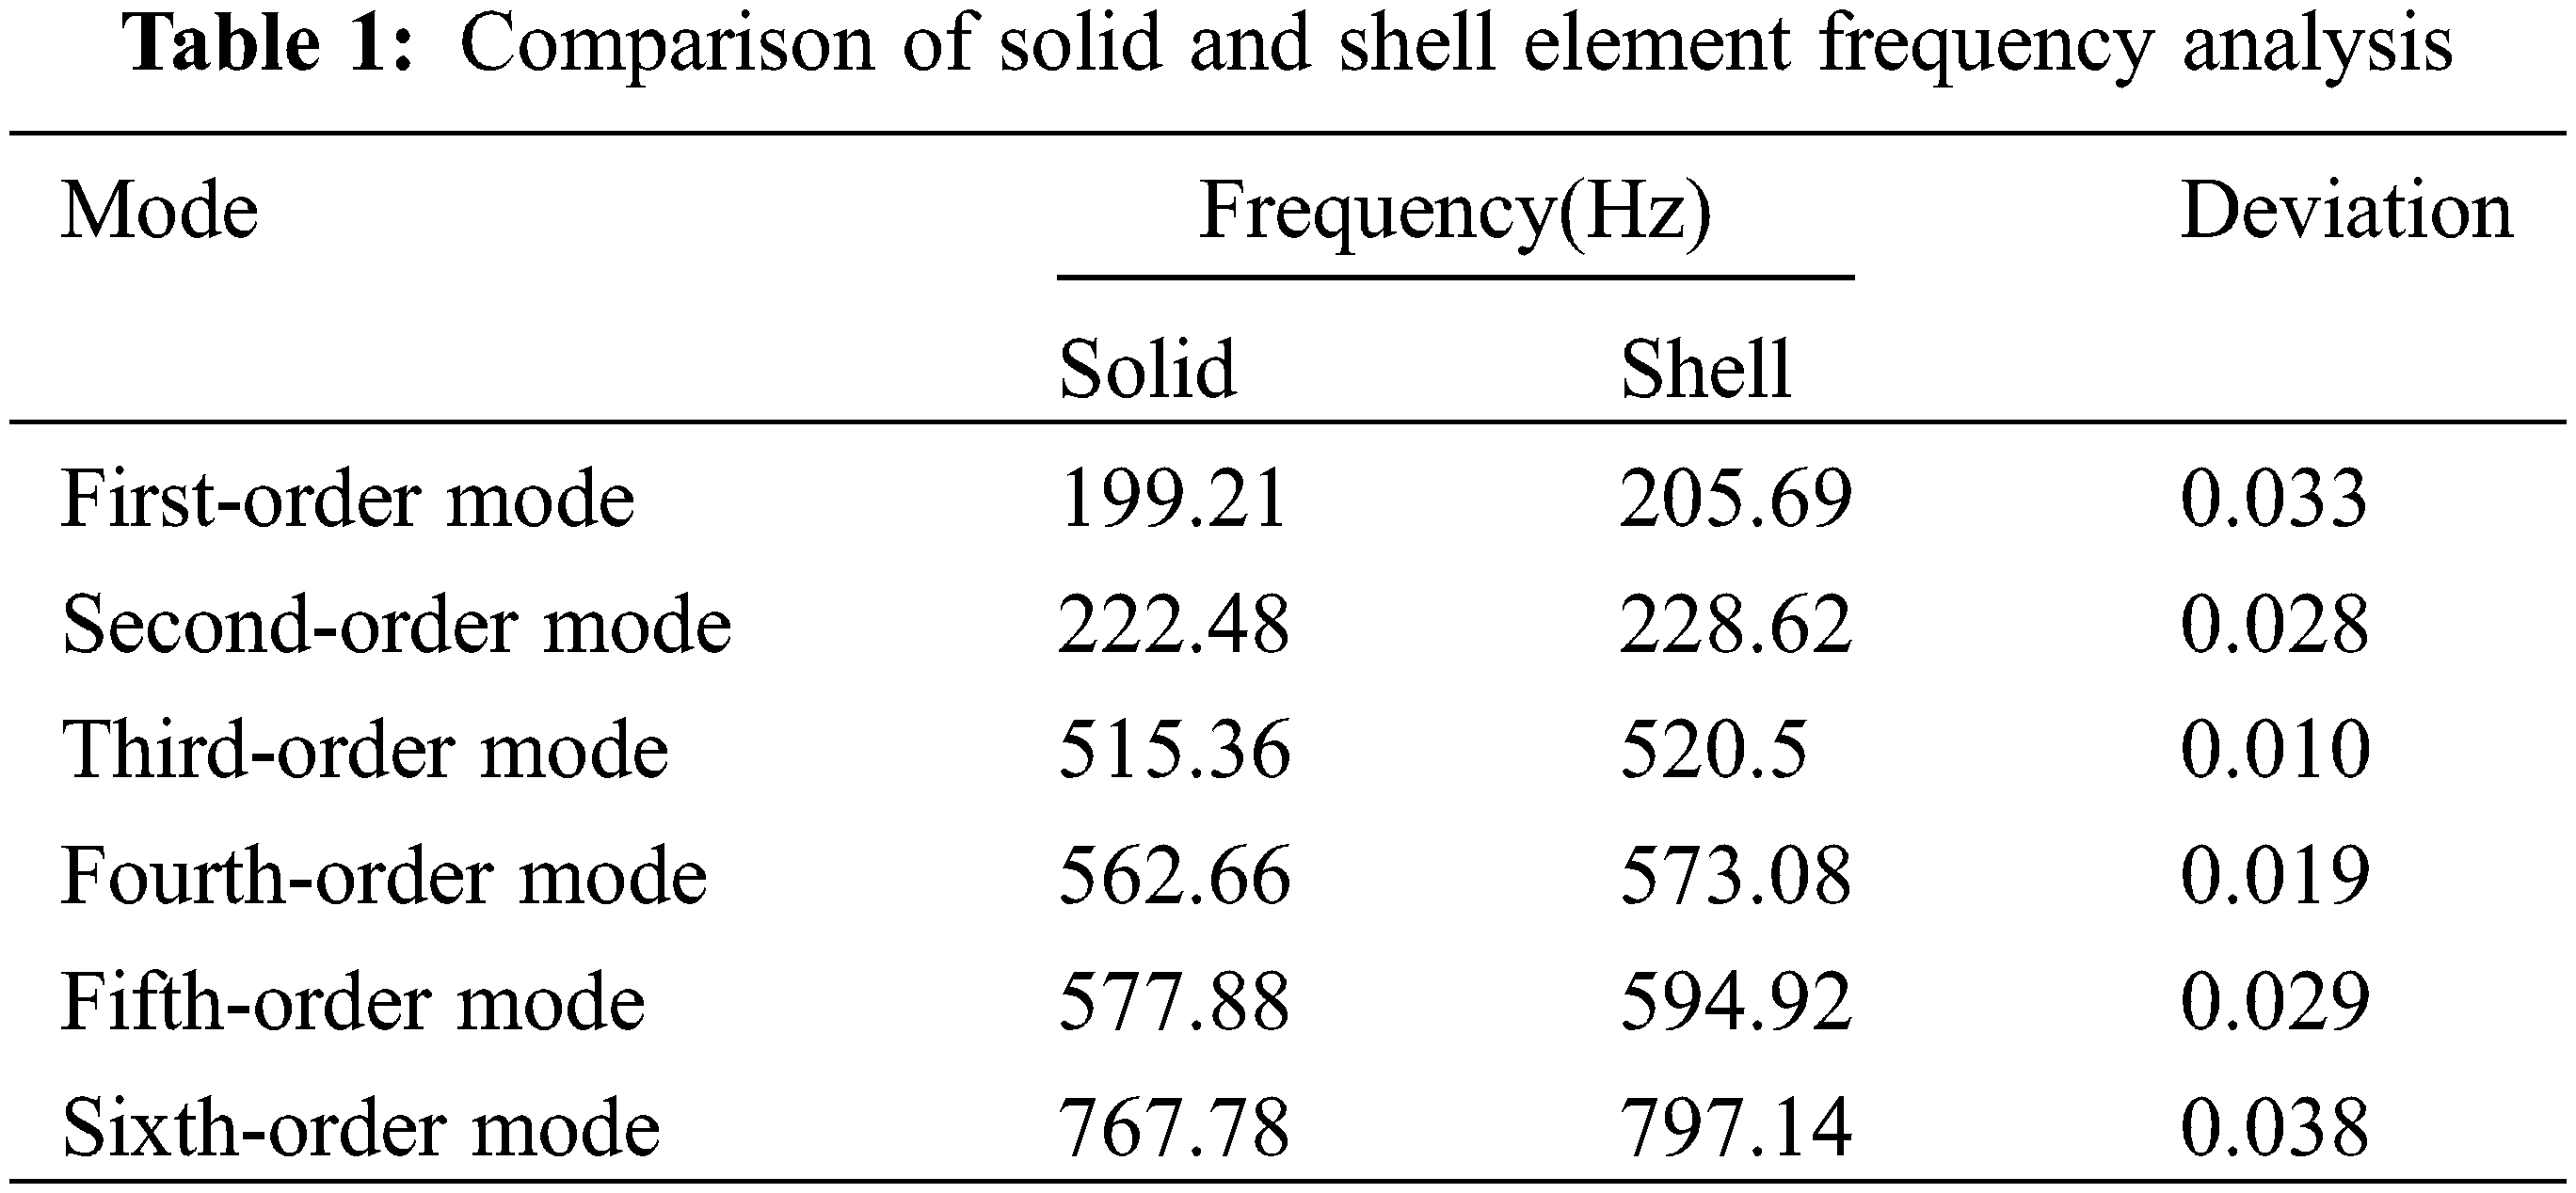
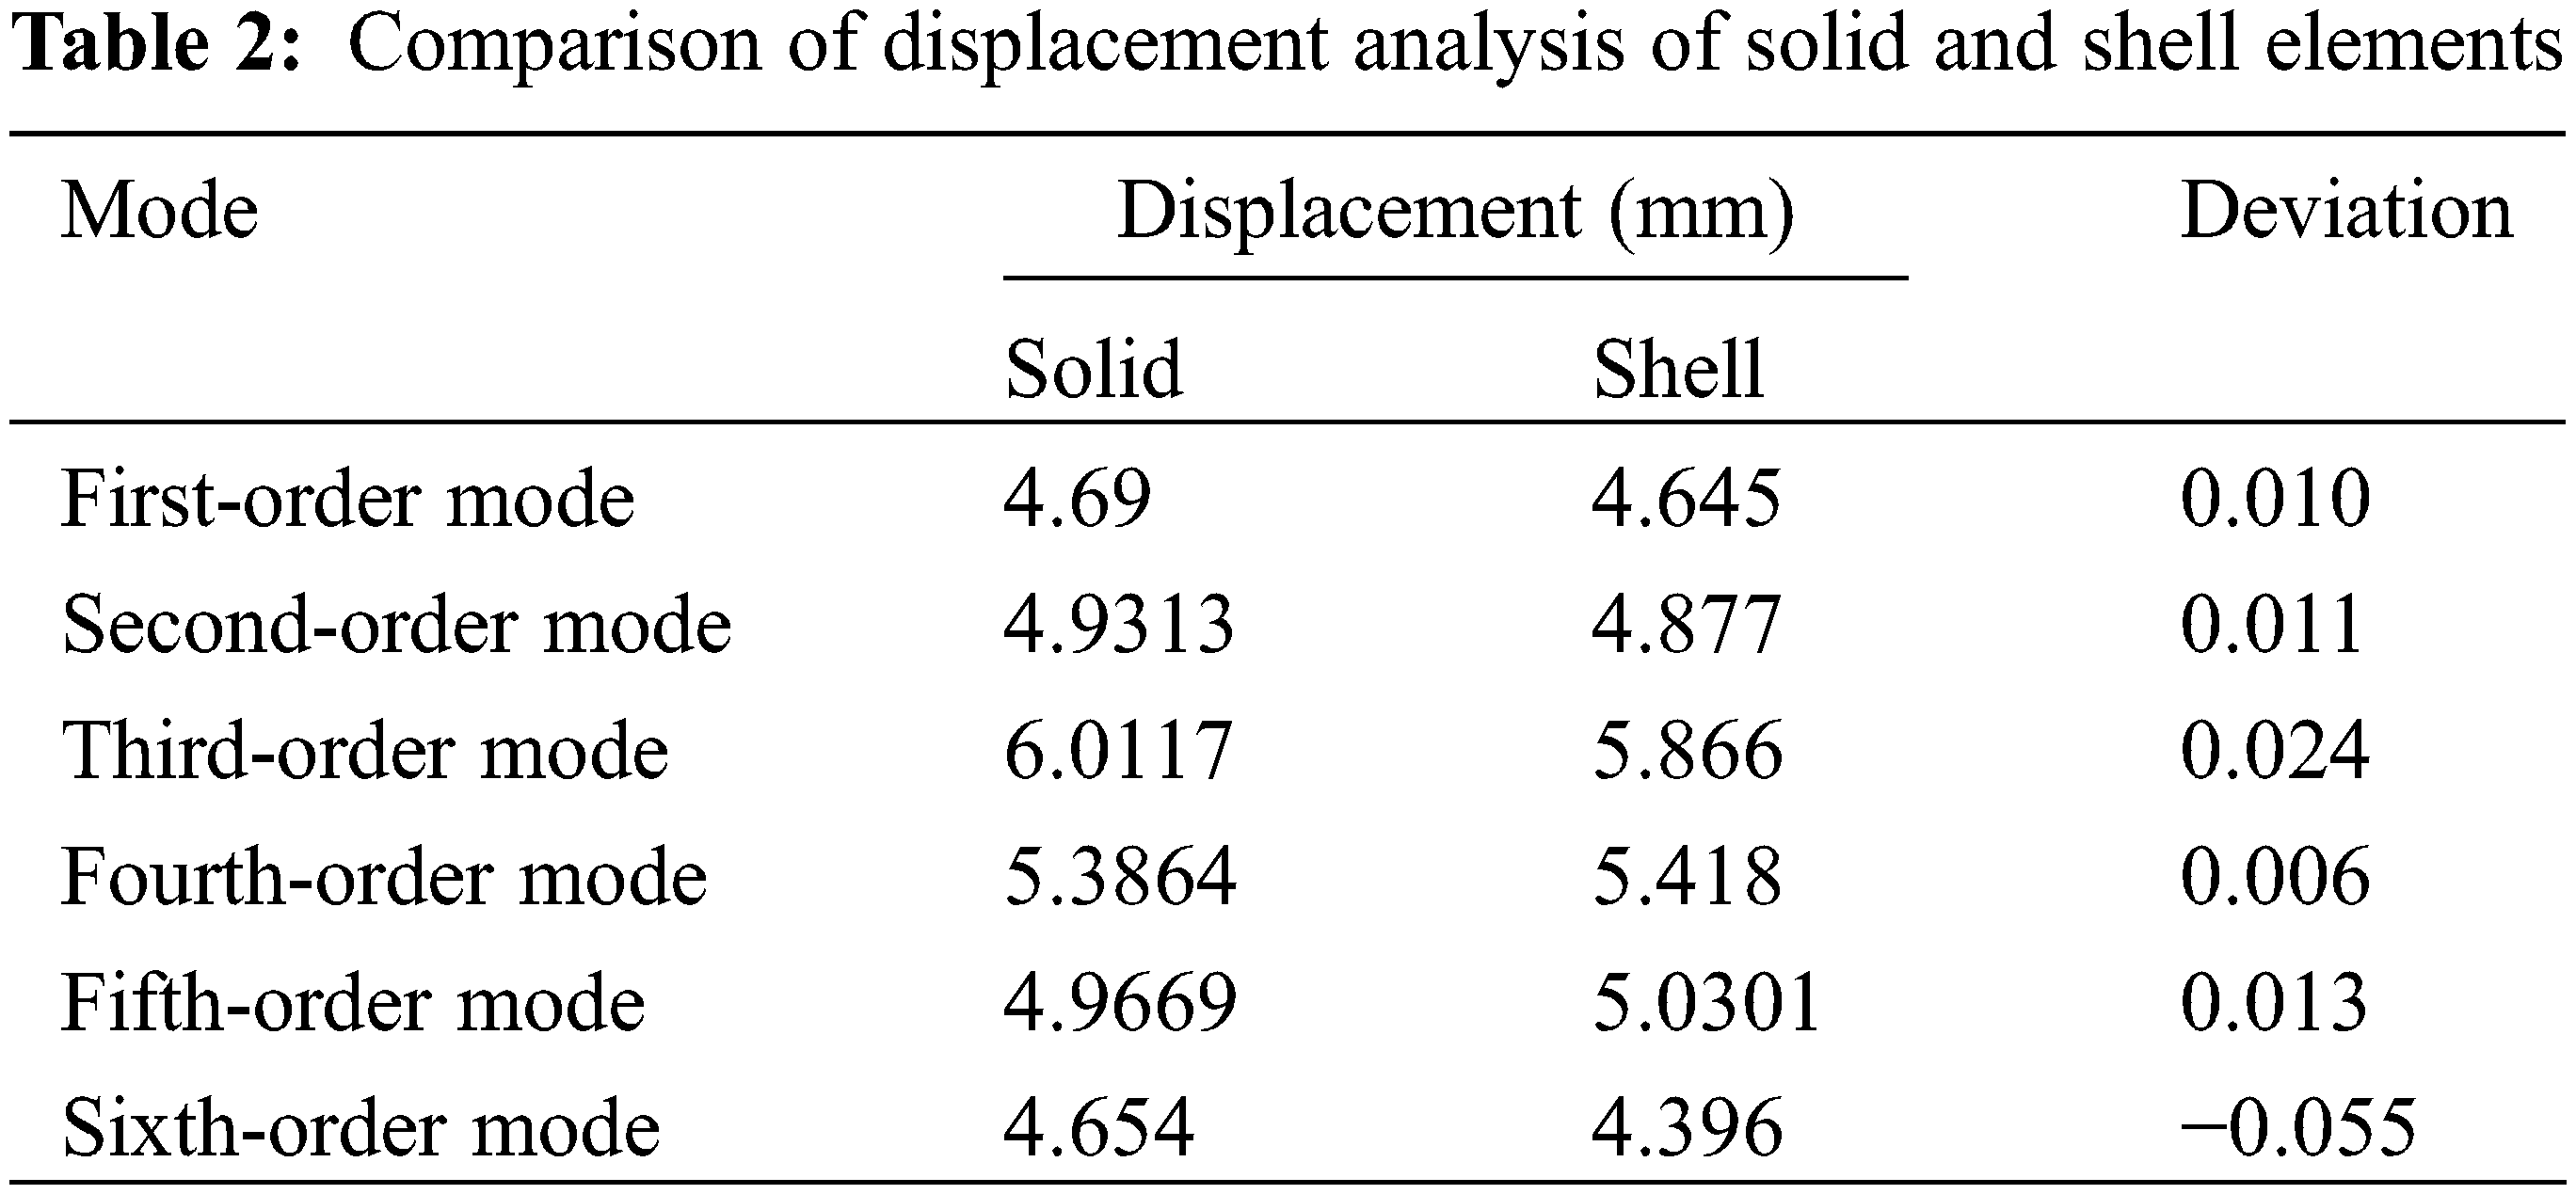
By comparing the analysis parameters of the solid model and the shell element model in Tables 1 and 2 with the analysis results, when the mesh size is set to 15 mm, the modal frequencies and modes of the first six segments obtained by the two modeling methods are basically the same, but from In terms of the number of elements and the number of nodes, the physical model has 9724 elements and 73,784 nodes; the shell element has 10,023 elements and 9880 nodes. The sensor decision analysis matrix is the modal matrix of each order of the node. Under the condition of ensuring the accuracy of the analysis result, the shell element has a smaller modal matrix dimension than the solid element, which is conducive to the calculation of the modal matrix in the sensor placement decision. In addition, the node combination obtained in the subsequent analysis of the solid element model may contain the internal nodes of the element, and the internal nodes cannot be installed in the actual project. Therefore, the subsequent comparative analysis uses the modal matrix obtained from the shell element analysis.
3.2 Selection of Initial Parameters
Harmony genetic algorithm selection probability HMCR, pitch fine-tuning probability PAR, mutation rate VAR, hybridization rate CRO and other initialization parameters are very important to the search algorithm to obtain a reasonable optimal solution and search efficiency. Different initial parameters will directly affect The size and convergence speed of the optimal solution for fitness. Therefore, before using the harmony genetic algorithm, the initialization parameters are compared. The comparative analysis result of HMCR and PAR is shown in Fig. 5 below, and the comparison analysis result of VAR and CRO is shown in Fig. 6 below.
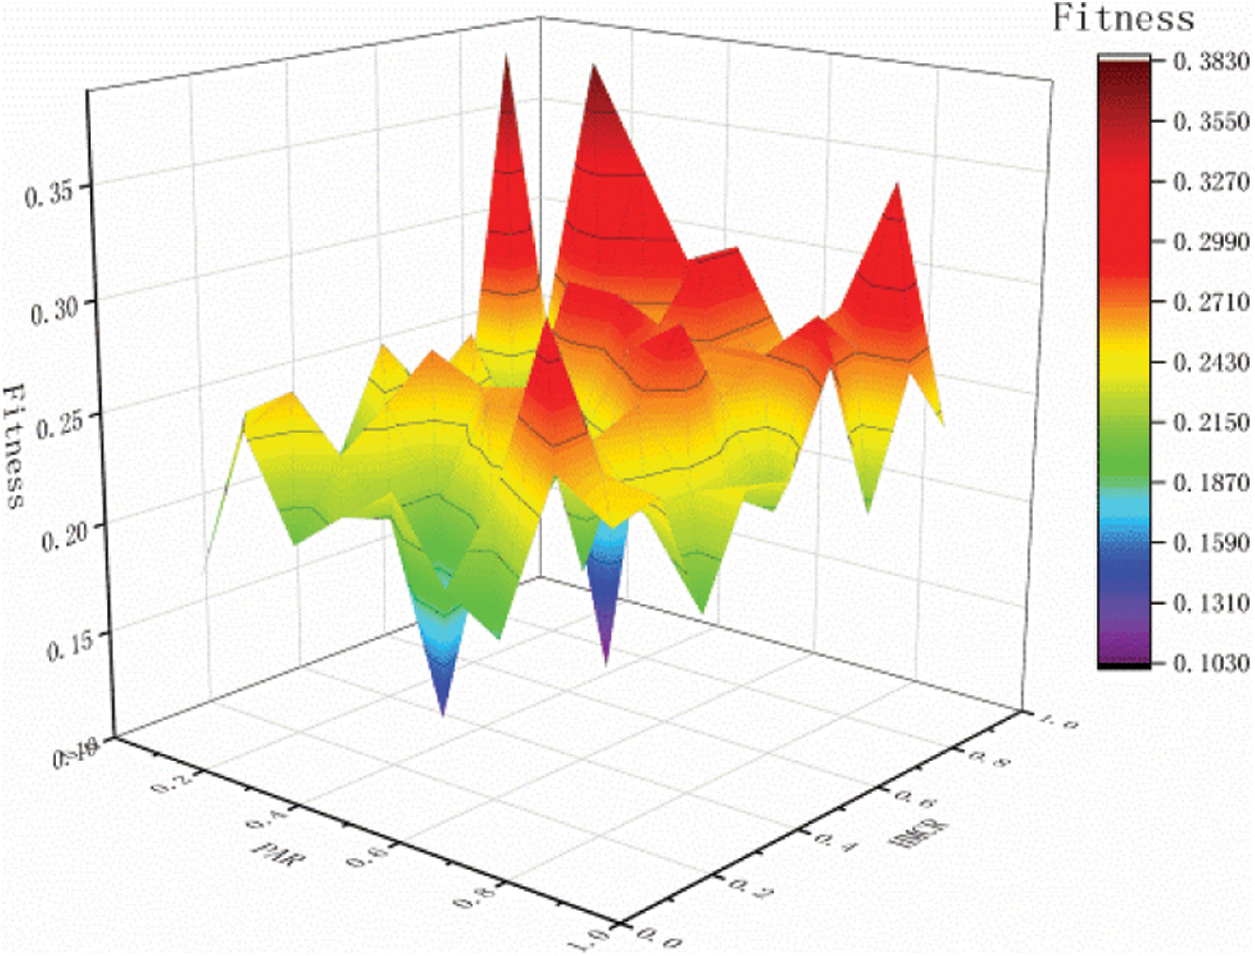
Figure 5: Comparative analysis of HMCR and PAR
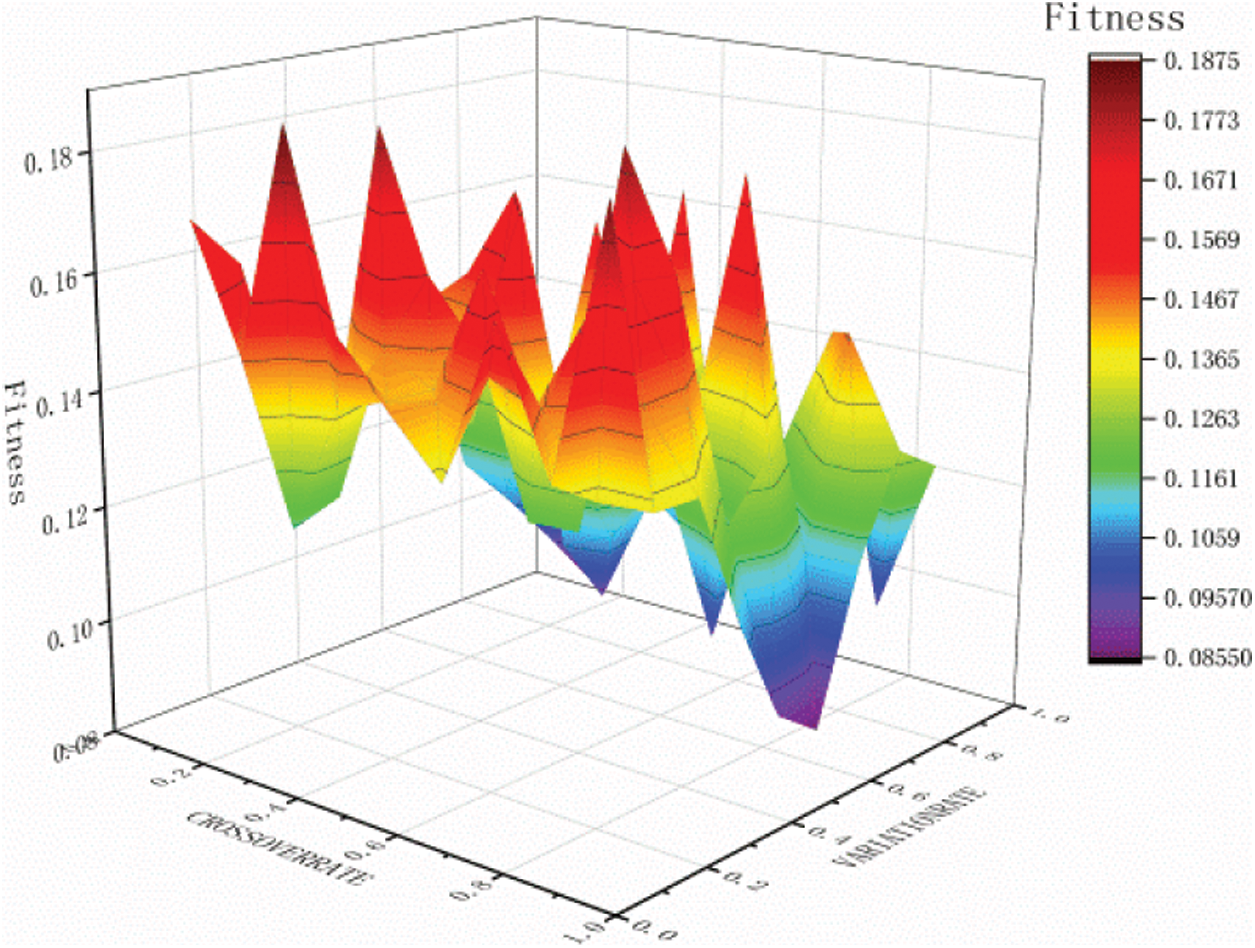
Figure 6: Comparative analysis of VAR and CRO
Based on the comparative analysis of Fig. 5 it can be seen that when the initial value of HMCR is 0.7 and the initial value of PAR is 0.4, the optimal value of fitness is 0.1034. Therefore, the initial values of the parameters in the subsequent analysis are determined as HMCR = 0.7 and PAR = 0.4.
Based on the comparative analysis in Fig. 6, it can be seen that when the VAR value is 0.6 and the CRO value is 0.9, the fitness is optimal, and the optimal value is 0.0860. Therefore, the initial values of the parameters in the subsequent analysis are determined as VAR = 0.6 and CRO = 0.9.
Through optimization and comparison, the final selection of initial parameters HMCR is 0.7, PAR is 0.4, CRO is 0.9, and VAR is 0.6.
3.3 Application Comparison of Sensor Layout Methods
The first 6 modes of the main girder structure of the hoisting machinery are isolated and the sensor placement of each mode has no effect on the observation of other modes, so the number of sensors is 6 [38]. In response to the requirements of single-beam crane structure vibration monitoring, 6 sensors are arranged in the X, Y and Z directions, and the main beam model is extracted for modal analysis and the displacement of each node to establish a modal matrix. HGSA, harmony search algorithm, and genetic algorithm are respectively used to analyze the sensor placement. The measuring points of each algorithm are shown in Fig. 7.
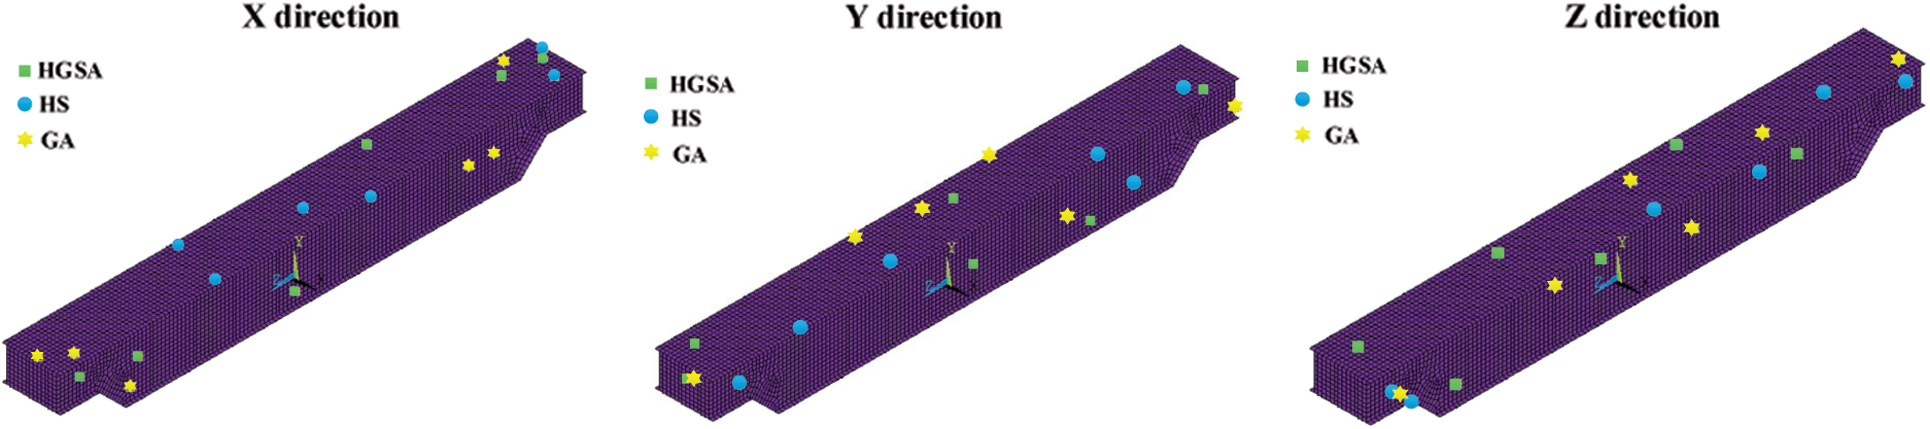
Figure 7: Layout diagram of main beam in all directions
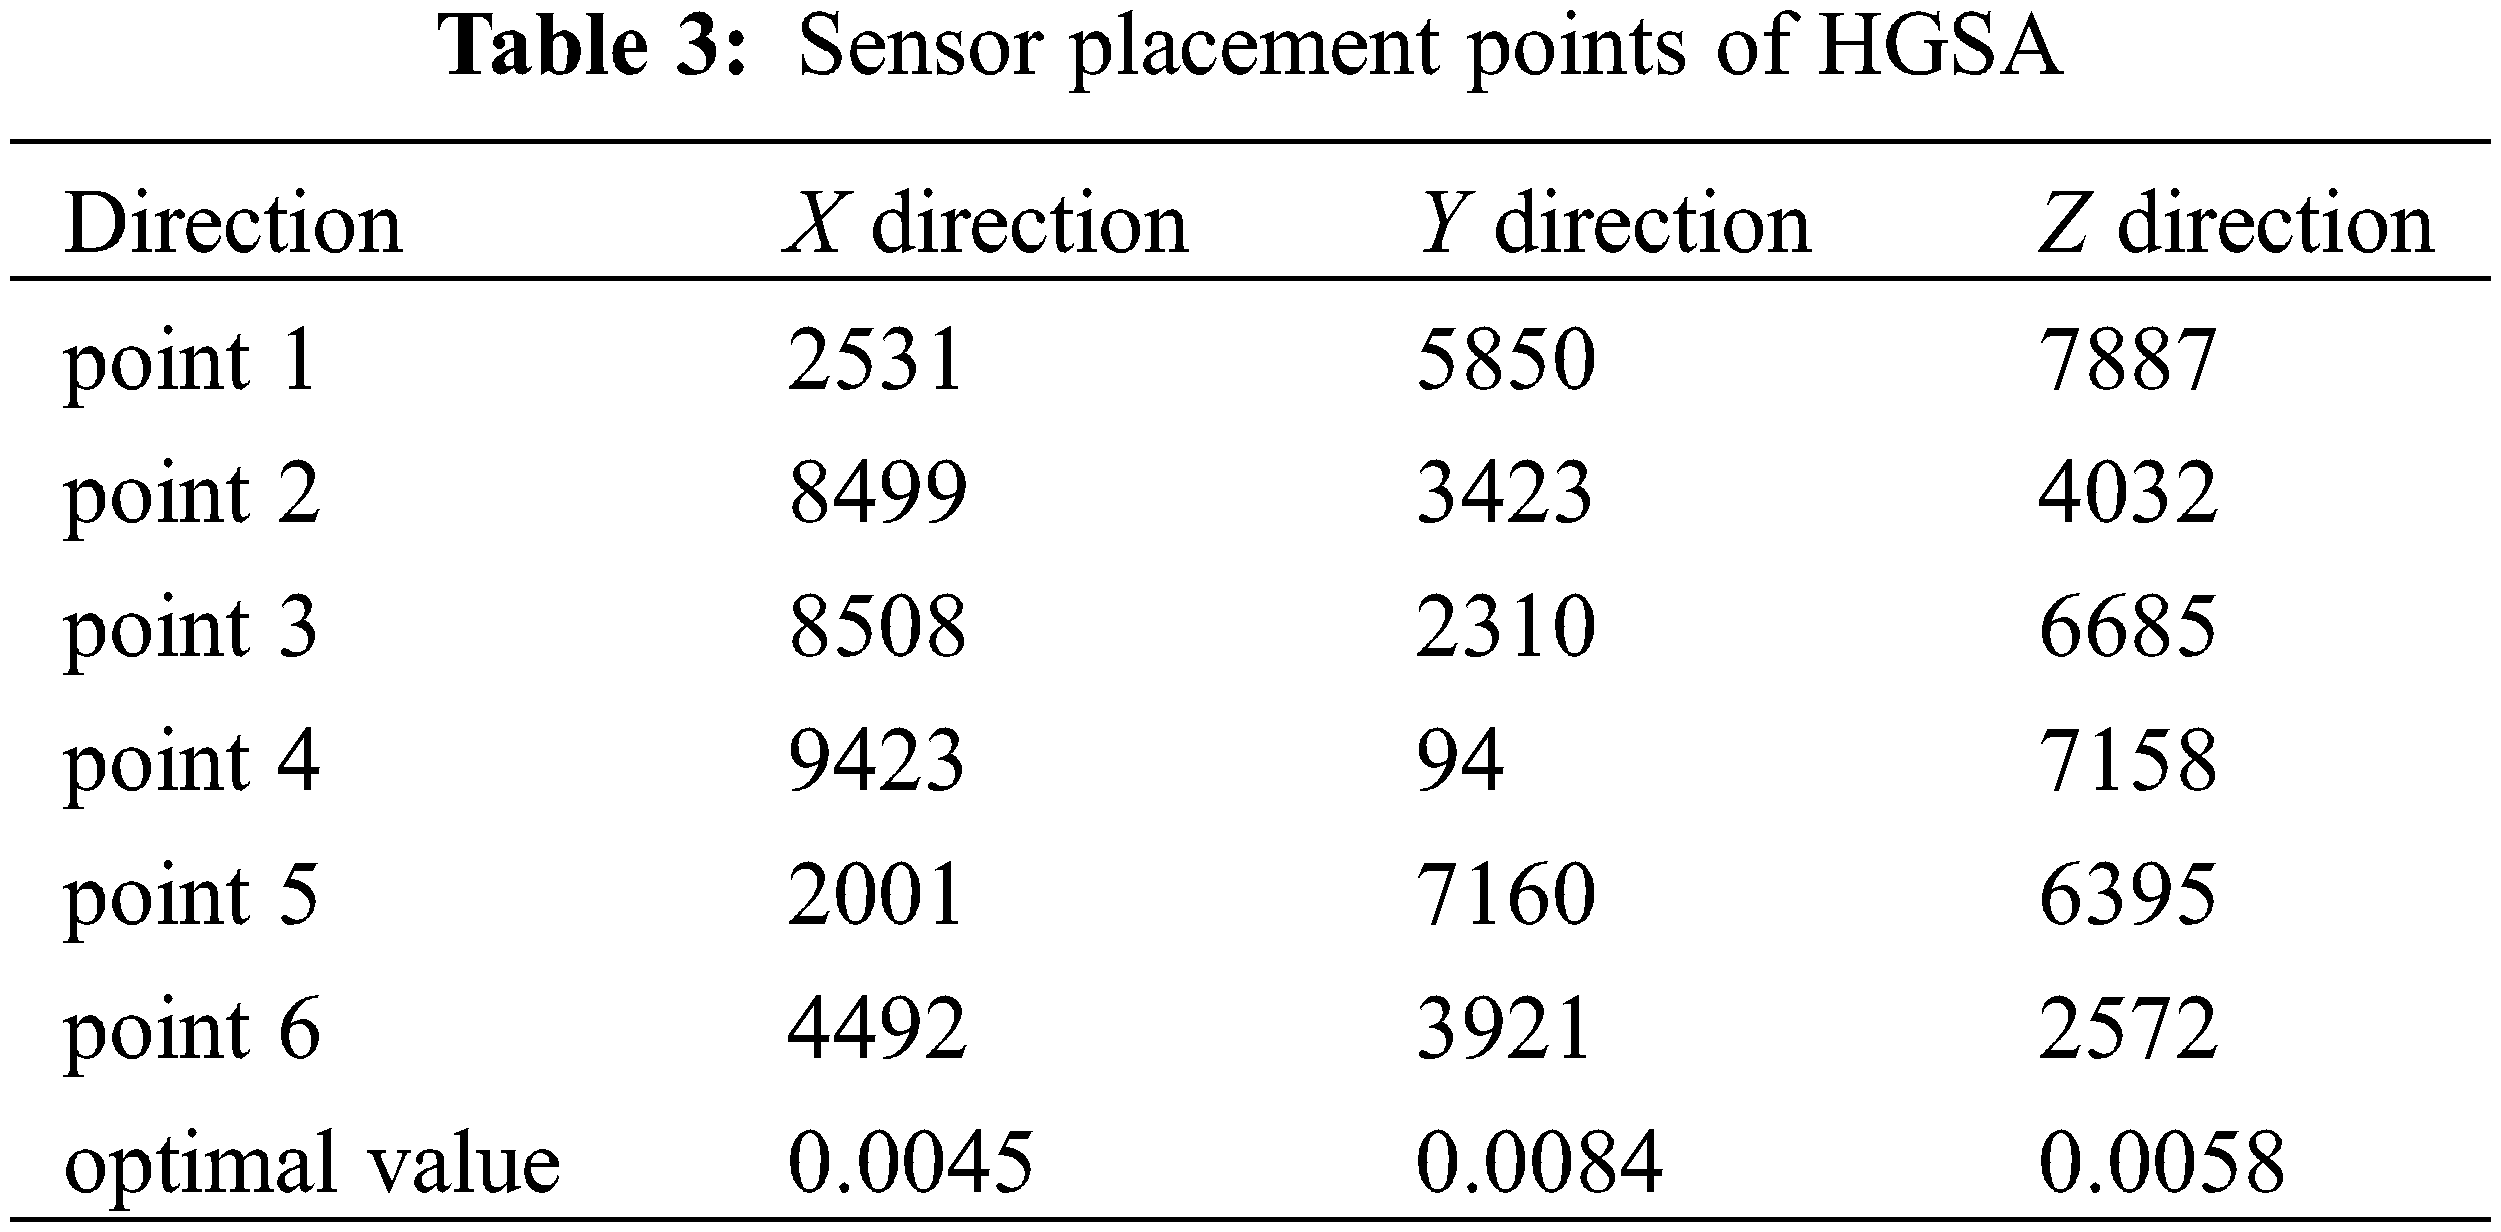
Using the HGSA algorithm, there are 6 sensors, HMCR of 0.7, PAR of 0.4, CRO of 0.9, VAR of 0.6, and 3000 search iterations in the X, Y, and Z directions of the main beam. The optimal fitness values in the X, Y, and Z directions are 0.0045, 0.0084, and 0.0058, respectively. The convergence curves in the X, Y, and Z directions calculated by the HGSA algorithm are shown in Fig. 8, and the placement points are shown in Table 3.
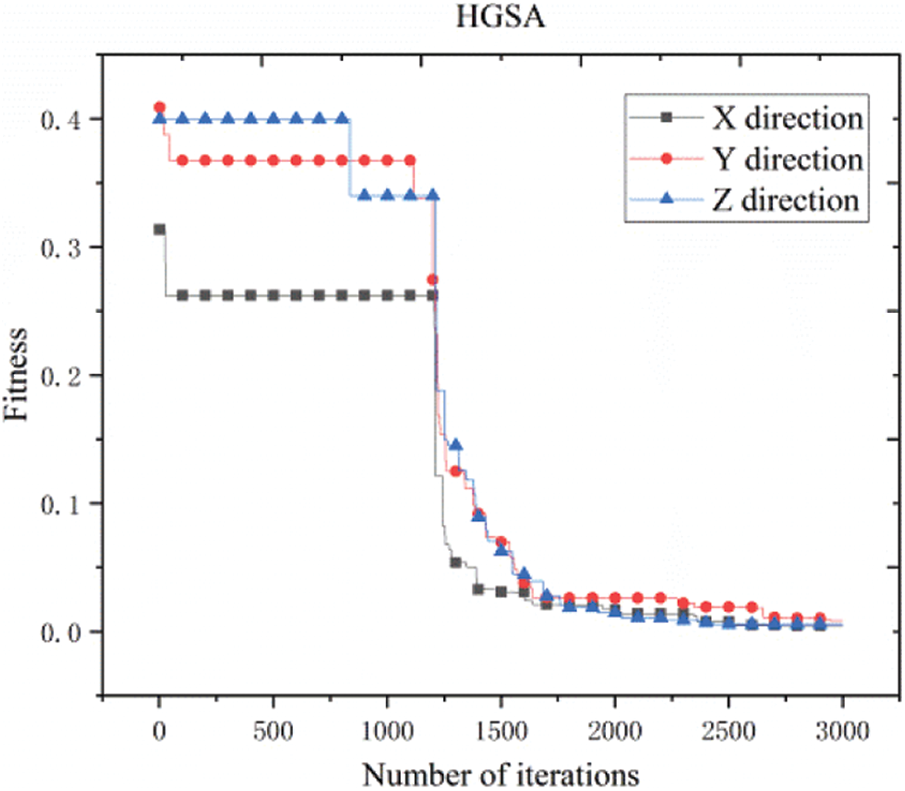
Figure 8: Convergence curve of HGSA
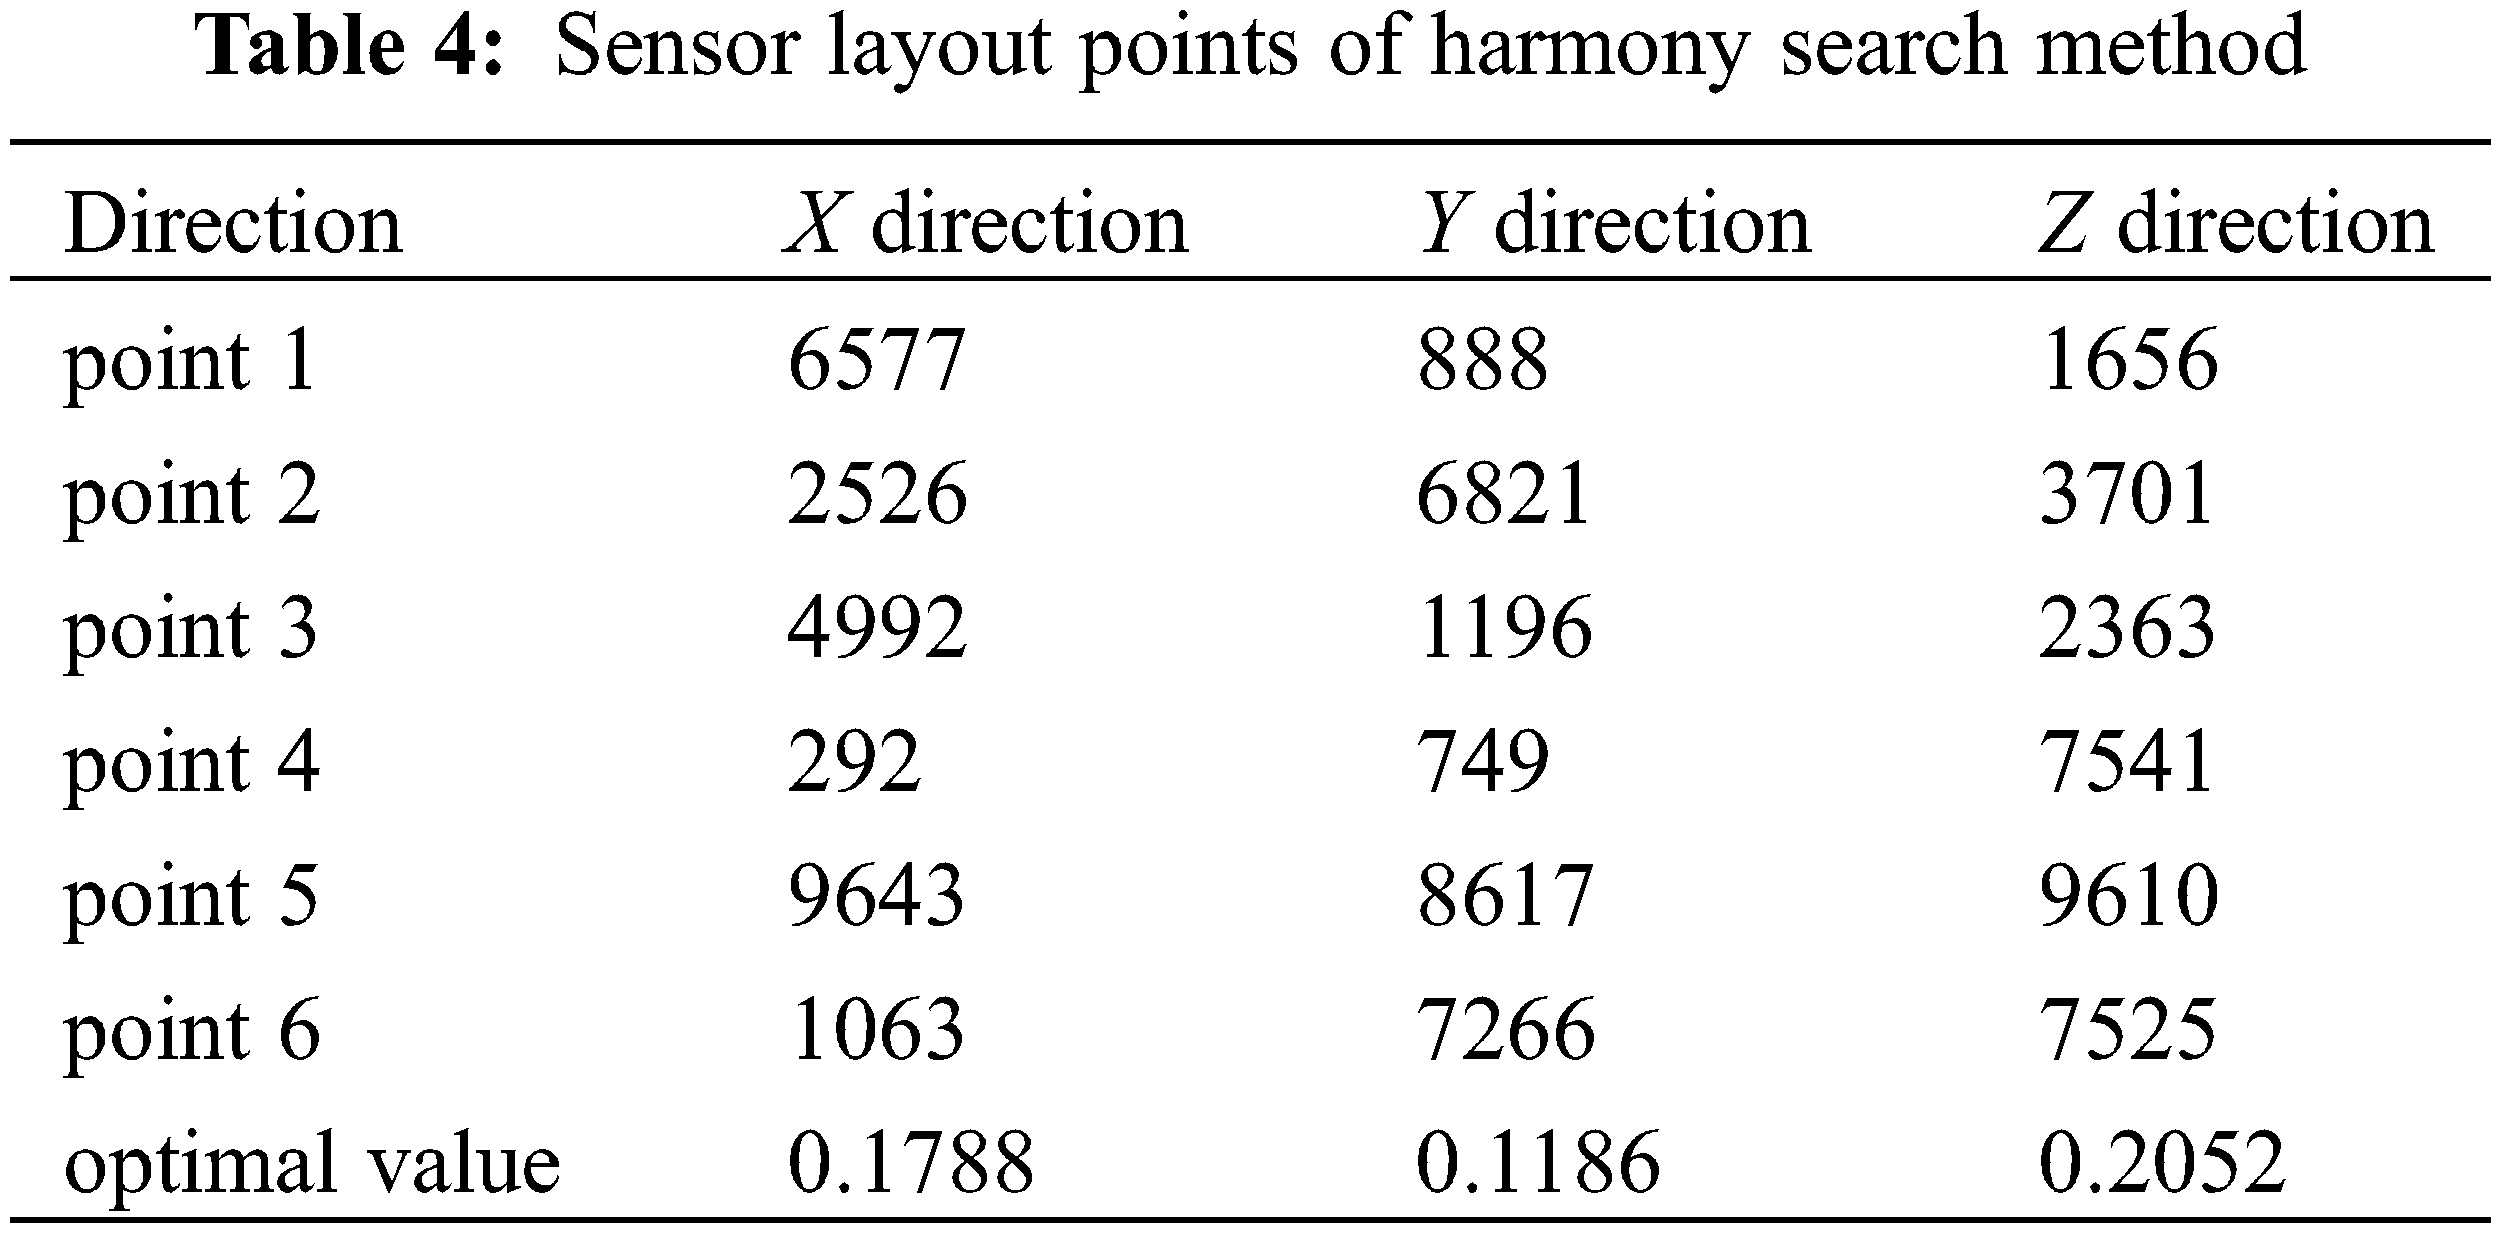
Using the HS algorithm, the number of sensors is 6, the initial harmony memory is 30, the HMCR is 0.7, and the PAR is 0.4. The main beam X, Y, and Z directions are searched for 3000 iterations. The optimal fitness values in the X, Y, and Z directions are 0.1788, 0.1186, and 0.2052, respectively. The convergence curves in the X, Y, and Z directions calculated by the HS algorithm are shown in Fig. 9, and the placement points are shown in Table 4.
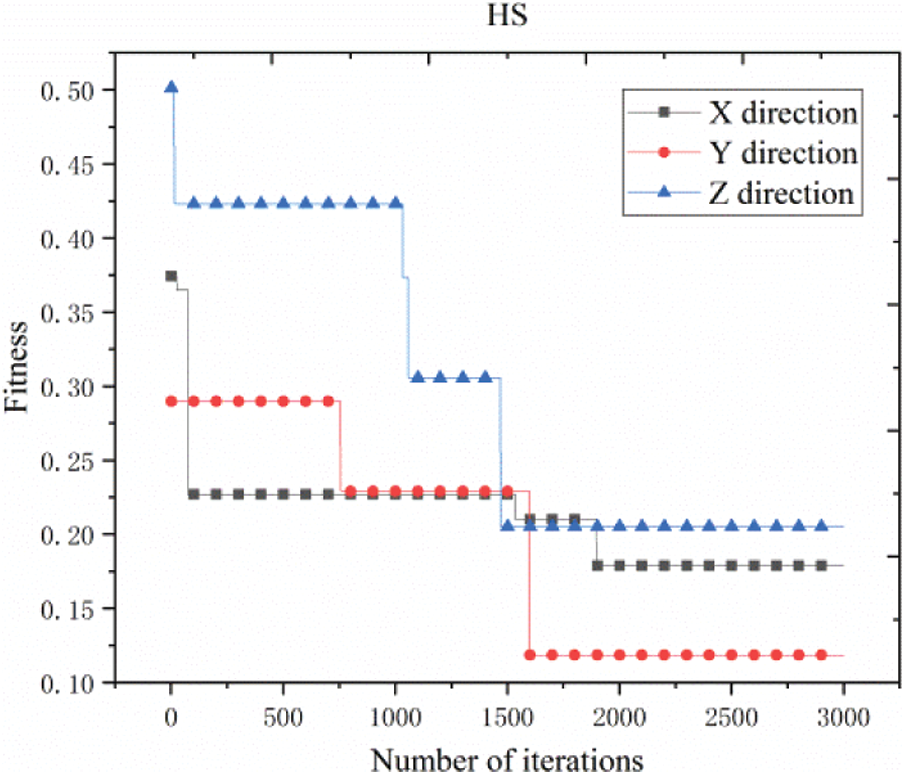
Figure 9: Convergence curve of harmony search method
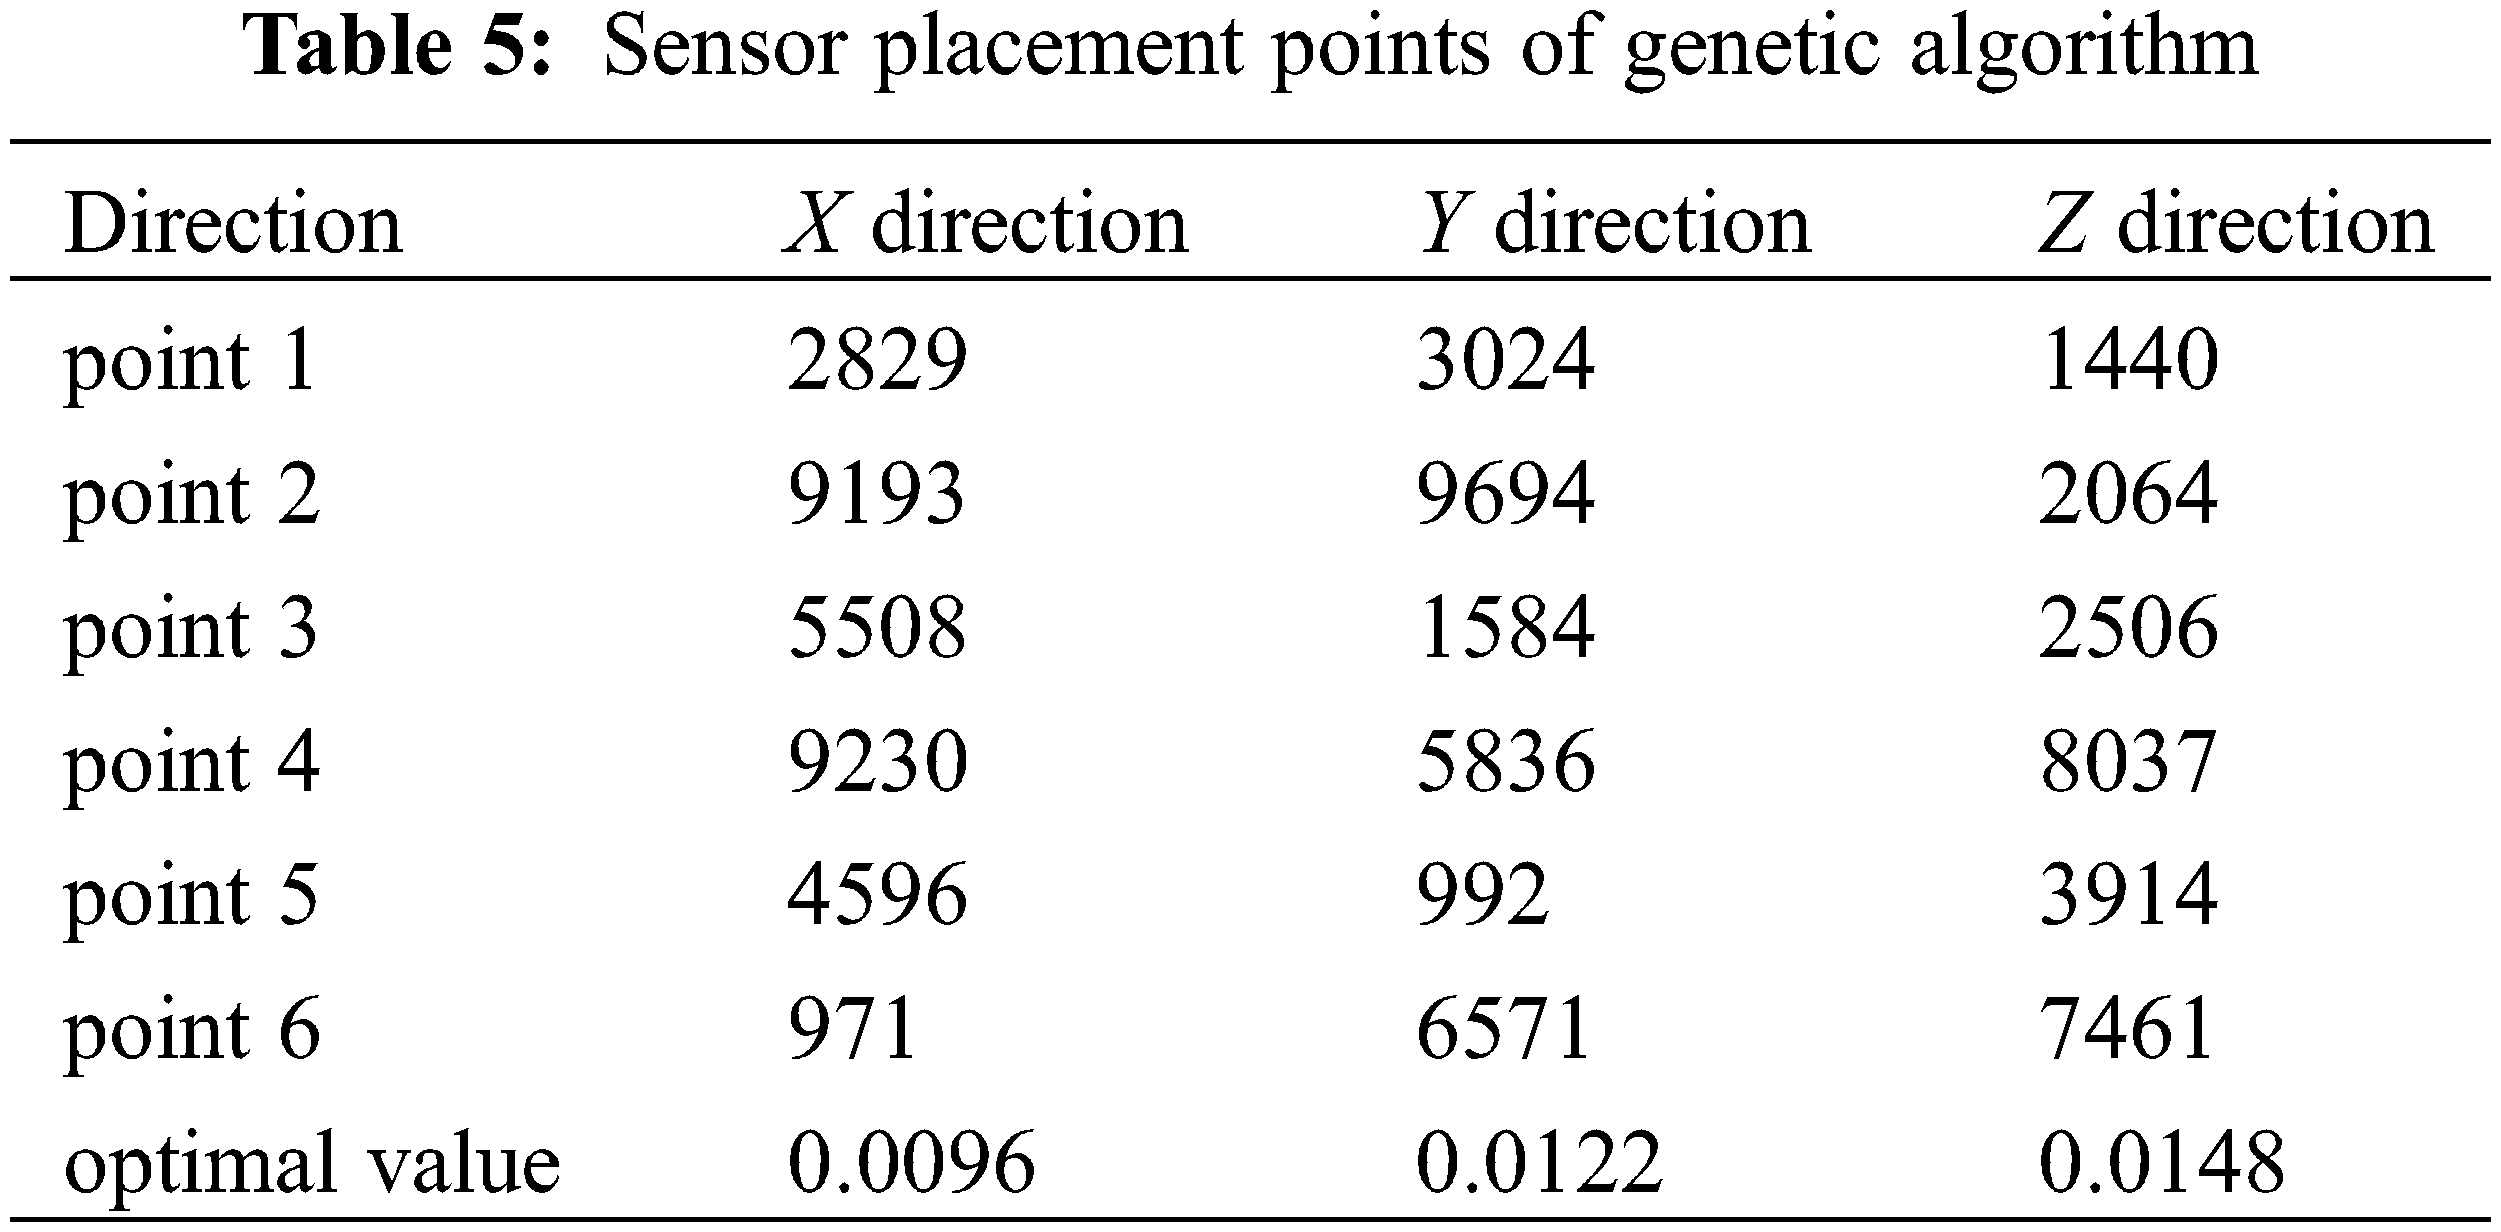
Using GA algorithm, there are 6 sensors, CRO is 0.9, VAR is 0.6, and 3000 search iterations are performed on the X, Y, and Z directions of the main beam. The optimal fitness values in the X, Y, and Z directions are 0.0096, 0.0122, and 0.0148, respectively. The convergence curves in the X, Y, and Z directions calculated by the GA algorithm are shown in Fig. 10, and the layout points are shown in Table 5.
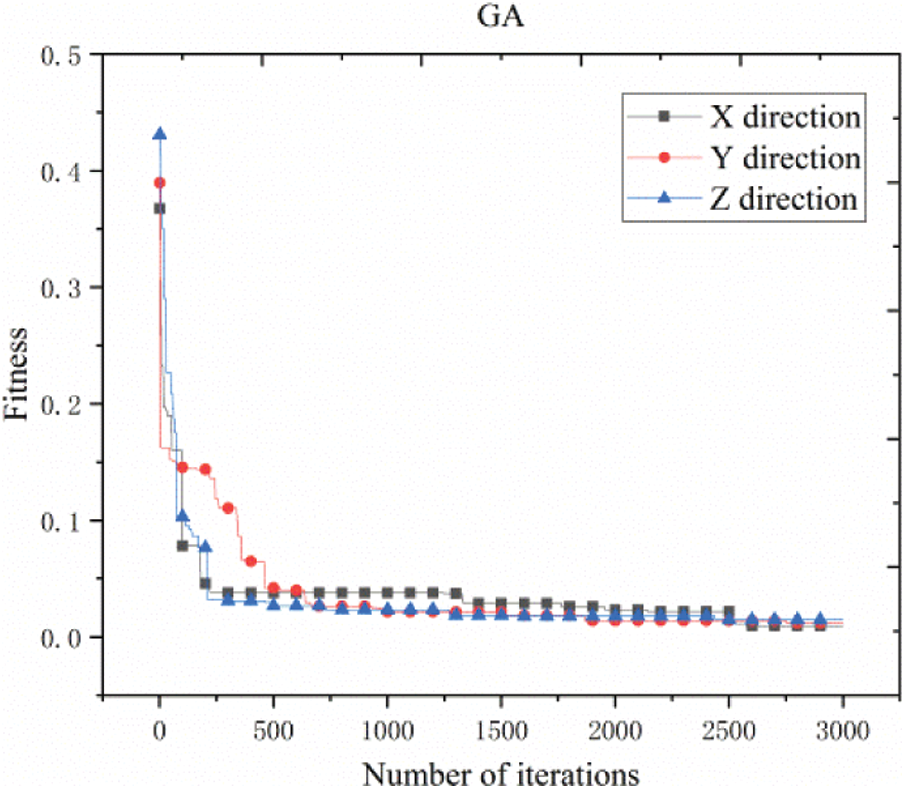
Figure 10: Convergence curve of genetic algorithm
For single girder hoisting machinery, the HGSA algorithm, HS algorithm and GA algorithm are used to search for sensor placement. The analysis and convergence of the three algorithms is shown in Fig. 11 below.
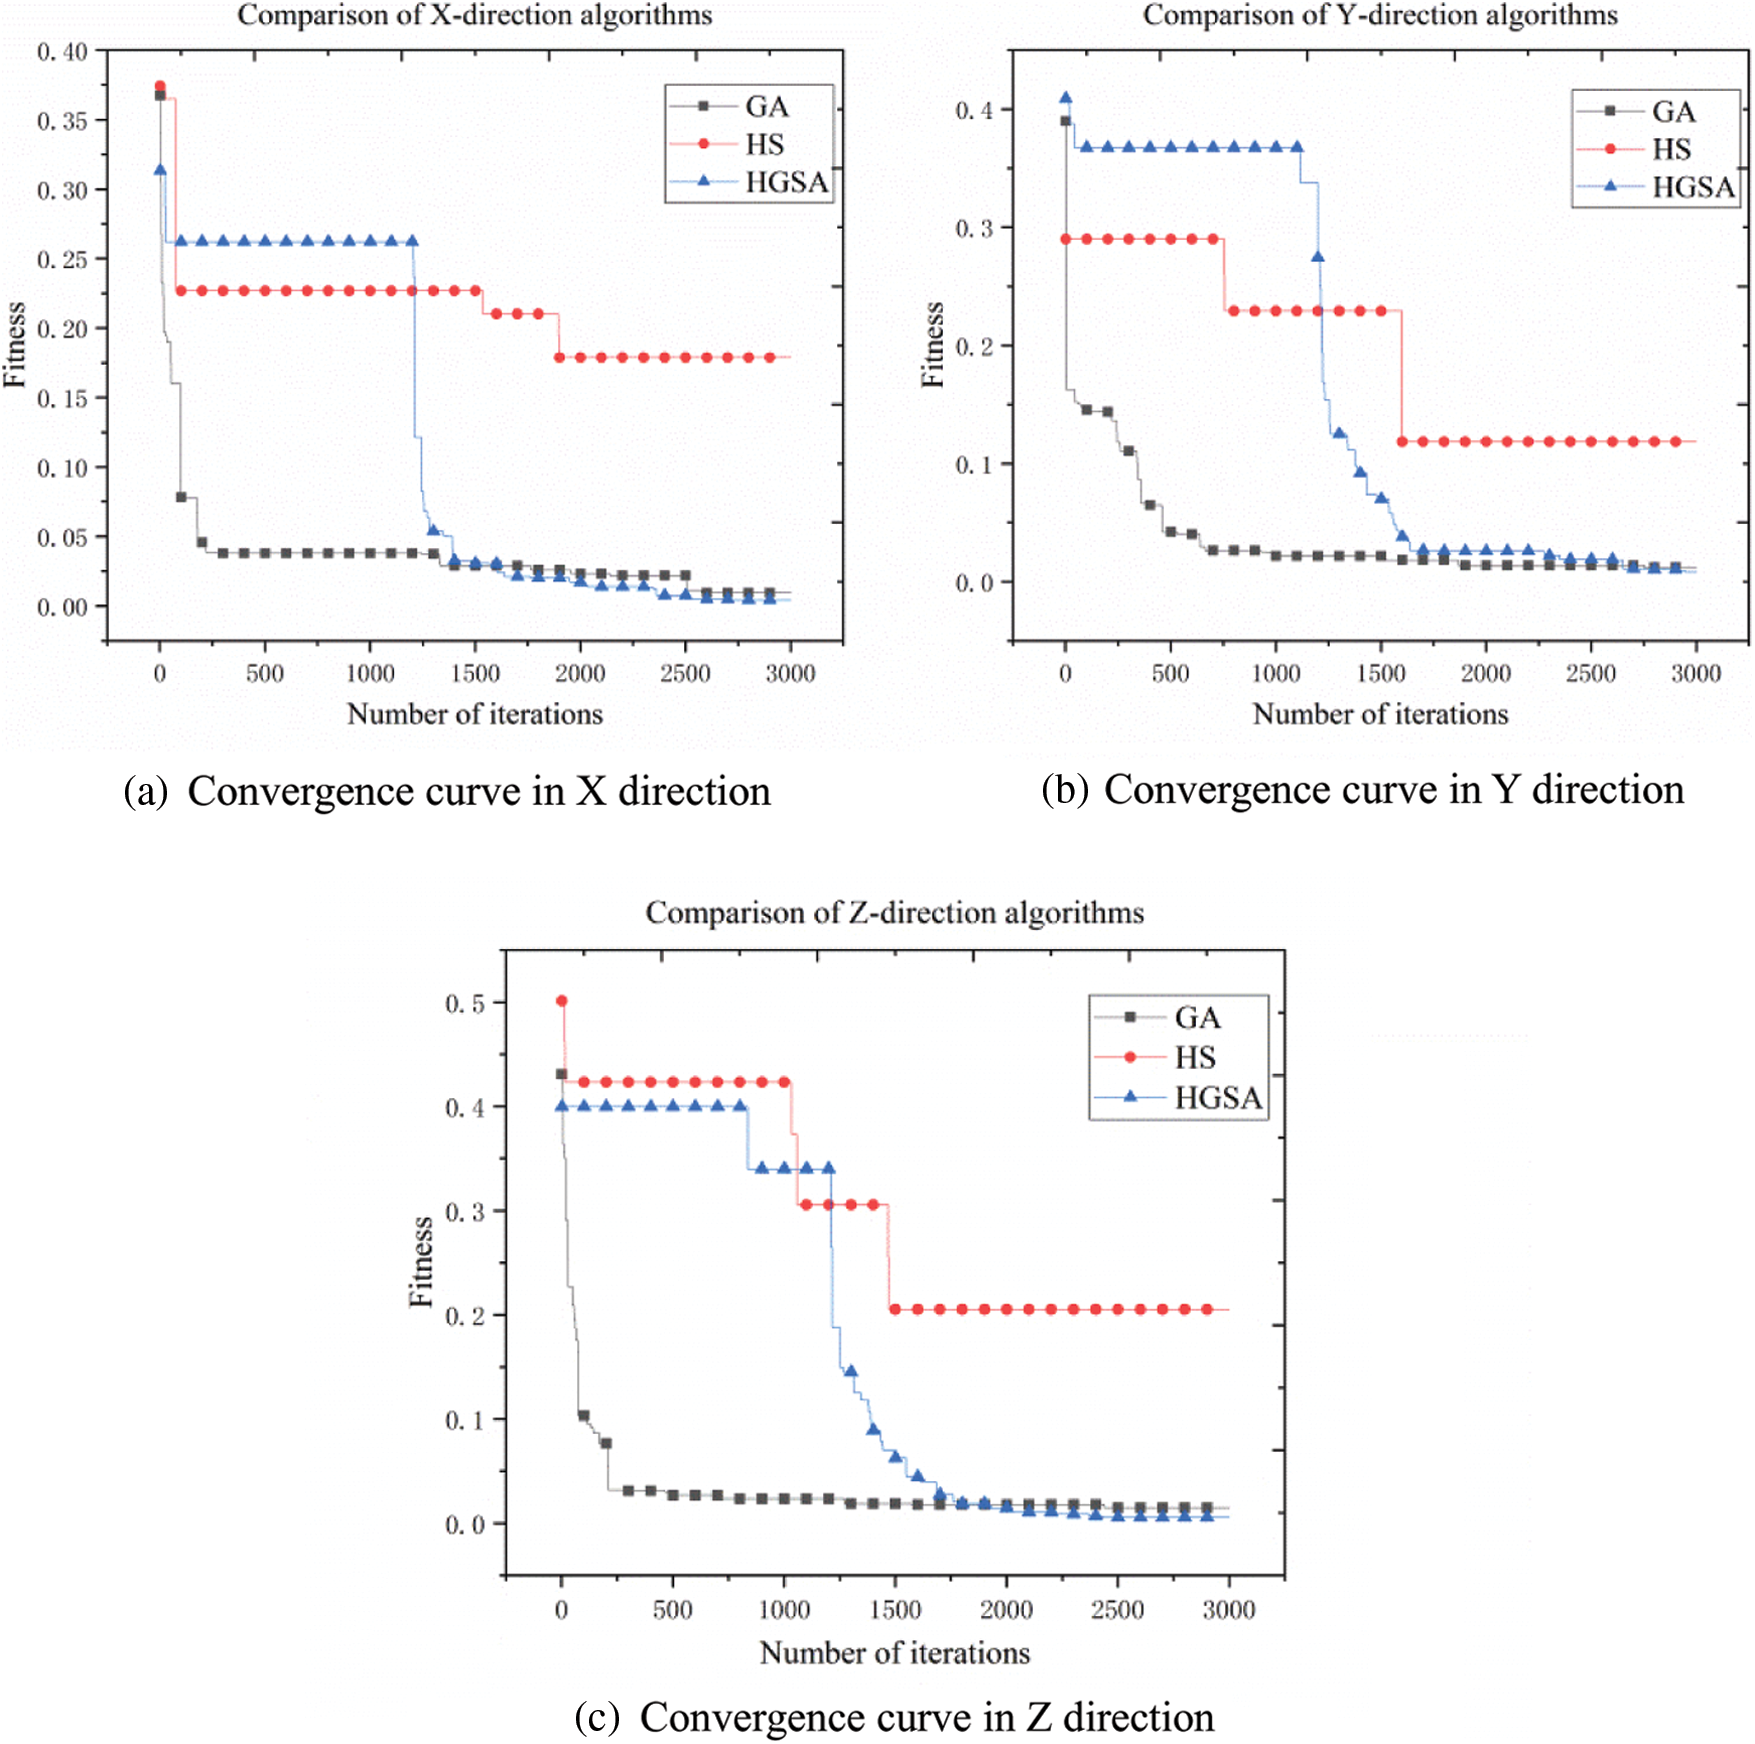
Figure 11: Convergence comparison of different methods
The comparative analysis shown in Fig. 11 shows that the harmony search algorithm is easy to fall into the local search during the analysis process to obtain the local optimal solution. The genetic algorithm can quickly obtain a more appropriate local optimal solution in the early stage of the search, and the algorithm is easy to fall into the local optimal solution in the later stage of the search. Harmony genetic algorithm combines the characteristics of harmony search and genetic search. In the early stage, the elite population is obtained by using the fast and efficient characteristics of harmony search, and then the parent and the mother are selected from the elite population, and then crossover, mutation, etc., are performed to obtain offspring. The comparison of harmony search method, genetic algorithm and harmony genetic algorithm is shown in Fig. 12.
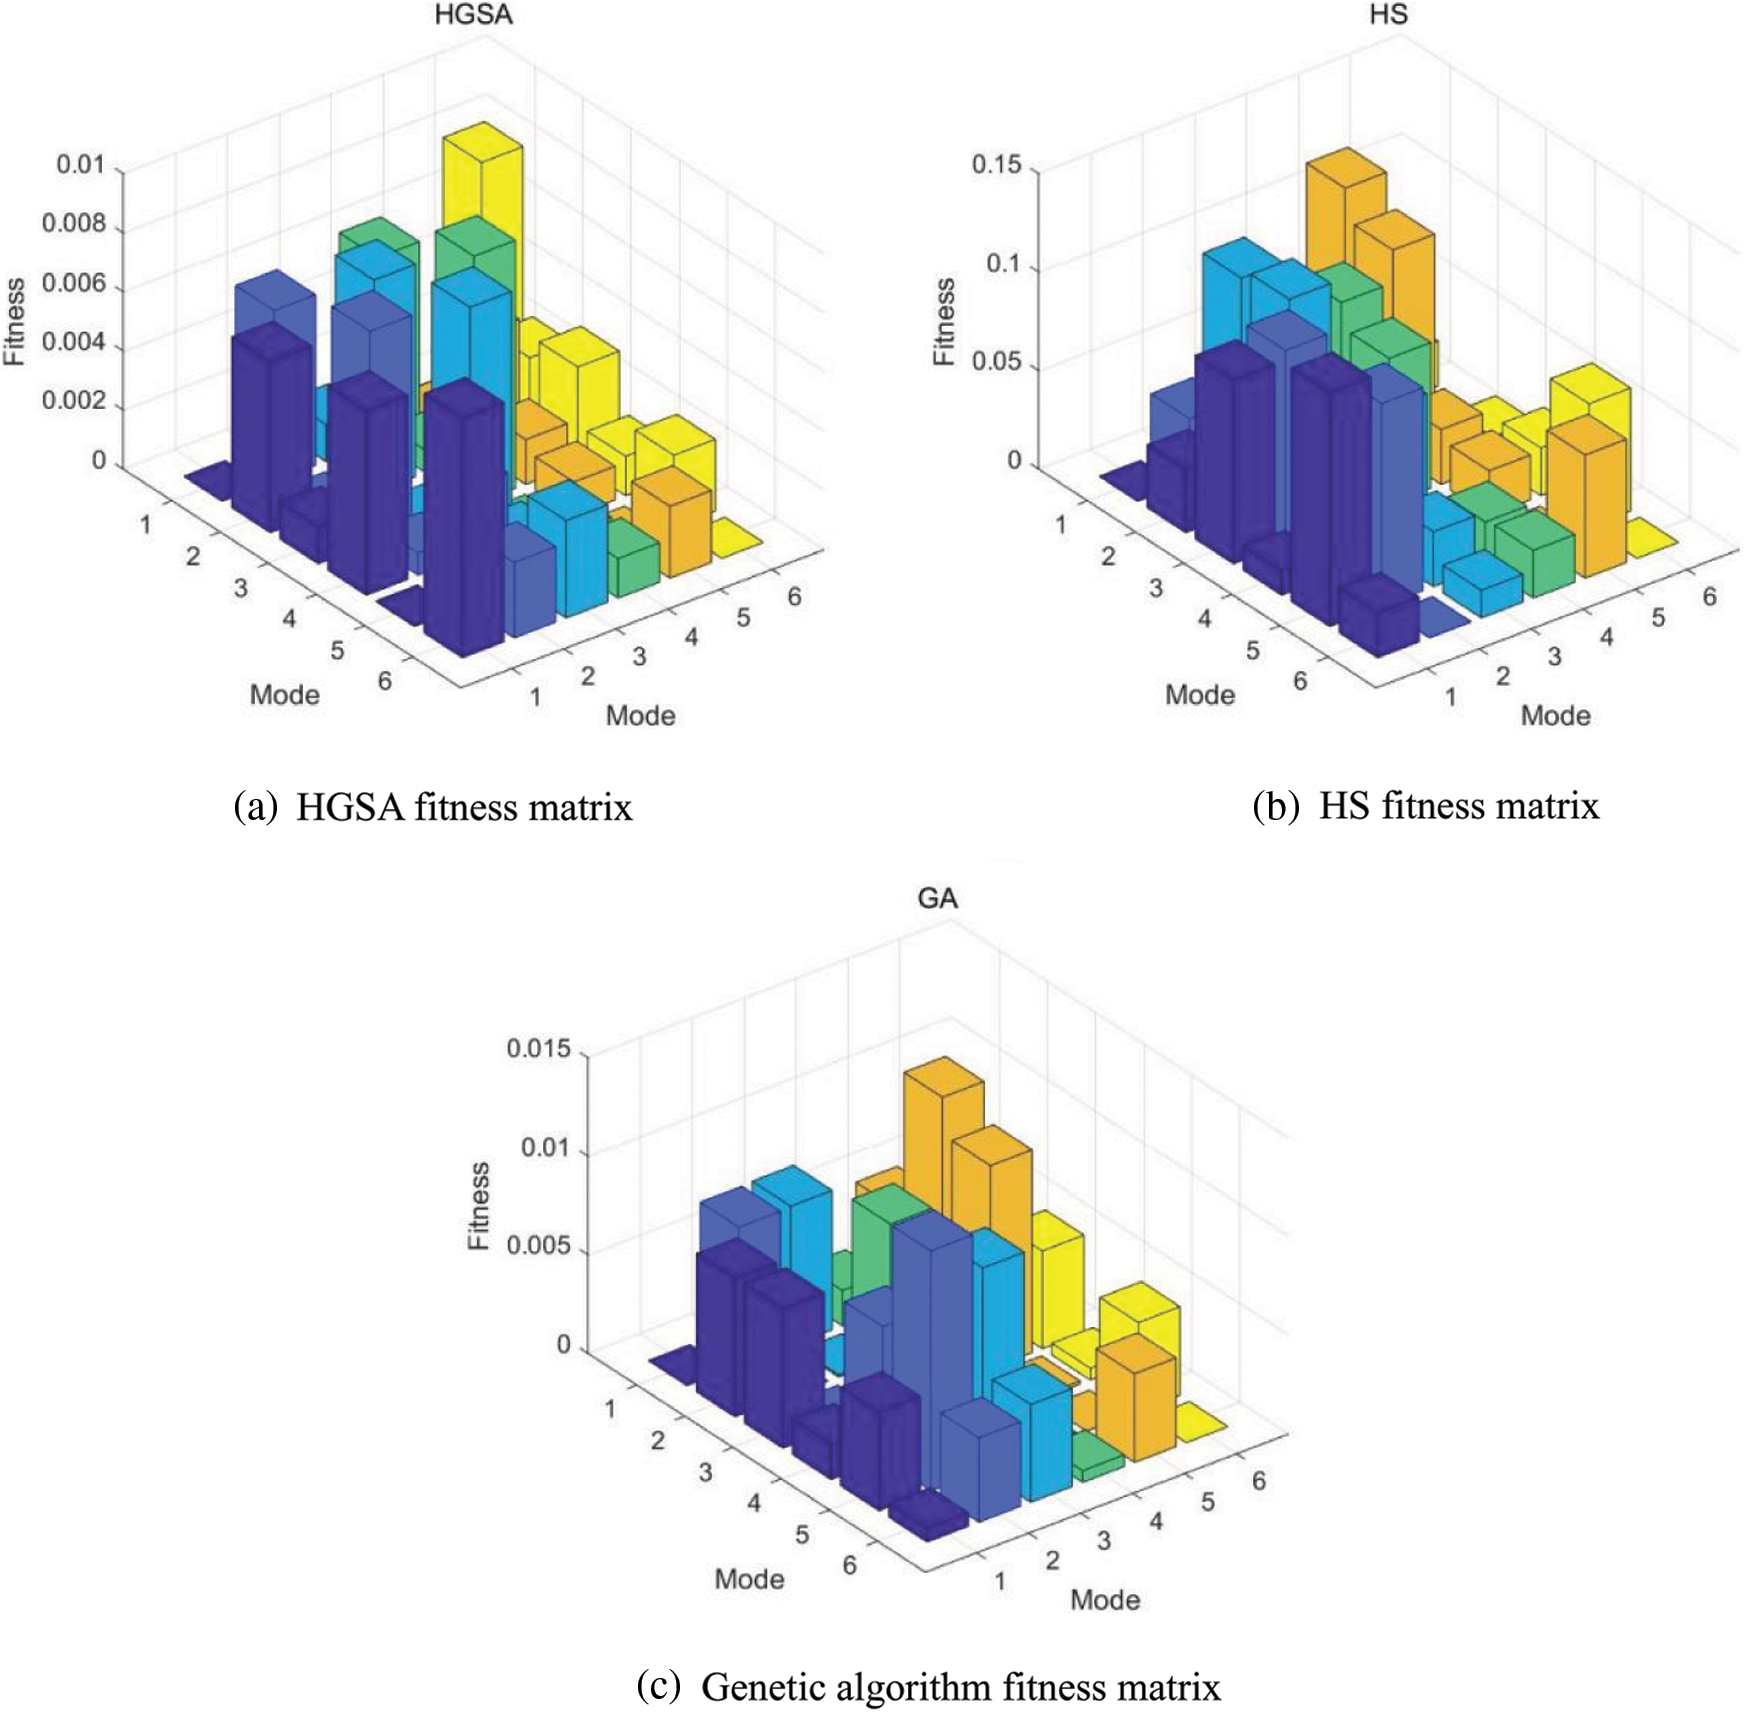
Figure 12: Fitness matrix of each algorithm
It can be seen from Fig. 12 that the maximum non-diagonal elements of the fitness matrix corresponding to the HGSA, HS, and GA algorithms are 0.0084, 0.1186, and 0.0122, respectively, which are all less than 0.25 [39]. Intelligent search algorithms such as HGSA, HS and GA have obvious advantages in ensuring the observability of the modal vector, while the results obtained by the HGSA algorithm are better than the HS algorithm and the GA algorithm.
The three search algorithms are inevitably with random characteristics, and repeated runs may get different local optimal solutions. Therefore, 30 times of analysis are used to compare the maximum (Best), minimum (Worst), average (Avg), standard deviation (Std) and average probability of deviation from the optimal path (Error) of their fitness respectively, and deviate from the optimal path. The average probability of is shown in Eq. (8).
In the formula, f(Xi) is the fitness value obtained from the i-th search; f(X0) is the fitness value obtained as expected. Therefore, the parameters of the three algorithm methods HGSA, HS and GA are shown in Tables 6–8.
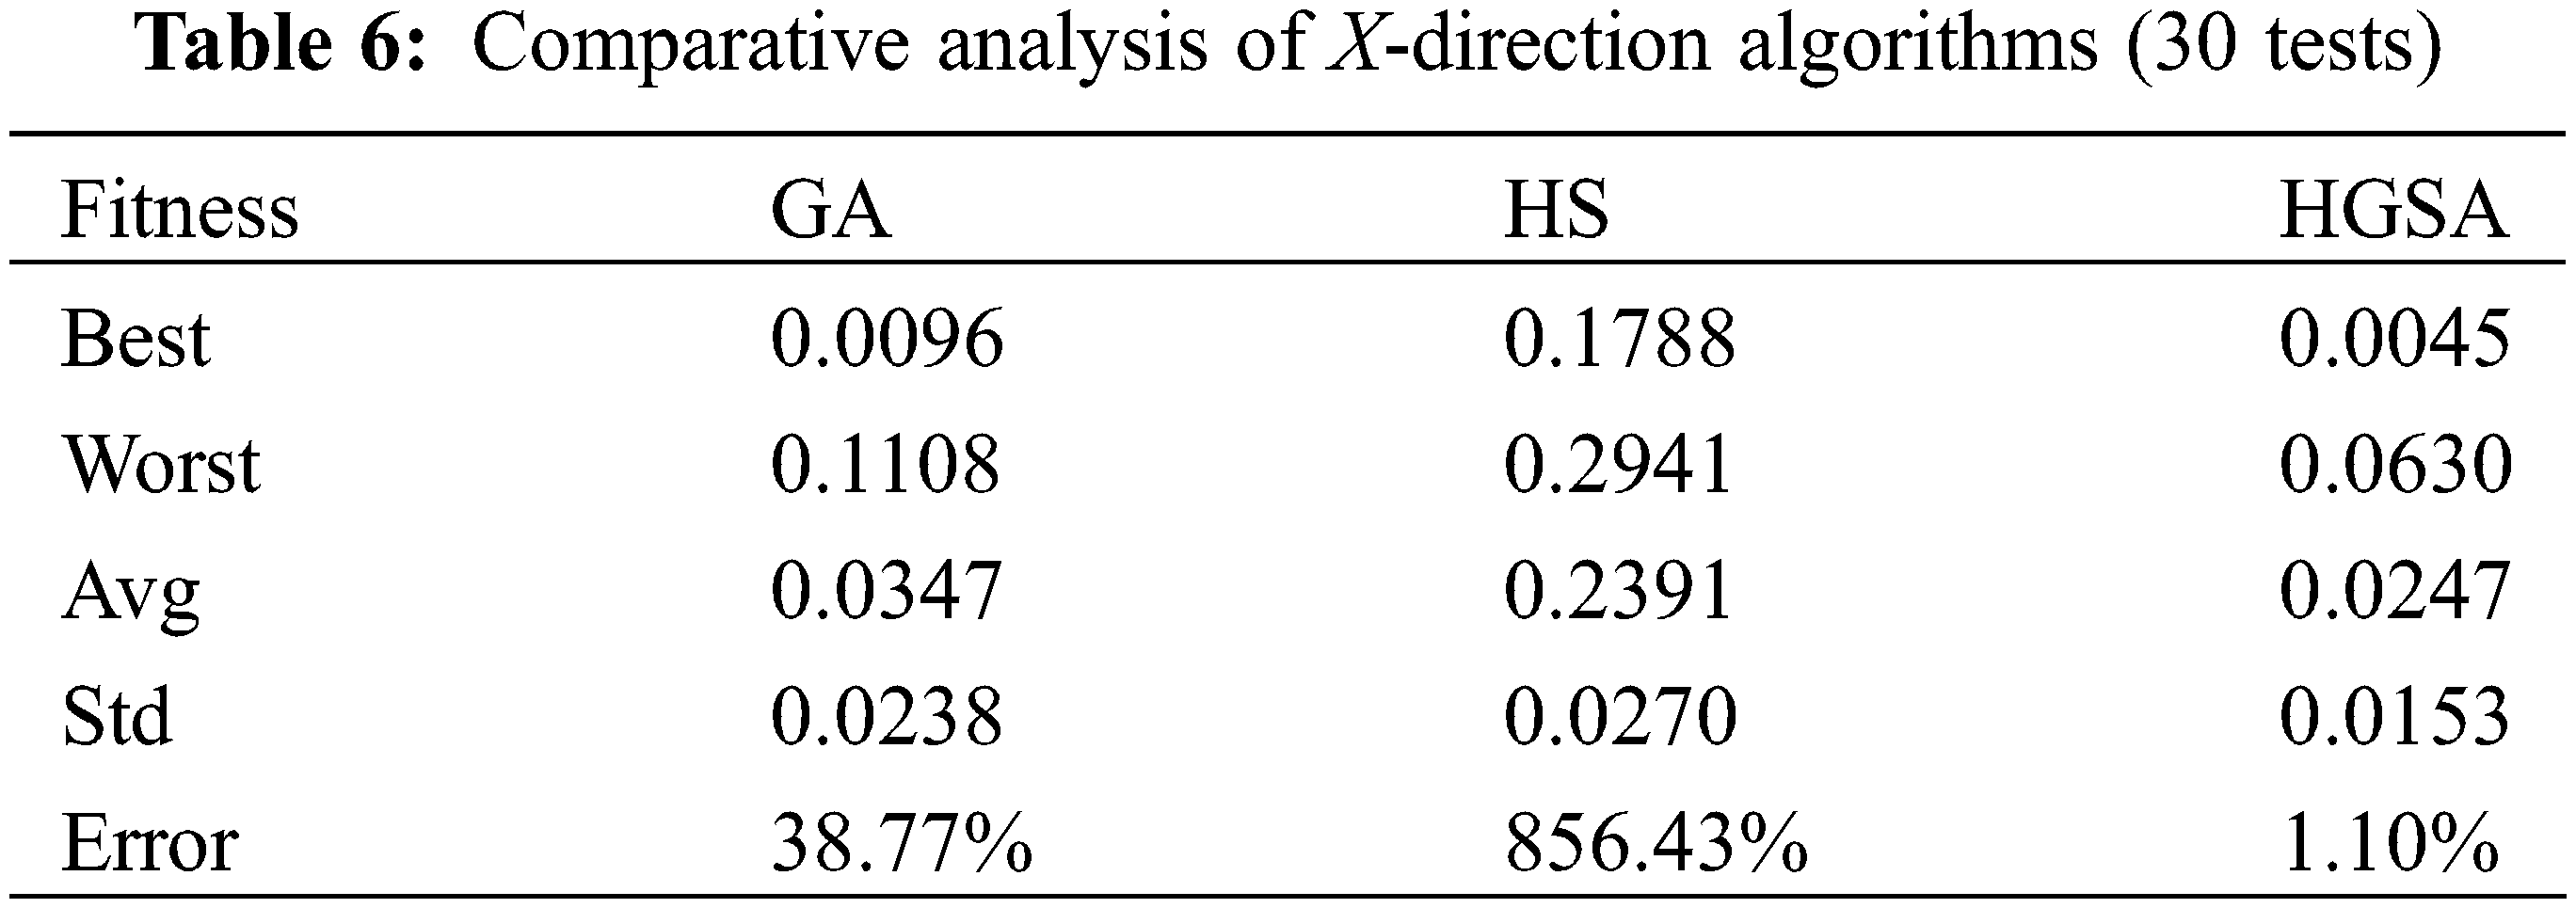
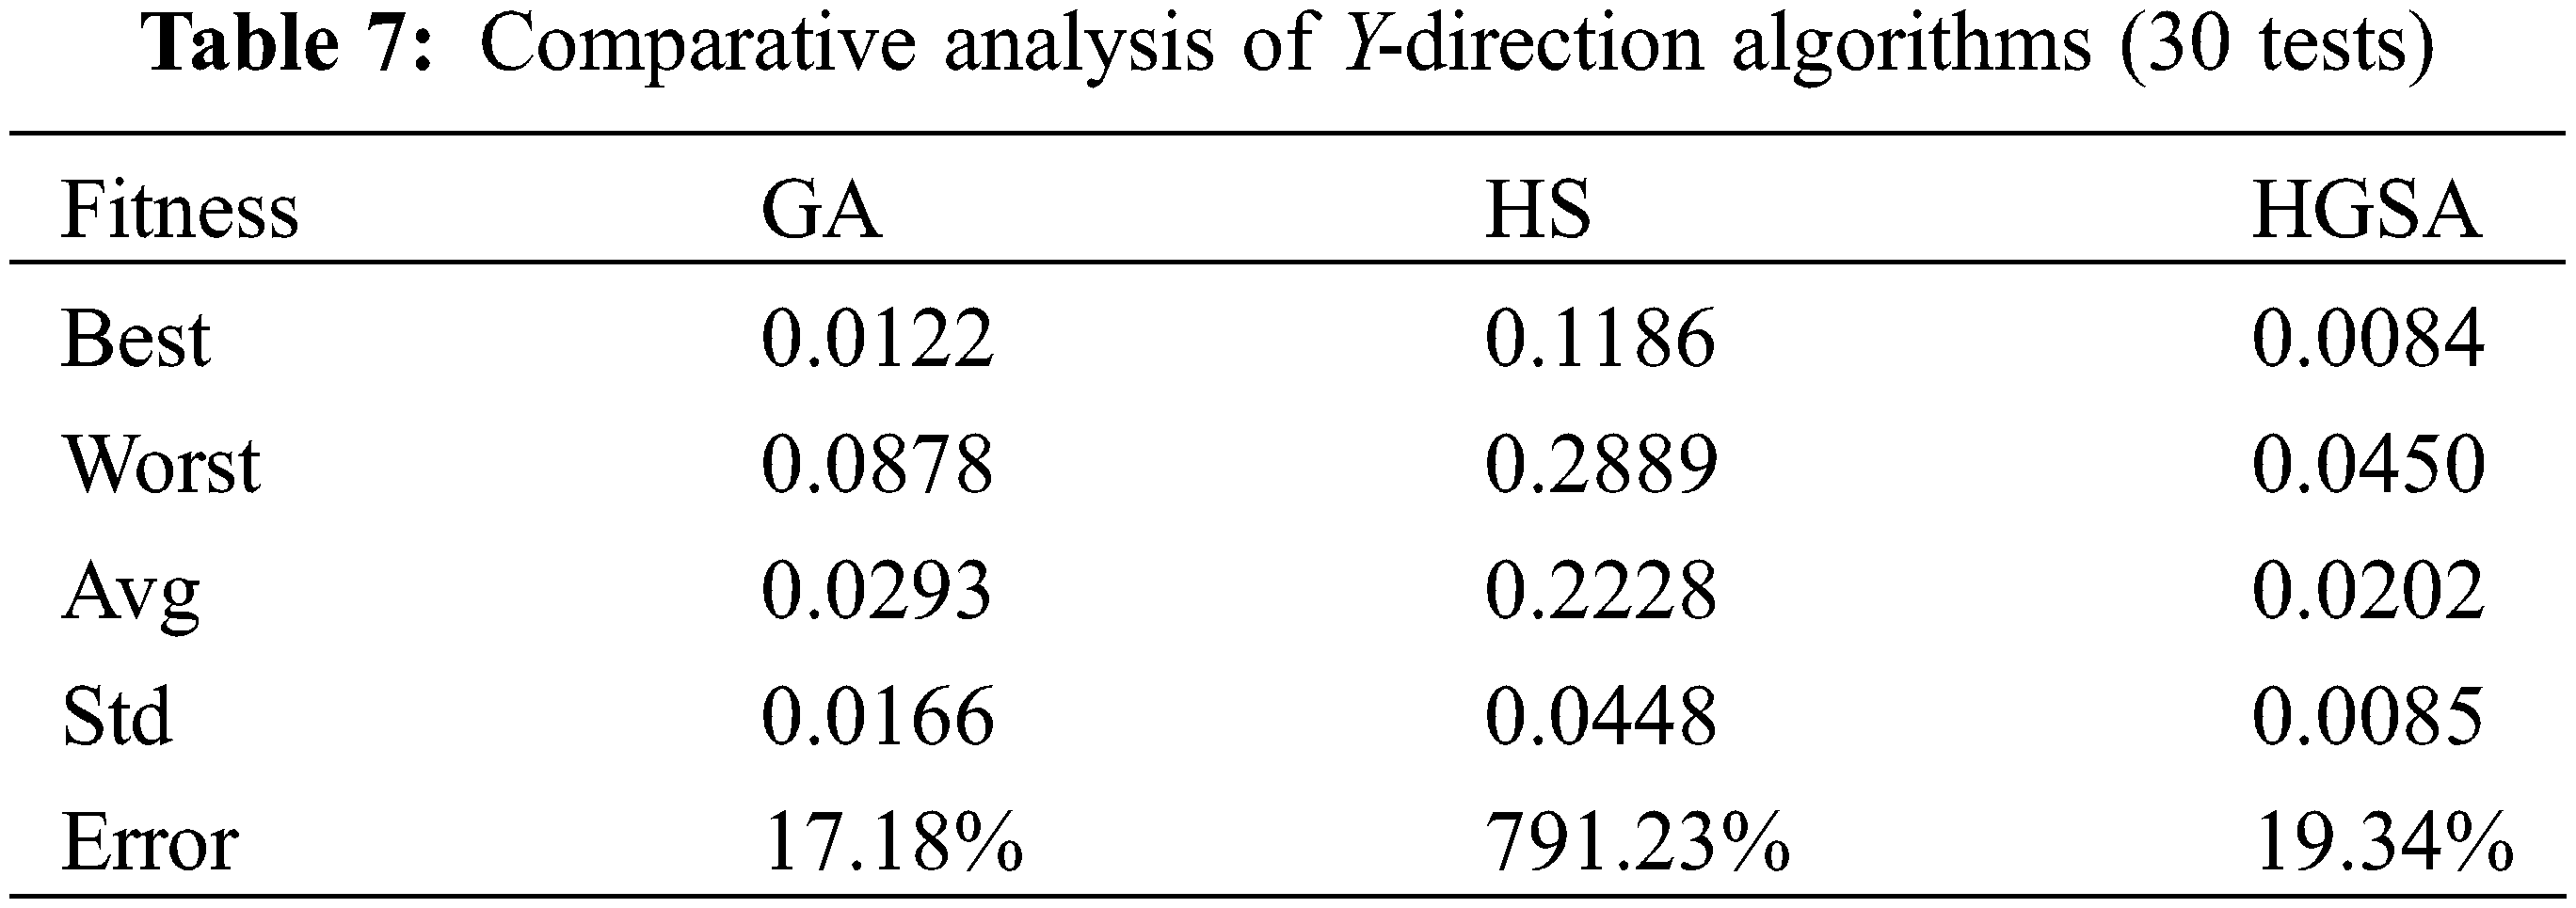
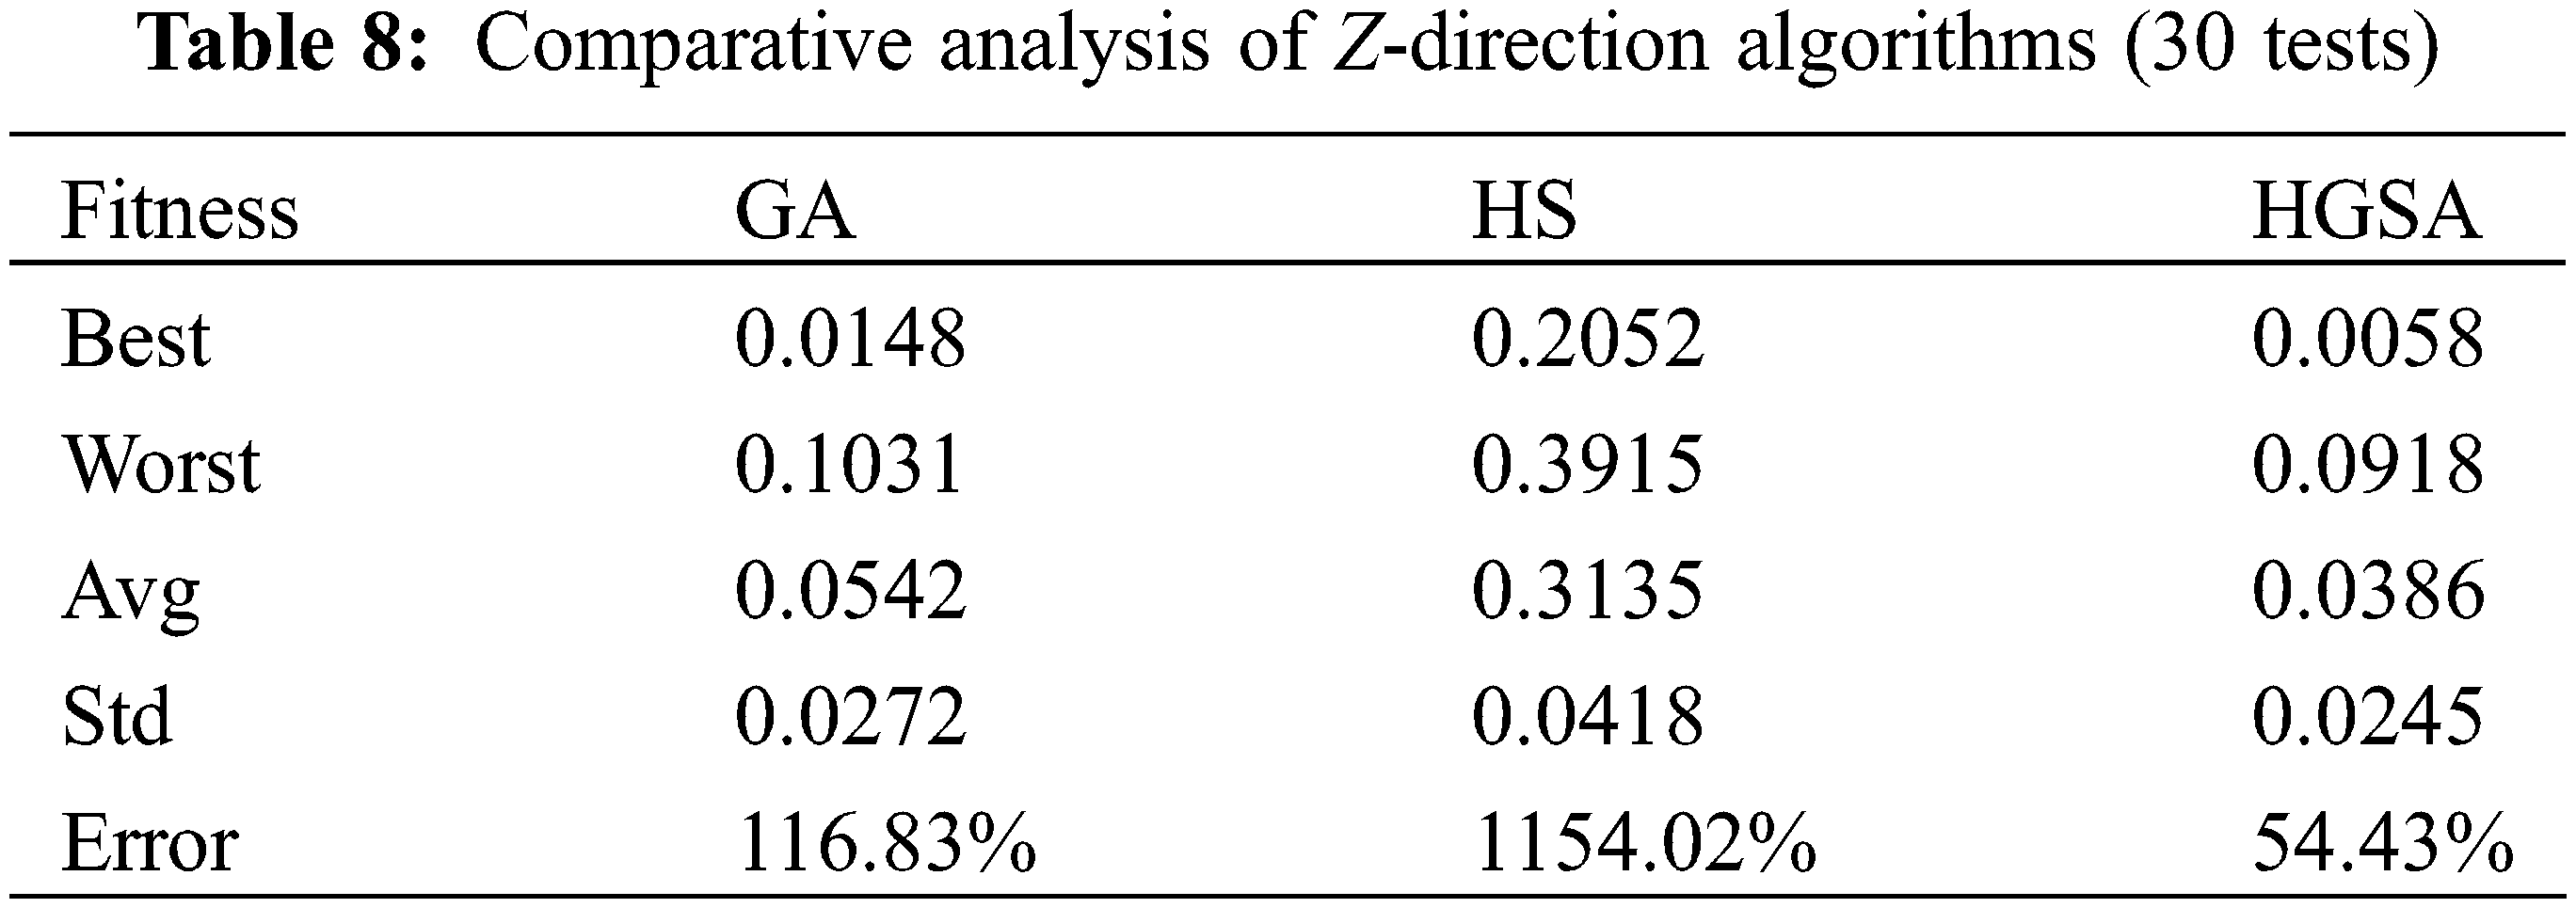
Through 30 calculation tests, the optimal fitness value obtained by the HGSA algorithm in the X direction is 0.0045, the worst fitness value is 0.0630, the average fitness value is 0.0247, and the standard deviation of the fitness value is 0.0153, which deviates from the optimal fitness. The average error rate of the value is 1.10%; the optimal fitness value obtained in the Y direction is 0.0084, the worst fitness value is 0.0450, the average fitness value is 0.0202, and the standard deviation of the fitness value is 0.0085, which deviates from the optimal fitness The average error rate of the value is 19.34%; the optimal fitness value obtained in the Z direction is 0.0058, the worst fitness value is 0.0918, the average fitness value is 0.0386, and the standard deviation of the fitness value is 0.0245, which deviates from the optimal fitness The average error rate of the value is 54.43%. The optimal fitness value obtained by the HS algorithm in the X direction is 0.1788, the worst fitness value is 0.2941, the average fitness value is 0.2391, the standard deviation of the fitness value is 0.0270, and the average error rate for deviation from the optimal fitness value is 856.43%; the optimal fitness value obtained in the Y direction is 0.1186, the worst fitness value is 0.2889, the average fitness value is 0.2228, the standard deviation of the fitness value is 0.0448, and the average error rate for deviation from the optimal fitness value 791.23%; the optimal fitness value obtained in the Z direction is 0.2052, the worst fitness value is 0.3915, the average fitness value is 0.3135, the standard deviation of the fitness value is 0.0418, and the average error rate for deviation from the optimal fitness value 1154.02%. The optimal fitness value obtained by the GA algorithm in the X direction is 0.0096, the worst fitness value is 0.1108, the average fitness value is 0.0347, the standard deviation of the fitness value is 0.0238, and the average error rate for deviation from the optimal fitness value is 38.77%; the optimal fitness value obtained in the Y direction is 0.0122, the worst fitness value is 0.0878, the average fitness value is 0.0293, the standard deviation of the fitness value is 0.0166, and the average error rate of deviation from the optimal fitness value 17.18%; The optimal fitness value obtained in the Z direction is 0.0148, the worst fitness value is 0.1031, the average fitness value is 0.0542, the standard deviation of the fitness value is 0.0272, and the average error rate for deviation from the optimal fitness value 116.83%.
HGSA algorithm is better than HS algorithm and GA algorithm in both the optimal fitness value and the worst fitness value. The average value and standard deviation of 30 tests are also better than HS algorithm and GA algorithm. The average probability of HGSA deviating from the optimal path The smallest. It shows that HGSA has stronger ability to reach the optimal value, has better stability, and is better in avoiding search randomness.
Hoisting machinery has a huge structure, variable cross-section, and many welded joints. Whether the sensor arrangement can cover the most critical or crack-sensitive area of the structure is a key issue for the implementation of the lifting machinery health monitoring technology and method.
(1) In order to solve the problem that the search algorithm for the vibration sensor layout of the main beam of the crane is easy to fall into the local optimum, a HGSA is proposed that has the advantages of simple and fast harmony search algorithm and strong global search ability of genetic algorithm., The use of complementary search mechanism to enhance the algorithm’s global search ability and local search ability, forming a hoisting machinery structure monitoring vibration sensor arrangement method.
(2) In view of the large number of nodes in the solid element model, the obtained node combination may contain the internal nodes of the element, and the sensor cannot be installed in the actual project. The shell element is used to replace the solid element for modal analysis to obtain the modal matrix of the sensor arrangement. Algorithm application provides support. Compared with the solid element, the shell element has the same eigenfrequency of each order, and the shell element has a smaller number of nodes than the solid element, and has a smaller modal matrix dimension, which greatly reduces the search operation of the modal matrix in the sensor placement decision. quantity.
(3) Through parameter comparison and analysis, the optimal HGSA initialization parameters are determined. Taking the main beam of the hoisting machinery as the object, the HGSA, HS and GA algorithms are studied in the vibration sensor placement decision, and comparative analysis is carried out. The test results show that while ensuring the efficiency of the solution, HGSA has a stronger search ability, better stability, and is better in avoiding search randomness.
Funding Statement: The author gratefully acknowledges the support of this work by the national key research and development project under the Grant No. 2017YFC0805100 and China Special Equipment Inspection and Research Institute under the Grant No. 2021 Youth 17.
Conflicts of Interest: The authors declare that they have no conflicts of interest to report regarding the present study.
1. Circular of the state administration of market supervision on the safety status of special equipment in China in 2019 (2020). [Google Scholar]
2. Wang, Q. (2018). Research on theory and application of crane health monitoring system. Taiyuan University of Science and Technology. [Google Scholar]
3. Liu, G. S., Ding, K. Q., Sun, B. Z., Ge, C. Q. (2019). Application research on health monitoring and diagnosis technology of rail mounted container gantry crane. Engineering Machinery, 50(5), 17–21+6–7. [Google Scholar]
4. Li, S. L., Zhang, H. M. (2012). Application of optical fiber sensing technology in crane metal structure health monitoring. Mechanical Management Development, (1), 78–79. [Google Scholar]
5. Ding, K. Q., Li, N., Wang, Z. J., Ding, S. Q., Feng, Y. G. (2011). Development and application of health monitoring system for large lifting machinery. Far East NDT New Technology Forum, vol. 6. [Google Scholar]
6. Feng, S. (2017). Research on optimal sensor placement and damage identification for structural monitoring. Dalian University of Technology. [Google Scholar]
7. Yang, Z. W. (2019). Study on optimal placement of sensors for health monitoring system of long span spatial structure. Dalian University of Technology. [Google Scholar]
8. Yang, C. (2020). Research progress and prospect of optimal sensor placement for structural health monitoring. Vibration and Shock, 39(17), 82–93. [Google Scholar]
9. Udwadia, F. E. (1994). Methodology for optimum sensor locations for parameter identification in dynamic systems. Journal of Engineering Mechanics, 120(2), 368–390. DOI 10.1061/(ASCE)0733-9399(1994)120:2(368). [Google Scholar] [CrossRef]
10. Kammer, D. C. (1991). Sensor placement for on-orbit modal identification and correlation of large space structures. Journal of Guidance, Control and Dynamics, 14, 251–259. DOI 10.2514/3.20635. [Google Scholar] [CrossRef]
11. Yang, Y. X., Hao, X. W., Sun, L. (2010). Optimal sensor placement of bridge structure based on energy coefficient effective independence method. Vibration and Impact, 29(11), 119–123+134+257. [Google Scholar]
12. Yuan, A. M., Dai, H., Sun, D. S. (2009). Optimal sensor placement of cable stayed bridge based on hybrid algorithm of EI and MAC. Vibration, Testing and Diagnosis, 29(1), 55–59+117–118. [Google Scholar]
13. Zhang, J., Liu, X., Zhao, Y., Wu, G., Liu, X. (2016). Optimal placement of vibration sensors for hydraulic structures based on effective independent total displacement method. Vibration and Impact, 35(8), 148–153. [Google Scholar]
14. He, L. J., Lian, J. J., Ma, B., Wang, H. J. (2013). Optimal sensor placement for large space structures based on distance coefficient effective independence method. Vibration and Shock, 32(16), 13–18. [Google Scholar]
15. Worden, K., Burrows A, P. (2001). Optimal sensor placement for fault detection. Engineering Structures, 23, 885–901. DOI 10.1016/S0141-0296(00)00118-8. [Google Scholar] [CrossRef]
16. Guyan, J. (1965). Reduction of stiffness and mass matrices. AIAA Joumal, 3(2), 380. DOI 10.2514/3.2874. [Google Scholar] [CrossRef]
17. Yang, Q. W., Liu, J. K. (2006). An improved model condensation method. Mechanics and Practice, (2), 70–72. [Google Scholar]
18. Liu, Z. S. (2011). Study on condensation method of dynamic model of nonclassical damping structure. Dalian University of Technology. [Google Scholar]
19. Xu, Y. (2012). Research and application of optimal layout of large steel structure health monitoring points based on QR decomposition method and effective independence method. Shandong Jianzhu University. [Google Scholar]
20. Qin, X. R., Zhang, L. M. (2001). A sensor configuration based on QR decomposition and gradual accumulation method. Vibration, Testing and Diagnosis, (3), 14–19+70. [Google Scholar]
21. Yao, L., Sethares, W. A., Kammer, D. C. (2012). Sensor placement for on-orbit modal identification via a genetic algorithm. AIAA Journal, 31(10), 1922–1928. DOI 10.2514/3.11868. [Google Scholar] [CrossRef]
22. Zuo, Y. (2012). Application of genetic algorithm in optimal layout of arch bridge health monitoring sensors. China Science and Technology Information, (24), 93–97. [Google Scholar]
23. Xin, X. (2016). Optimal placement method of bridge monitoring sensors based on simulated annealing. Sichuan Cement, (5), 311. [Google Scholar]
24. Yuan, G. X. (2012). Simulated annealing algorithm for routing optimization in wireless sensor networks. Science and Technology Bulletin, 28(12), 155–157. [Google Scholar]
25. Seyedpoor, S. M. (2012). A two stage method for structural damage detection using a modal strain energy based index and particle swarm optimization. Advances in Swarm Intelligence, 47(1), 1–8. DOI 10.1016/j.ijnonlinmec.2011.07.011. [Google Scholar] [CrossRef]
26. Lu, W. (2016). Research on optimal sensor placement for grid structure health monitoring based on particle swarm optimization. Xi’an University of architecture and technology. [Google Scholar]
27. Wang, X. M., Wang, H. F., Yao, N. F. (2018). Parameter optimization of laser displacement sensor based on particle swarm optimization. Laser Technology, 42(2), 181–186. [Google Scholar]
28. Li, M., Hu, J. P. (2019). Fault tolerant deployment method for wireless sensor networks based on harmony search algorithm. Sensors and Microsystems, 38(11), 50–53. [Google Scholar]
29. Jin, H., Xia, J., Wang, Y. Q. (2015). Optimal sensor placement for space modal identification of crane structures based on an improved harmony search algorithm. Journal of Zhejiang University-SCIENCE A, 16, 464–477. DOI 10.1631/jzus.A1400363. [Google Scholar] [CrossRef]
30. Wang, Y. Q. (2015). Research on optimal sensor placement of gantry crane for risk identification. Southeast University. [Google Scholar]
31. He, C., Xing, J. C., Li, J. L., Yang, Q., Xun, Z. (2013). A combined optimal sensor placement strategy for the structural health monitoring of bridge structures. International Journal of Distributed Sensor Networks, (4), 1–9. DOI 10.1155/2013/820694. [Google Scholar] [CrossRef]
32. Ma, G., Huang, F. L., Wang, X. M. (2008). Optimal placement of bridge monitoring sensors based on hybrid genetic algorithm. Journal of Vibration Engineering, (2), 191–196. [Google Scholar]
33. Cao, X. Y., Chen, J. Y., Xu, Q., Li, J. (2021). A distance coefficient-multi objective information fusion algorithm for optimal sensor placement in structural health monitoring. Advances in Structural Engineering, 24(4). DOI 10.1177/1369433220964375. [Google Scholar] [CrossRef]
34. Niu, G. C., Lian, J. J., Ma, B. (2012). Research on optimal sensor layout of hydraulic structure based on QR decomposition and genetic algorithm. Water Resources and Hydropower Technology, 43(6), 36–38+43. [Google Scholar]
35. Hua, L., Kang, J. X., Wang, F. S., Yue, Z. F. (2019). Optimal placement of multi-functional box section sensors of wing based on hybrid algorithm. Science, Technology and Engineering, 19(6), 257–262. [Google Scholar]
36. Liu, X. X., Peng, Z. R., Yin, H. (2018). Sensor configuration based on distribution estimation harmony search algorithm. Journal of Lanzhou Jiaotong University, 37(3), 64–70. [Google Scholar]
37. Carne T, G., Dohrmann C, R. (1994). A modal test design strategy for model correlation. USA. [Google Scholar]
38. He, H. X., Yan, W. M., Zhang, A. L. (2008). Research on optimization of sensor number and location for structural health monitoring. Vibration and Shock, (9), 131–134+188. [Google Scholar]
39. Tian, Y., Pan, H. X., Bi, J. W., Wu, C. L. (2016). Measuring point optimization of high-speed automata using the optimal solution of modal confidence criterion. Mechanical Design and Research, 32(1), 72–75. [Google Scholar]
 | This work is licensed under a Creative Commons Attribution 4.0 International License, which permits unrestricted use, distribution, and reproduction in any medium, provided the original work is properly cited. |