| Structural Durability & Health Monitoring |
DOI: 10.32604/sdhm.2022.020301
ARTICLE
Comparison of Structural Probabilistic and Non-Probabilistic Reliability Computational Methods under Big Data Condition
1School of Physics and Electronic Information Engineering, Ningxia Normal University, Guyuan, 756000, China
2School of Engineering, University of Greenwich, Kent, ME4 4TB, UK
3School of Mechanical Engineering, Guizhou University of Engineering Science, Bijie, 551700, China
*Corresponding Author: Kong Fah Tee. Email: K.F.Tee@gre.ac.uk
Received: 16 November 2021; Accepted: 25 February 2022
Abstract: In this article, structural probabilistic and non-probabilistic reliability have been evaluated and compared under big data condition. Firstly, the big data is collected via structural monitoring and analysis. Big data is classified into different types according to the regularities of the distribution of data. The different stresses which have been subjected by the structure are used in this paper. Secondly, the structural interval reliability and probabilistic prediction models are established by using the stress-strength interference theory under big data of random loads after the stresses and structural strength are comprehensively considered. Structural reliability is computed by using various stress types, and the minimum reliability is determined as structural reliability. Finally, the advantage and disadvantage of the interval reliability method and probability reliability method are shown by using three examples. It has been shown that the proposed methods are feasible and effective.
Keywords: Big data; structure; interval reliability; probabilistic reliability; reliability index
The reliability problem has existed since the beginning of human social activities, but the real cause of human attention should have started during the Second World War. At that time, the United States military’s communications and electronic equipment frequently failed during the service period, and some electronic equipment had not even been put into use, and a large number of them had failed.
Since the end of the 1940s, many industrially developed countries led by the United States have successively carried out research on reliability. Reliability research in the field of structures and systems can be traced back to the late 1940s and early 1950s. In 1947, the famous stress-strength interference model was established, which formed the basis of structural reliability design. Since 1954, the normal-normal model of the stress-strength interference model was established, scholars from the Soviet Union, the United States, Japan, Canada and other countries have made outstanding contributions to the study of mechanical and structural reliability. So that structural reliability has been gradually developed into an independent engineering subject.
In modern manufacturing companies, big data is being captured by using lasers, sensors, wireless networks, etc. These big data include the processing of manufacturing processes, the effects of temperature, vibration, reliability data, etc. Big data is processed in computers by using different algorithms for improving the products and to increase the competitiveness of organizations in the market. Big data is widely used to discover and develop new technologies, methodologies and decisions. Big data has been paid attention to and researched in modern society. The 5 V (volume, velocity, variety, veracity, value) of big data have been defined and they are believed as important as the meaning of new technology [1–3]. The application principles of big data in the field of security engineering have been analyzed, the theoretical system of the secure big data application was established, the safe big data processing procedure was developed, and the theoretical guidance was provided for the application of big data in the field of security science and engineering [4,5].
For most engineering structures, massive data would be generated during their service life such as bridges, wind towers, pipelines and automobile chassis [6]. These structures are subjected not only to a large amount of imposed load, but also to other loads such as wind, corrosion, vibration, etc. The data is acquired timely, and the data would be analyzed and sorted. The structural reliability can be predicted using the data, and thus effective maintenance measures for the structure are proposed [7–9]. The existing bridge structures are normally evaluated using big data. It is suggested that the early maintenance of the bridge is very important [10–12]. A faster detection method that is nonlinear and more practical and feasible has been proposed using big data collected from the structural health monitoring for a large reinforced concrete structure in Italy [13]. The wind turbine failure model and the maintenance decision system is also established using big data which is obtained from the weather and wind power equipment [14].
The traditional structural probability reliability model has been developed based on the known probability distribution function of structural strength and imposed load. The structural reliability can be directly obtained by using the integration method or the first-second moment method, and the prediction result is sensitive to the accuracy of the probability distribution parameters [15,16]. In fact, any structure is normally subjected to big data loads during its service period, but these loads have no obvious regular distribution, in other words, the probability distribution parameters would be difficult to be determined. The uncertain issue may be solved by using the interval or convex set model [17,18]. According to the literature [19–21], a structural non-probabilistic reliability model based on interval analysis has been proposed, and the non-probabilistic reliability of the structure under the interval static load has been analyzed.
Interval data with both heavy censoring and batch effects are considered, simulation studies demonstrate the superiority of the proposed method over two other commonly-used bootstrap methods [22]. The equivalent conversion method will convert the interval variables to the normal random variables for the computation of reliability. A numerical example is used to demonstrate that the method is feasible [23]. The time-variant stress–strength interference interval model is established, the structural state at any time can be described by the non-probabilistic time-variant reliability [24].
With the massive data advantage, big data processing technology has been applied to the reliability research of large-capacity power and electronic systems [25]. The application of big data in traffic reliability operations has also been put forward. It is believed that new opportunities will be brought to innovation in traffic management and the decision-making paradigm [26]. The data quality and data characteristics have been analyzed, and the highway reliability estimation methods have been proposed [27–30]. The reliability of the system was predicted and analyzed using big data, and the prediction model was developed. The proposed method has been compared with the existing methods and their prediction model is better than others. However, there are few related works on the reliability of structures using big data. In most cases, big data has no obvious distribution rules, but in some cases, it is necessary to use these big data to evaluate structural reliability. The main novelty of this paper is a comparison of structural probabilistic and non-probabilistic or interval reliability computational methods using big data.
In this paper, based on the research of structural probability reliability and interval reliability, big data collected from structural monitoring will be classified according to different types of data. The stress response of structure will be obtained by analyzing the big data as shown in Section 2. The interval reliability and structural probability reliability prediction models will be developed according to the stress response and the strength of the structure as reported in Sections 3 and 4, respectively and the two prediction models are compared. Finally, the advantages and disadvantages of the probabilistic and interval reliability calculation methods under the condition of big data will be illustrated by three examples as presented in Section 5. The rationality and practicability of the calculation methods of structural reliability are further elaborated.
2 Big Data of Structural Stress
During the structural service lifetime, massive structural health monitoring data of a structure can be produced because it is constantly subjected to imposed loads. The loads can be classified according to their characteristics, they are classified as A1, A2,…,Ai,…,An, respectively. The number of the loads is denoted as mi in each Ai, where i, m are 1, 2, 3, …
In each Ai, a structural load is denoted as
3 Structural Interval Reliability with Big Data
3.1 Interval Non-Probabilistic Reliability Index
The function of the interval non-probabilistic reliability can be calculated as follows by using the strength-stress interference theory:
where δ and s are the strength and working stress of the structure, respectively.
The structural interval non-probabilistic reliability index can be obtained as follows:
If η > 1, then the structure is considered reliable whereas when η ≤ 1, then the structure is considered unreliable and might contain defects. The higher the value of η, the more reliable the structure will be.
3.2 Computing Structural Interval Non-Probabilistic Reliability with Big Data
In each big data load classification Ai, the maximum load is
where
The mean and dispersion of Eq. (3) are
where
The mean and dispersion of Eq. (4) are δc and δr, respectively. The structural interval non-probabilistic reliability index can be obtained by using Eq. (2) under big data loads Ai as follows:
A structure is considered similar to a series system that is comprised of n number of subsystems in the structural lifetime. According to the reliability concept of a series system, if a system is reliable, then every subsystem should be reliable. Therefore, the structural interval non-probabilistic reliability index can be obtained under the condition of big data loads as follows:
where
4 Structural Probabilistic Reliability with Big Data
Stress-strength interference is referred to the basic idea of interference analysis of probabilistic variables in reliability estimation. The stress and strength are considered as two random variables to compare their relative magnitudes in the same coordinate system. The distribution function curves of two random variables will be drawn in one coordinate system, they will generally be intersected, that is, there is an interference area, indicating the possibility that the stress is greater than the strength.
The probabilistic density function of the stress is noted as g(s), the probabilistic density function of the strength is noted as f(δ), the structural reliability R can be obtained by using the stress-strength interference theory as follows:
The concepts of stress and strength are broad. It can be considered that stress is any physical factor that can lead to failure of the structure, such as load, temperature, corrosion, radiation, etc. The strength of structure and system components is their performance index against corresponding stress. According to the traditional view and the assumption of independent failure of components, the reliability of the system can be directly calculated based on the reliability of the system components.
The reliability model of a series system can be calculated as follows:
The reliability model of a parallel system can be calculated as follows:
where Rsys is the reliability of the system,
The limit state function of a structure can be established by using the stress-strength interference theory as follows:
The reliability of the structure that the structure is in a safe state can be computed by using the first-order second-moment method.
where
4.2 Probabilitistic Reliability with Big Data
Suppose the probability distribution function and the probability density function of
The probability density function
Suppose the probability density function f(δ) of the random variable δ of structural strength is obtained, the formulation of the structural reliability can be derived using the stress-strength interference theory under the Ai type of loads with the big data condition as follows:
Based on the n types of A1, A2,…,Ai,…,An of structural loads, a formulation of structural reliability can be calculated by using Eq. (14). Thus, each reliability can be obtained as follows, respectively:
The minimum value of Eq. (15) is determined as the structural reliability under the big data loads.
Case 1
A chassis of a tractor is the basic component for the tractor, the chassis of a tractor is shown in Fig. 1. A chassis of a tractor has been monitored for 10000 h, 0.125 GB of data has been produced in every hour, and thus the total data collected is 1250 GB. The working stress of the chassis of the tractor is shown in Fig. 2 and the parameters
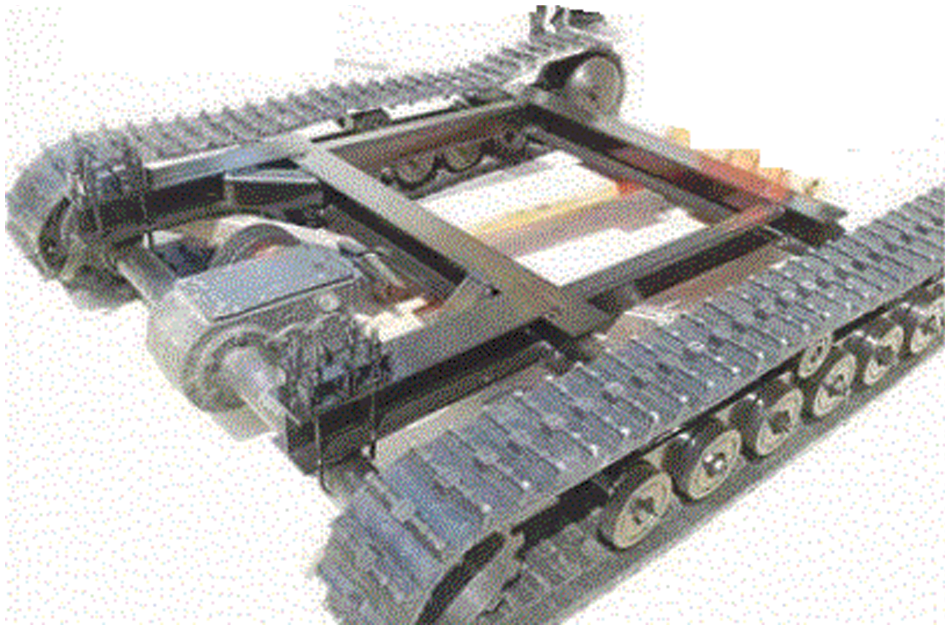
Figure 1: A chassis of a tractor
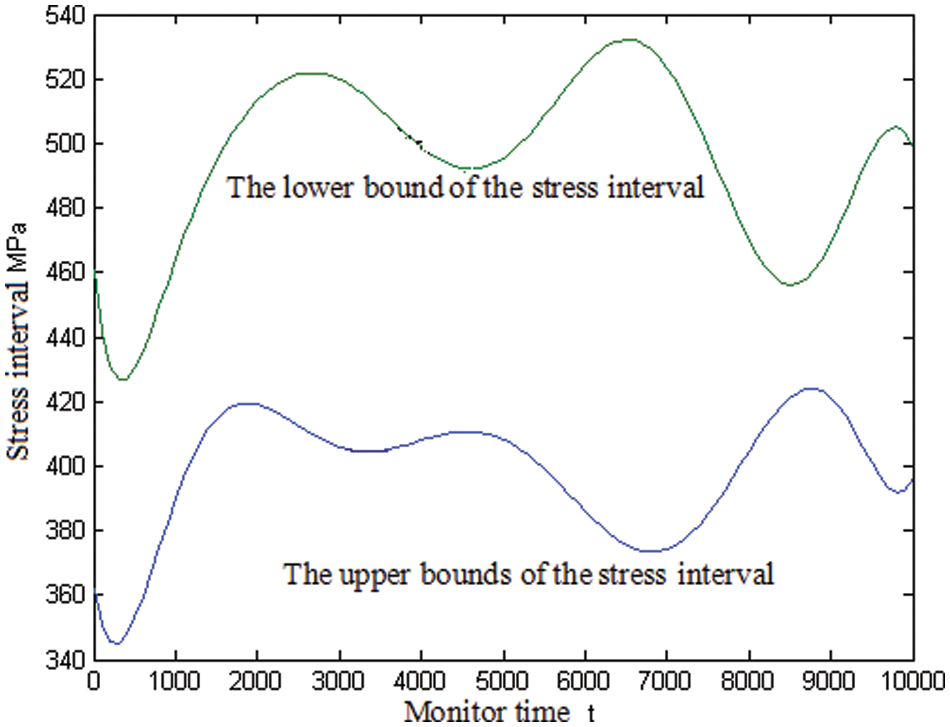
Figure 2: The stress of the chassis of the tractor
The chassis was made of 45# steel, its interval of the stress is given as δ = (720, 890) MPa, and the interval reliability index can be computed by using Eq. (5) as follows:
The probability reliability of the chassis can be computed by using Eq. (9) as follows:
The reliability of the chassis is computed by using Monte Carlo (MC) method with 106 samples. The reliability is 0.9999 which is considered as a practical value in structural reliability engineering. The reliability index is 6.025. It can be converted to the interval reliability index of 1.0346 [31]. It is shown that the interval reliability is very close to the industry practices.
The probability reliability index of the chassis is more than 4.5. Based on the literature review, in comparison to the probability reliability index and interval reliability index, the probability reliability index may be smaller. This is because for the probability reliability index, if less data is used for random distribution parameters, the probability distribution of the stress and strength of the chassis will not be modelled sufficiently, which also reflects the advantages of the interval reliability method.
Case 2
The structural health monitoring data was collected for a large spanning suspension bridge in China with 3 GB data per day that is 1 TB of big data every year [32]. The collected load data comprises vehicles passing through the bridge in the whole year of 2015.
The welding joint of a U stiffener and roof is an important part of the large spanning suspension bridge. The welding joint of a U stiffener and roof is shown in Fig. 3. The reliability of the welding joint of U stiffener and roof, which is the weak link of the bridge [33], under the passing vehicle loads on the bridge in 2015 has been studied.
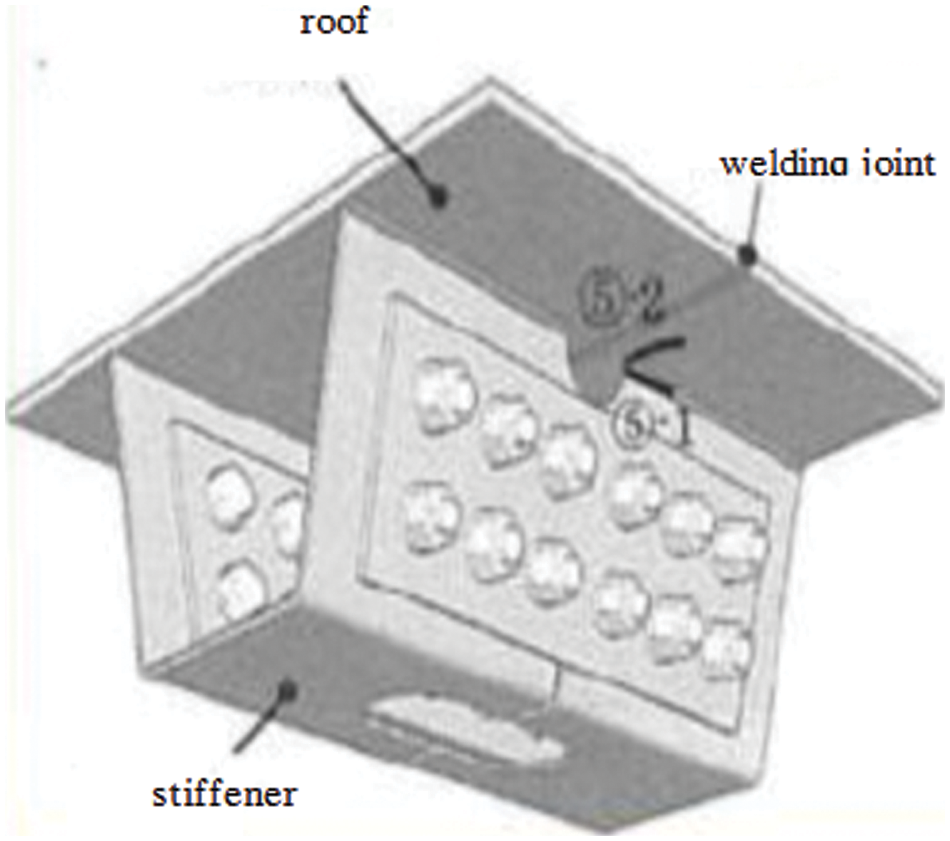
Figure 3: The welding joint of U stiffener and roof
The passing vehicles of the whole year are divided into six types according to the number of axles of the vehicle as follows:
Type I, 2 axles 2 axles,
Type II, 3 axles 2 axles,
Type III, 4 axles 3 axles,
Type IV, 5 axles 3 axles,
Type V, 6 axles 3 axles,
Type VI, 6 axles 4 axles.
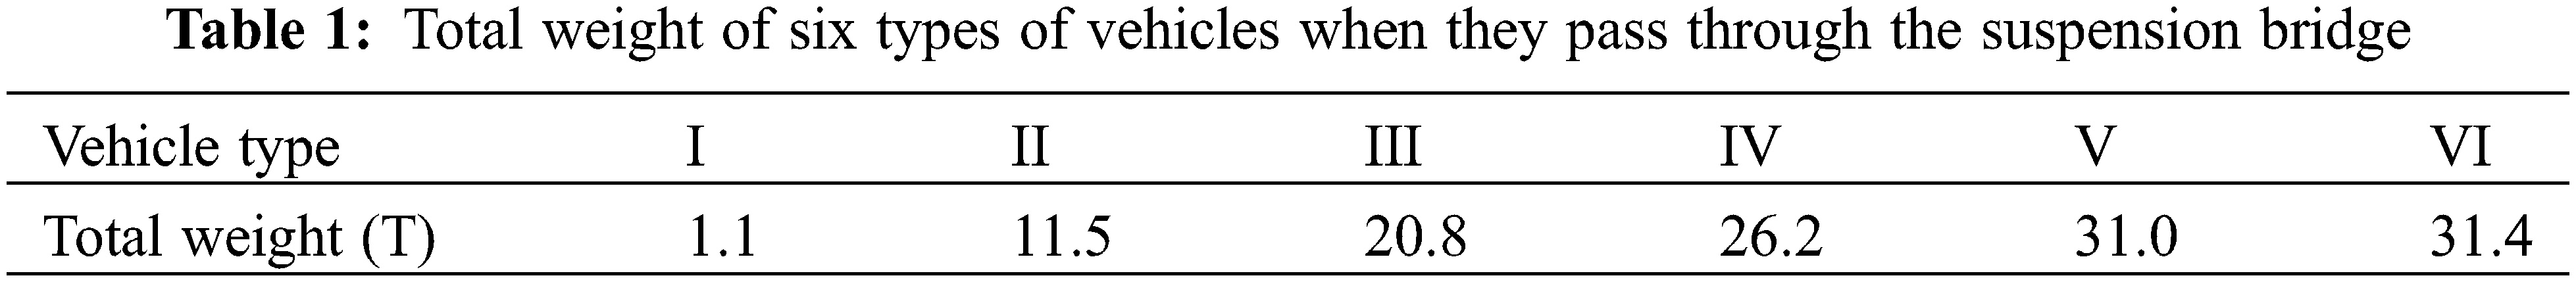
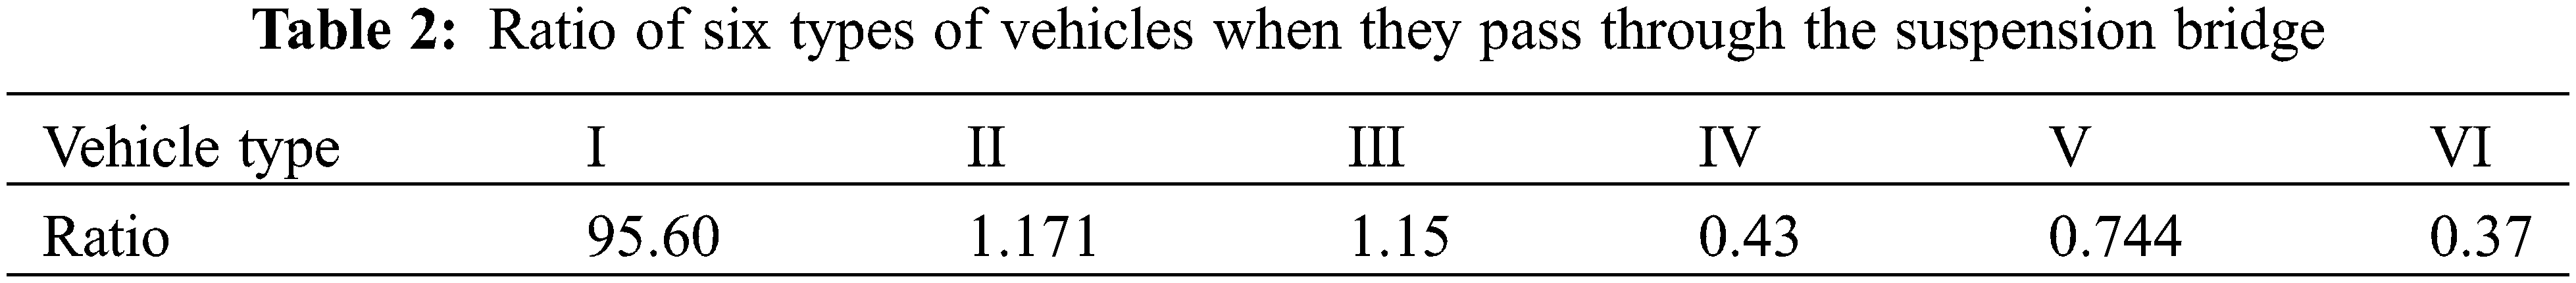
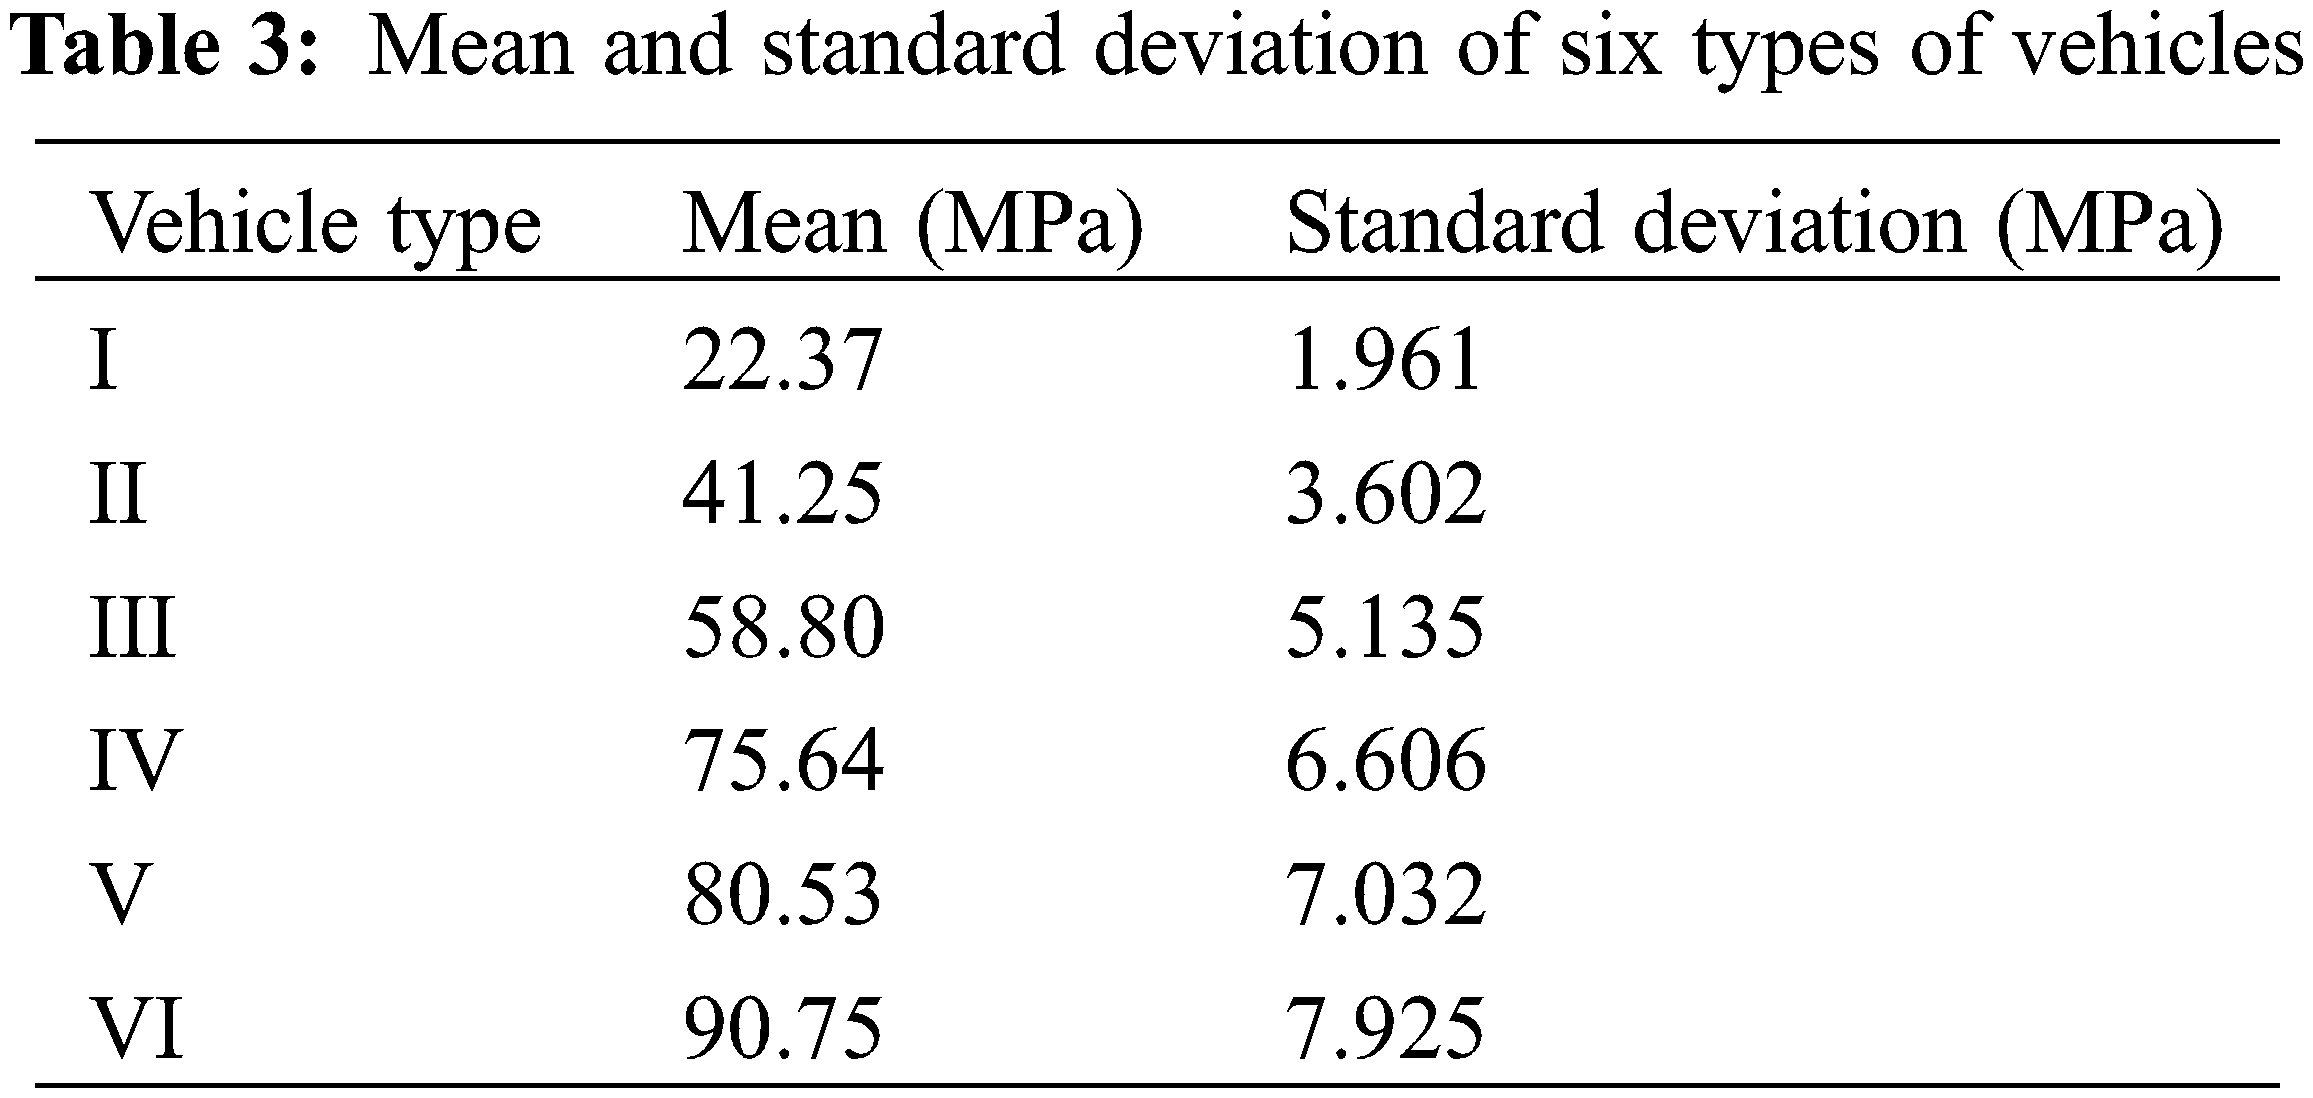
The total weight of six types of vehicles is shown in Table 1. The ratio of the loads for six types of vehicles is shown in Table 2. The stresses of six types of vehicles obey the normal distribution, and their mean and standard deviation are shown in Table 3.
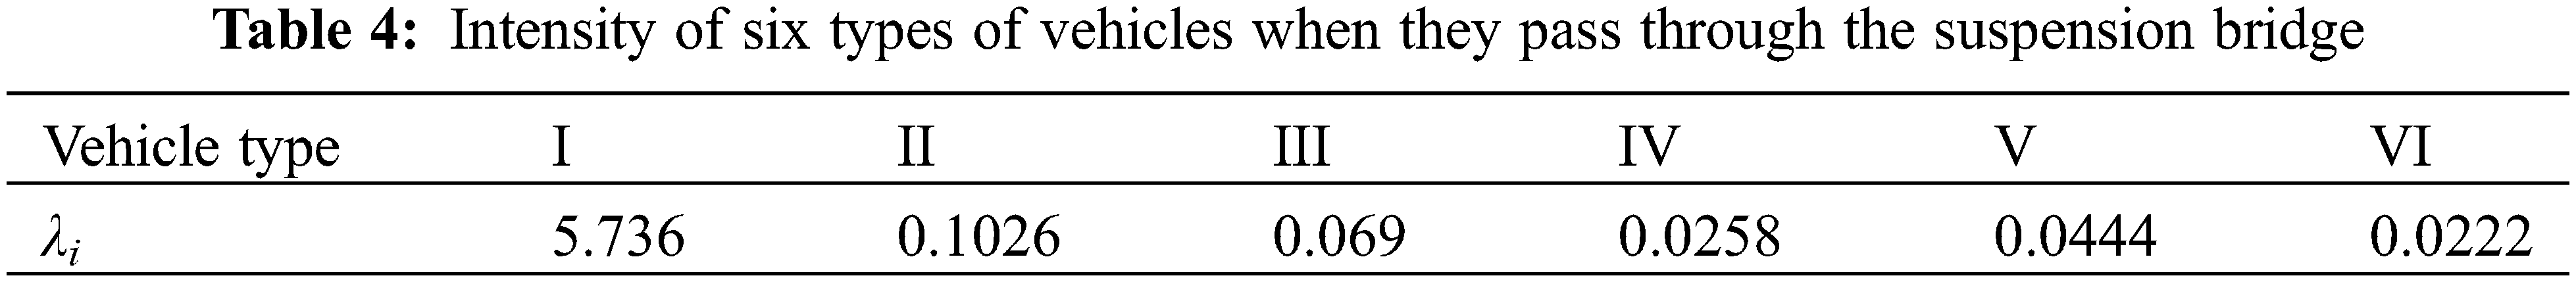
The strength of the welding joint of the U stiffener and roof is also assumed to obey the normal distribution with the mean of 345 MPa and the standard deviation of 15 MPa. In this example, the theoretical lifetime of the part is 204 years, whereas the actual observed lifetime is 165 years [31]. According to the traffic intensity of most intercity highway vehicles, the intensity of amplification λ = 6 is obtained. The λ is allocated according to the proportion of the six types of vehicles as shown in Table 4. The reliability P1…,Pi,…,P6 is computed by using Monte Carlo (MC) method with 106 samples, respectively, and the reliability results are shown in Table 5.
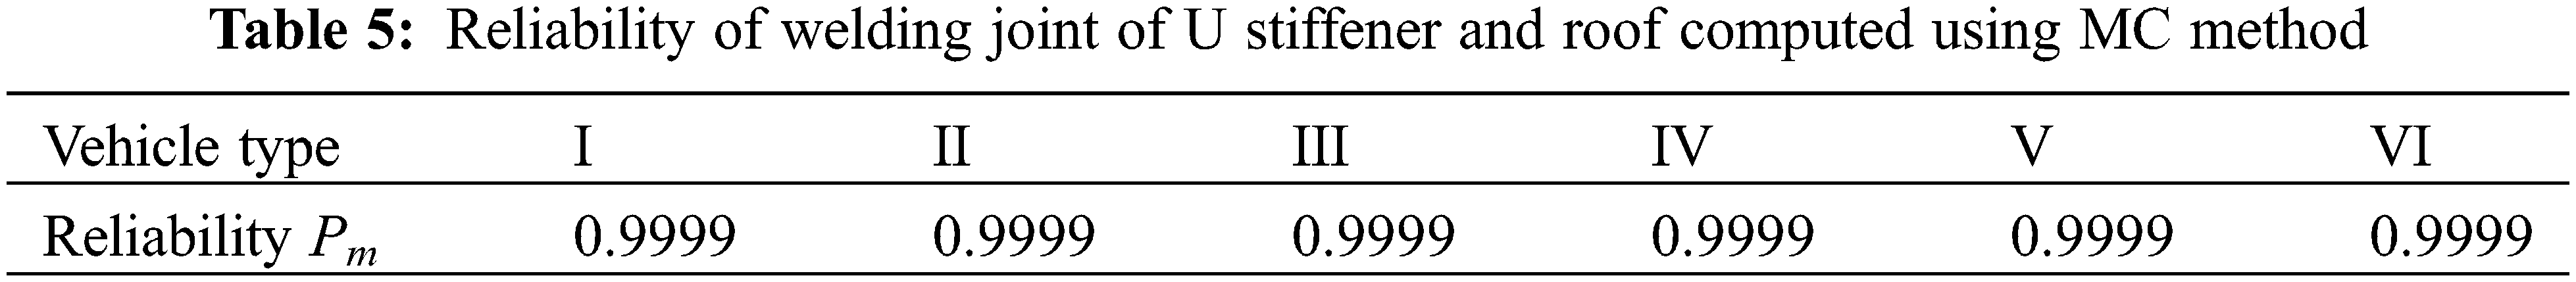
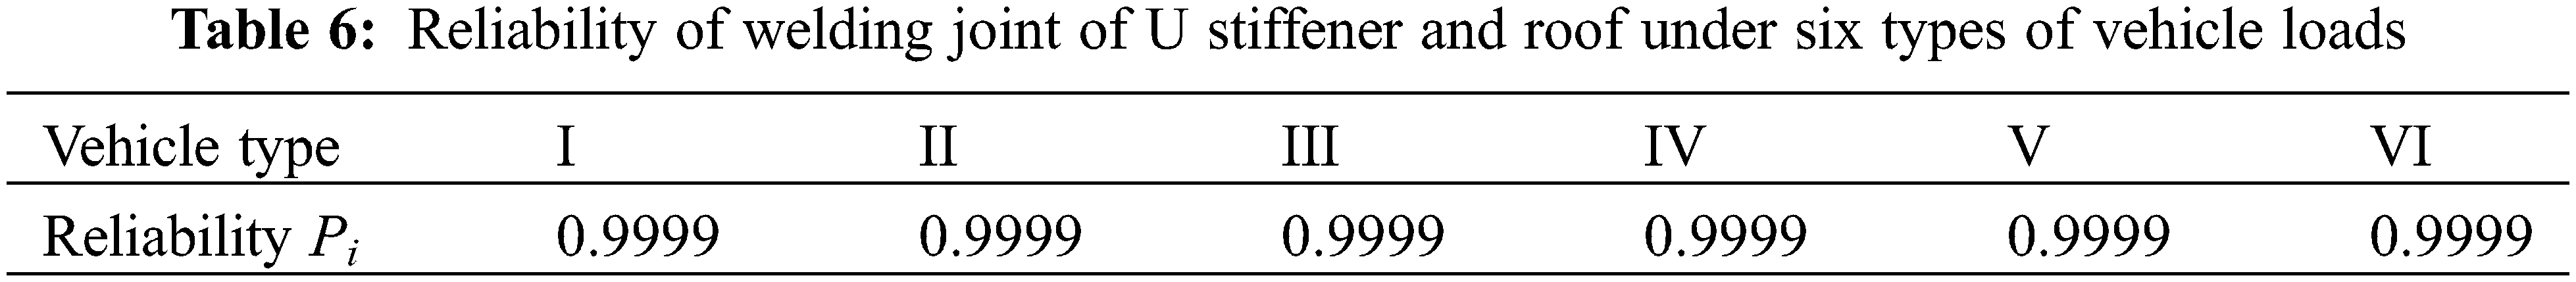
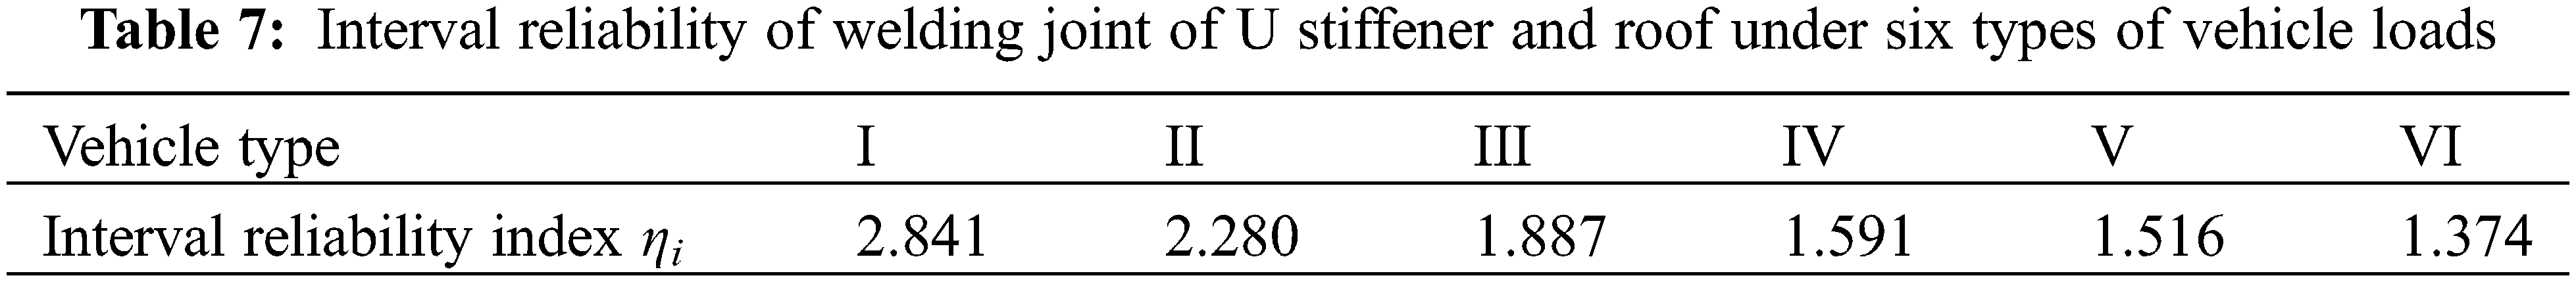
The reliability P1,…,Pi,…,P6 is computed by using Eq. (16) as shown in Table 6. As shown in Table 6, the reliabilities of the welding joint of the U stiffener and roof are 0.9999 for all types of vehicle loads. Their reliabilities are all equal to the result in Table 5. On the other hand, the structural interval reliability index is computed as shown in Table 7 by using Eq. (6). As can be seen from Table 7, the interval reliability index of the welding joint of U stiffener and roof is the lowest (1.374) for the type VI vehicle for the lifetime of the suspension bridge which is computed by using big data.
Based on Tables 6 and 7, the interval reliability index of the welding joint of U stiffener and roof for type VI vehicle is reasonably similar to the probability reliability index for the lifetime of the suspension bridge which is computed by using big data. This is because the probability distribution parameters can be accurately determined by using big data. In addition, it can also be seen that the probability reliability of the welding joint of U stiffener and roof for the type I vehicles is the highest in all probability reliabilities because of a small impact on the welding joint of U stiffener and roof due to the smallest load. The interval reliability of the welding joint of U stiffener and roof for the type I vehicles is also the highest. It is shown that the results of probabilistic reliability and non-probabilistic reliability are consistent. Non-probabilistic reliability is an effective supplement to probabilistic reliability. On the other hand, the reliability of the joint has a great influence on type VI vehicles because the load is the largest. This also puts forward corresponding requirements for the management and maintenance of the bridge, if necessary, the vehicles with larger loads must be restricted to ensure the reliability of the bridge.
Case 3
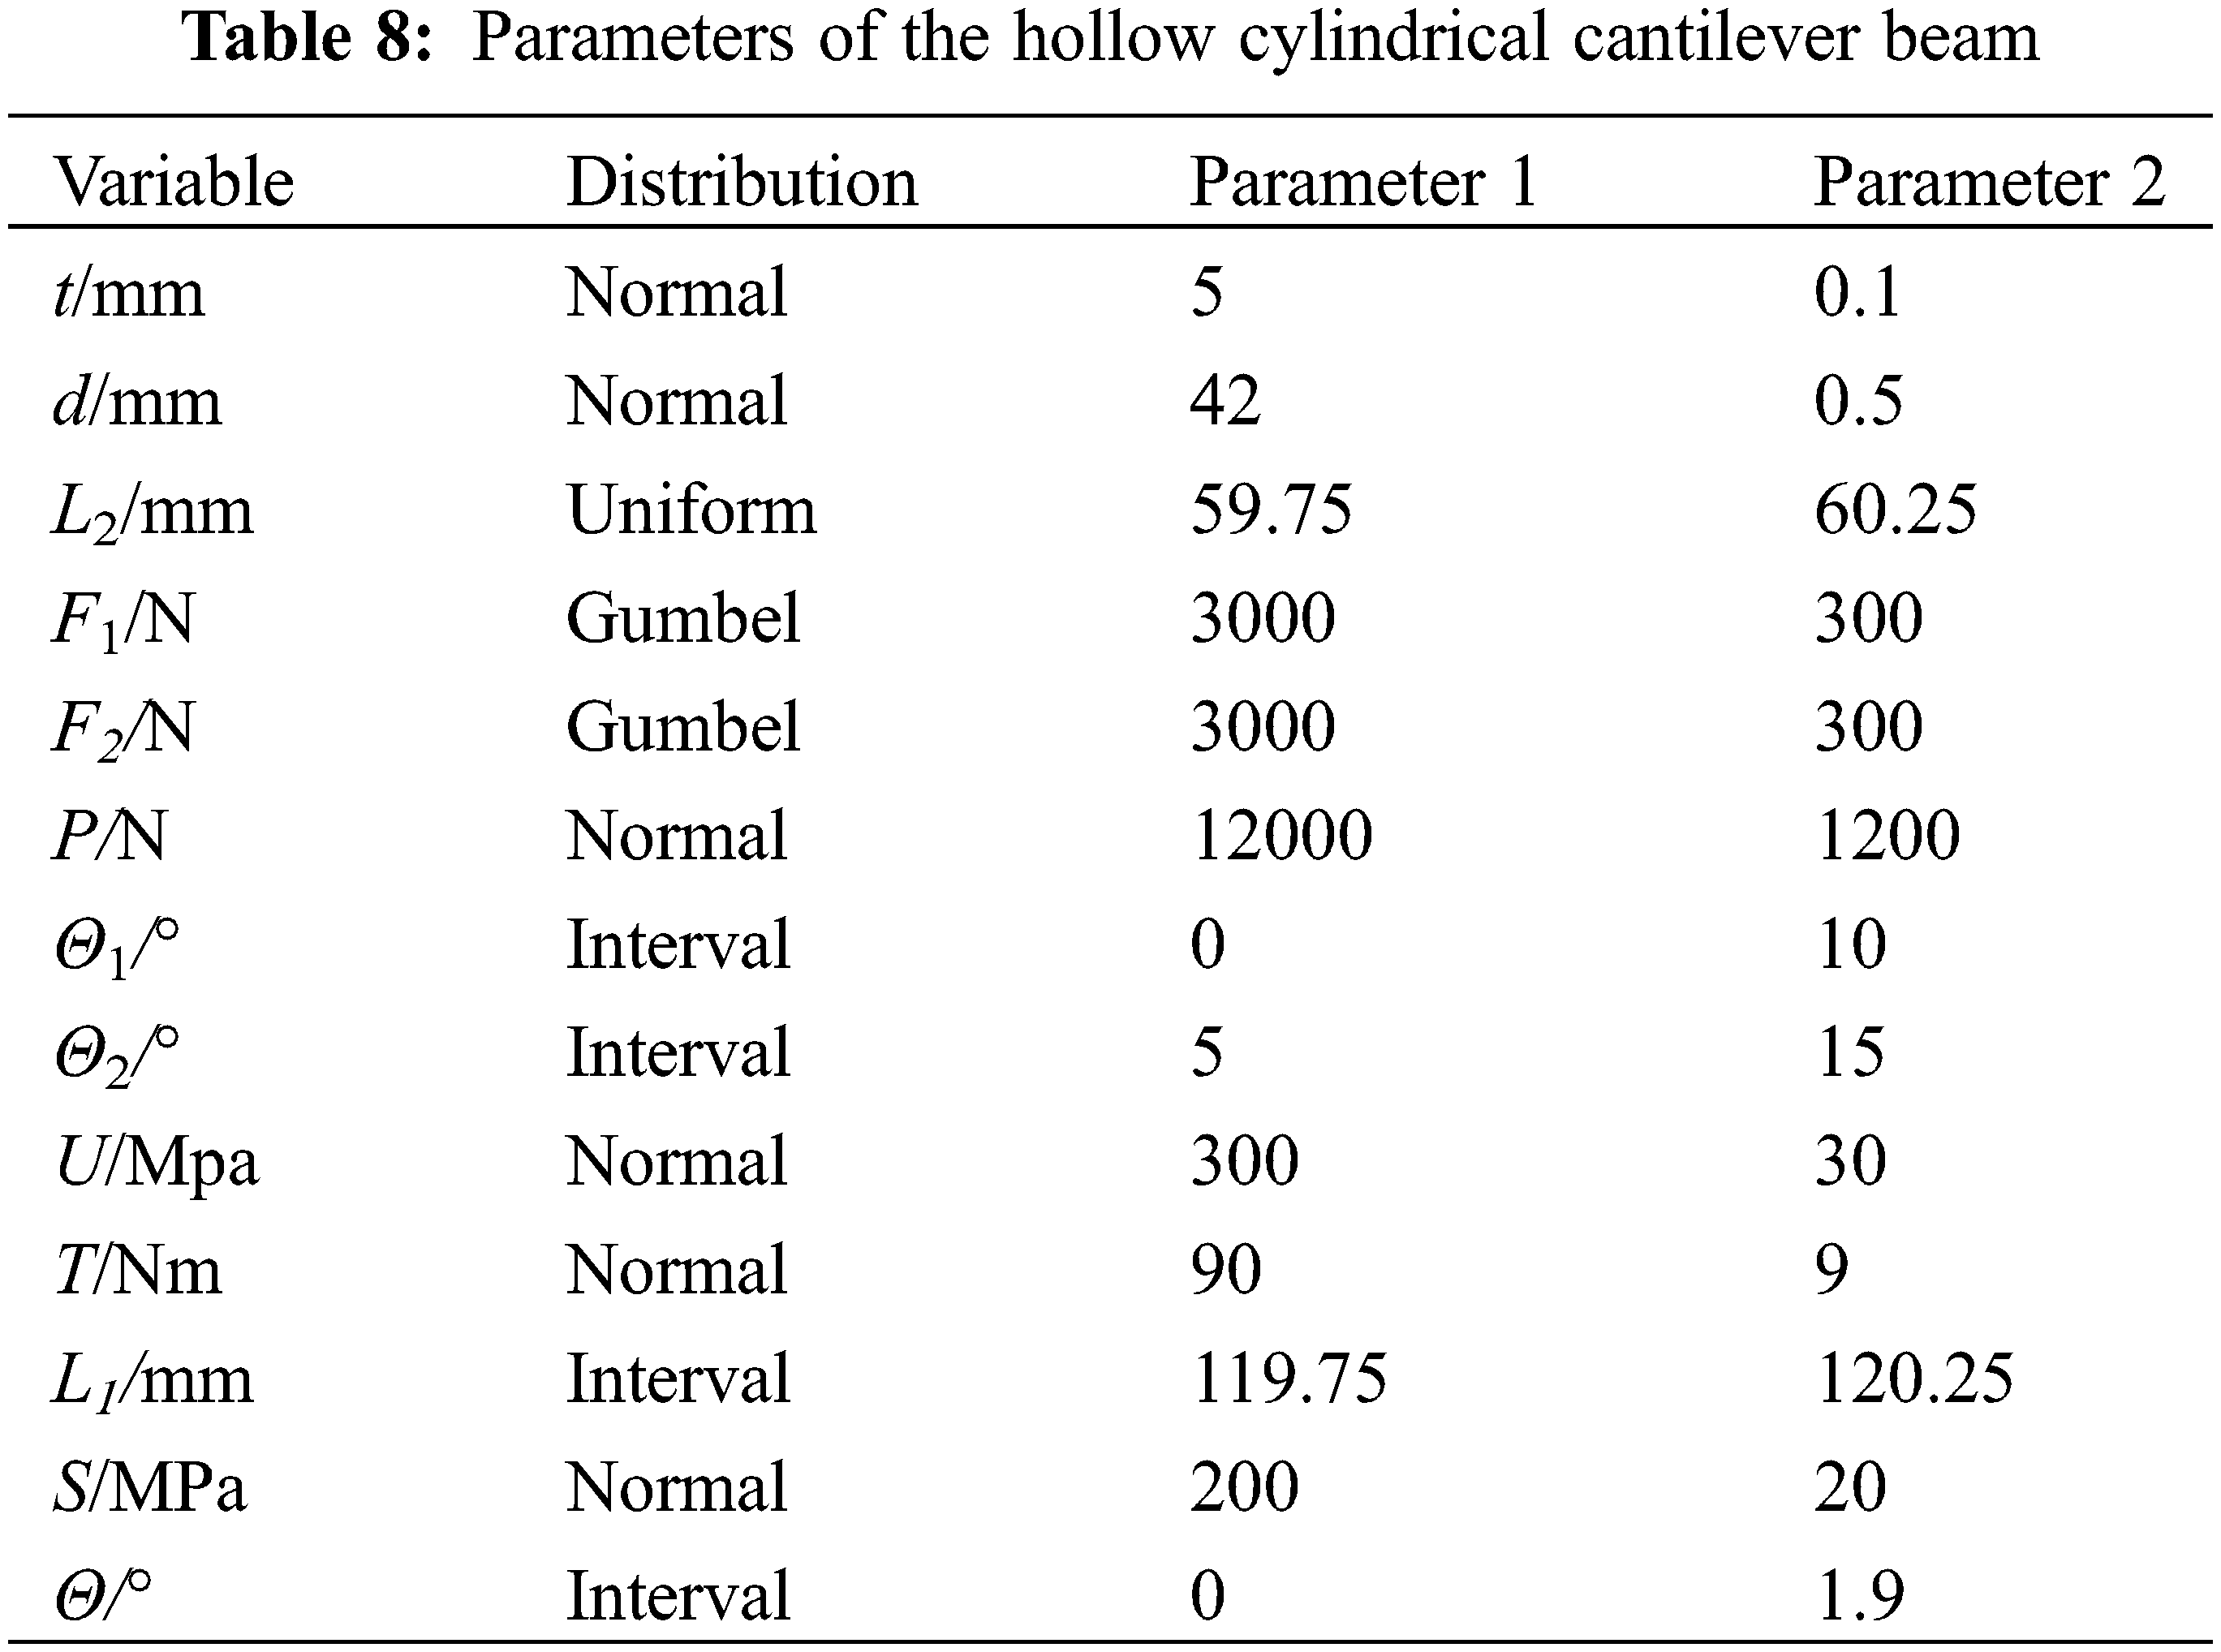
Hollow cylindrical cantilever beams (HCCB) have been widely used in engineering practice as shown in Fig. 4. The parameters of the hollow cylindrical cantilever beam are shown in Table 8. The allowable strength of the HCCB is noted as U, the allowable shear stress the HCCB is noted as τ, and the allowable deflection of the HCCB is noted as w, the allowable torsional angle of the HCCB is noted as θ, The allowable yield strength of the HCCB is noted as S. Parameters 1 and 2 are shown in Table 8. Parameter 1 is mean and Parameter 2 is standard deviation if the distribution is obeyed to the normal distribution. Parameter 1 is the lower bounds and Parameter 2 is the upper bounds if the distribution is obeyed to the uniform distribution. Parameter 1 is the positional parameter and Parameter 2 is the scale parameters if the distribution is obeyed to the Gumbel distribution. Parameter 1 is the lower bounds and Parameter 2 is the upper bounds if the parameters are intervals.
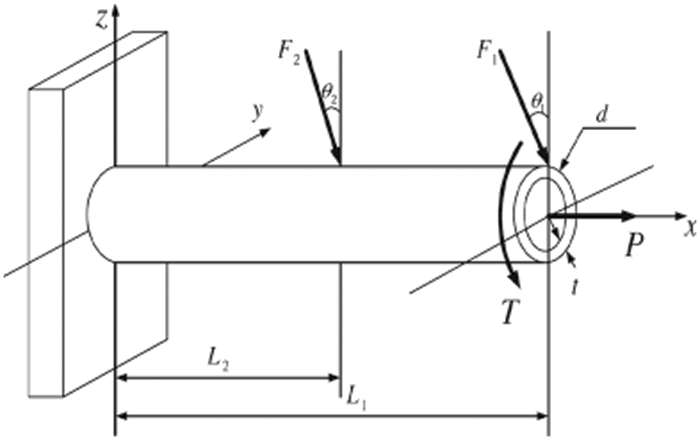
Figure 4: Hollow cylindrical cantilever beam
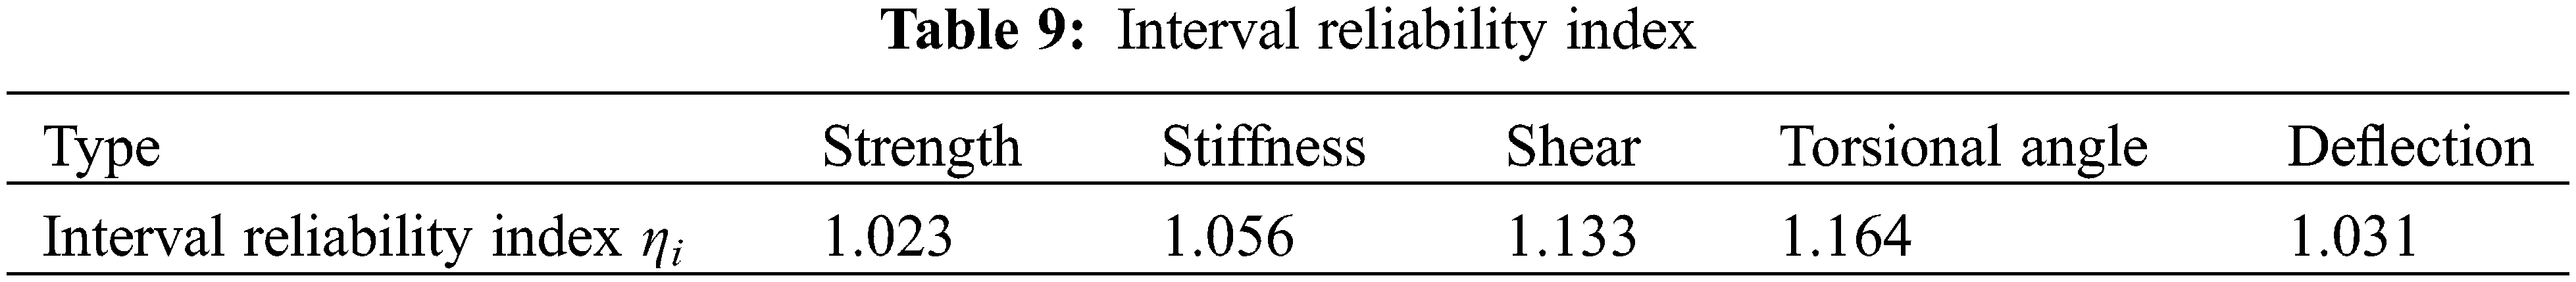
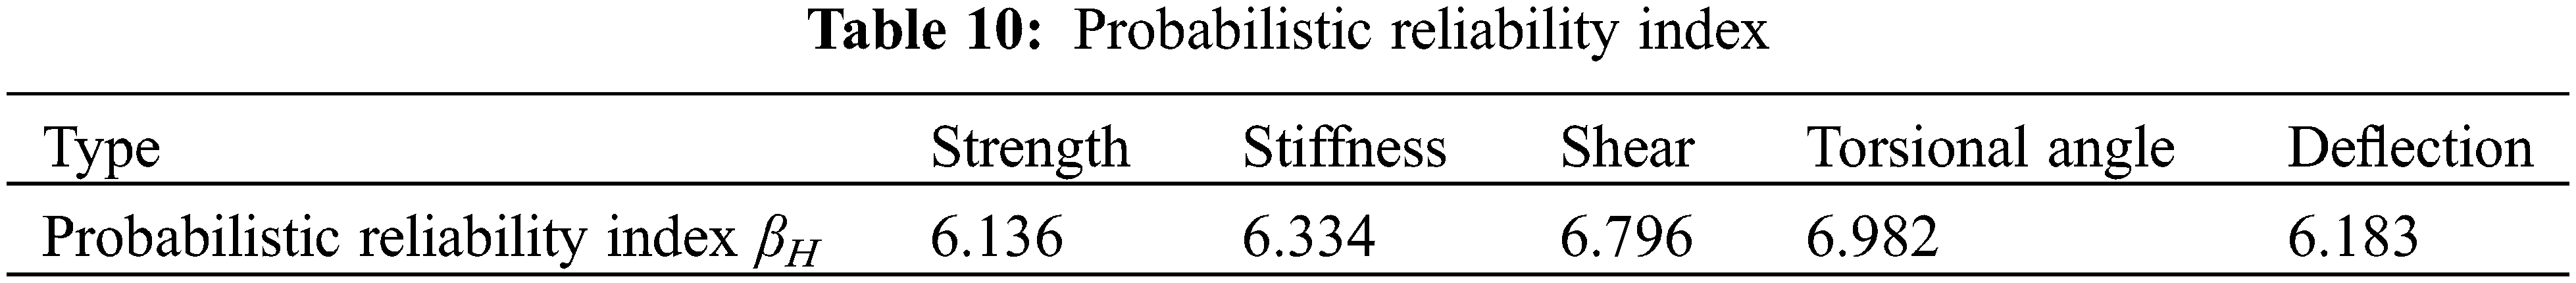
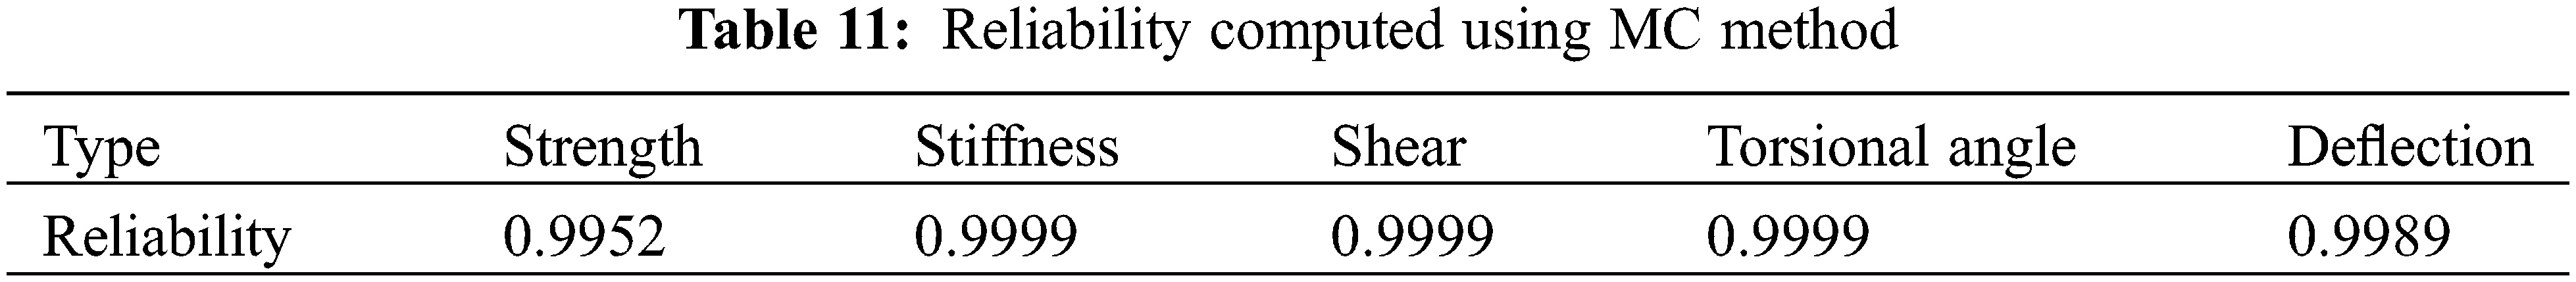
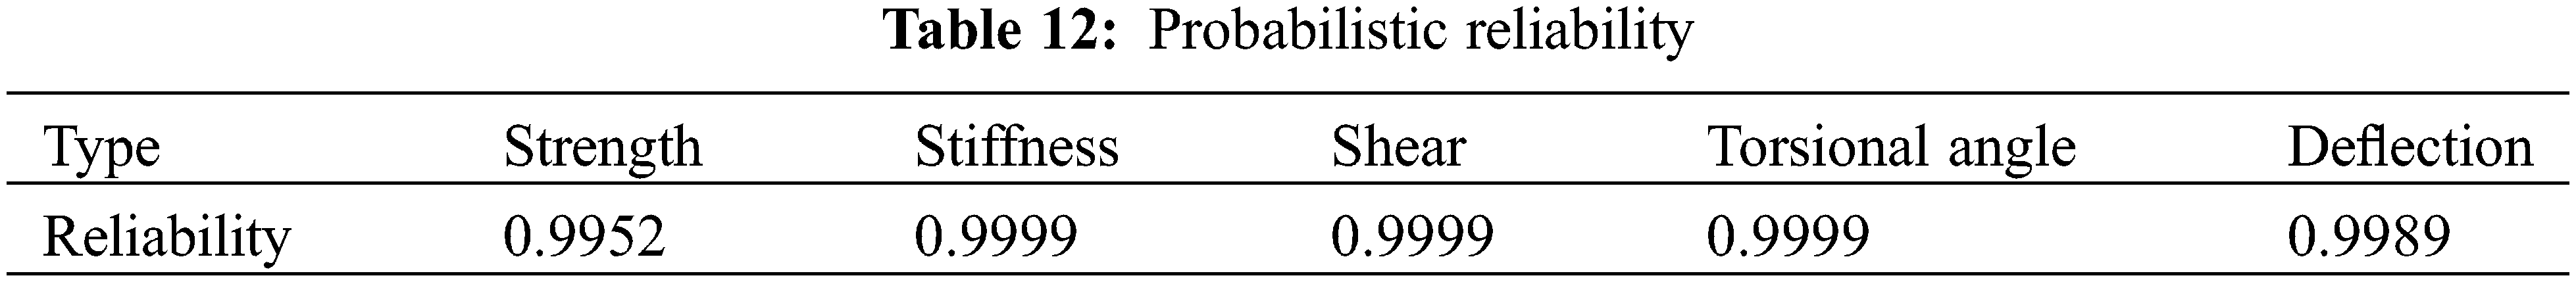
The reliabilities of the strength, stiffness, shear force, torsional angle and deflection of the HCCB are considered in this example. The interval reliability indices of the strength, stiffness, shear force, torsional angle and deflection of the HCCB are shown in Table 9. The probabilistic reliability indices of the strength, stiffness, shear force, torsional angle and deflection of the HCCB are shown in Table 10. Each reliability has been calculated by the MC method with 106 samples under big data conditions, and the reliability results are shown in Table 11. The probabilistic reliabilities of the strength, stiffness, shear force, torsional angle and deflection of the HCCB are shown in Table 12.
If only considering one of these five reliabilities, it will be a parallel system. However, by considering all these five reliabilities, it will be a series system. If three of them do not fail, then the cantilever beam does not fail. The cantilever beam will be a 3/5 voting system. The reliabilities of these systems are shown in Table 13.
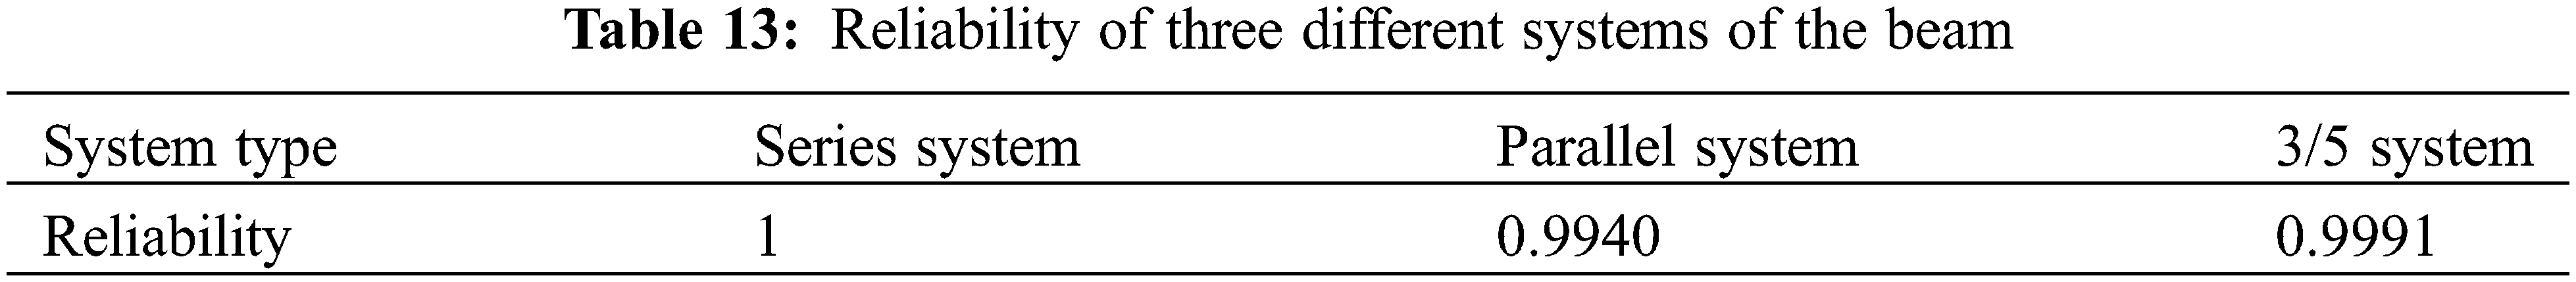
Based on Tables 9 and 10, the interval reliability indices of the strength, stiffness, shear force, torsional angle and deflection of the HCCB are reasonably similar to the probabilistic reliability indices of the strength, stiffness, shear force, torsional angle and deflection of the HCCB which were computed by using big data. It is further validated that the probabilistic reliability and non-probabilistic reliability are consistent for the same calculation example. It is further shown that non-probabilistic reliability is an effective supplement to probabilistic reliability. In fact, the reliability of the strength, stiffness, deformation and other factors of the HCCB should be considered comprehensively during the service period of the HCCB. The reliability of the HCCB should be considered as a parallel system, and its reliability is obtained as 0.9940.
(1) The collected big data has been analyzed according to its source and distribution. The different types of stress responses of the structure have been classified.
(2) The structural interval and probabilistic reliability computational models have been proposed using the stress-strength interference theory according to different types of structural stress responses and structural strength. Different structural reliabilities were computed, and the minimum of these reliabilities is the reliability of the structure.
(3) It has been shown that the proposed methods are feasible and effective. The probabilistic reliability method and interval reliability method have their advantages and disadvantages which have been shown by using the three examples under the condition of big data. The structural reliability can be obtained by using the probabilistic reliability method when the probability distribution parameters can be determined by using big data. Alternatively, the interval reliability method can be used.
(4) It should be pointed out that both the structural interval reliability method and probabilistic reliability method are no better or simpler than each other under the condition of big data, and each has different applicable conditions. They are not developed to replace each other, and the interval reliability method is a useful complement to the probabilistic reliability method under the condition of big data.
(5) The repairable system and other complex systems with random and interval parameters under big data will be studied in future work.
Funding Statement: The work described in this paper was supported in part by the Foundation from the Science Foundation, Guizhou, China (Qian Kehe [2018] 1055), and Research Foundation for Talented Scholars in Ningxia Normal University.
Conflicts of Interest: The authors declare that they have no conflicts of interest to report regarding the present study.
1. Jocic, M., Pap, E., Szakál, A., Obradovic, D., Konjovic, Z. (2017). Managing big data using fuzzy sets by directed graph node similarity. Acta Polytechnica Hungarica, 14(2), 183–200. DOI 10.12700/APH.14.2.2017.2.10. [Google Scholar] [CrossRef]
2. Storey, V. C., Song, I. I. Y. (2017). Big data technologies and management: What conceptual modeling can do. Data & Knowledge Engineering, 108, 50–67. DOI 10.1016/j.datak.2017.01.001. [Google Scholar] [CrossRef]
3. Mandawat, A., Williams, A. E., Francis, S. A. (2017). Cardio-oncology the role of big data. Heart Failure Clinics, 17, 403–408. DOI 10.1016/j.hfc.2016.12.010. [Google Scholar] [CrossRef]
4. Ouyang, Q., Wu, C., Huang, L. (2016). Research on basic principles of applications of big data in field of safety science. China Safety Science Journal, 26(11), 13–18. DOI 10.16265/j.cnki.issn1003-3033.2016.11.003. [Google Scholar] [CrossRef]
5. Koseleva, N., Ropaite, G. (2017). Big data in building energy efficiency: Understanding of big data and main challenges. Procedia Engineering, 172, 544–549. DOI 10.1016/j.proeng.2017.02.064. [Google Scholar] [CrossRef]
6. Tee, K. F., Pesinis, K. (2017). Reliability prediction for corroding natural gas pipelines. Tunnelling and Underground Space Technology, 65, 91–105. DOI 10.1016/j.tust.2017.02.009. [Google Scholar] [CrossRef]
7. Rosà, A., Chen, L. Y., Binder, W. (2017). Failure analysis and prediction for big-data systems. IEEE Transactions on Services Computing, 10(6), 983–998. DOI 10.1109/TSC.2016.2543718. [Google Scholar] [CrossRef]
8. Pehlivan, H. (2018). Frequency analysis of GPS data for structural health monitoring observations. Structural Engineering and Mechanics, 66 (2), 185–193. DOI 10.12989/sem.2018.66.2.185-. [Google Scholar] [CrossRef]
9. Fang, Y., Xiong, J., Tee, K. F. (2014). An iterative hybrid random-interval structural reliability analysis. Earthquakes and Structures, 7(6), 1061–1070. DOI 10.12989/eas.2014.7.6.1061. [Google Scholar] [CrossRef]
10. Kim, Y. J., Queiroz, L. B. (2017). Big data for condition evaluation of constructed bridges. Structures Engineering, 141, 217–227. DOI 10.1016/j.engstruct.2017.03.028. [Google Scholar] [CrossRef]
11. Bellahcene, T., Aberkane, M. (2017). Estimation of fracture toughness of cast steel container from charpy impact test data. Steel and Composite Structures, 25(6), 639–648. DOI 10.12989/scs.2017.25.6.639. [Google Scholar] [CrossRef]
12. Tee, K. F., Ekpiwhre, E. O. (2018). Reliability analysis and growth curves modelling of fielded road systems. World Review of Intermodal Transportation Research, 7(2), 168–194. DOI 10.1504/WRITR.2018.091255. [Google Scholar] [CrossRef]
13. Ponzo, F. C., Ditommaso, R., Auletta, G., Mossucca, A. (2010). A fast method for structural health monitoring of Italian reinforced concrete strategic buildings. Bull Earthquake Engineering, 8, 1421–1434. DOI 10.1007/s10518-010-9194-6. [Google Scholar] [CrossRef]
14. Reder, M., Yurusun, N. Y., Melero, J. J. (2018). Data-driven learning framework for associating weather conditions and wind turbine failures. Reliability Engineering and System Safety, 169(4), 554–569. DOI 10.1016/j.ress.2017.10.004. [Google Scholar] [CrossRef]
15. Dilip, R., Tanmoy, D. (2001). A discretizing approach for evaluating reliability of complex systems under stress-strength model. IEEE Transaction on Reliability, 50(2), 145–150. DOI 10.1109/24.963121. [Google Scholar] [CrossRef]
16. Ellishkoff, I. (1995). Essay on uncertainties in elastic and viscoelastic structures: Form A M freudenthal’s criticisms to modern convex modeling. Computers & Structures, 56(6), 871–895. DOI 10.1016/0045-7949(94)00499-S. [Google Scholar] [CrossRef]
17. Qiu, Z. (2005). Convex method based on non-probabilistic set-theory and its application. Beijing: National Defence Industry Press. [Google Scholar]
18. Schaff, J. R., Davidson, B. D. (1997). Life prediction methodology for composite structures. Journal of Composite Materials, 31(2), 127–157. DOI 10.1177/002199839703100202. [Google Scholar] [CrossRef]
19. Ben-Haim, Y. (1994). A non-probabilistic concept of reliability. Structural Safety, 14(4), 227–245. DOI 10.1016/0167-4730(94)90013-2. [Google Scholar] [CrossRef]
20. Qiao, X., Qiu, Y. (2009). Study of safety factors and non-probabilistic reliability measures of structures. Journal of Xidian University, 36(5), 916–920. DOI 10.3969/j.issn.1001-2400.2009.05.028. [Google Scholar] [CrossRef]
21. Qiu, Z., Wang, J. (2010). The interval estimation of reliability for probabilistic and non-probabilistic hybrid structural system. Engineering Failure Analysis, 17(5), 1142–1154. DOI 10.1016/j.engfailanal.2010.01.010. [Google Scholar] [CrossRef]
22. Zhuang, L. L., Xu, A. C., Pang, J. H. (2021). Product reliability analysis based on heavily censored interval data with batch effects. Reliability Engineering & System Safety, 212, 107622. DOI 10.1016/j.ress.2021.107622. [Google Scholar] [CrossRef]
23. Gao, H., Zhang, X. (2019). Reliability-based design optimization under fuzzy and interval variables based on entropy theory. Eksploatacja i Niezawodnosc–Maintenance and Reliability, 21 (3), 430–439. DOI 10.17531/ein. [Google Scholar] [CrossRef]
24. Xin, T. D., Zhao, J. G., Cui, C. Y., Duan, Y. S. (2020). A non-probabilistic time-variant method for structural reliability analysis. Proceedings of the Institution of Mechanical Engineers, Part O: Journal of Risk and Reliability, 234(5), 664–675. DOI 10.1177/1748006X20928196. [Google Scholar] [CrossRef]
25. He, X., Shi, W., Li, W., Luo, H., Zhao, R. (2017). Reliability enhancement of power electronics systems by big data science. Proceeding of the CSEE, 37(1), 209–221. DOI 10.13334/j.0258-8013.pcsee.161782. [Google Scholar] [CrossRef]
26. Ekpiwhre, E. O., Tee, K. F., Aghagba, S. A., Bishop, K. (2016). Risk-based inspection on highway assets with category 2 defects. International Journal of Safety and Security Engineering, 6(2), 372–382. DOI 10.2495/SAFE. [Google Scholar] [CrossRef]
27. Chen, Q. (2016). Evaluation and analysis of expressway traffic operation state driven by big data (Ph.D. Thesis). Changan University, Xi’an, China. [Google Scholar]
28. Yazdanpanah, O., Seyedpoor, S. M., Akbarzadeh, H. (2015). A new damage detection indicator for beams based on mode shape data. Structural Engineering and Mechanics, 53(4), 725–744. DOI 10.12989/sem.2015.53.4.725. [Google Scholar] [CrossRef]
29. Fang, Y., Wen, L., Tee, K. F. (2014). Reliability analysis of repairable k-out-n system from time response under several times stochastic shocks. Smart Structures and Systems, 14(4), 559–567. DOI 10.12989/sss.2014.14.4.559. [Google Scholar] [CrossRef]
30. Fang, Y., Xiong, J., Tee, K. F. (2015). Time-variant structural fuzzy reliability analysis under stochastic loads applied several times. Structural Engineering and Mechanics, 55(3), 525–534. DOI 10.12989/sem.2015.55.3.525. [Google Scholar] [CrossRef]
31. Fang, Y., Tee, K. F., Cheng, Z., Yong, X. (2021). Computational method and simulation of reliability for series, parallel, and k-out-of-n systems with interval parameters. Mathematical Problems in Engineering, 2021, 5713902. DOI 10.1155/2021/5713902. [Google Scholar] [CrossRef]
32. Ma, R., Xu, S., Wang, D., Chen, A. (2017). Big data-based fatigue life analysis of steel box girder in large-span suspension bridge. Journal of South China University of Technology, 45(6), 66–73. DOI 10.3969/j.issn.1000-565X.2017.06.011. [Google Scholar] [CrossRef]
33. Mahmoodian, M., Alani, A. M., Tee, K. F. (2012). Stochastic failure analysis of the gusset plates in the Mississippi River bridge. International Journal of Forensic Engineering, 1(2), 153–166. DOI 10.1504/IJFE.2012.050415. [Google Scholar] [CrossRef]
Appendix. Algorithm of Interval Number and Interval Function
The original intention of the interval algorithm was used to calculate the reliability of the structure, but people soon discovered that the interval algorithm can have a wider range of applications. In interval mathematics, all variables can be considered as an interval quantity and the uncertain factors of the variables are converted into intervals. Due to the set properties of the interval itself, the set operations between the intervals can be easily implemented.
Interval analysis is a set of operation rules defined on the interval. Its main feature is that it can process uncertain data, automatically record the truncation and rounding errors generated in computer floating-point operations, and efficiently and reliably estimate the value range of a function in a certain independent variable area, so it is widely used in all areas of science. Interval analysis emerged in the 1960s and has been widely used in computer graphics and computer-aided design since the early 1980s.
There are two real numbers
For two intervals
The
If
The mean of the interval number is given as follows:
The dispersion of the interval number is given as follows:
The interval
where
These are the rules for the addition, subtraction, multiplication, and division of two intervals.
Let
If
On the other hand, if
If f(x) is a non-singular increasing or decreasing function in the interval I, then the algorithm of f(x) − f(xI) can be written as follows:
where fmin(x) and fmax(x) is the minimum and maximum value of the function in the interval f(x), respectively.
The four arithmetic operations of the interval can be satisfied with some algebraic properties of the four arithmetic operations on real numbers, such as the associative and commutative laws of addition and multiplication. However, the law of distribution does not always hold. In general, the following equation does not hold, that is as follows:
However, the following sub-distributive law expression is true, that is as follows:
where,“⊆” is containment relationship, xI⊆ yI, yl ≤ xl ≤ xu ≤ yu, the interval yI is contained to the interval xI.
If there are some common parts in the interval xI, yI ∈ I(R), the two intervals have an intersection. It can be shown as follows:
If
Based on the above, it is obtained that in the interval calculation process, the arithmetic operation of the interval is closed, and the set operation of the interval is also closed. However, their algebraic properties are different from the algebraic properties of real numbers. When performing interval operations, the following expressions should be given special attention to, otherwise, serious errors may occur.
 | This work is licensed under a Creative Commons Attribution 4.0 International License, which permits unrestricted use, distribution, and reproduction in any medium, provided the original work is properly cited. |