| Structural Durability & Health Monitoring |
DOI: 10.32604/sdhm.2022.018422
ARTICLE
PSO-LSSVM-based Online SOC Estimation for Simulation Substation Battery
1State Grid Jiangsu Electric Power Co., Ltd., Nanjing, 210024, China
2State Grid Jiangsu Electric Power Company Research Institute, Nanjing, 211103, China
3Technican Training Center of State Grid Jiangsu Electric Power Co., Ltd., Suzhou, 215004, China
*Corresponding Author: Ning Ji. Email: gitanjali1985@163.com
Received: 11 August 2021; Accepted: 10 December 2021
Abstract: As the emergency power supply for a simulation substation, lead-acid batteries have a work pattern featuring non-continuous operation, which leads to capacity regeneration. However, the accurate estimation of battery state of charge (SOC), a measurement of the amount of energy available in a battery, remains a hard nut to crack because of the non-stationarity and randomness of battery capacity change. This paper has proposed a comprehensive method for lead-acid battery SOC estimation, which may aid in maintaining a reasonable charging schedule in a simulation substation and improving battery’s durability. Based on the battery work pattern, an improved Ampere-hour method is used to calculate the SOC during constant current and constant voltage (CC/CV) charging and discharging. In addition, the combined Particle Swarm Optimization (PSO) and Least Squares Support Vector Machine (LSSVM) model is used to estimate the SOC during non-CC discharging. Experimental results show that this method is workable in online SOC estimation of working batteries in a simulation substaion, with the maximum relative error standing at only 2.1% during the non-training period, indicating a high precision and wide applicability.
Keywords: Simulation substation; lead-acid batteries; SOC; PSO; LSSVM
As the hub of the power grid, substations are responsible for power supply for different regions, which makes training on substation operation and maintenance crucial. By combining the transformed primary equipment and a simulation platform, we can create a simulation substation for trainees. The DC power supply system is an important part of a simulation substation, as it powers relay protection devices, switch control devices, simulation operation equipment, etc. [1] The simulation substation can maintain normal operation when the AC power supply fails. In addition, as a key component of the DC power supply system, batteries can be used as a backup power supply in case of a power failure of the simulation substation. Therefore, real-time monitoring of battery SOC is a key technology to ensure safe operation of simulation substation and stability of power grid, as well as a key part of simulation substation construction.
Since the French physicist Gaston Plante invented the world’s first rechargeable battery based on lead-acid chemistry in 1859, the lead-acid battery has been gaining momentum and applied in more and more scenarios due to its high safety, low cost, stable operation and long service life [2,3]. When it is woven into the fabric of our daily life, the research on the lead-acid battery SOC comes under the spotlight. At present, lead-acid batteries can be roughly divided into three categories by application: (1) start and traction type, which is used for starting or traction of automobiles, motorcycles, and electric tools; (2) backup type, which is applied in substation DC systems, communication base stations and computer systems; (3) energy storage type, which is applied in the wind or solar power generation [4]. This paper delves into the lead-acid battery for simulation substations and batteries mentioned in this paper all refer to lead-acid batteries.
So far, there has been a lot of in-depth research in the field of SOC estimation at home and abroad. Wang et al. [5–7] proposed an extended Kalman filter algorithm for accurate SOC estimation based on different temperature conditions. In the range of −20°C to 40°C, the battery temperature data is collected and the model parameters of the battery are associated to realize the online parameter estimation of open circuit voltage (OCV). The final relative error of SOC estimation is just 3%. However, the problem of parameter deviation arising from battery aging fails to be solved. In order to fully exploit the capacity of batteries in the application of power storage, Cacciato et al. [8] realized the joint online estimation of the battery SOC and state of health (SOH) by establishing an electrochemical model of the battery. The relative error is less than 3%, but the electrochemical model entails a lot of mathematical formula calculations and modeling, which brings down the applicability. He et al. [9,10] proposed an electromotive force (EMF) method combined with recursive least-squares (RLS) for online estimation of OCV and SOC of Li-ion batteries. However, adaptive systems also operate with the drawback of having a high computational load, which complicates the online running of the model on a real application.
Lead-acid batteries in the DC system of a simulation substation are charged/discharged in either CC model or non-CC model. CC means that the working current of the lead-acid battery changes slightly in a continuous period of time. Non-CC means that the working current of the lead-acid battery is always changing at a fast rate and in a high amplitude [11]. For example, the battery load may increase or decrease during discharging, which will lead to the instability of the discharge current. In order to achieve a better effect on battery SOC estimation, this paper proposes a comprehensive method to estimate the battery SOC under the CC and non-CC models.
There are many factors that affect the durability of batteries, such as the SOC window and temperature control etc. The most important one is the SOC window of the battery cell. The SOC window refers to the reasonable upper and lower bound of the SOC during charging and discharging. The SOC window range is 30%–70% [12]. Only by accurate SOC estimation can the battery power be managed strictly in accordance with the SOC window. The battery cell working in a reasonable SOC window will slow down the edge polarization phenomenon and improve the battery cell durability, which extends the service life of the battery [13].
2 SOC Calculation during CC/CV Charging and Discharging
The calculation formula based on the Ampere-hour method is as follows:
where
Due to the limitation of the Ampere-hour method [14], this paper will correct the influence of temperature and the charge and discharge current on the Ampere-hour method in the process of battery charging and discharging.
2.1 SOC Calculation during CC Discharging
In China, the standard temperature for the rated capacity of a lead-acid battery is generally 25°C. When the temperature changes, the available battery capacity will have a certain difference from the rated capacity. At present, the common compensation coefficient formula is:
where
where
The rated battery capacity refers to the amount of electricity discharged from the battery to the cut-off voltage at a current of 0.05 C (20-h discharge rate). When the working current of the battery is greater than 0.05 C, the total energy released at the discharge cut-off voltage is less than the rated capacity [15]. The discharge efficiency is the ratio of the discharged capacity to the full capacity. According to the actual discharging test, the discharge efficiency of the battery under different discharge currents is obtained as shown in Fig. 1.
Figure 1: Relationship between discharge efficiency and discharge rate
MATLAB is used to fit the curve of Fig. 1, the discharge efficiency
Without considering the temperature, we can obtain the following equation from Eq. (4):
where
2.2 SOC Calculation during CC/CV Charging
The battery charging usually has three stages: CC charging, CV charging and floating charging.
The CC model is used firstly, so that the battery voltage can reach a certain amplitude as soon as possible. When the battery voltage reaches a certain voltage value, the CV model should take over, as continued CC charging will lead to water electrolysis (produce hydrogen and oxygen gases and elevate the battery temperature), instead of improving the charging efficiency. At this time, the charging voltage remains unchanged, but the charging current starts to taper off. In the process of CV charging, the magnitude of the current is similar to the MAS theoretical curve, as shown in Fig. 2. When the charging current exceeds the acceptance curve, gas evolution will occur and the charging efficiency does not improve. Only when the charging current is below the acceptance curve can the adverse reaction of the battery be reduced during the charging process and the battery be fully used. The formula of MAS curve is as follows [16]:
Figure 2: MAS charging curve
where
where
Figure 3: Relationship between charging efficiency and CC charging current
Figure 4: Relationship between charging efficiency and CV charging voltage
The least square method of MATLAB is used to fit the curve:
where V is the voltage during CV charging.
The charging process is also affected by temperature. The charging voltage needs to decrease by 4 mV (2 V battery) for every 1°C rise in temperature (based on the standard temperature of 25°C); the charging voltage needs to increase by 4 mV (2 V battery) for every 1°C drop in temperature [19]. Temperature affects the change of charging voltage, thereby indirectly affects the charging efficiency. Therefore, considering the temperature factor during CV charging, Eq. (11) can be changed into:
where
Therefore, the calculation formula of SOC during charging is:
where
3 Method for Battery SOC Estimation during Non-CC Discharging
Non-CC discharging refers to a process where the discharge current will change with the increase or decrease of the battery load in actual use [20]. During the training process of a simulation substation, the DC power supply system supplies power for relay protection devices, switch control devices, simulation operation equipment, etc. In this case, the calculation based on the improved Ampere-hour method is not accurate enough because of the integral error caused by the instability of the discharge current. In order to accurately calculate the discharge capacity under the unstable discharge current, the PSO-LSSVM model is used to estimate the battery SOC for a simulation substation during non-CC discharging.
The LSSVM method can obtain the optimal result when the linear target is interfered with by Gaussian noise, so it is often used to fit the numerical points in the plane [21–23]. With the least square method, training data can be transformed into a higher-dimensional feature space through nonlinear mapping, thus forming a hyperplane and making the data linearly separable. The least square method can be used to obtain the optimal solution and extract the data information. Therefore, LSSVM demonstrates its superiority over the standard SVM.
In the sample sets
Assume the regression function in the case of nonlinearity is:
where
where
To solve the above optimization problem, the Lagrange multiplier method is used:
where
Derivate
According to (18), the linear equations about
where
Then the following regression estimation function can be obtained:
where
The Kernel Function affects the estimation accuracy of LSSVM to a great extent. The Kernel Functions of LSSVM are generally Radial Basis Kernel Function (RBF), Linear Kernel Function (LKF), and Polynomial Kernel Function (PKF) and so on [25]. The Kernel Function formula is as follows:
where d is the degree of polynomial and
PSO is used to optimize the parameters of Kernel Function in order to avoid error caused by experience and random selection. PSO is to find the optimal solution by iteration from the perspective of a random solution where fitness is used to measure the quality of the optimal solution. It can find the global optimal solution by following the current optimal value [26–28]. Each particle represents a solution that contains a position vector and a velocity vector. For any particle i, the position vector is
In this algorithm, the following formula is used for iteration:
where m is the weight coefficient;
The weight parameter m should be selected appropriately in order to balance the local and global search. It should gradually change from
where H is the maximum number of iterations.
3.3 Principle of Internal Resistance Test
Internal resistance is an important parameter for battery SOC estimation. In this paper, a 6 V, 4,500 mAH battery is discharged in stages with different currents. The internal resistance of the battery is measured by the Kelvin detection method. The excitation signal input and the voltage measurement are realized by two different wires, respectively, as shown in Fig. 5. This can reduce the influence of the wire resistance in the detection circuit branch of the battery terminal voltage on the calculation of the battery internal resistance. Although the wire also has a voltage drop, the current on the terminal voltage measurement branch is very small, so the voltage drop on the wire at this time has little effect on the calculation of the AC voltage drop of the battery. In Fig. 5,
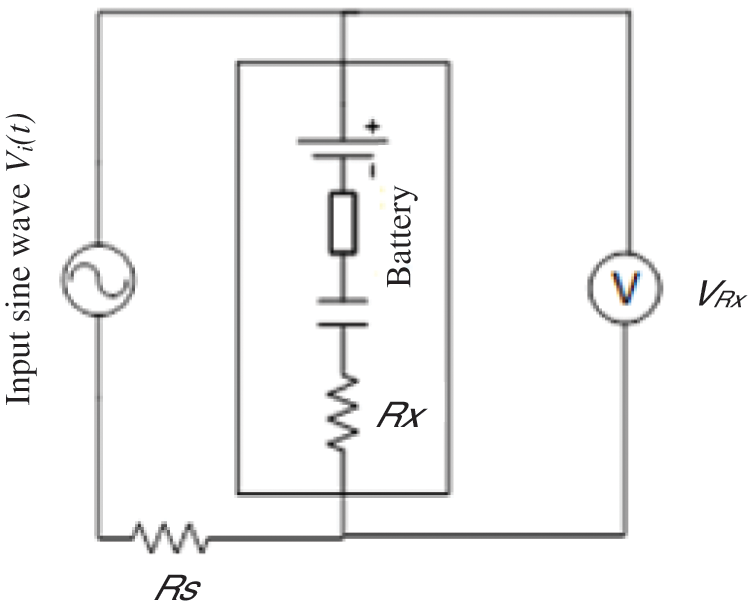
Figure 5: Schematic diagram of Kelvin method for detecting AC internal resistance of the battery
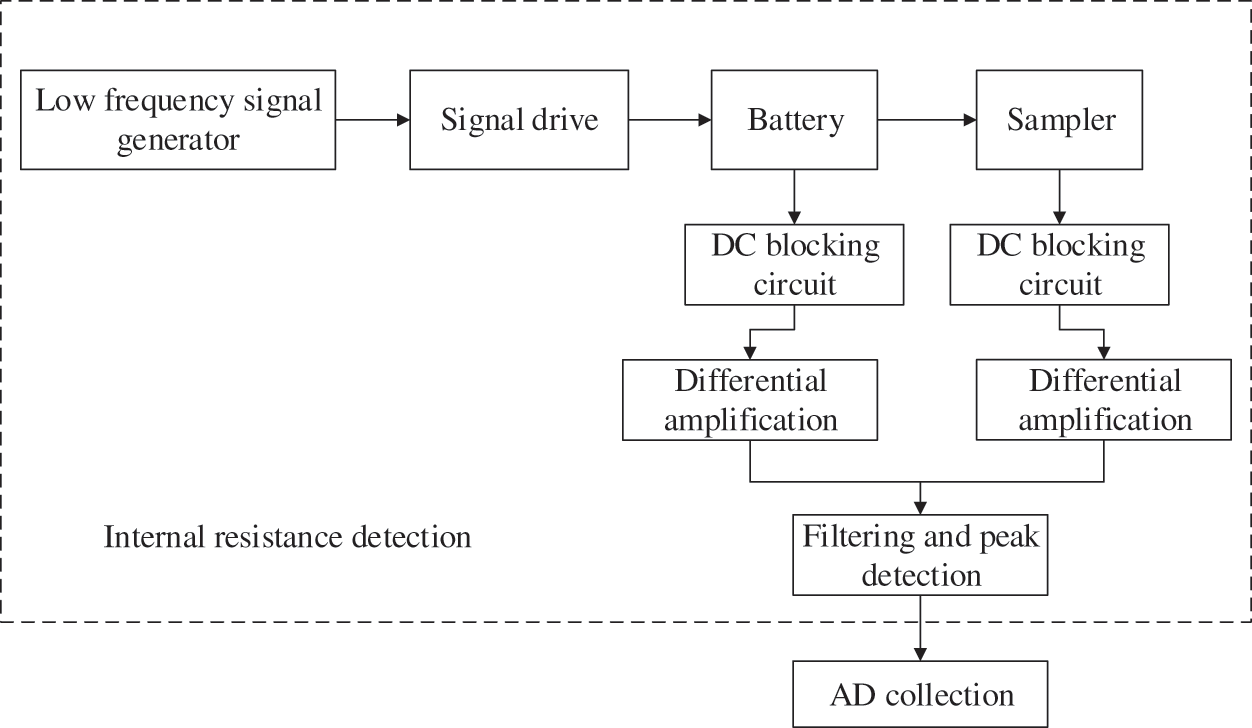
Figure 6: Internal resistance detection process
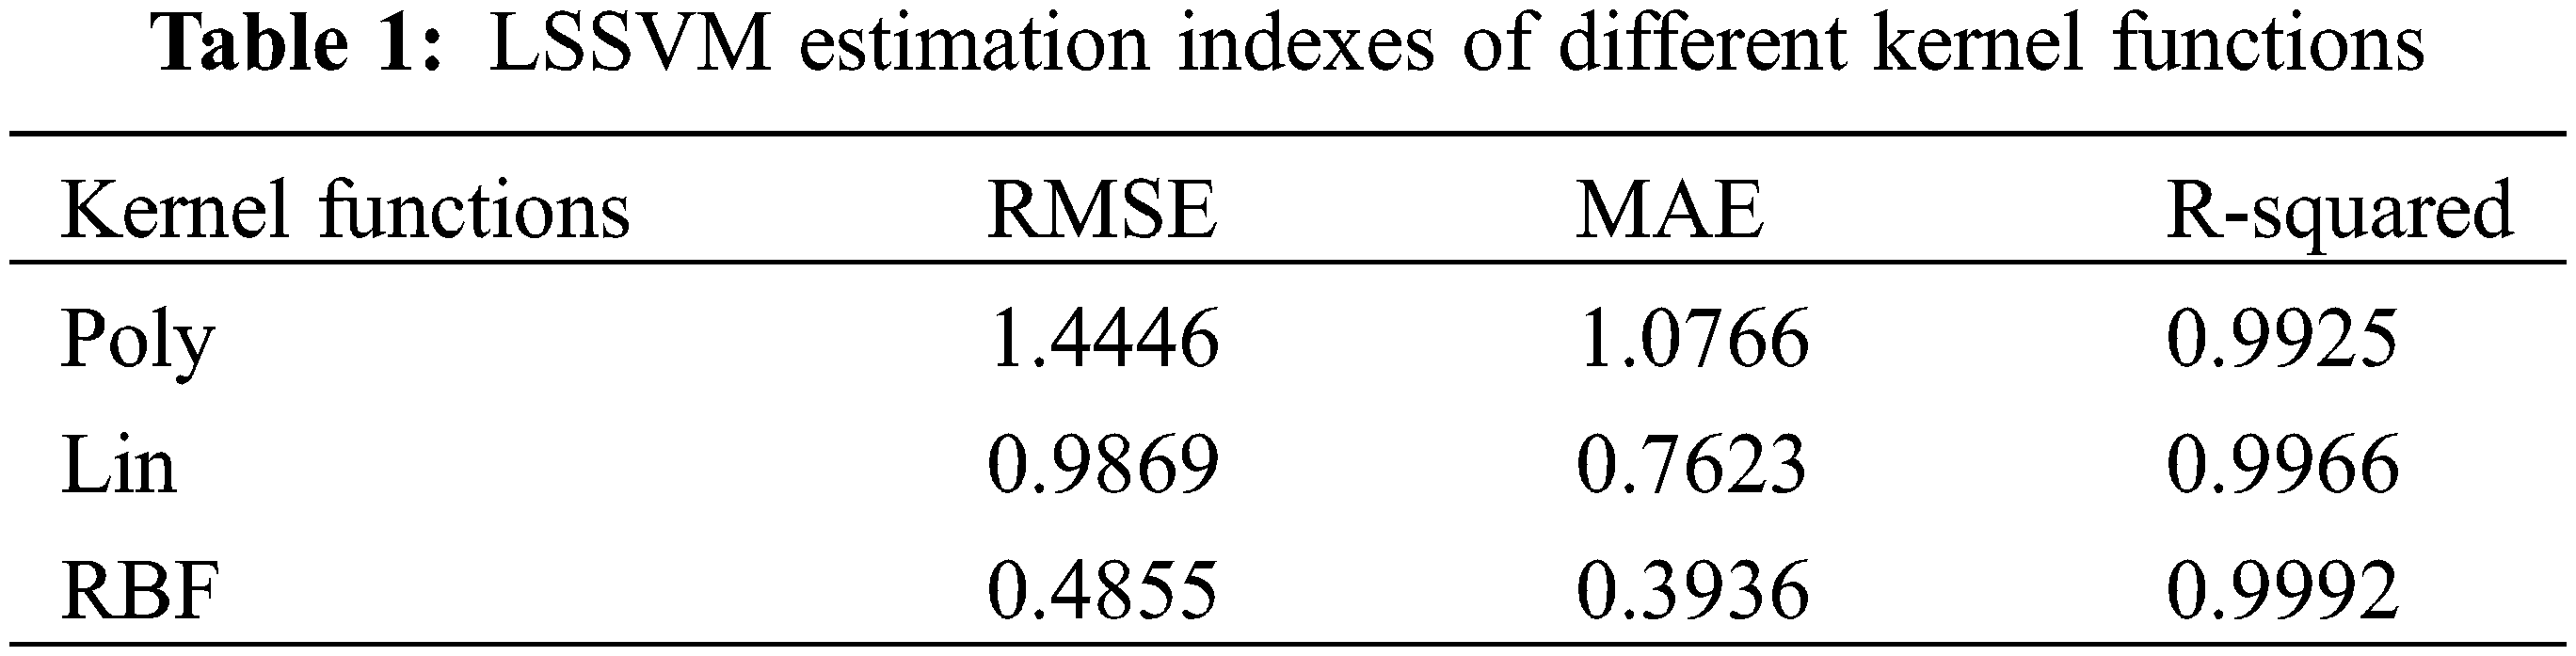
Three kernel functions are used to estimate the SOC, and the results are compared in order to ensure the accuracy of model estimation. The evaluation indexes of the regression algorithm are generally Root Mean Square Error (RMSE), Mean Absolute Error (MAE), and R-Squared. The LSSVM estimation results of different kernel functions are compared based on these three indexes. Figs. 7−9 show the battery SOC estimation results calculated based on the LSSVM algorithm with Poly, Lin, and RBF as the core functions respectively. Table 1 shows the evaluation indexes of different kernel functions.
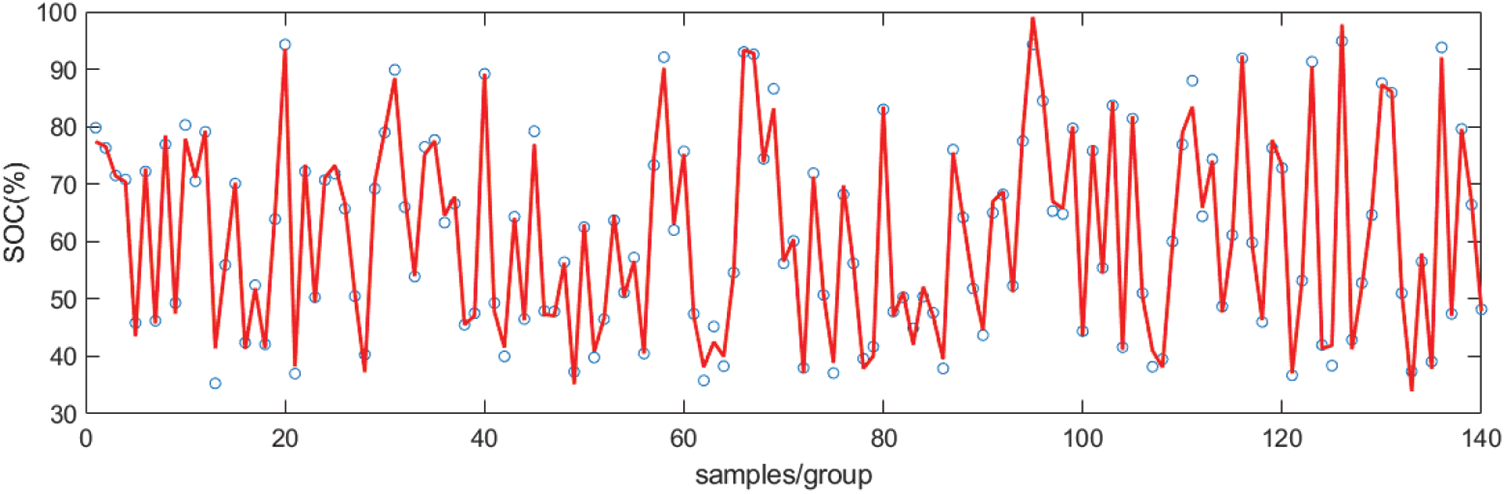
Figure 7: SOC estimation result based on Poly
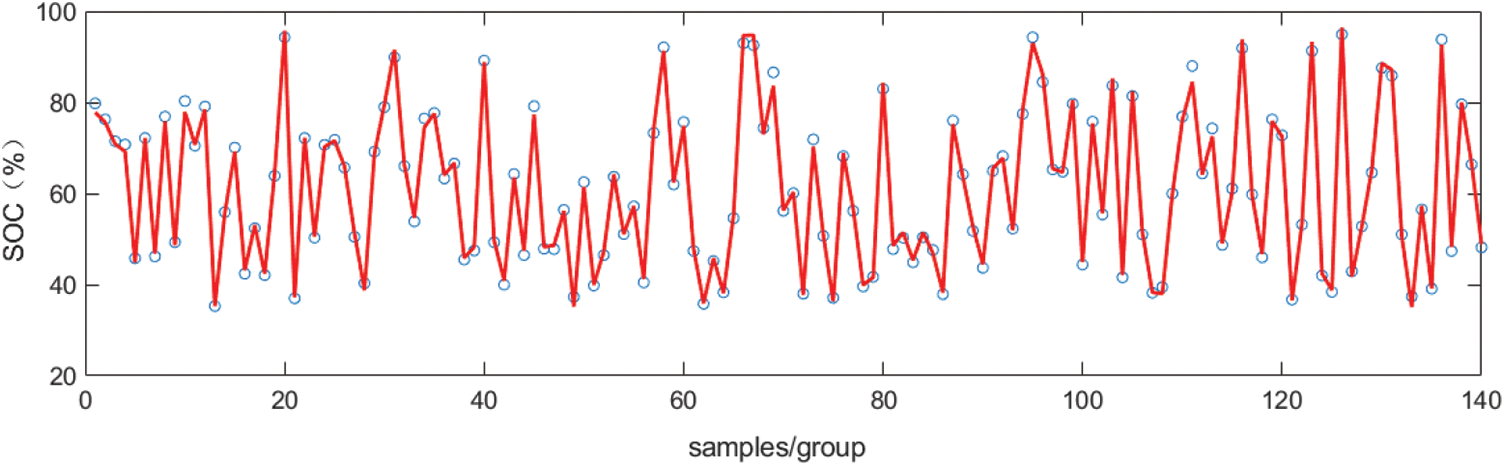
Figure 8: SOC estimation result based on Lin
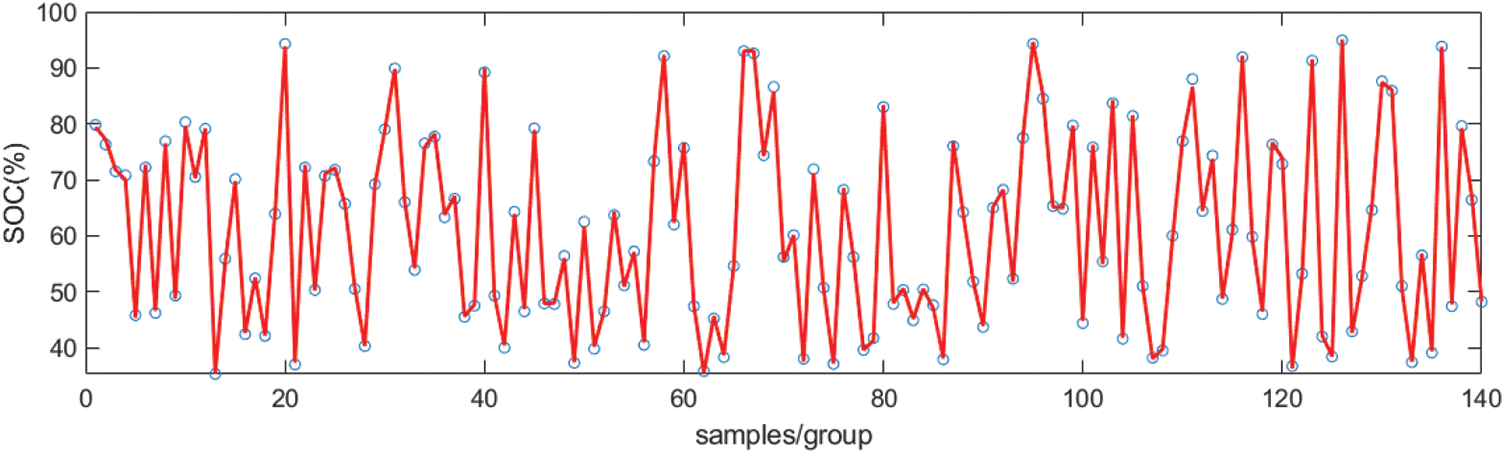
Figure 9: SOC estimation result based on RBF
According to the evaluation indexes in Table 1 and the estimation results shown in Figs. 7–9, the result is the best when RBF is selected for LSSVM. In the three figures, the discrete points are the true SOC values, and the solid lines are the online estimation results. In order to further compare the advantages and disadvantages of the three kernel functions, the relative errors of the estimated values of different kernel functions are compared, as shown in Fig. 10. It can be seen that the relative error of the estimated value of RBF is significantly less than that of Poly and Lin, so this paper decides to select RBF as the kernel function for the LSSVM model.
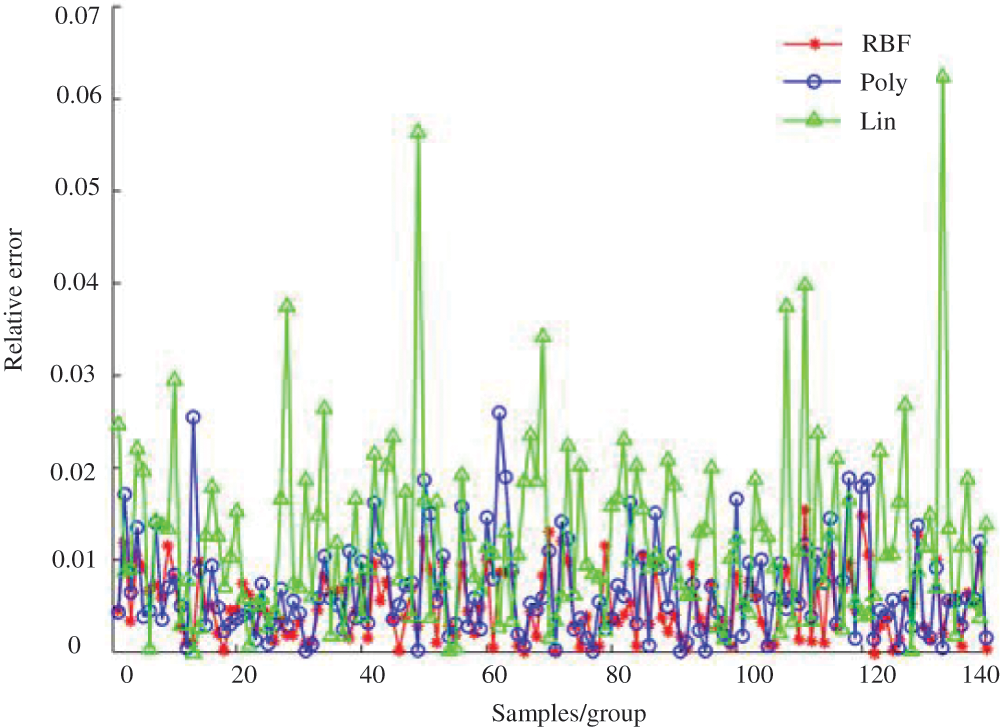
Figure 10: Relative error of SOC estimation under different kernel functions
It can be seen from the relationship between the OCV and the capacity of the battery, when the same capacity is discharged on the basis of different remaining capacities, the OCV drops at different rates. In addition, different discharge rates lead to different voltage drop rates. There could be a voltage recovery when the discharge current switches from high to low. At this time, the internal temperature of the battery will decrease, thereby reducing the energy loss. There is a close correspondence between a battery’s working voltage and its OCV, so for non-CC discharging, the terminal voltage difference and the discharge time in the current fluctuation period are used as the input of the estimation algorithm.
Based on the comprehensive analysis of various influencing factors of the battery, this paper proposes a PSO-LSSVM model for SOC estimation during non-CC discharging based on four indicators: battery internal resistance, terminal voltage difference, temperature, and discharge time. The internal resistance is obtained by the self-built four-terminal Kelvin testing equipment. Current, terminal voltage, temperature and other parameters are detected by Neware’s high-performance battery detection equipment. The experimental environment is shown in Figs. 11 and 12. The input variable of PSO-LSSVM is
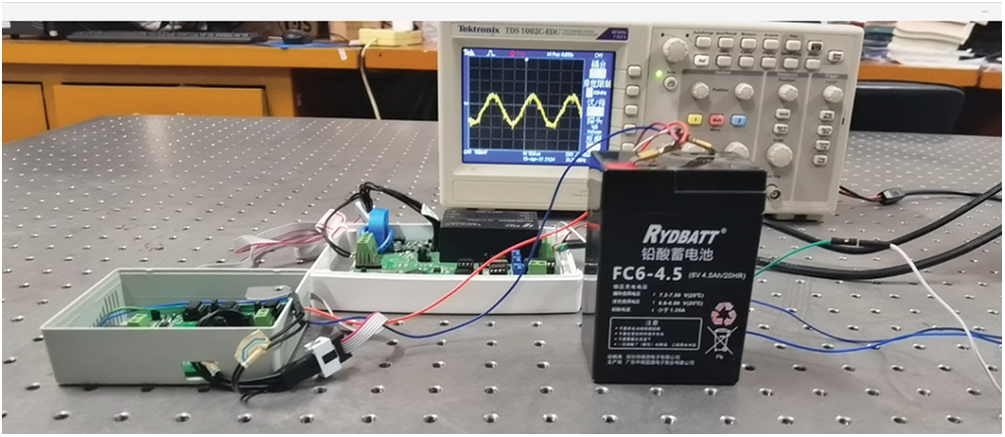
Figure 11: Internal resistance detection equipment
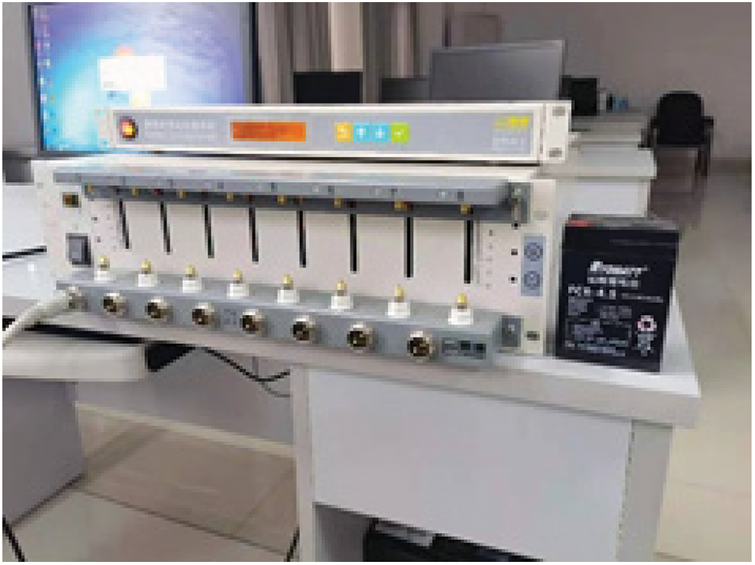
Figure 12: Battery testing equipment
The curve of discharge current variation is shown in Fig. 13. During the discharging process, the terminal voltage, internal resistance, temperature and discharge time of the battery are recorded every 10 s. Fig. 14 is the change curve of relevant parameters during a stepped discharge process. According to Figs. 13 and 14, when the discharge current increases, the internal resistance increases faster, but the SOC and terminal voltage decrease faster; when the discharge current decreases, the internal resistance decreases rapidly before escalating due to the change of the discharge efficiency, but the SOC and terminal voltage increase rapidly before tapering off. This phenomenon is in line with the discharge characteristics of batteries for a simulation substation, and it is also an important basis for mapping the battery SOC change through the battery voltage difference over a period of time.
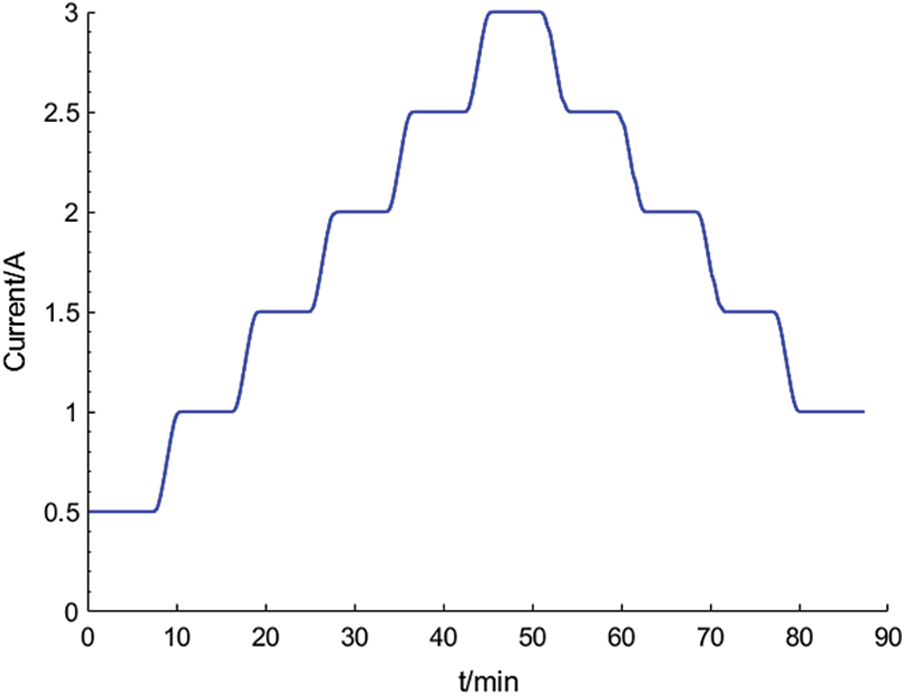
Figure 13: Stepped discharge current
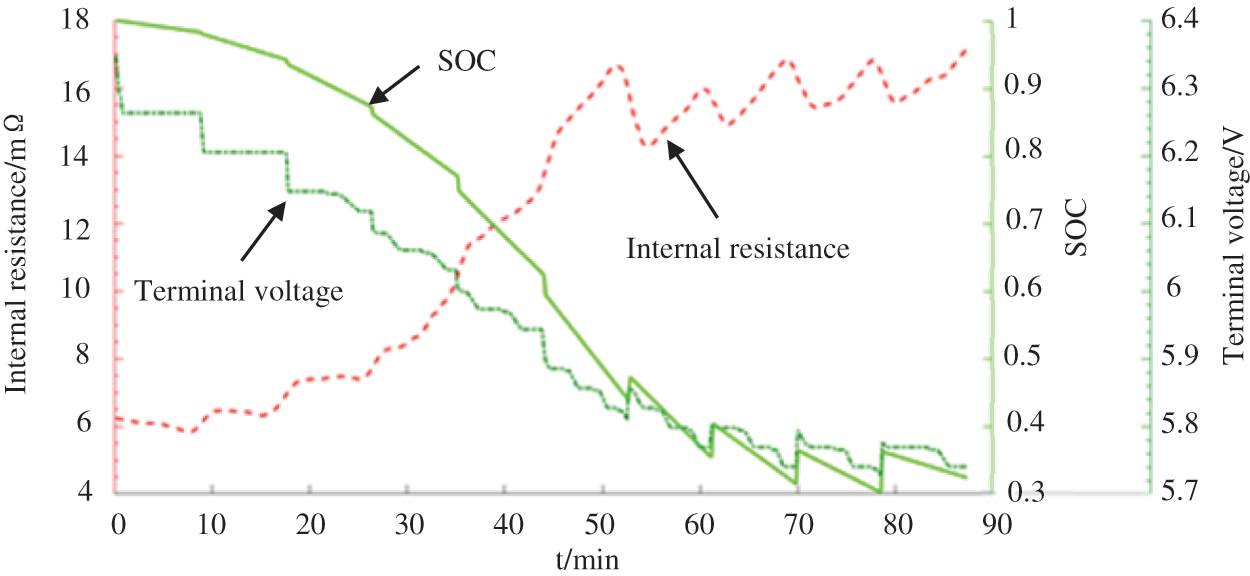
Figure 14: Changes of battery parameters during non-CC discharging
Voltage differences between several time intervals (5, 10, and 20 min) are calculated. This is to ensure there are one or more current changes in each time interval, thus making the training data closer to the real data. The battery discharging experiment has generated a total of 1,140 groups of non-repetitive data in different time periods, and the time interval between every two groups is 10 s. After an out-of-order arrangement, the first 1,000 groups are selected as the training data and the rest as the validation data.
The accuracy of the estimated value is determined by the penalty factor
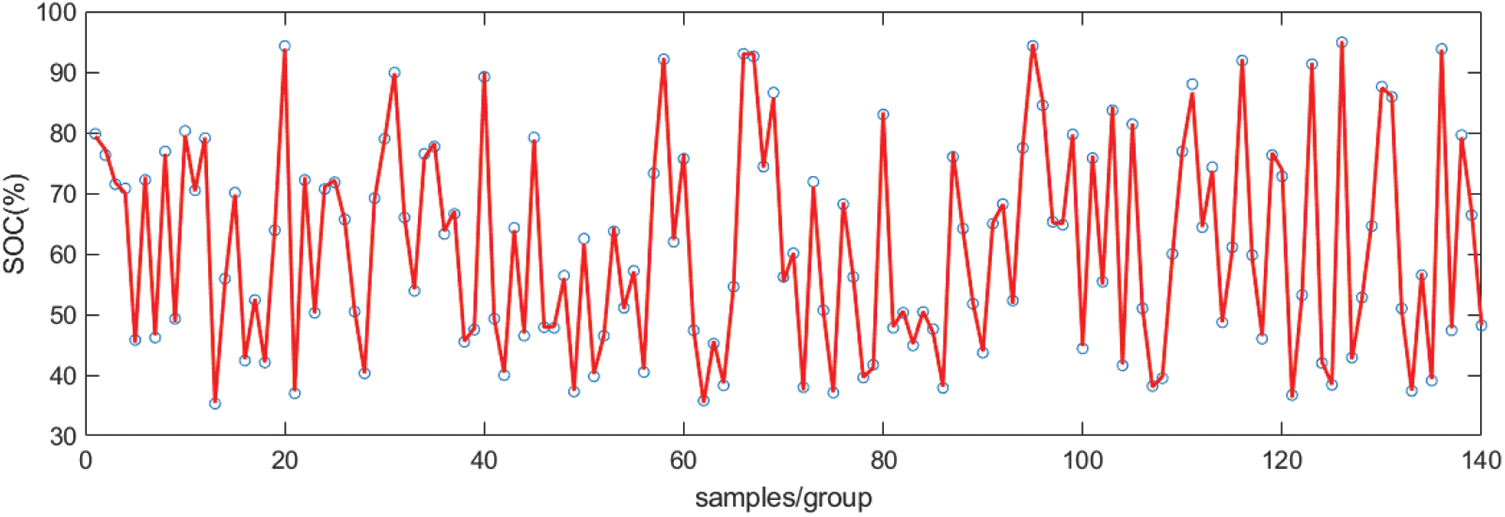
Figure 15: SOC estimation validation results based on PSO-LSSVM
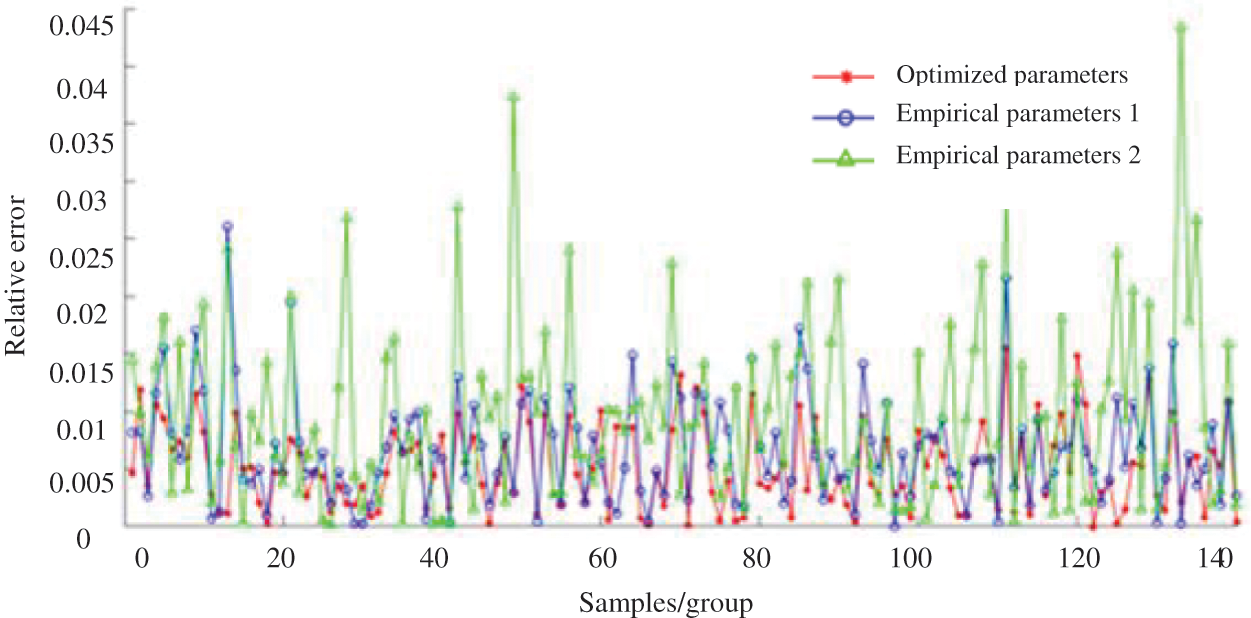
Figure 16: Relative errors of SOC estimation under different LSSVM parameters
As the backup power supply for the DC system in a simulation substation, lead-acid batteries feature non-continuity in operation. However, the accurate SOC estimation remains a challenge due to the non-stationarity and randomness of battery capacity change. This paper proposes a comprehensive method for battery SOC estimation, which may aid in maintaining a reasonable charging schedule in a simulation substation and improving battery’s durability. Based on the different working conditions of a battery, taking into account factors such as the terminal voltage, internal resistance, temperature and discharge time of the battery, different estimation methods are selected to improve the accuracy of SOC estimation. An improved Ampere-hour method is used to calculate the battery SOC during CC/CV charging and discharging. A PSO algorithm is employed to optimize the kernel function parameters, and a combined PSO-LSSVM algorithm is introduced to estimate the battery SOC, with the maximum relative error being 2.1%, which is significantly less than that obtained by conventional kernel function parameters. The PSO-LSSVM algorithm automatically discovers the data rules during online data collection and accurately estimates the SOC change during non-CC discharging, solving the problem of low estimation accuracy obtained by the improved Ampere-hour method.
Acknowledgement: The authors are grateful for the financial support provided by State Grid Jiangsu Electric Power Co., Ltd.
Funding Statement: The authors received funding for this study from Science and Technology Project of State Grid Jiangsu Electric Power Co., Ltd. (J2021020).
Conflicts of Interest: The authors declare that they have no conflicts of interest to report regarding the present study.
1. Li, Y., Luo, L., Rehtanz, C., Ruberg, S., Yang, D. et al. (2011). An industrial DC power supply system based on an inductive filtering method. IEEE Transactions on Industrial Electronics, 59(2), 714–722. DOI 10.1109/TIE.2011.2161245. [Google Scholar] [CrossRef]
2. Liao, X. J., He, L. P., Zhong, Z. H. (2006). A review of battery management system. Automotive Engineering, 28(10), 961–964. DOI 10.19562/j.chinasae.qcgc.2006.10.022. [Google Scholar] [CrossRef]
3. Zhu, S. R. (1998). Battery handbook. China: Tianjin University Press. [Google Scholar]
4. Peng, X. Y., Tang, C. Y., Sun, J. L., Liu, Z. (2020). Research on SOC estimation method of lithium battery based on extended kalman filter and capacity calibration. Electrical Appliances and Energy Efficiency Management Technology, 2020(5), 51–56. DOI 10.16628/j.cnki.2095-8188.2020.05.008. [Google Scholar] [CrossRef]
5. Wang, Q., Qi, W. (2020). New SOC estimation method under multi-temperature conditions based on parametric-estimation OCV. Journal of Power Electronics, 20(2), 614–623. DOI 10.1007/s43236-020-00036-4. [Google Scholar] [CrossRef]
6. Wang, Q., Qi, W. (2018). State estimation method for power lithium-ion battery based on dynamic equilibrium voltage. International Journal of Electric and Hybrid Vehicles, 10(2), 95–99. DOI 10.1504/IJEHV.2018.095712. [Google Scholar] [CrossRef]
7. Wang, Q., Qi, W., Xiao, D. (2018). Cycle life estimation method for parallel lithium battery pack based on double kalman filtering algorithm. Information and Control, 47(4), 461–467, 472. DOI 10.13976/j.cnki.xk.2018.6491. [Google Scholar] [CrossRef]
8. Cacciato, M., Nobile, G., Scarcella, G., Scelba, G. (2016). Real-time model-based estimation of SOC and SOH for energy storage systems. IEEE Transactions on Power Electronics, 32(1), 794–803. DOI 10.1109/TPEL.2016.2535321. [Google Scholar] [CrossRef]
9. He, H., Zhang, X., Xiong, R., Xu, Y., Guo, H. (2012). Online model-based estimation of state-of-charge and open-circuit voltage of lithium-ion batteries in electric vehicles. Energy, 39(1), 310–318. DOI 10.1016/j.energy.2012.01.009. [Google Scholar] [CrossRef]
10. He, H., Wei, Z. G., Hu, J., Li, Y., Xiong, B. (2021). Load current and state of charge co-estimation for current sensor-free lithium-ion battery. IEEE Transactions on Power Electronics, 36(10), 10970–10975. DOI 10.1109/TPEL.2021.3068725. [Google Scholar] [CrossRef]
11. White, C., Deveau, J., Swan, L. G. (2016). Evolution of internal resistance during formation of flooded lead-acid batteries. Journal of Power Sources, 327(1), 160–170. DOI 10.1016/j.jpowsour.2016.07.020. [Google Scholar] [CrossRef]
12. Cooper, A., Furakawa, J., Lam, L., Kellaway, M. (2009). The ultrabattery–A new battery design for a new beginning in hybrid electric vehicle energy storage. Journal of Power Sources, 188(2), 642–649. DOI 10.1016/j.jpowsour.2008.11.119. [Google Scholar] [CrossRef]
13. Wen, Y., Wang, L., Cheng, C., Wang, Z., Pei, F. et al. (2021). Study on the influence factors of the cycle life of lead-acid battery in DC system. Earth and Environmental Science, 772(1), 12039. DOI 10.1088/1755-1315/772/1/012039. [Google Scholar] [CrossRef]
14. Xiong, X., Wang, S. L., Fernandez, C., Yu, C. M., Zou, C. Y. et al. (2020). A novel practical state of charge estimation method: An adaptive improved ampere-hour method based on composite correction factor. International Journal of Energy Research, 44(14), 11385–11404. DOI 10.1002/er.5758. [Google Scholar] [CrossRef]
15. Rong, Y. (2009). Defects and improvement of examination method for discharge degree of lead-acid battery. Power Supply Technology, 33(1), 51–52. DOI 10.3969/j.issn.1002-087X.2009.01.016. [Google Scholar] [CrossRef]
16. Cho, S. Y., Lee, I. O., Baek, J. I., Moon, G. W. (2016). Battery impedance analysis considering DC component in sinusoidal ripple-current charging. IEEE Transactions on Industrial Electronics, 63(3), 1561–1573. DOI 10.1109/TIE.2015.2497661. [Google Scholar] [CrossRef]
17. He, B., Wang, H., He, X. (2014). Vibration test methods and their experimental research on the performance of the lead-acid battery. Journal of Power Sources, 268(1), 326–330. DOI 10.1016/j.jpowsour.2014.05.098. [Google Scholar] [CrossRef]
18. Aksakal, C., Sisman, A. (2018). On the compatibility of electric equivalent circuit models for enhanced flooded lead acid batteries based on electrochemical impedance spectroscopy. Energies, 11(1), 1432–1437. DOI 10.3390/en11010118. [Google Scholar] [CrossRef]
19. Chen, G., Guo, Q., Wang, J. H. (2012). Battery testing system based on the STM32. Foreign Electronic Measurement Technology, 31(1), 70–73. DOI 10.19652/j.cnki.femt.2012.01.020. [Google Scholar] [CrossRef]
20. Wang, Y. Y., Li, J. B., Zhang, F. (2020). Battery state estimation of least squares support vector machine based on particle swarm optimization. Energy Storage Science and Technology, 9(4), 1153–1158. DOI 10.19799/j.cnki.2095-4239.2020.0075. [Google Scholar] [CrossRef]
21. Tian, L., Liu, Z. T. (2012). Least-squares method piecewise linear fitting. Computer Science, 39, 482–484. [Google Scholar]
22. Xie, T., Cao, J. W., Gao, T. (2015). An energy storage system smoothing control strategy based on sliding least square algorithm and battery SOC. Power System Protection and Control, 43(5), 1–7. DOI 10.7667/j.issn.1674-3415.2015.05.001. [Google Scholar] [CrossRef]
23. Kim, C. M., Bang, S. B., Shong, K. M. (2009). A study on the establishment of impedance/conductance guide line for diagnosis of lead-acid battery’s state of health. Journal of Power Sources, 211(2), 214–219. [Google Scholar]
24. Blanke, H., Bohlen, O., Buller, S., Friicke, B., Linzen, D. et al. (2005). Impedance measurements on lead-acid batteries for state-of-charge, state-of-health and cranking capability prognosis in electric and hybrid electric vehicles. Journal of Power Sources, 144(2), 418–425. DOI 10.1016/j.jpowsour.2004.10.028. [Google Scholar] [CrossRef]
25. Zhu, B., Ye, S., Jiang, M., Wang, P., Wu, Z. et al. (2019). Achieving the carbon intensity target of China: A least squares support vector machine with mixture kernel function approach. Applied Energy, 233(1), 196–207. DOI 10.1016/j.apenergy.2018.10.048. [Google Scholar] [CrossRef]
26. Li, X., Wang, Z., Zhang, L., Zou, C., Dorrell, D. D. (2019). State-of health estimation for Li-ion batteries by combing the incremental capacity analysis method with grey relational analysis. Journal of Power Sources, 410(2), 106–114. DOI 10.1016/j.jpowsour.2018.10.069. [Google Scholar] [CrossRef]
27. Jia, R., Hong, G., Xue, J. H., Hong, G., Cui, J. W. (2010). Application of particle swarm optimization-least squares support vector machine algorithm in mechanical fault diagnosis of high-voltage circuit breaker. Power System Technology, 34(3), 197–200. DOI 10.13335/j.1000-3673.pst.2010.03.012. [Google Scholar] [CrossRef]
28. Zhang, X., Wang, H. L. (2011). LSSVM based on PSO and its applications to time series prediction. China Mechanical Engineering, 22(21), 2572–2576. [Google Scholar]
 | This work is licensed under a Creative Commons Attribution 4.0 International License, which permits unrestricted use, distribution, and reproduction in any medium, provided the original work is properly cited. |