| Structural Durability & Health Monitoring |
DOI: 10.32604/sdhm.2022.016130
ARTICLE
Health Monitoring-Based Assessment of Reinforcement with Prestressed Steel Strand for Cable-Stayed Bridge
School of Traffic Engineering, Shenyang Jianzhu University, Shenyang, 110168, China
*Corresponding Author: Kexin Zhang. Email: jt_zkx@sjzu.edu.cn
Received: 09 February 2021; Accepted: 08 June 2021
Abstract: This paper presents the method of reinforcing main girder of reinforced concrete cable-stayed bridge with prestressed steel strands. To verify the effectiveness of external prestressed strand reinforcement method. Static load tests and health monitoring-based assessment were carried out before and after reinforcement. Field load test shows that the deflection and stress values of the main girder are reduced by 10%~20% after reinforcement, and the flexural strength and stiffness of the strengthened beam are improved. The deflection and strain data of health monitoring of the specified section are collected. The deflection of the second span is 4 mm~10 mm, the strain range of the upper edge of the second span is −10 με~−40 με, and the strain range of the lower edge is 30 με~75 με. These values show the deflection and strain values fluctuate within a prescribed range, verifying the safety of the bridge. The reinforcement method of prestressed steel strand is feasible and effective. It can provide reference basis for the application of external prestressed strand reinforcement technology in similar projects.
Keywords: Prestressed steel strand; reinforcement; cable-stayed bridge; load testing; health monitoring
Cable-stayed bridge is an important structural form of bridge, which appears in the seventeenth century and develops in the twentieth century. In 1955, Dischinger designed and built the world’s first modern long-span cable-stayed bridge-Stromsund Bridge, Sweden. It inaugurated a new era in bridge structure and created a new system. The appearance of such a new bridge with advanced technology, economical cost and beautiful appearance is immediately appreciated and accepted by the society, and subsequently promoted in large quantities. With the development of modern industrial technology, high strength and high elastic modulus steel wire can be produced in large quantities. With the finite element method, the development of computer technology and the emergence of structural reliability theory and structural dynamics, modern cable-stayed bridges are eventually built in large numbers and became popular. In just a few decades, the span has jumped from about 100 m to more than 1000 m. The number and span of cable-stayed bridges have been increasing worldwide, and more than 300 have been built so far.
The development of cable-stayed bridges in China began in the 1970s. The first cable-stayed bridge in China, Yunyang Bridge in Sichuan Province, was built in 1975. The mid-late 1980s was the heyday of cable-stayed bridge development in China. More than 200 cable-stayed bridges have been built or are under construction so far. Among them, 52 have a span of more than 200 m, and 20 have a span of more than 400 m [1–5]. The use of cable-stayed bridge structure system can effectively reduce the height of the main beam, reduce the weight of the structure. Compared with suspension bridge, it has better stiffness and it has more advantages in resisting wind load, earthquake and vertical live load. Therefore, cable-stayed bridges have been widely recognized and favored by the engineering field [6–8]. However, the construction and operation of a large number of cable-stayed bridges also expose a series of problems. As the volume of traffic increases and the class of vehicles improves, overloading is becoming more and more serious. At the same time, due to the lack of design theory or construction technology, many cable-stayed bridges suffer from a series of damages, which seriously affect their carrying capacity and performance. It has caused a serious impact on traffic safety [9–12].
Cable-stayed bridges have many advantages in their applications, but with the many damages that inevitably come with long service. Damage has cracks (vertical cracks and inclined cracks), pits, alkali-aggregate reaction and leakage aggregate. Serious damages may lead to bridge collapse accidents, bringing huge losses to the safety of people’s lives and property. There are many strengthening methods for the damage bridge. For example, the commonly used reinforcement method of adhesive fiber composite material, reinforcement method of adhesive steel plate, external prestressing reinforcement method [13–18]. The use of carbon fiber reinforcement method, has the advantages of convenient construction, simple operation, accurate paste, but the high market price will make the project budget high. Moreover, the strength of carbon fiber cannot be fully exerted when it shares the load with the beam after construction. Although the pasted steel plate has the advantages of strong and durable, rapid construction and reasonable economy, the tensile force of the steel plate is only balanced by the adhesive force on one side, which requires a high level of adhesive technology and operation. External prestressed reinforcement method can balance part of dead load and give full play to the advantages of reinforcement materials. It can greatly improve the bearing capacity and stiffness of the structure. The crack and deflection of the original structure can be effectively controlled, and the crack resistance of the original beam can be significantly improved.
This paper takes a cable-stayed bridge which has been in operation for many years as an example, and uses external prestressing tendons to strengthen the bridge. The load test before and after reinforcement and the health monitoring after reinforcement are carried out.
Muling River Bridge in Mishan City is located at K247+799 of Jixian-Dangbi Highway. The main bridge is a reinforced concrete cable-stayed bridge with a structure of two towers and two cable planes. The height of the tower is 14 m, the length of the bridge is 106.4 m, and the span is 28 m + 50.4 m + 28 m. The bridge is 9 m wide, with a sidewalk of 1 m+ a driveway of 7 m + a sidewalk of 1 m. The bearing adopts PTFE plate rubber bearing, and the bridge deck is paved with 5~10 cm reinforced concrete. The lower structure abutment adopts gravity abutment, and the tower foundation adopts caisson foundation. The original design load grade for the automobile −20, and the check the load grade for the trailer −100. The elevation of the bridge is shown in Figs. 1 and 2, respectively.
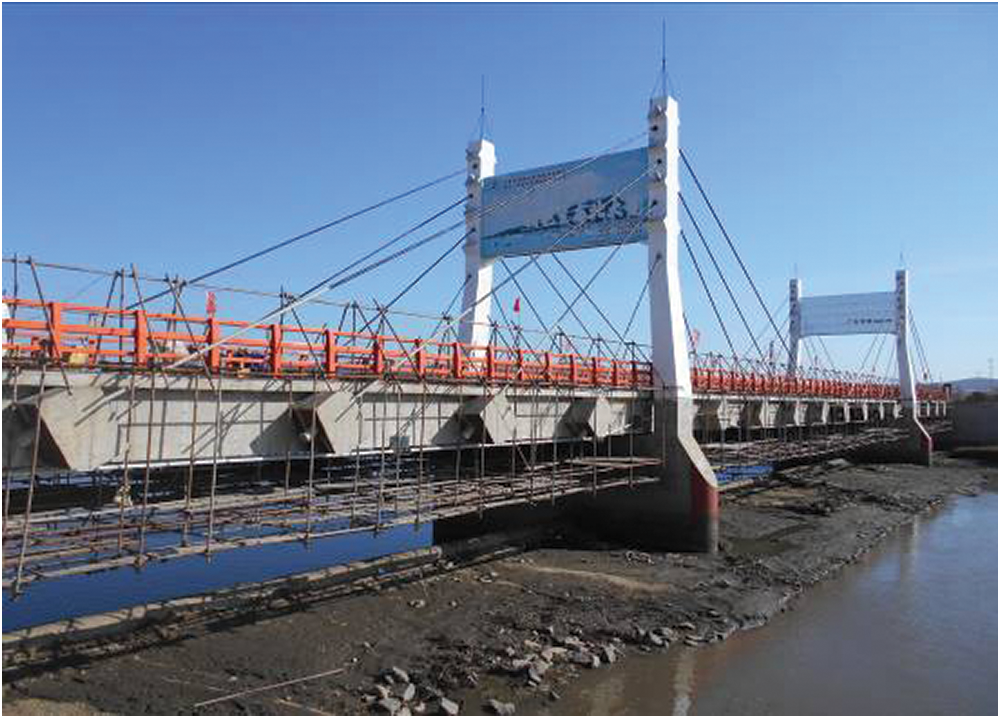
Figure 1: Elevation photo of Muling River Bridge
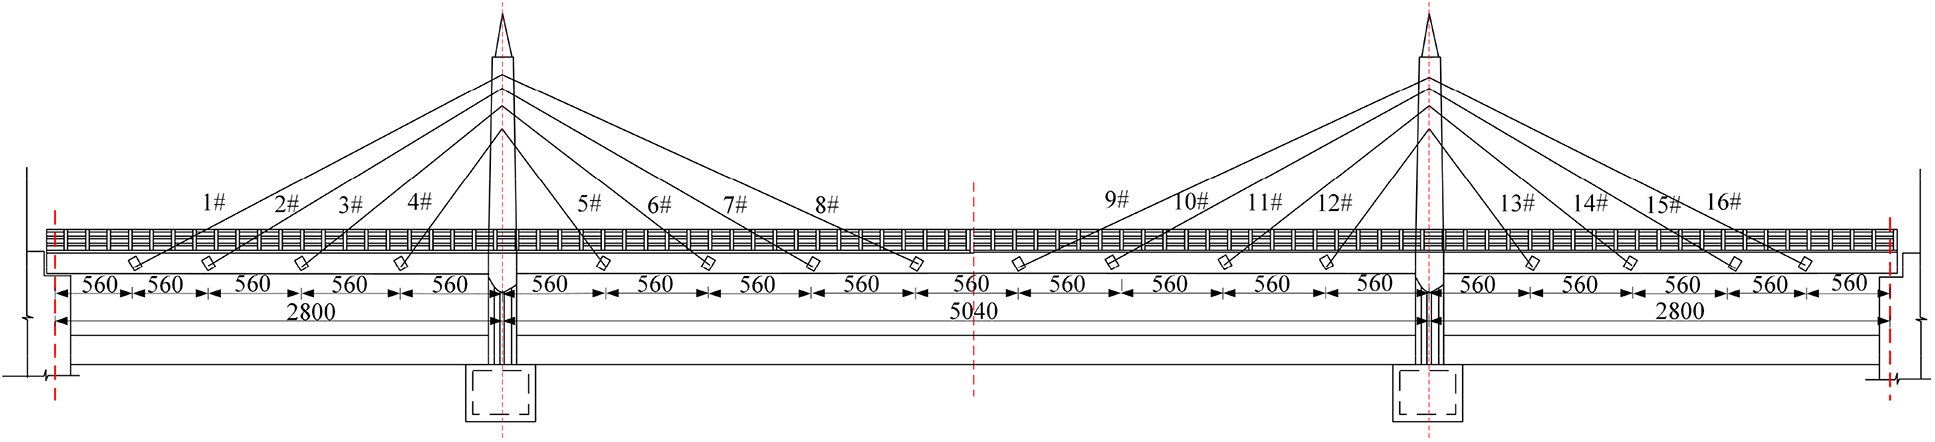
Figure 2: Elevation drawing of Muleng River Bridge (Unit: cm)
During routine inspection, the first span vertical crack mainly exists in the middle of the span. The vertical fracture length is about 100 cm, and the fracture width is about 0.12 mm. The crack of second span is mainly vertical cracks, which mainly exists in the intermediate of the span and cable anchorage zone. The vertical crack length is between 100 cm and 240 cm, and the crack width is between 0.17 mm and 0.30 mm. The third span crack is mainly vertical crack and oblique crack, mainly exists in the middle of the span. The vertical crack length is between 70 cm and 120 cm, and the crack width is between 0.21 mm and 0.40 mm. The oblique crack length is between 70 cm and 100 cm, and the crack width is between 0.16 mm and 0.20 mm. The steel plate at the anchorage end of the cable of the whole bridge is corroded, with an area of 10.1 m2. The concrete reinforcement at the anchor end of the left-1# stay cable is exposed, and the anchor of the left-6# and right-10# stay cable is pulled out. The damage cases are observed as follows:
As shown in the Figs. 3 and 4, the shrinkage crack and temperature crack may exist in the reinforced concrete structure when it is formed, and the corrosion of the environment makes the shrinkage crack of the main girder increase. In addition, the increase of the number of vehicles and the increase of the load of vehicles will cause the bridge to produce excessive stress, the stress exceeds the cracking strength of concrete, so that the concrete in the tensile zone and shear zone will produce stress cracks. As shown in the Fig. 5, due to the influence of rain and snow, the concrete on the surface of bridge pier will accelerate aging and corrosion, which will eventually lead to concrete spalling and steel corrosion. As shown in the Fig. 6, the cable anchorage area may be pulled out due to low steel mesh placement rate and insufficient anchorage depth. The damage of cable anchorage area seriously affects the safety of bridge operation.
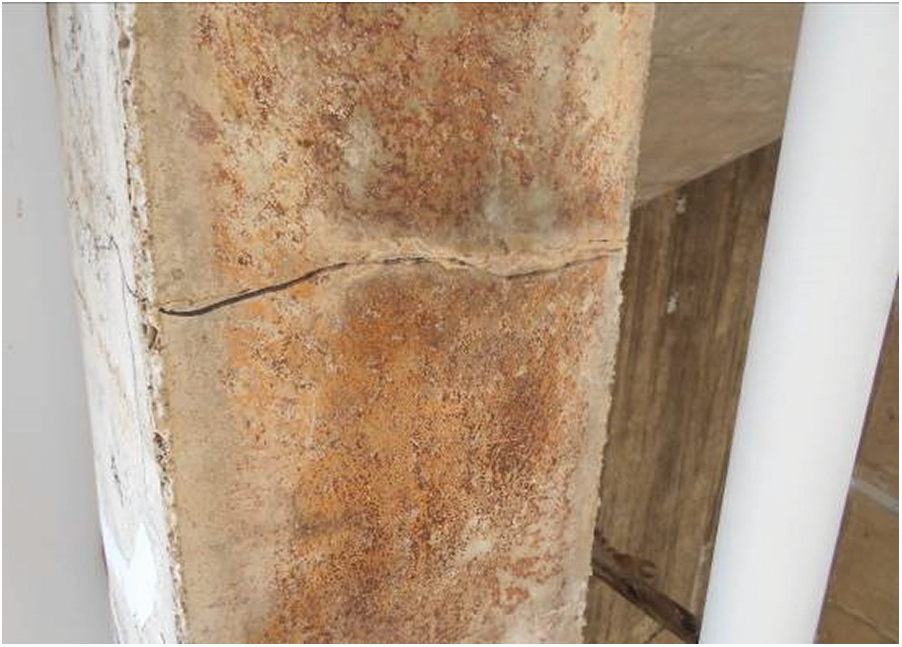
Figure 3: Vertical cracks in main girder structure

Figure 4: Oblique crack in main girder structure

Figure 5: Leakage reinforcement

Figure 6: Cable anchor pulled out
3 Construction Reinforcement Process
A bundle of prestressed steel strands is arranged on both sides of each girder. Each bundle is made of three high strength and low relaxation steel strands of 15.24 mm specification, with a standard strength of 1860 MPa and an elastic modulus of 195000 MPa. The tension control stress of a single strand is 168.05 MPa, and that of prestressed steel bundle is 1209 MPa, which is 65% of the standard strength. Considering the fatigue performance of external prestressing tendons, the tensile range of prestressing tendons is generally 55%~65% of the designed tensile strength. It is bent and anchored at the corresponding webs at both ends of the T beam respectively. The specific layout of the external bundle is shown in Figs. 7–10.
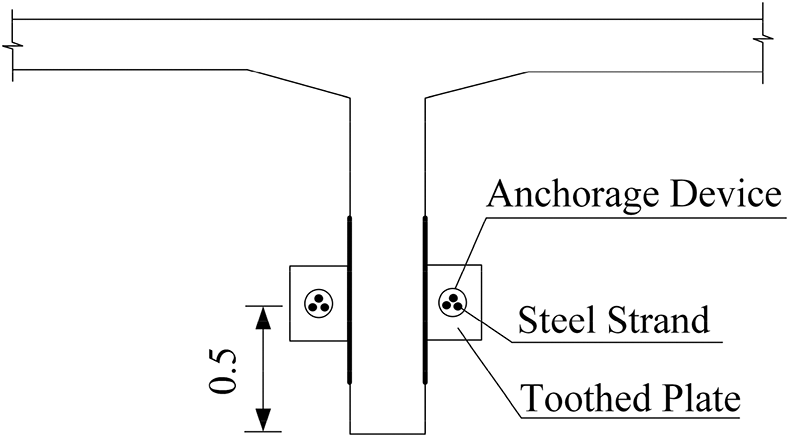
Figure 7: Layout of tensioning ends

Figure 8: Arrangement of the mid-span section

Figure 9: External longitudinal profile
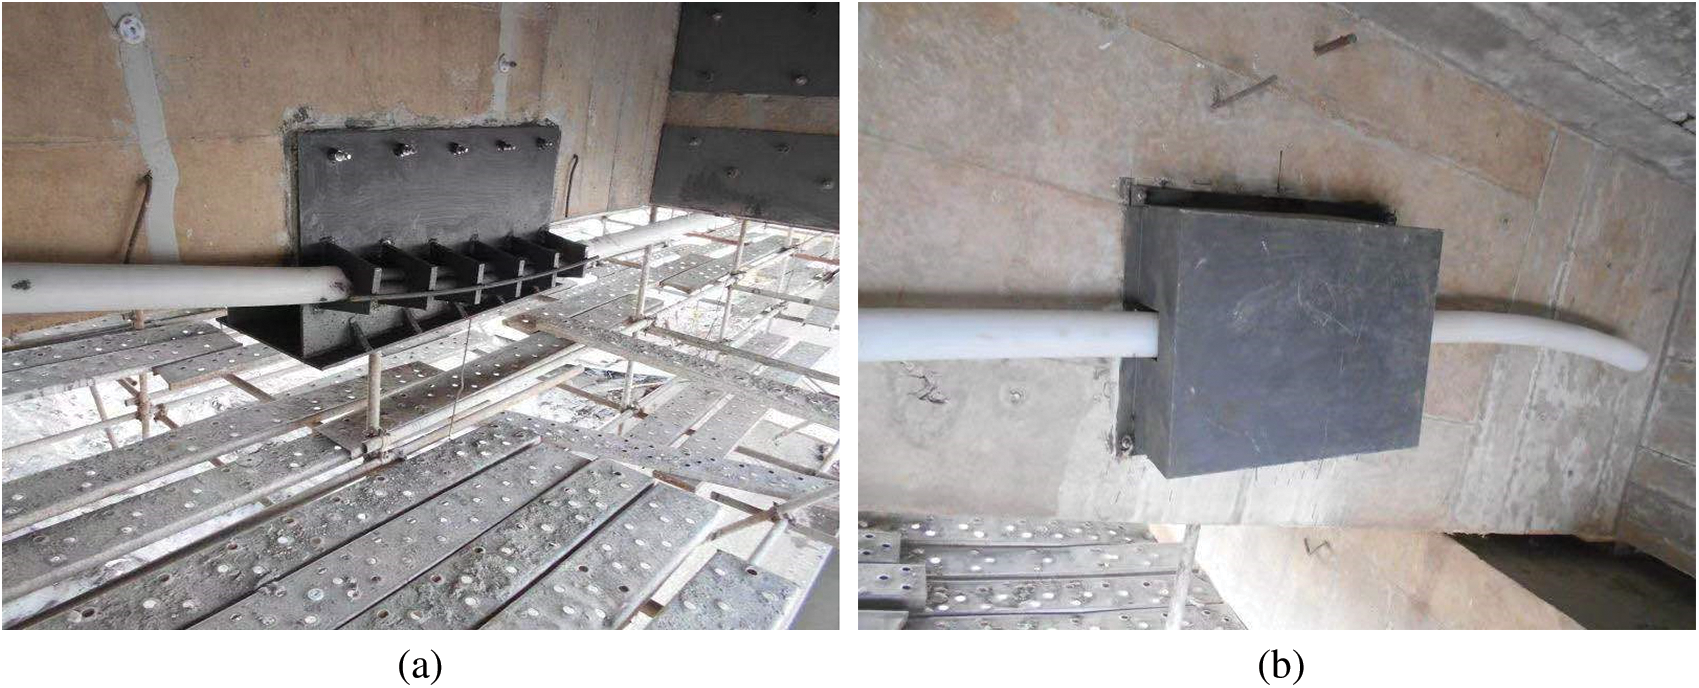
Figure 10: External prestressed reinforcement of main girder
In addition, some other bridge defects have also been repaired. The stress crack of the main beam is sealed with potting glue to increase the durability of the main girder. The damaged concrete such as main girder and bridge pier shall be repaired with epoxy resin mortar. As for the reinforcement of the anchorage area, the anchorage block is first reinforced, and then the steel skeleton is bound and the concrete is poured.
The internal force calculation model of this project is calculated by Midas/Civil, a special finite element calculation software for bridges. The finite element model of the full bridge is shown in Fig. 11. Beam elements are used to simulate main girders, pylons and piers, while truss elements are used to simulate stay cables. The whole finite element model of the cable-stayed bridge has 800 nodes, 767 elements and 735 beam elements. There are 32 tension-only truss (stay cable) elements. The girder and tower are used as common joints to simulate the consolidation system of the cable-stayed bridge. The elastic connection boundary condition of the main girder is adopted, and the rigid connection boundary condition of the anchor point of the cable to the main girder and the main tower is adopted. The correctness of the model is verified by the load test data of the bridge, and the reinforcement analysis is carried out on the basis of the finite element model.
The load combination is “1.2 transverse load + 1.4 live load”. Fig. 12 shows the stress diagram of the upper edge of the main girder. The top edge stress is −3.5 MPa~2.3 MPa. All of them did not exceed the permitted standard value. Fig. 13 shows the stress diagram at the lower edge of the main girder. The bottom edge strain is −3.5 MPa~2.3 MPa, which meets the requirement of the code value. After the reinforcement of external prestressed strand, the stress at the upper and lower edges of the control section of the main girder meets the requirements.

Figure 11: Calculation model of Muleng River Bridge in Mishan City
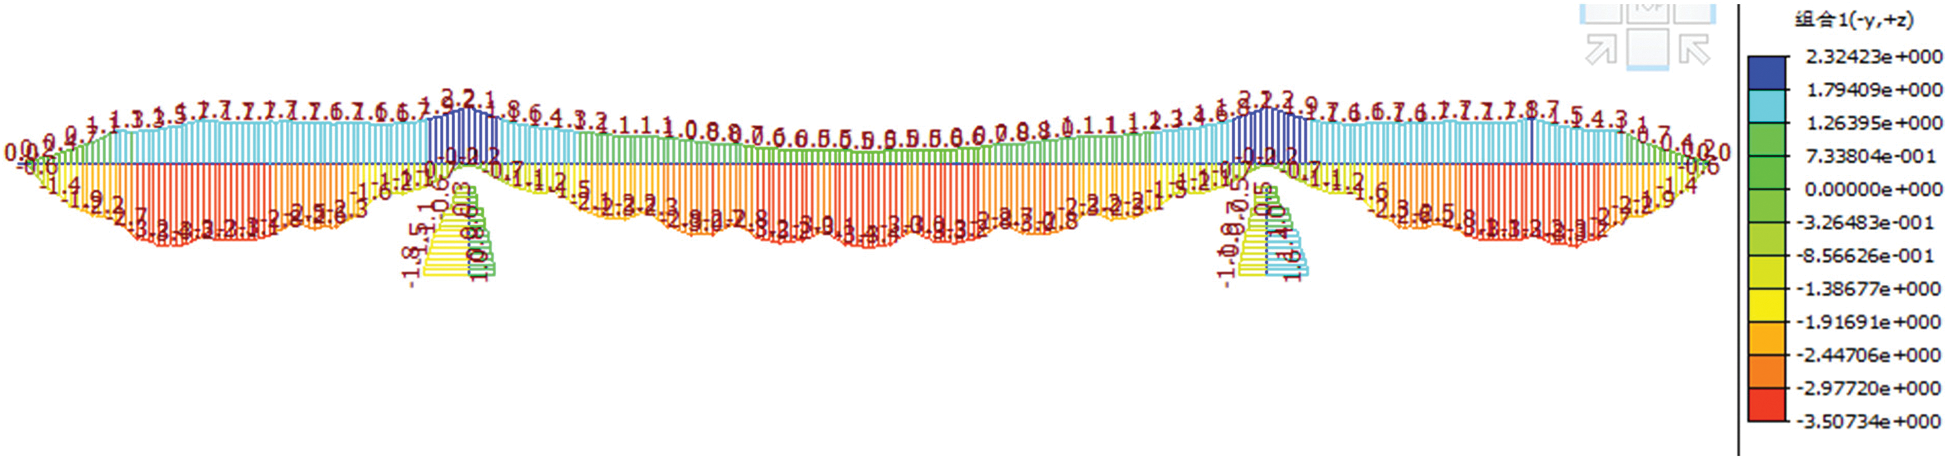
Figure 12: Upper edge stress diagram

Figure 13: Lower edge stress diagram
5 Load Test, Health Monitoring
5.1.1 Determination of Test Vehicles
In order to simulate the maximum bending moment effect and ensure the validity of the test, the test determined to use four trucks as the test load before and after strengthening, and each truck is about 400 kN.
5.1.2 Determination of Vehicle Load Loading Conditions
According to the site situation of the bridge, on the premise of ensuring the maximum bending moment in the longitudinal span of the bridge, the bridge is loaded under four working conditions.
Working condition 1: Symmetric load of maximum bending moment of the mid-span section. (2# span)
Working condition 2: Eccentric load of maximum bending moment of the mid-span section. (2# span)
Working condition 3: Symmetric load of maximum bending moment of the mid-span section. (3# span)
Working condition 4: Eccentric load of maximum bending moment of the mid-span section. (3# span)
Working condition 5: Symmetrical load of maximum negative bending moment of pier top section.
Working condition 6: Eccentric load of maximum negative bending moment of pier top section.
Loading arrangement in each working condition is shown in Figs. 14–17.
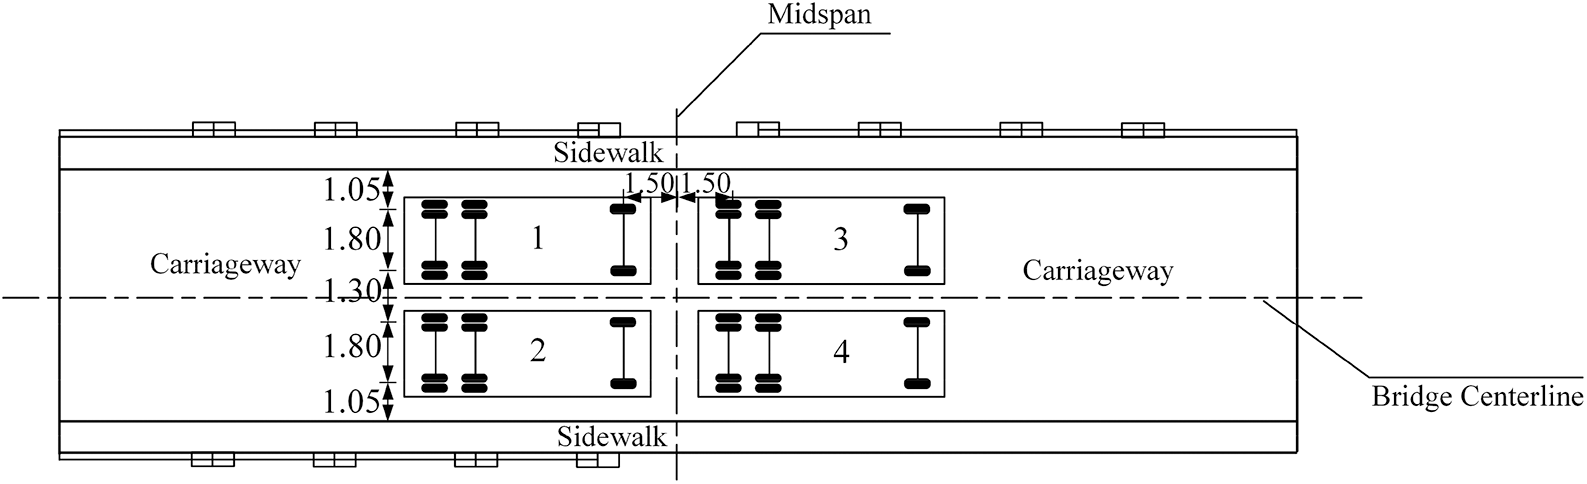
Figure 14: Condition 1 and Condition 3 (Unit: m)

Figure 15: Condition 2 and Condition 4 (Unit: m)

Figure 16: Condition 5 (Unit: m)
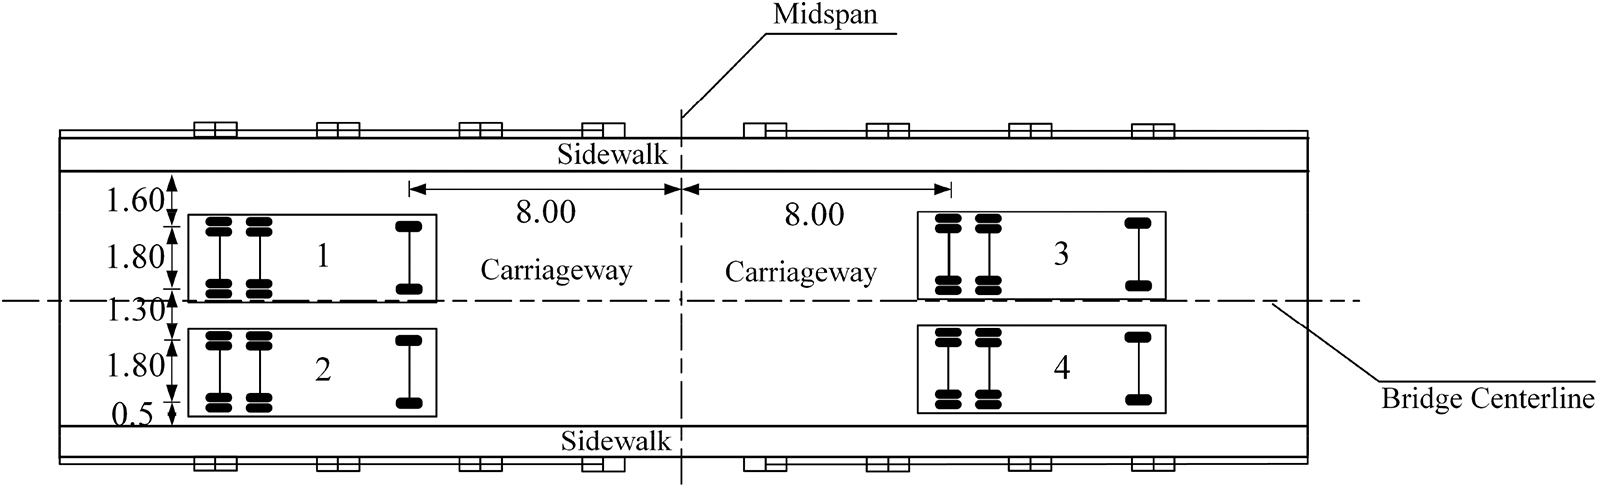
Figure 17: Condition 6 (Unit: m)
Determine the test items of this bridge as follows:
1. Strain of the middle section of the test span under test load;
2. Deflection of the test span girder under the test load;
3. Cable force of cable-stayed bridge;
The cable force test adopts spectral analysis method. In this method, a high sensitivity sensor temporarily fixed on the stay cable is used to pick up the pulsation signal of the stay cable under ambient excitation, and then through filtering, amplification and spectrum analysis, the natural vibration frequency of the stay cable is determined according to the spectrum diagram, and then the cable force is obtained.
4. Main tower deviation.
Structural health monitoring (SHM) is the use of advanced technology to monitor the structural response of structures to environmental or human motivation [19–21]. Combined with advanced signal processing technology, it is used to identify the characteristic parameters and damage status of the structure, and evaluate the performance of the structure, so as to ensure the safety of the structure [22–26]. By installing sensors outside or inside the bridge structure, the structure can self-detect itself, so as to detect and prevent structural damage in advance. Based on a certain number of historical monitoring data, the health monitoring system in this paper not only uses the intelligent method to predict the structural response, but also uses the prediction function to eliminate the influence of interference factors, so that the pre-monitoring system is more scientific and reasonable.
Combined with field testing and finite element analysis, the section that may appear the most dangerous is determined as the test section. As shown in Fig. 18, a static level is installed at the second and third span 1/2 of the bridge as the deflection monitoring point. As shown in Fig. 19, strain sensors are installed on the top edge and bottom edge of the second and third span beams of the bridge to monitor the strain changes of the bridge. Layout of measurement points for tower deviation is shown as Fig. 20.

Figure 18: Main girder deflection point arrangement (a) 2# span (b) 3# span

Figure 19: Arrangement of main girder strain measuring points (a) 2# span (b) 3# span (c) Beam section at the pier top
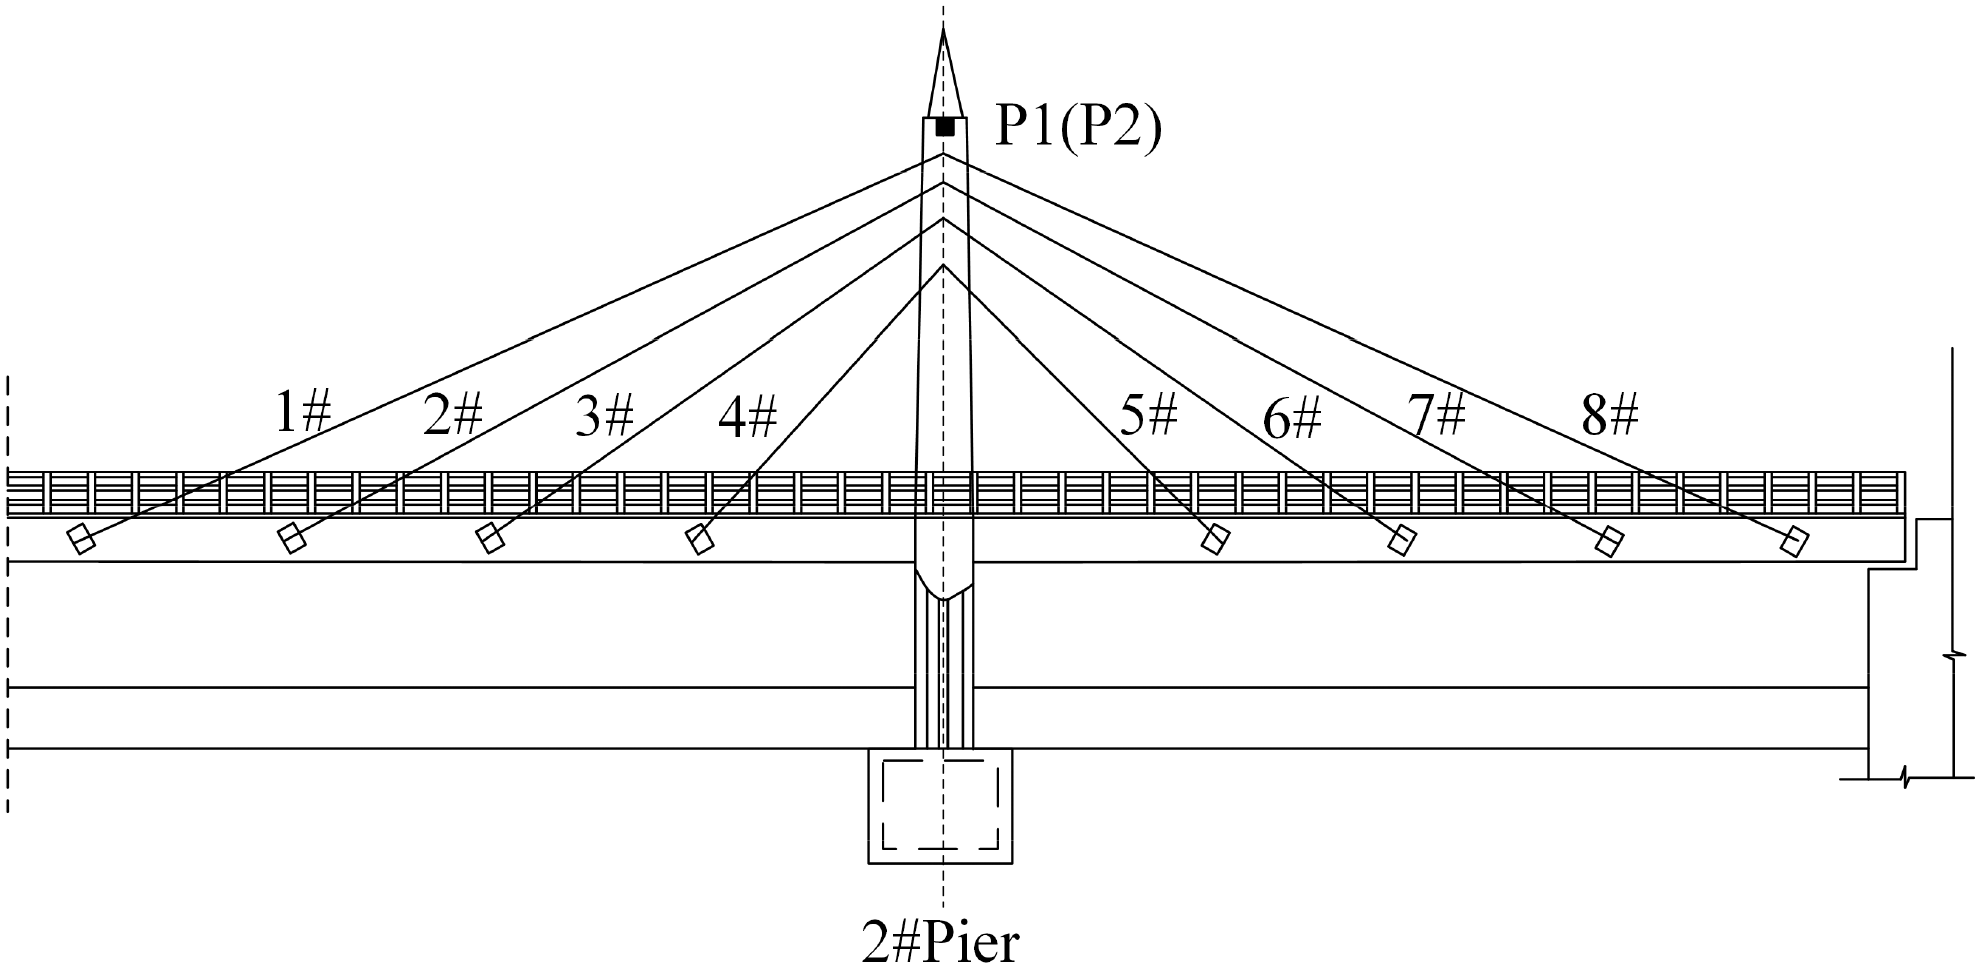
Figure 20: Layout of measurement points for tower deviation
In order to understand the stiffness of the bridge before and after reinforcement, the mid-span deflection of the second and third span before and after reinforcement is collected. The results of the second span are shown in Figs. 21 and 22. In condition 1, the deflection of each measuring point decreases obviously after reinforcement. The maximum deflection of point D3 is 36.1 mm before reinforcement, which decreases to 30.6 mm after reinforcement, a decrease of 15.3%. Before reinforcement, the minimum deflection at point D1 is 33.1 mm, but it is reduced to 29.3 mm after reinforcement, a decrease of 11.5%. The maximum deflection at point D4 is 48.1 mm before the reinforcement, which decreases to 38.2 mm after the reinforcement, which decreases by 20.6%. The minimum deflection at point D1 before reinforcement is 33.4 mm, which decreases to 29.8 mm after reinforcement, a decrease of 11.1%. It fully shows that the stiffness has been improved. There are many stress cracks in the original beam, and these cracks will increase with the increase of load, resulting in low stiffness. Due to the application of prestress in the bridge, the cracks of the original beam are closed. Even if the vehicle load is applied, the cracks do not increase, leading to the improvement of the overall stiffness of the bridge.

Figure 21: Deflection on Condition 1

Figure 22: Deflection on Condition 2
The deflection results of the third span are shown in Figs. 23 and 24. In the case of symmetric load loading, the reduction of deflection after reinforcement can be clearly seen in the figure. The maximum deflection at point D3 is 17.7 mm before reinforcement, but decreased to 15.2 mm after reinforcement, which decreased by 14.2%. The minimum deflection at point D1 is 15.2 mm before reinforcement, but decreases to 13.5 mm after reinforcement, a decrease of 11.2%. When the eccentric load is loaded, the deflection also decreases to different degrees. Before the reinforcement, the maximum deflection at point D4 is 18.9 mm, which decreases to 16.3 mm after the reinforcement, reducing by 13.8%. Before the reinforcement, the minimum deflection at point D1 is 11.5 mm, which decreases to 9.8 mm after reinforcement, reducing by 14.8%. It shows that the stiffness of the bridge is improved and meets the requirements.

Figure 23: Deflection on Condition 3

Figure 24: Deflection on Condition 4
In order to understand the strength of the bridge, the stress of the bridge before and after reinforcement is tested. Figs. 25 and 26 show the bottom stress before and after reinforcement under eccentric loads respectively. As shown in Fig. 25, the maximum stress at point N4 before reinforcement is 10.29 MPa, which decreases to 9.15 MPa after reinforcement, a decrease of 11.1%. Before reinforcement, the minimum stress at point N1 is 6.95 MPa, which decreases to 6.04 MPa after reinforcement, a decrease of 13.1%. As shown in Fig. 26, the maximum stress at point N4 is 9.93 MPa before reinforcement, which decreases to 8.63 MPa after reinforcement, a decrease of 13.1%. Before reinforcement, the minimum stress at point N1 is 6.79 MPa, but after reinforcement, it is reduced to 6.04 MPa, which is reduced by 11.0%. Other measurement points also have a certain extent of reduction, indicating that the strength of the structure has been improved. The steel strands make the concrete prestress to overcome the tensile stress caused by the vehicle load, and the tensile stress at the bottom edge of the beam is obviously reduced after reinforcement. Thus, the strength of the beam can be enhanced.

Figure 25: Stress on Condition 1
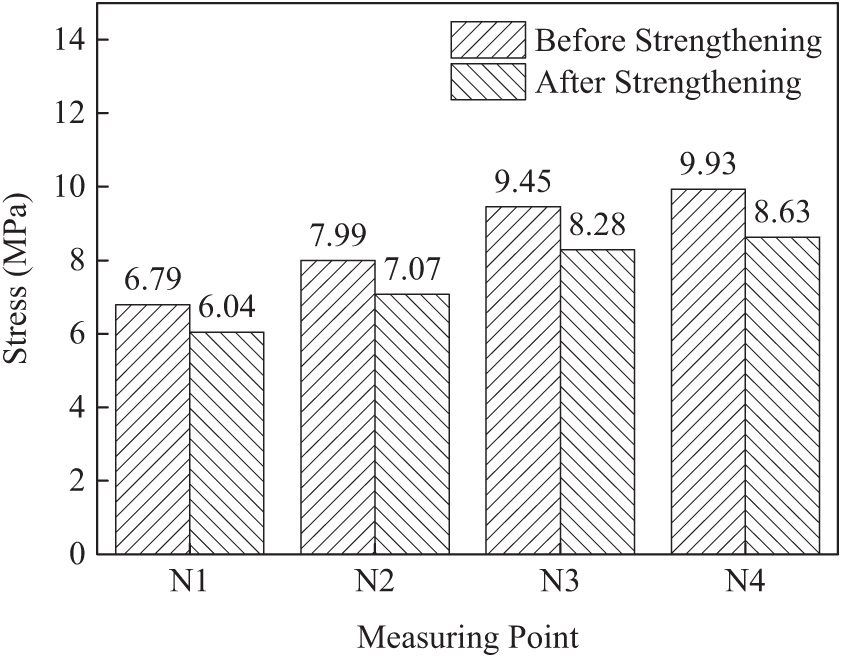
Figure 26: Stress on Condition 2
Fig. 27 shows the stress comparison diagram before and after reinforcement of the measuring point along the beam height of the second span 3# beam under eccentric load. It can be seen from the figure that the upper edge of the main beam is under compression and the lower edge is under tension. The tensile stress of point N6 is 0.42 MPa before reinforcement, which is reduced to 0.35 MPa after reinforcement, which is reduced by 16.7%. The compressive stress of point N7 before and after reinforcement is 1.59 MPa and 1.38 MPa, which decreases by 13.2%. The N10 measuring point at the lowest edge of the main girder has the maximum compressive stress, which is 8.86 MPa and 7.14 MPa before and after strengthening respectively, reducing by 19.4%.
Fig. 28 shows the stress before and after reinforcement of the second span 4# beam at the measuring point. It can be seen from the figure that the upper edge of the main beam is under compression and the lower edge is under tension. The tensile stress of N12 before reinforcement is 0.41 MPa, and after reinforcement it is reduced to 0.35 MPa, which is reduced by 14.7%. The compressive stress at point N13 is 1.67 MPa and 1.45 MPa respectively before and after reinforcement, which decreases by 13.2%. The compressive stress at the measuring point N16 at the lowest edge of the main girder is the largest, 8.14 MPa and 6.78 MPa, respectively, which decreases by 16.7%. The other measurement points are also greatly reduced, indicating that the strength of the structure meets the requirements and is improved.

Figure 27: 2-3# beam stress (Condition 1)
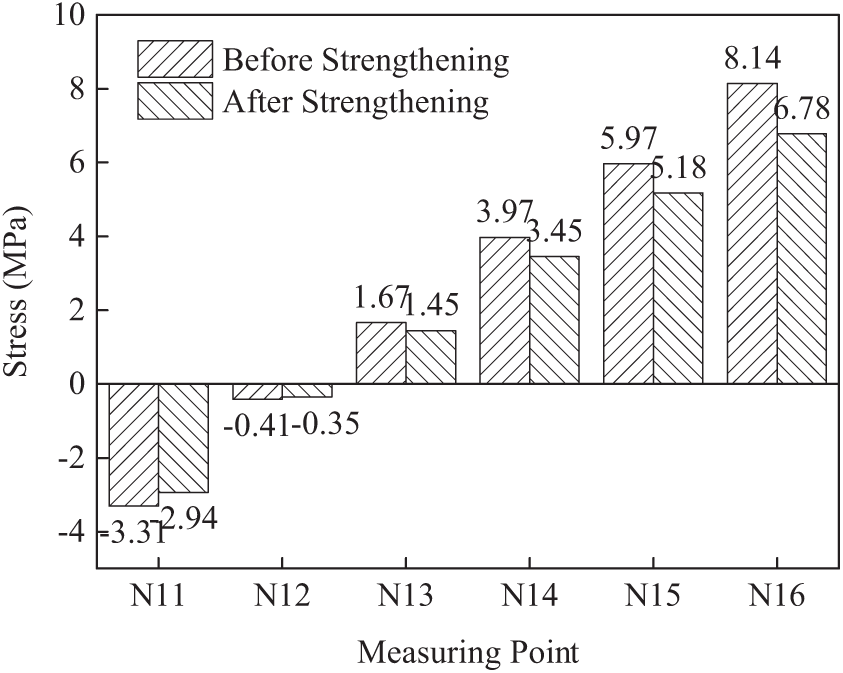
Figure 28: 2-4# beam stress (Condition 2)
Fig. 29 shows the stress of the third span # 3 beam along the beam height under eccentric load. It can be seen that the upper edge of the main beam is compressed while the lower edge is tensile. The tensile stress at the measuring point N6 is still tensile. The tensile stress before reinforcement is 0.41 MPa, and after reinforcement it is reduced to 0.35 MPa, which is reduced by 14.7%. The compressive stress before and after reinforcement is 1.91 MPa and 1.56 MPa, respectively, which decreases by 18.3% from the measuring point N7 to compression. The compressive stress at the measuring point N10 at the lowest edge of the main girder is the largest, which is 7.98 MPa and 6.73 MPa, respectively, reducing by 15.7%.
Fig. 30 shows the stress comparison diagram of the third span 4# beam of along the beam height under the eccentric load. It can be seen from the figure that the upper edge of the main beam is under compression and the lower edge is under tension. The tensile stress of point N12 before reinforcement is 0.98 MPa, and it is reduced to 0.87 MPa after reinforcement, which is reduced by 11.3%. The compressive stress at point N13 is 1.66 MPa and 1.38 MPa respectively before and after reinforcement, which decreases by 16.9%. The N16 measuring point at the bottom edge of the main girder has the maximum compressive stress, which is 8.53 MPa and 7.08 MPa respectively before and after reinforcement, decreasing by 17.0%. The other measurement points are also greatly reduced, indicating that the strength of the structure has been improved.

Figure 29: 3-3# beam stress (Condition 3)

Figure 30: 3-4# beam stress (Condition 4)
Fig. 31 shows the stress comparison diagram before and after the reinforcement. The stress distribution at pier top is opposite to the mid-span stress, and the upper edge is the tension and the lower edge is the pressure. The tensile stress at L1 measuring point on the upper edge of the top section of the front pier is the largest, which is 1.95 MPa, and it is reduced to 1.56 MPa after reinforcement, which is reduced by 20.0%. Before reinforcement, the tensile stress at L3 measuring point is the smallest, which is 0.22 MPa, and decreases to 0.18 MPa before reinforcement, which is reduced by 18.2%. The compressive stress at the measuring point L4 is the smallest. The compressive stress before and after the reinforcement is 0.62 MPa and 0.52 MPa, respectively, which is 12.9% lower than that before the reinforcement. The compressive stress at measuring point L6 is the largest, and the compressive stress before and after reinforcement is 2.82 MPa and 2.42 MPa, respectively, which is reduced by 14.2% compared with that before reinforcement. The reduction range of other measurement points is also between 10%–20%, indicating that the strength of the structure has been improved.

Figure 31: Stress (Condition 5)
Fig. 32 shows the tower stress under eccentric load (Condition 1) before and after reinforcement. The tensile stress at the measuring point M1 is 0.2 MPa and 0.17 MPa before and after reinforcement, which decreases by 19.1% compared with before reinforcement. The compressive stress at M2 measurement point is 1.82 MPa and 1.55 MPa before and after reinforcement, which decreases by 14.9% compared with that before reinforcement. The tensile stress of point M3 measured point is 0.62 MPa and 0.52 MPa respectively before and after reinforcement, which decreases by 16.2% compared with that before reinforcement. The compressive stress of M4 measured point is 0.22 MPa and 0.17 MPa respectively before and after reinforcement, which decreases by 22.7% compared with that before reinforcement.
Fig. 33 shows the tower stress value under eccentric load (Condition 3) before and after reinforcement. Due to the change of loading position, the stress at each measuring point under this working condition is just opposite to that of the previous loading. The tensile stress at M2 measurement point is 0.61 MPa and 0.52 MPa respectively before and after reinforcement, which decreases by 14.8% compared with that before reinforcement. The compressive stress at M3 measurement point is 0.21 MPa and 0.17 MPa respectively before and after reinforcement, which decreases by 19.1% compared with that before reinforcement. The tensile stress at the measuring point M4 is 0.19 MPa and 0.17 MPa respectively before and after reinforcement, which decreases by 10.6% compared with that before reinforcement. Under the same load, the stress of each measuring point decreases in different degrees after reinforcement, which indicates that the strength of the structure meets the requirements and the strength is improved.

Figure 32: Tower stress (Condition 1)
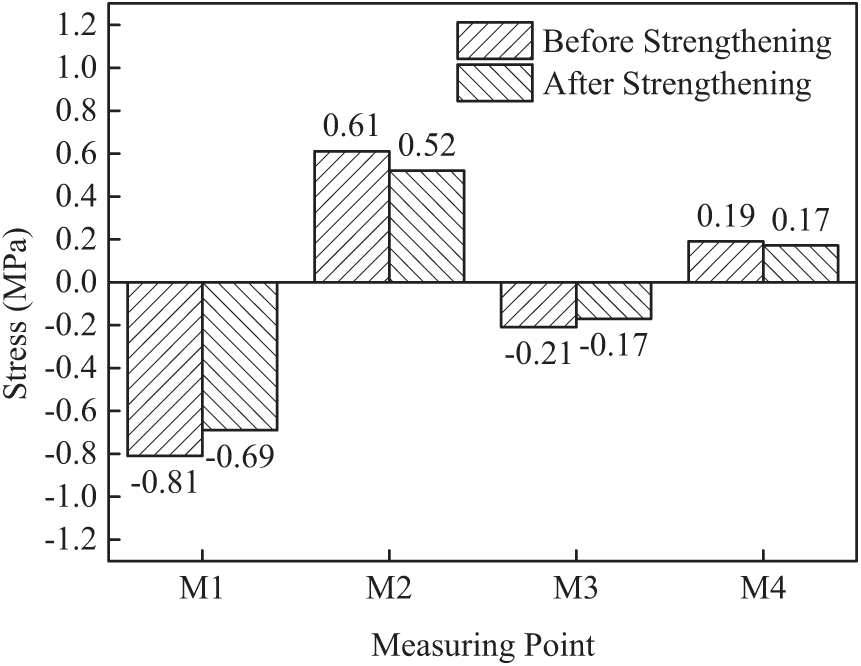
Figure 33: Tower stress (Condition 3)
Under the symmetrical loads (the second span) on the left side of the cable force contrast is shown in Fig. 34. Under the symmetrical loads (the second span) the right side of the cable force contrast is shown in Fig. 35. After the reinforcement, the measured values of the left 9# and right 8# cables are 4.9% smaller than those before the reinforcement, and the measured values of the left 9# and right 8# cables are 3.9% smaller than those before the reinforcement. The decrease range of the cable force of the other cables is 3.9%~4.9%.

Figure 34: Upstream cable force comparison
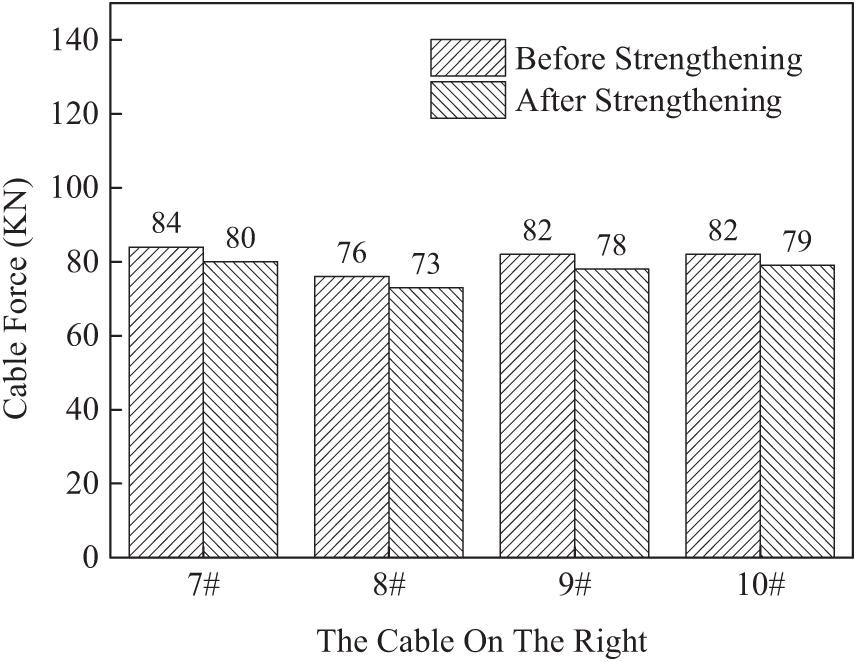
Figure 35: Downstream cable force comparison
Fig. 36 shows the comparison diagram of cable forces on the left side under eccentric load (the middle of the third span), and Fig. 37 shows the comparison diagram of cable forces on the right side under eccentric load (the middle of the third span).As shown in the figure, under the action of eccentric load, the cable force of the bridge increases, and the cable force measured on the right is obviously higher than that on the left, and the measured cable force after reinforcement is all smaller than that before reinforcement. Among them, the cable force value after the reinforcement of the left 14# cable is 3.6% lower than that before the reinforcement, the measured value of the left 16# cable is 4.8% lower than the theoretical value, and the cable force decreases within the range of 3.6%~4.8% after the reinforcement of the other cables.
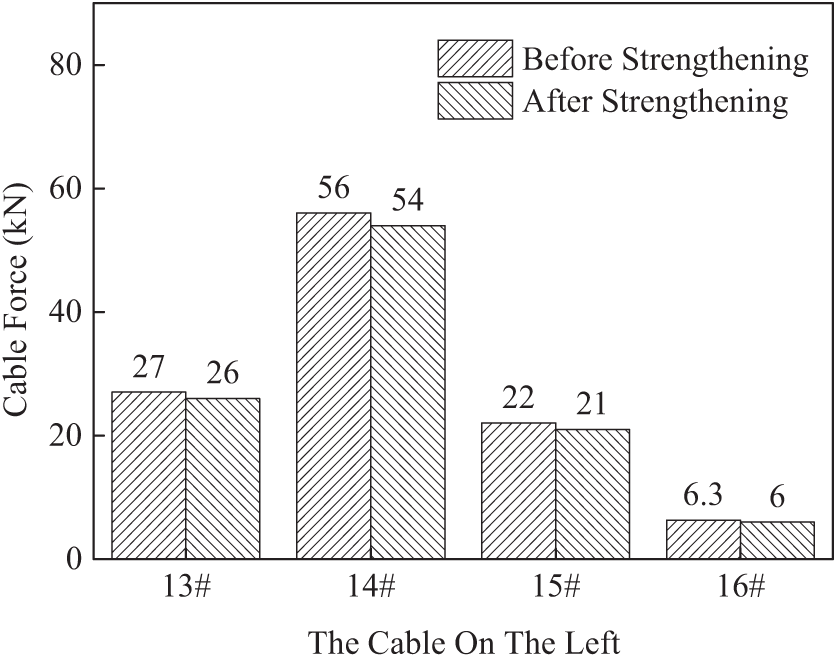
Figure 36: Upstream cable force comparison

Figure 37: Downstream cable force comparison
Under the symmetrical loads (the second straddle in the middle) in the second span, the bridge tower deviation contrast value is shown in Fig. 38. Under the symmetrical loads (the third straddle straddle) in the third span, the bridge tower deviation contrast diagram is shown in Fig. 39. On both sides of the cable tower deformation uniformity is good, the cable tower offset values are less than the offset value of reinforcement former, reduce the range of 4.5%~5.6%, enough stiffness cable tower structure are proved.
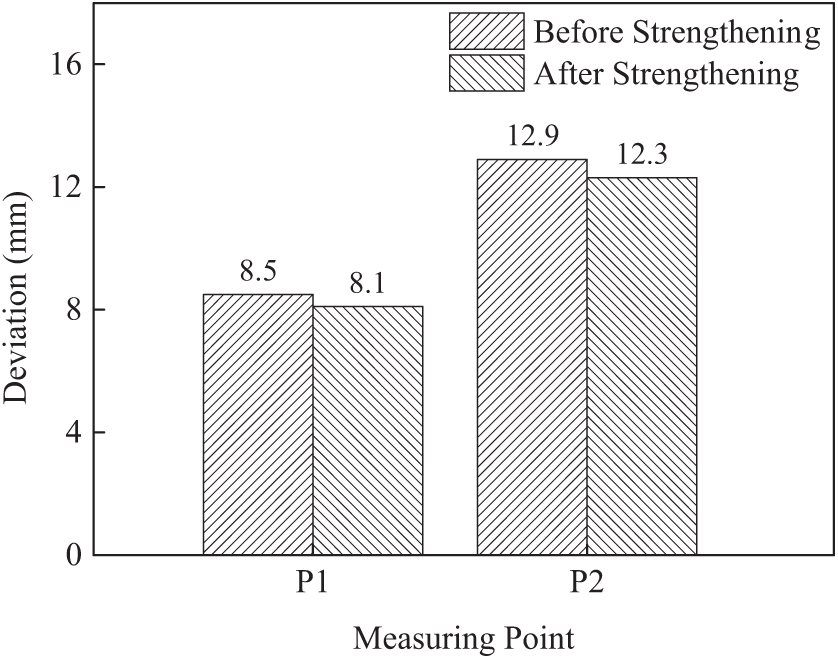
Figure 38: Tower migration contrast in working Condition 1

Figure 39: Tower migration contrast in working Condition 2
6.2.1 Natural Vibration Frequency Test
In the forward load test, when the load test vehicle drives off the test bridge span, due to the action of inertia, the vibration of the test bridge span structure will not immediately return to the equilibrium position, and it is still vibrating. In the test of impact load, the sudden impact load on the bridge deck arouses the free vibration of the bridge span structure. However, due to the existence of damping action, the vibration energy is consumed. As a result, the vibration decreases gradually in a short period of time until the bridge structure returns to a stable equilibrium position.
The pulsation curve of the bridge without external force and the time-domain curve of the free attenuating vibration of the bridge span under impact load have been measured by the speed sensor placed on the bridge deck of the test hole. The waveform of the collected time-history graph is analyzed by spectrum analysis.
The measured natural vibration frequencies of the third span are shown in Figs. 40–43.
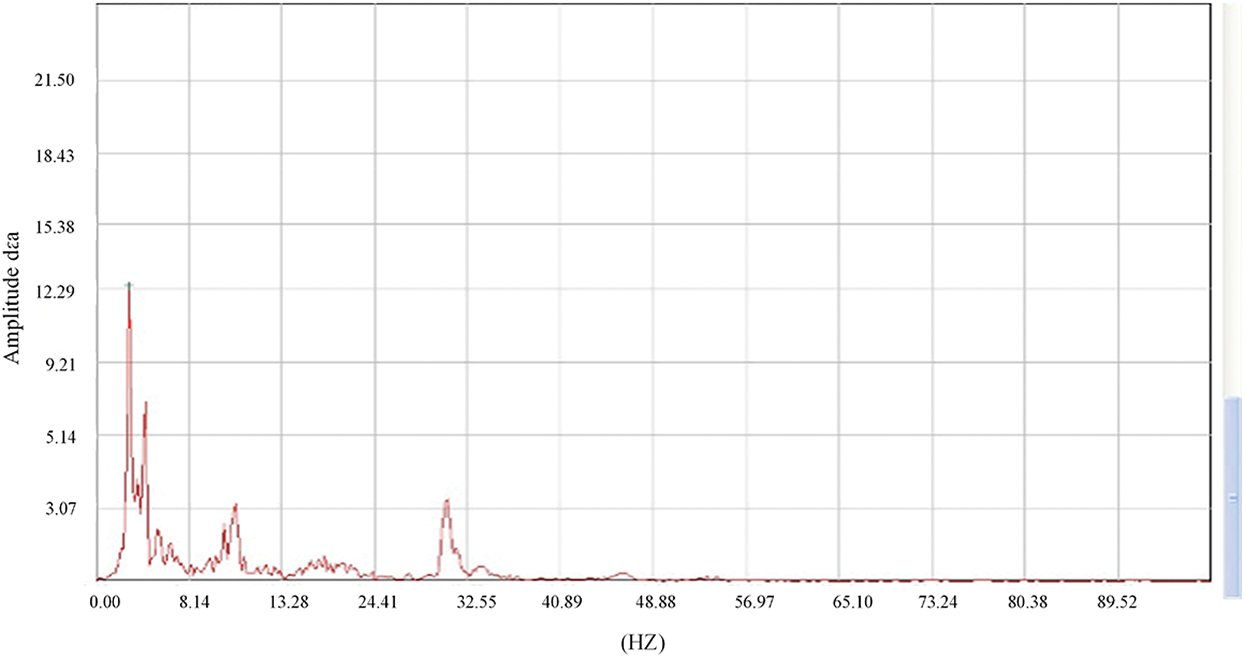
Figure 40: Natural spectrum diagram of pulsation test bridges (f = 2.71 Hz)

Figure 41: Natural spectrum diagram of bridge at 10 km/h (f = 2.75 Hz)

Figure 42: Natural spectrum diagram of bridge at 20 km/h (f = 2.77 Hz)

Figure 43: Natural spectrum diagram of bridge at 30 km/h (f = 2.82 Hz)
The measured natural vibration frequency of the bridge at the vehicle speed of 10 km/h, 20 km/h and 30 km/h. The frequency of the third span is 2.71 Hz~2.82 Hz. The measured data are larger than the theoretical data, which indicates that the bridge structure has greater actual stiffness.
6.2.2 Damping Characteristic Test
The damping characteristics of bridge structures are generally expressed by logarithmic attenuation or damping ratio D. The measured attenuation curve of free vibration is shown in the figure. According to the vibration theory, the logarithmic attenuation rate is as follows:
According to the vibration theory, the relationship between logarithmic attenuation rate and damping ratio is as follows:
Since the damping ratio of general materials is very small, it can be approximated as:
The measured damping ratio reflects the ability of the bridge structure to dissipate the external energy input. A large damping ratio indicates that the bridge structure has a strong ability to dissipate the external energy input and the vibration attenuation is fast. Small damping ratio indicates that the bridge structure has poor ability to dissipate the external energy input and the vibration attenuation is slow. However, excessive damping ratio indicates that there may be cracks in the bridge structure or abnormal working condition of the support. The data curves of jump test and brake test are collated and analyzed, and their attenuation rule is taken as the reference of the measured damping ratio of the bridge. The damping ratio of the third span can be calculated according to Figs. 44–47.

Figure 44: Jumping attenuation curve 1 (damping ratio 0.027)
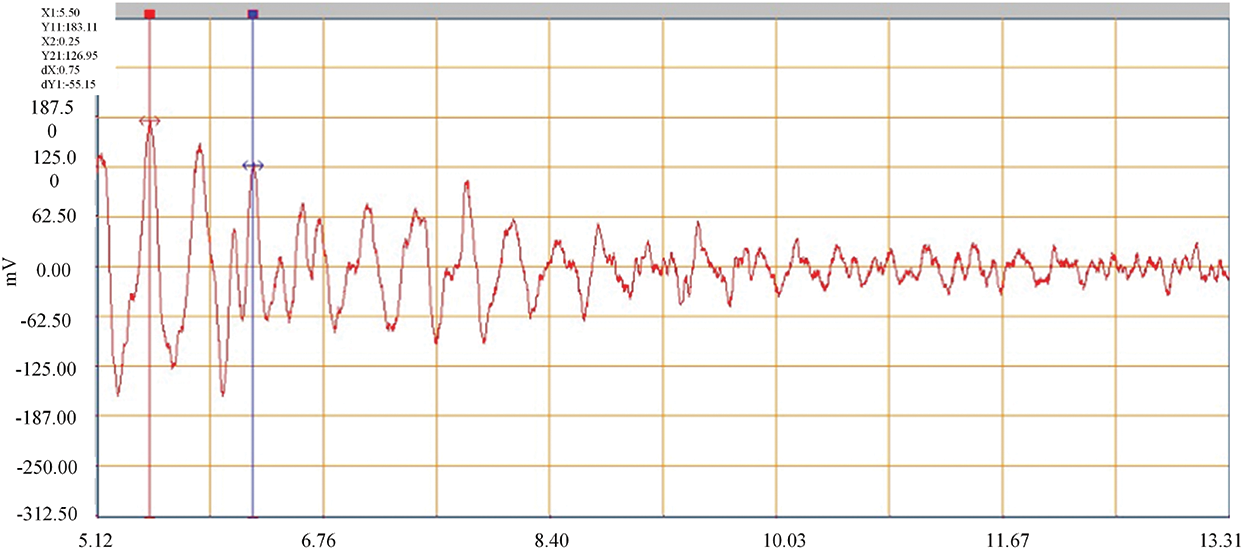
Figure 45: Jumping attenuation curve 2 (damping ratio 0.030)
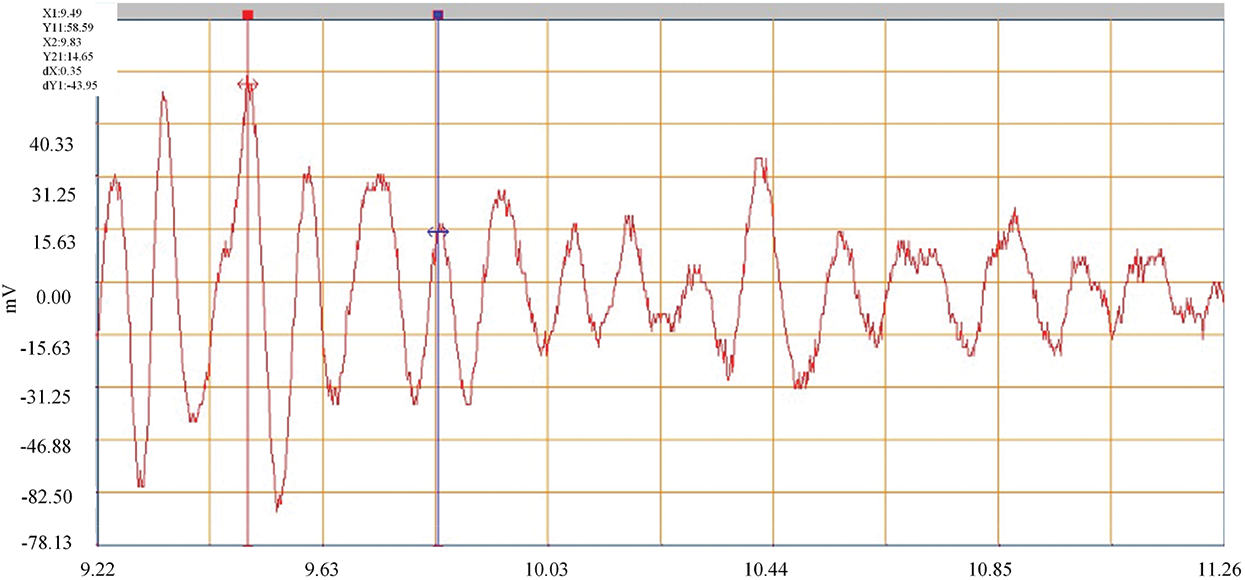
Figure 46: Brake attenuation curve 1 (damping ratio of 0.037)

Figure 47: Brake attenuation curve 2 (damping ratio of 0.042)
The damping ratio of the bridge structure is between 0.01 and 0.08. Through the analysis of the test data, it is known that the damping ratio of the third span is between 0.027 and 0.042, and the measured values are all within a reasonable range.
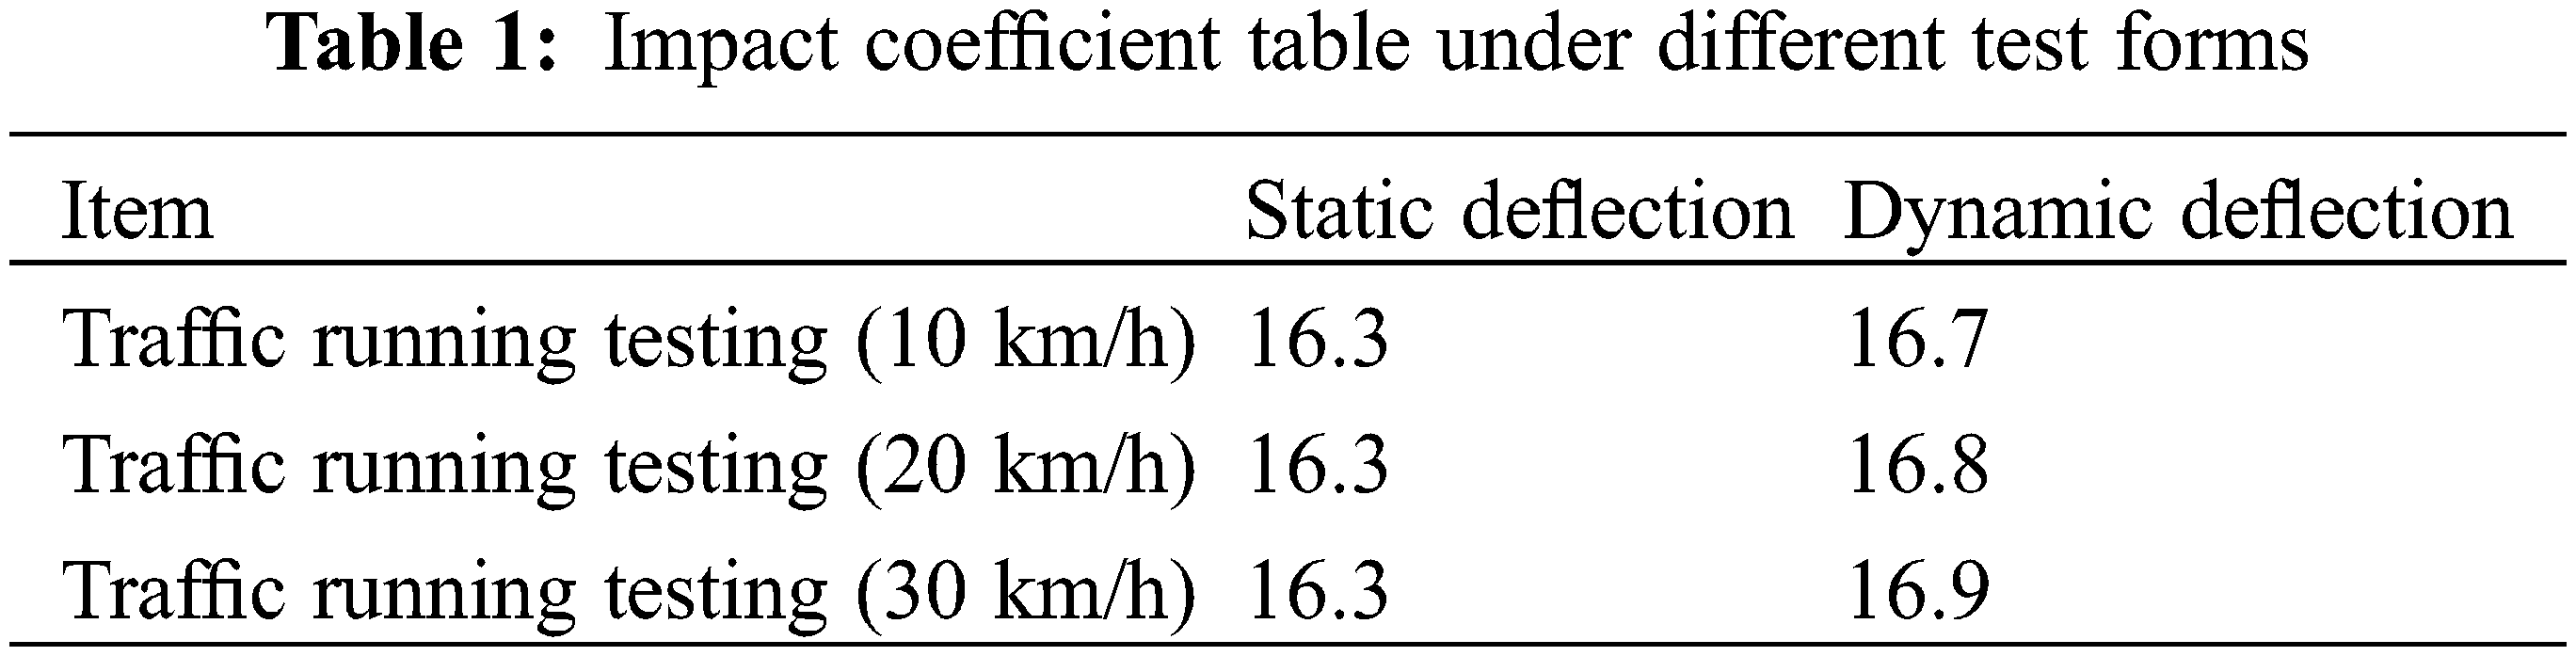
The dynamic deflection produced by dynamic load on the bridge structure is generally larger than the corresponding static deflection produced by the same static load. The ratio of the dynamic deflection to the corresponding static deflection is called the impact factor of the live load. Since the deflection reflects the overall deformation of the bridge structure and is the main index to measure the structural stiffness, the live load impact coefficient comprehensively reflects the dynamic action of the dynamic load on the bridge structure.
The impact coefficient of each section of the third span is shown in Table 1. By comparing the measured impact coefficient. It can be seen that the actual impact coefficient increases with the increase of external energy. Under the condition of trucks with a speed of 30 km/h, the impact coefficient reaches the maximum of 1.038, which does not exceed the theoretical calculation value of 1.05.
The significance of bridge health monitoring mainly includes three aspects: monitoring and evaluation, design verification, and research and development. (1) Monitoring and Evaluation. The basic connotation of bridge health monitoring is to provide the basis and guidance for the bridge maintenance, repair and management decision making by monitoring and evaluating the bridge structure state, to send out early warning signal for the project under the special climate, traffic condition or the serious abnormal operation condition. (2) Design Verification. Because of the mechanical and structural characteristics of large bridges and the specific environment they are in, it is very difficult to grasp and predict the mechanical and behavioral characteristics of large bridges in the design stage. Therefore, it is of great significance to test the theoretical model and calculation assumption of the bridge through the static and static behavior of the actual structure obtained from the bridge health monitoring. (3) Research and Development (RD). Bridge health monitoring will bring not only the rethinking of the monitoring system and the design of a particular bridge, but also the possibility of becoming a field laboratory for bridge research. The information obtained from bridge structure and its environment in operation is not only a supplement to theoretical research and laboratory investigation, but also can provide real information about structural behavior and environmental laws.
The safety early warning system of Muling River Bridge in Mishan City is divided into three levels: blue early warning, yellow early warning and red early warning, and the safety early warning limits under different levels are established, respectively. The establishment of blue warning limit is based on monitoring data samples and statistics. The establishment of the yellow warning limit is based on the calculation value under the reference finite element model under the relevant working conditions. The red warning limit is established by the allowable value under the limit state of bearing capacity in the relevant specifications. The blue warning determines whether the structural response value exceeds the usual variation range of the structural response in the historical monitoring period. If it exceeds the limit, the bridge state changes should be closely tracked to find out the cause of the over-limit. The yellow warning is used to judge whether the response value of the structure exceeds the upper and lower limit value calculated according to the most unfavorable or favorable distribution under the design load. If the value exceeds the limit value, it indicates that the bearing capacity of the structure is insufficient under the design load. Red warning determines whether the response value of the structure exceeds the allowable value or design value related to the ultimate strength of the material in the code. If it exceeds the limit, it means that the component has failed and the bridge structure is in an extremely dangerous state.
Deflection curves of the second and third spans in 1000 s have been collected for this health monitoring. According to the established early warning system of Muling River Bridge, the safety monitoring of the normal performance of main girder can be realized. The deflection time history curves of the second and third spans are shown in Fig. 48. It can be seen from the figure that only a small number of data exceed the blue warning limit and innumerable data exceed the yellow warning limit, indicating that the structure is in a safe state.

Figure 48: Time history diagram of main beam deflection measurement points (a) Point D1 (b) Point D2 (c) Point D3 (d) Point D4
According to the established early warning system of Muling River Bridge, the safety early warning of main girder strain monitoring data can be realized. The strain curves of the first and fourth spans have been collected for 1000 s. The time history curves of the strain measuring points of the first span, the second span and the top of the 2# pier are shown in Fig. 49. As can be seen from the figure, a very small amount of data is close to the blue warning limit, and countless data exceed the yellow and red warning limit, indicating that the structure is in a safe state.
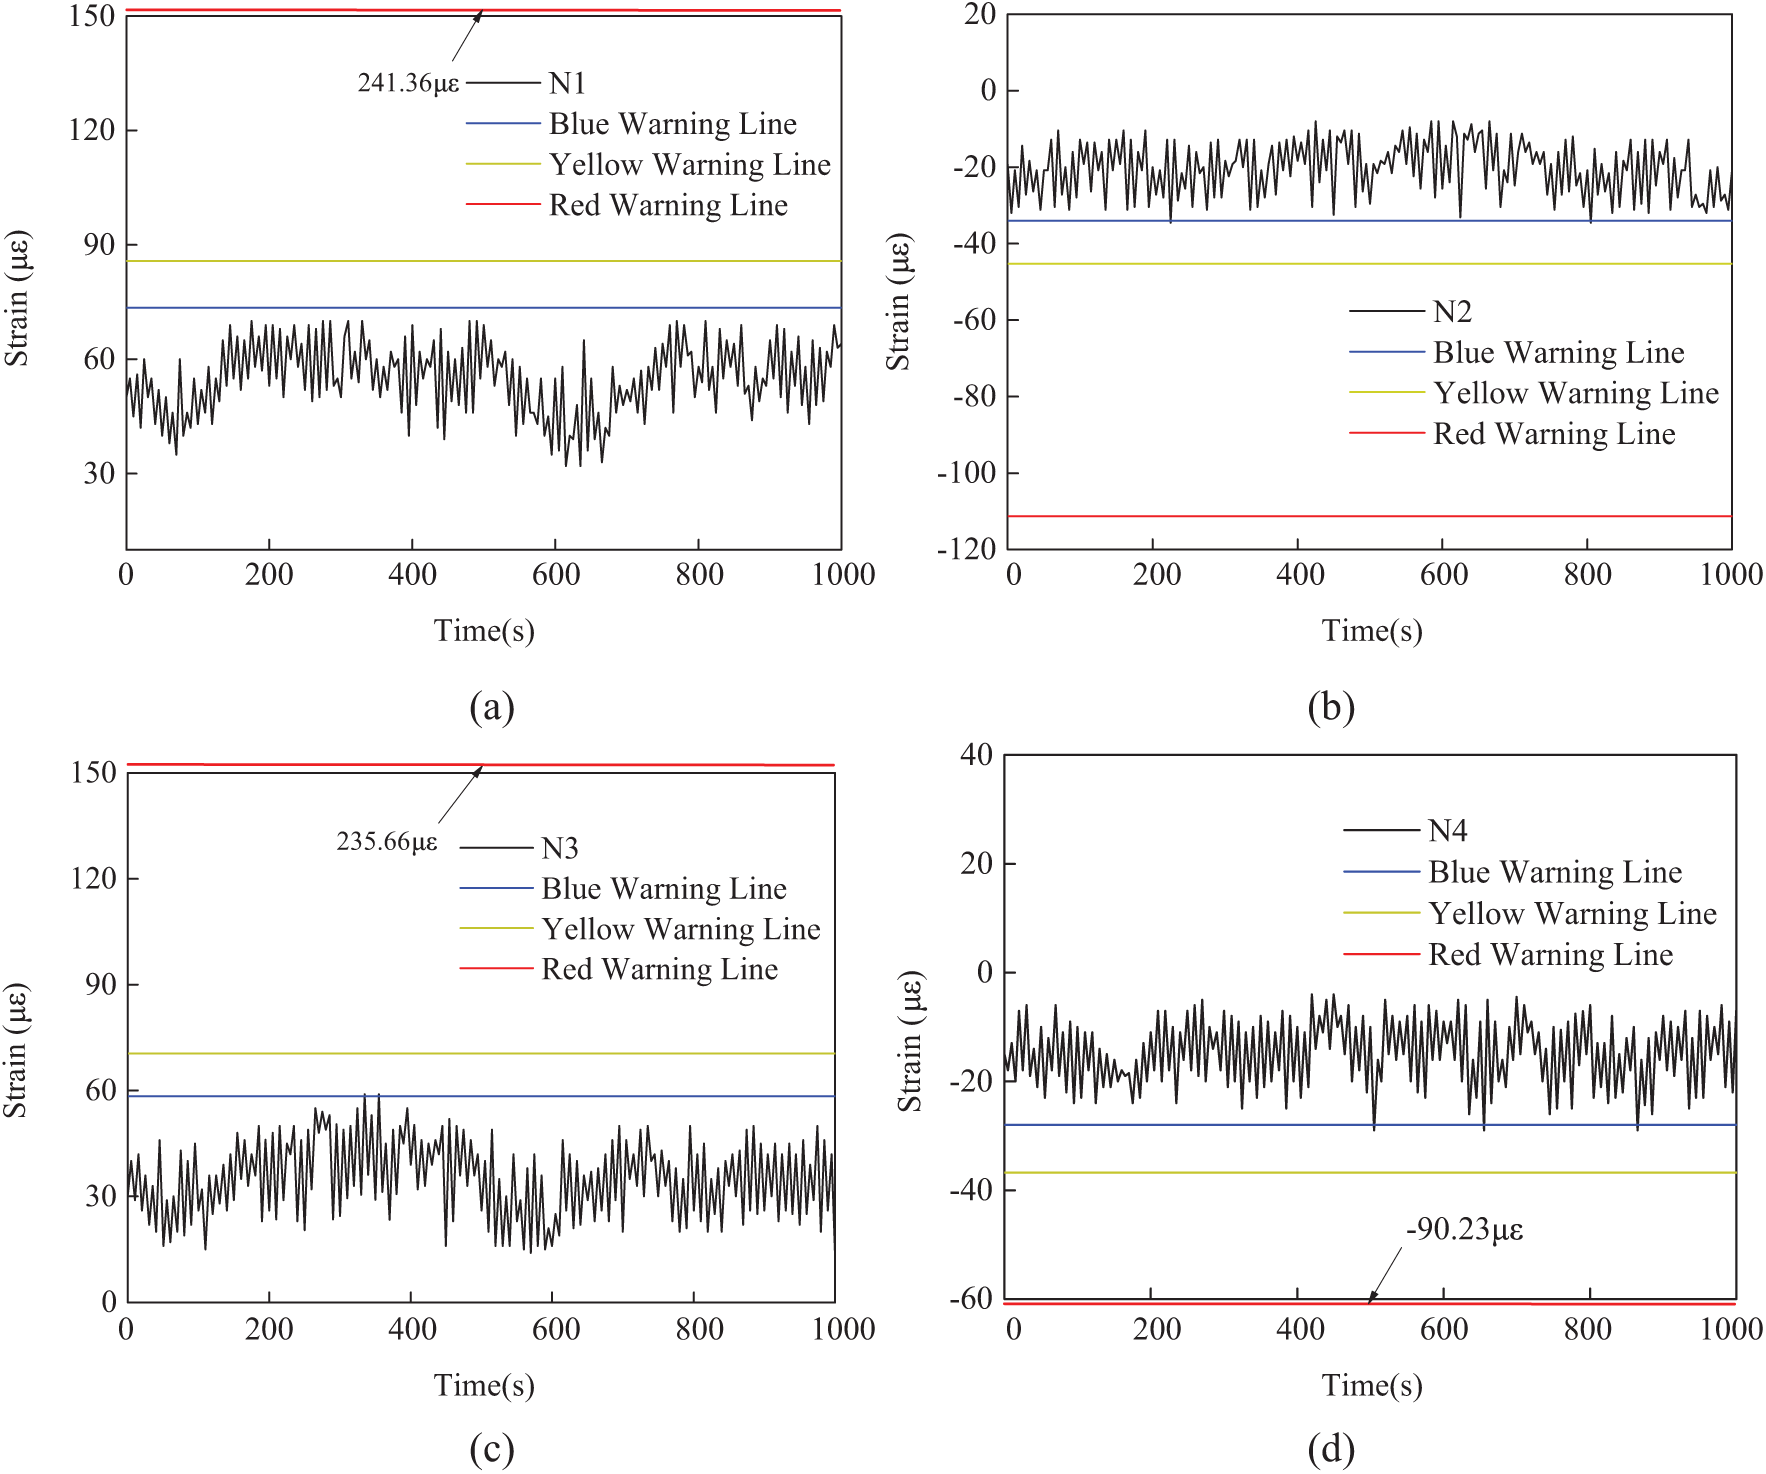
Figure 49: Time history diagram of main girder strain measuring points (a) Point N1 (b) Point N2 (c) Point N3 (d) Point N4 (e) Point L1 (f) Point L2
This paper discusses an innovative reinforcement technique to improve the flexural strength and stiffness of the reinforced concrete cable-stayed bridge. Based on the results of static load tests and post-reinforcement health monitoring, the following conclusions can be drawn:
1. Static load test
(1) After the reinforcement, the deflection of the middle span and the side span decreases to different degrees. Among them, the middle rib deflection of the 2# span decrease most obviously under symmetric load, and the deflection decreases by 15.3% compared with those before the reinforcement. Under the action of eccentric load, the deflection of 2# span edge girder decreases most obviously, the deflection after reinforcement decreases by 20.6% compared with that before reinforcement, and the deflection at measuring points of other spans also decreases by 10%~20%.
(2) After reinforcement, the stress of concrete decreases to different degrees. Under eccentric load, the stress at the bottom decreases in the range of 10%~15%. The high stress of the main beam along the beam also decreases to a certain extent, and the decrease of intermediate span and edge span is the most obvious, which are 19.4% and 17.0%, respectively.
(3) Under the action of eccentric load, the stress at the top of the reinforced pier decreases the most obviously, which is 20.0%, and the stress at other measuring points also decreases between 10% and 20%. After the reinforcement, the stress of the tower also decreases, the most obvious decrease is 22.7%, and the decrease range of other measuring points is also between 10% and 20%.
(4) Under the action of test load, the measured cable force values of the cables after reinforcement are all smaller than those before reinforcement, and the reduction range of the cable force values is 3.6%~4.9%, indicating that the stiffness of the structure can meet the requirements and has been improved. In the deflection test of the cable tower, the deformation on both sides of the cable tower is consistent. The offset values of the cable tower after reinforcement are all smaller than that after reinforcement, and the drop range is 4.5%~5.6%, indicating that the cable tower structure has enough stiffness after reinforcement.
2. In the health monitoring data collection, the mid-span deflection of the second span is 4 mm~10 mm, and the mid-span deflection of the third span is 2.5 mm~7 mm. The strain value of the upper edge of the middle section of the second span is −10 με~−40 με, and the strain value of the lower edge is 30 με~75 με. The strain value at the upper edge of the middle section of the third span is −5 με~−25 με and 20 με~60 με at the lower edge. The strain value at the upper edge of the pier top is 3 με~17 με, and the strain value at the lower edge is −10 με~30 με. When the bridge is in normal use, the deflection and strain of the bridge rarely exceed the limit value of the blue warning line, and the structure is in a safe state.
3. Although the strength and stiffness of the strengthened bridge have been improved obviously, there are still some problems that need to be further studied. On the one hand, the durability of the reinforced prestressed strand is the content that needs to be studied in the future; on the other hand, whether the prestressed strand will cause more serious losses is also the content that needs to be studied in the future.
Funding Statement: The authors received no specific funding for this study.
Conflicts of Interest: The authors declare that they have no conflicts of interest to report regarding the present study.
1. Cho, S., Jo, H., Jang, S., Park, J., Jung, H. J. et al. (2010). Structural health monitoring of a cable-stayed bridge using smart sensor technology: Deployment and evaluation. Smart Structures & Systems, 6(5–6), 439–459. DOI 10.1016/10.12989/sss.2010.6.5_6.439. [Google Scholar] [CrossRef]
2. Wang, H., Li, A., Niu, J., Zong, Z., Li, J. (2013). Long-term monitoring of wind characteristics at Sutong Bridge site. Journal of Wind Engineering & Industrial Aerodynamics, 115, 39–47. DOI 10.1016/j.jweia.2013.01.006. [Google Scholar] [CrossRef]
3. Miao, J., Pei, M., Zhang, X., Xiao, R. (2006). Global analysis of the SuTong cable-stayed bridge. Journal of Highway & Transportation Research & Development, 1(1), 51–55. DOI 10.1061/JHTRCQ.0000143. [Google Scholar] [CrossRef]
4. Wang, H., Tao, T., Li, A. (2016). Structural health monitoring system for sutong cable-stayed bridge. Smart Structures & Systems, 18(2), 317–334. [Google Scholar]
5. You, Q., Zhang, X., Feng, L., Liu, H. (2007). (IBC 07-04) Sutong Bridge-A Thousand-meter span Cable-stayed Bridge across Yangtze River. 24th Annual International Bridge Conference: Bridging Continents. Sharing Ideas. Jiangsu Provincial Sutong Bridge Construction Commanding Department. Nantong, China. [Google Scholar]
6. Xie, X., Li, X., Shen, Y. (2014). Static and dynamic characteristics of a long-span cable-stayed bridge with CFRP cables. Materials, 7(6), 4854–4877. DOI 10.3390/ma7064854. [Google Scholar] [CrossRef]
7. Chin, W. J., Kim, Y. J., Kim, H. S., Yoon, H. J., Kim, B. S. et al. (2013). Innovative slip form method for the construction of tapered concrete pylon of long-span cable bridge. Iabse Symposium Report, 101(1), 1–6. DOI 10.2749/222137813815776151. [Google Scholar] [CrossRef]
8. Wang, F. L. (2011). Study on ultimate load-carrying capacity of long-span composite girder cable-stayed bridge with three pylons. Advanced Materials Research, 243–249, 1952–1956. DOI 10.4028/www.scientific.net/AMR.243-249.1952. [Google Scholar] [CrossRef]
9. Yang, Y., Mccabe, S. L. (2001). The ultimate load-carrying capacity of concrete cable-stayed bridges. Iabse Symposium Report, 130–131. [Google Scholar]
10. Lin, K., Xu, Y. L., Lu, X., Guan, Z., Li, J. (2021). Digital twin-based collapse fragility assessment of a long-span cable-stayed bridge under strong earthquakes. Automation in Construction, 103, 103547. DOI 10.1016/j.autcon.2020.103547. [Google Scholar] [CrossRef]
11. Xie, W., Sun, L. (2021). Transverse seismic response and failure mode of towers of a cable-stayed bridge full-model: tests and simulations. Engineering Failure Analysis, 122(11), 105224. DOI 10.1016/j.engfailanal.2021.105224. [Google Scholar] [CrossRef]
12. Alamdari, M. M., Khoa, N., Wang, Y., Samali, B., Zhu, X. (2019). A multi-way data analysis approach for structural health monitoring of a cable-stayed bridge. Structural Health Monitoring, 18(1), 35–48. [Google Scholar]
13. Zhang, J., Li, C., Xu, F., Yu, X. (2007). Test and analysis for ultimate load-carrying capacity of existing reinforced concrete arch ribs. Journal of Bridge Engineering, 12(1), 4–12. DOI 10.1061/(ASCE)1084-0702(2007)12:. [Google Scholar] [CrossRef]
14. Ni, Y. C., Alamdari, M. M., Ye, X. W., Zhang, F. L. (2021). Fast operational modal analysis of a single-tower cable-stayed bridge by a Bayesian method. Measurement, 12, 109048. DOI 10.1016/j.measurement.2021.109048. [Google Scholar] [CrossRef]
15. Taljsten, B., Nordin, H. (2007). Concrete beams strengthened with external prestressing using external tendons and near-surface-mounted reinforcement (NSMR). ACI Symposium Publication, 245, 143–164. [Google Scholar]
16. Zhao, S. W., Qiao, X. P. (2011). Experimental study on reinforced hollow beam with carbon fiber reinforced polymer and external prestressed strand. Applied Mechanics & Materials, 94–96, 495–499. DOI 10.4028/www.scientific.net/AMM.94-96.495. [Google Scholar] [CrossRef]
17. Zhang, J., Zhou, P., Guan, C., Liu, T. Q., Gao, S. (2020). An ultra-lightweight CFRP beam-string structure. Composite Structures, 257(1), 113149. [Google Scholar]
18. Xiao, Z., Mo, F., Zeng, D., Yang., C. (2020). Experimental and numerical study of hat shaped CFRP structures under quasi-static axial crushing. Composite Structures, 249, 112465. DOI 10.1016/j.compstruct.2020.112465. [Google Scholar] [CrossRef]
19. Koh, B. H., Dyke, S. J. (2007). Structural health monitoring for flexible bridge structures using correlation and sensitivity of modal data. Computers & Structures, 85(3–4), 117–130. DOI 10.1016/j.compstruc.2006.09.005. [Google Scholar] [CrossRef]
20. Koo, K. Y. (2013). Structural health monitoring of the Tamar suspension bridge. Structural Control and Health Monitoring, 20(4609–625. DOI 10.1016/10.1002/stc.1481. [Google Scholar] [CrossRef]
21. Seo, J., Phares, B., Lu, P., Wipf, T., Dahlberg, J. (2013). Bridge rating protocol using ambient trucks through structural health monitoring system. Engineering Structures, 46, 569–580. [Google Scholar]
22. Ponzo, F. C., Ditommaso, R., Auletta, G., Mossucca, A. (2010). A fast method for structural health monitoring of Italian strategic reinforced concrete buildings. Bulletin of Earthquake Engineering, 8(6), 1421–1434. [Google Scholar]
23. Sun, M., Staszewski, W. J., Swamy, R. N. (2010). Smart sensing technologies for structural health monitoring of civil engineering structures. Advances in Civil Engineering, 2010(11), 1–13. DOI 10.1016/10.1155/2010/724962. [Google Scholar] [CrossRef]
24. Gatti, M. (2019). Structural health monitoring of an operational bridge: A case study. Engineering Structures, 195, 200–209. DOI 10.1016/j.engstruct.2019.05.102. [Google Scholar] [CrossRef]
25. Hapsari, A. A., Supriyanto, E., Hasan, A., Suharjono, A. (2021). Accelerometer sensor data analysis of bridge structural health monitoring system. IOP Conference Series: Materials Science and Engineering, vol. 1108, no. 1, pp. 012026. DOI 10.1016/10.1088/1757-899X/1108/1/012026. [Google Scholar] [CrossRef]
26. Caicedo, J. M., Dyke, S. J. (2010). Experimental validation of structural health monitoring for flexible bridge structures. Structural Control & Health Monitoring, 12(3–4), 425–443. DOI 10.1016/10.1002/stc.78. [Google Scholar] [CrossRef]
 | This work is licensed under a Creative Commons Attribution 4.0 International License, which permits unrestricted use, distribution, and reproduction in any medium, provided the original work is properly cited. |