| Structural Durability & Health Monitoring |
DOI: 10.32604/sdhm.2021.017526
ARTICLE
Fatigue Performance of Orthotropic Steel Decks in Super-Wide Steel Box Girder Considering Transverse Distribution of Vehicle Load
1Key Laboratory of Concrete and Prestressed Concrete Structures of Ministry of Education, Southeast University, Nanjing, 211189, China
2School of Civil Engineering, Southeast University, Nanjing, 211189, China
*Corresponding Author: Changqing Miao. Email: chqmiao@163.com
Received: 17 May 2021; Accepted: 09 September 2021
Abstract: This study presents an investigation on the fatigue analysis of four types of details on orthotropic steel decks (OSDs) for a cable-stayed super-wide steel box girder bridge based on finite-element analysis (FEA) with vehicle transverse distribution model (VTDM). A high-fidelity 3D FE model verified by the static load test is established to satisfy the fatigue analysis accuracy. The stress behavior of super-wide steel box girders under the vehicle load at different lane locations is investigated. Then, considering the effect of VTDM, the fatigue life analysis of four typical details is performed using the Miner cumulative damage rule. The results show that the vehicle transverse location has a great influence on the stress behavior of details with sharp influence surface, and the stress ranges in the outermost lane are larger than those in other lanes, indicating that the details of OSD in the outermost lane are prone to fatigue. The fatigue life analysis indicates that the diaphragm cutout is more prone to fatigue than other details, which should be carefully treated in bridge maintenance.
Keywords: Orthotropic steel deck; steel box girder; fatigue life; vehicle transverse distribution model; finite element analysis
Orthotropic steel deck (OSD) has become a standard component of major steel girders, particularly steel box girders, due to its advantages of light weight, expedient construction, structural redundancy, etc. [1]. However, OSDs are prone to fatigue damage at the welded connections, and thus the fatigue cracking may appear in fatigue-prone details (hereinafter called details) under long-term cyclical vehicle loads [2,3]. The typical details include the rib-to-deck weld, the floor beam (FB) or diaphragm cutout, the rib-to-FB or diaphragm connection, and the welded rib splice, etc. [4–6].
Many scholars have conducted the fatigue analysis of details on OSD in the literature. Kainuma et al. [7] concluded that the cracking in the rib-to-deck weld may destroy the pavement of the deck and the corrosion damage may also occur in the U-rib due to rainwater penetrating through the cracks, resulting in serious consequences for the OSD. Fu et al. [8] performed several fatigue tests on the U-rib-to-deck weld, the results demonstrated that the fatigue life of this detail can be extended with increasing penetration rate. Although the fatigue test method has been widely adopted in fatigue analysis, it has the disadvantages of harsh condition requirements, long test periods, high test costs, and potential safety problems [9]. The numerical simulation validated through experiments increasingly provides a reasonable performance assessment for structural fatigue. Zhang et al. [10] investigated the influence of vehicle speed and road surface condition on fatigue of steel bridge using the three-dimensional (3D) finite element (FE) model, and the conclusion pointed out that the increase of vehicle speed and the deterioration of road conditions could reduce the fatigue reliability of OSDs. Zhu et al. [11] compared the fatigue performance of two different FB cutouts using FE analysis and field test. Moreover, the investigation on the fatigue damage and stress distribution of OSD was continued by Tian et al. [12] using a 3D FE model.
Nowadays, in order to meet the increasing traffic demand, the steel box girders with larger width would be designed, in which more traffic lanes could be set. Many super-wide steel box girders have been used in the real bridge, such as Qingshan Yangtze River Bridge (girder width: 48 m) [13], Yunlongwan Bridge (girder width: 48.5 m) [14], Linggang Bridge (girder width: 63.9 m) [15], New San Francisco-Oakland Bay Bridge (girder width: 78.74 m) [16], etc. However, the spatial effects (e.g., shear-lag effect, complex deformation effect) of the super-wide steel box girders are quite obvious [17,18], and the effects of wheel loads on the welded details are different in each lane [19], which means the influence of vehicle transverse location should be analyzed carefully. Based on the vehicle transverse distribution model (VTDM) specified in the BS5400 fatigue design code, Battista et al. [20] conducted a fatigue analysis on a steel box girder that has been in operation for 32 years. Similarly, considering the VTDM, Guo et al. [21] proposed a probabilistic FEA approach and applied it in the fatigue analysis of a steel bridge. Zhou et al. [19] concluded that the transverse location of the heavy vehicle could affect the fatigue damage for typical details of OSDs. Cui et al. [22] studied the stress behavior of rib-to-deck weld located at the slow lane (i.e., the truck lane) and proposed a framework for fatigue evaluation of OSDs. So far, limited studies are focusing on the effect of vehicle transverse location on the fatigue performance of OSDs steel box girders, especially for super-wide steel box girders with obvious spatial effects.
In this study, a cable-stayed bridge with a 51-m-wide steel box girder is employed as the engineering background, and a comprehensive framework for fatigue life analysis of OSD in super-wide box girders is presented. Firstly, the FE model which is verified by field test is established to guarantee the accuracy of the simulation. Secondly, the stress behaviors of box girders under the vehicle load applied in different lanes are analyzed, and the most unfavorite lane for fatigue analysis is determined. Then, based on the stress time history of typical details calculated by the FE model, the rain-flow counting method is applied in the calculation of stress amplitude. Finally, considering the effects of the transverse location of vehicles and the traffic growth, the fatigue life of four typical details of OSD is calculated. The objective of this paper is to study the stress behaviors of super-wide steel box girders considering the vehicle transverse location, and to compare the fatigue performance of typical details considering different VTDMs, which help provide suggestions for fatigue design of OSDs.
The Weier bridge (Fig. 1a), a stay-cable bridge with a span layout of 47 m + 86 m + 29 m, is located in Hebei Province, China mainland. The steel box girder is used in the main span to reduce the self-weight and the prestressed concrete box girder is used in the side span to balance the force transmitted from the stay cable to the bridge tower. The transition segment with a length of 6.5 m is set at the connection between the steel box girder and the prestressed concrete box girder, including a 2.5 m steel-concrete joint and a 4 m steel stiffness transition segment. The bridge tower is a steel structure and the height is about 42 m. The main span is arranged with 24 stay cables (12 pairs) named C1 to C12, respectively, and the side span is arranged with 4 stay cables (2 pairs) named C13 and C14, respectively.
The steel box girder at the standard segment is 51 m wide and only 1.9 m high, hence the height/width ratio is quite small compared to a typical girder with a similar span length. The OSD system is used in the steel box girder. Eight traffic lanes named Lanes 1 to 8 from northbound to southbound, respectively, are arranged on the deck, as shown in Fig. 1b. The bridge is designed for a 100-year service and has become the main trunk road connecting the city proper and the suburbs since it opened to traffic.
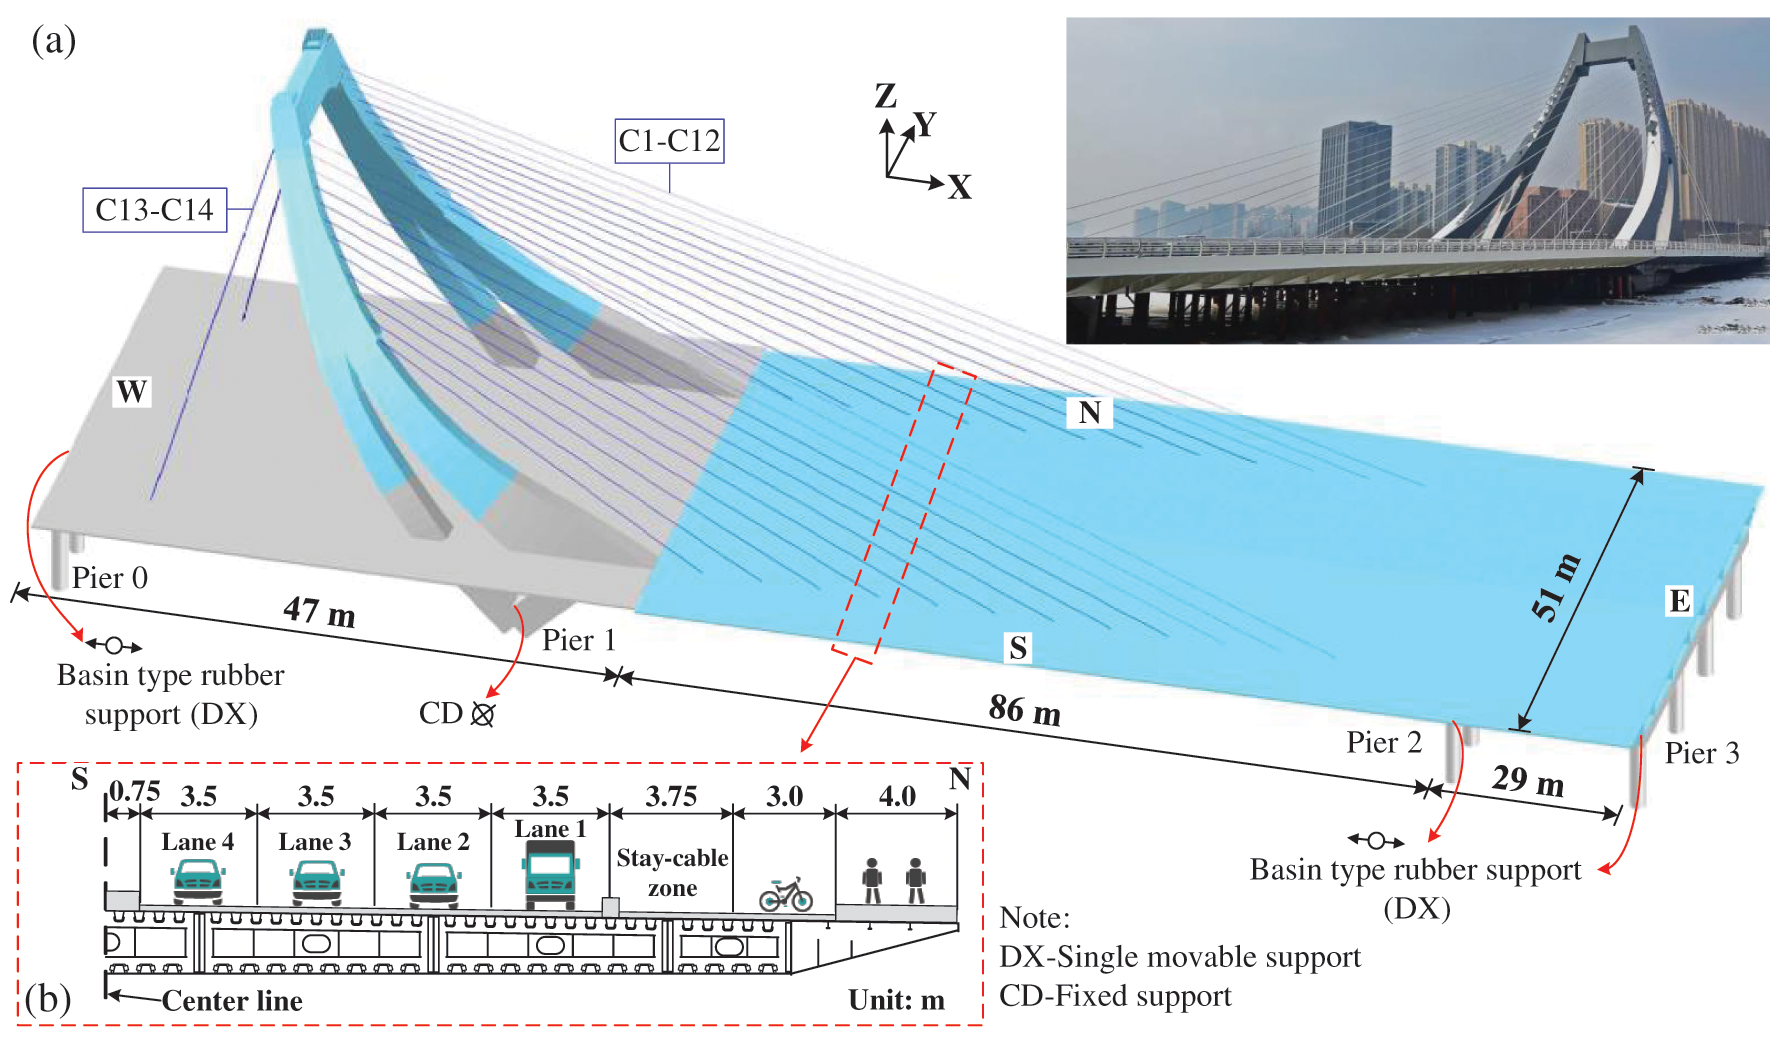
Figure 1: Description of the Weier bridge, (a) Overview; (b) Cross section of steel box girder
To investigate the stress behavior of details, a high-fidelity 3D FE model is established by using the software ANSYS for fatigue analysis. A segmental model of the box girder with a length of 12.4 m is established by using the Shell63 elements, as shown in Fig. 2. The segmental model contains five diaphragms named D1 to D5, respectively, and the stay cables are anchored at the diaphragms of D1, D3, and D5. The Young’s model, the Poisson ratio and the density of the steel are 2.06 × 10⁵ MPa, 0.3 and 7850 kg/m3, respectively.
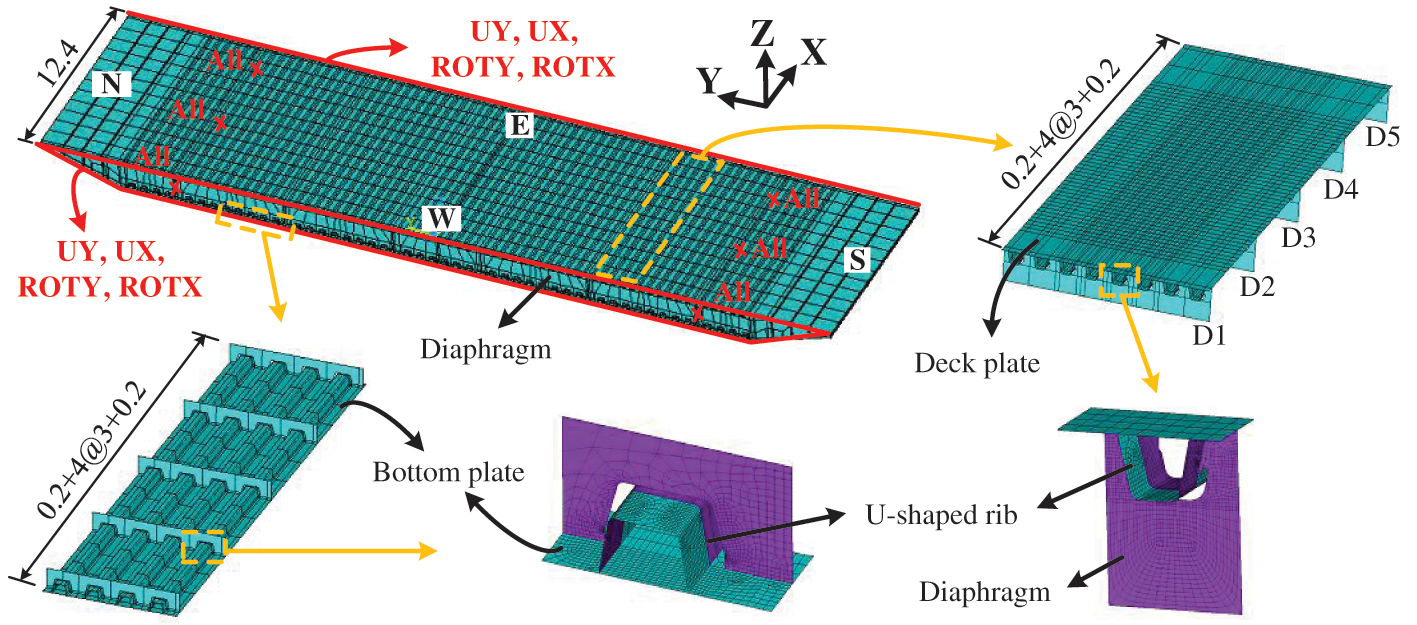
Figure 2: Finite element model (Unit: m)
To find a balance between the computational efficiency and accuracy of the FE model, the non-uniform meshing scheme is adopted, using fine meshes in the regions of interest, and coarse meshes in the other parts [11]. As a result, the FE model includes about 460,000 elements and 417,000 nodes. To simulate the exact boundary condition, the nodes in the diaphragms associated with the anchorage box are all fixed. In the meantime, the nodes at the western end and the eastern end of the FE model are all restricted from translations and rotations in the X and Y directions. According to Saint-Venant’s principle, errors that result from the boundary conditions can be ignored due to the focused area is far away from the boundaries.
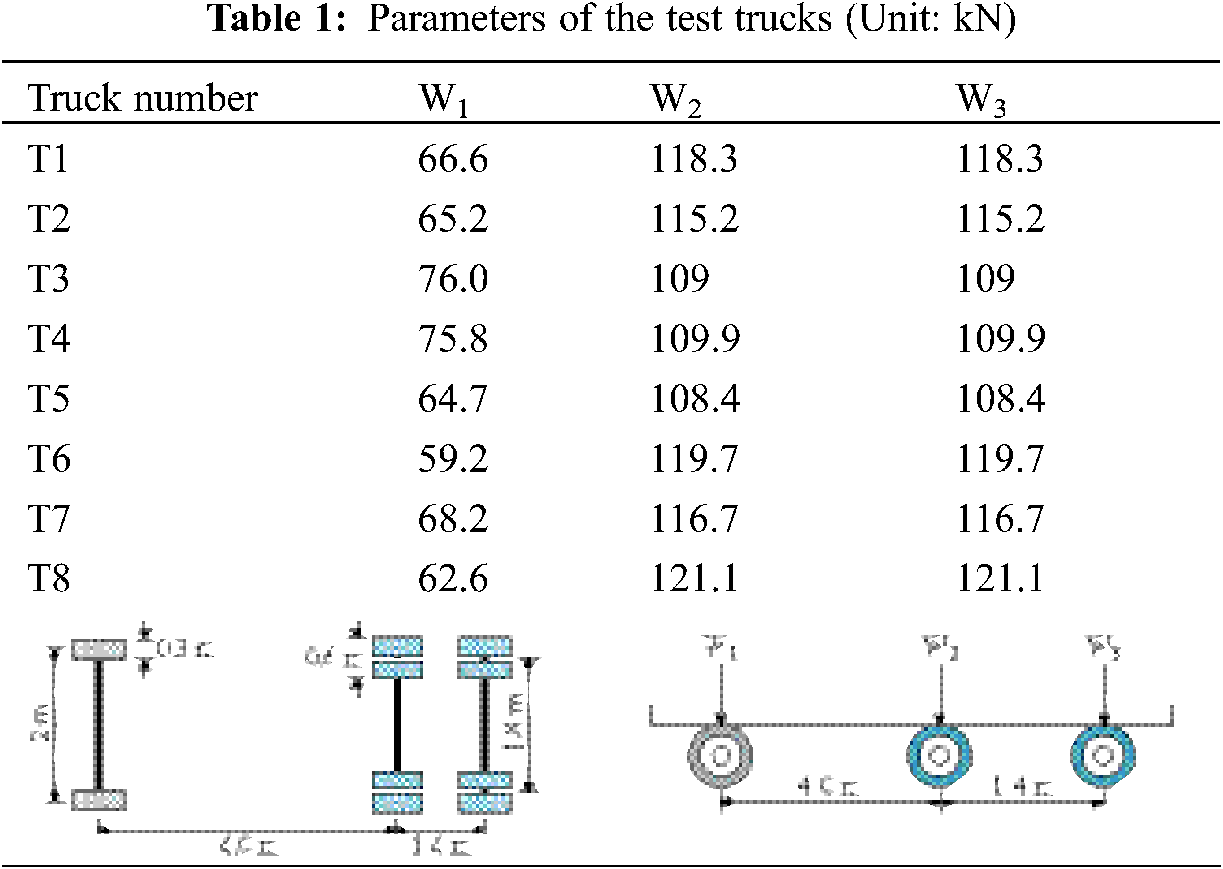
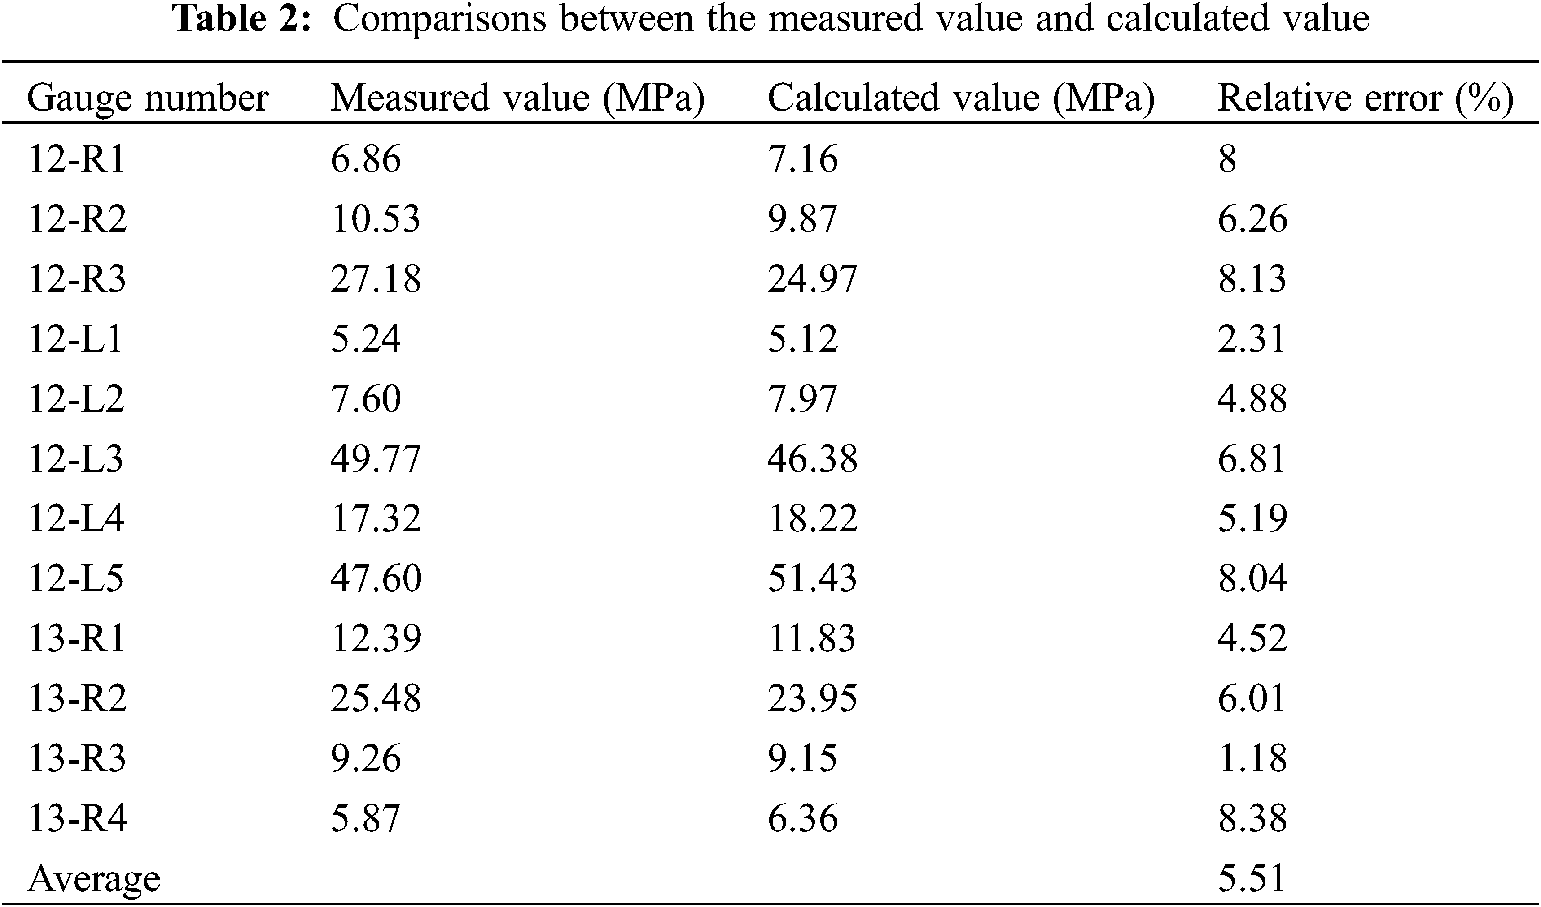
To validate the FE model, the comparison between the measured values in the static load tests and the calculated values in the FE analysis is performed. The schematic diagram of the static load condition is shown in Figs. 3a and 3b. The details among Rib11 to Rib14 (hereafter R11 and R14 in short) in diaphragm D3 are adopted as the analysis objects, and the arrangement of strain gauges is illustrated in Fig. 3c. The parameters of the test trucks are shown in Table 1, and the calculated and measured results are summarised in Table 2. It is seen that the maximum relative error is about 8% and the calculated results are in good agreement with the measured results, indicating the FE model has sufficient accuracy to meet the requirements of the stress analysis of girders later.
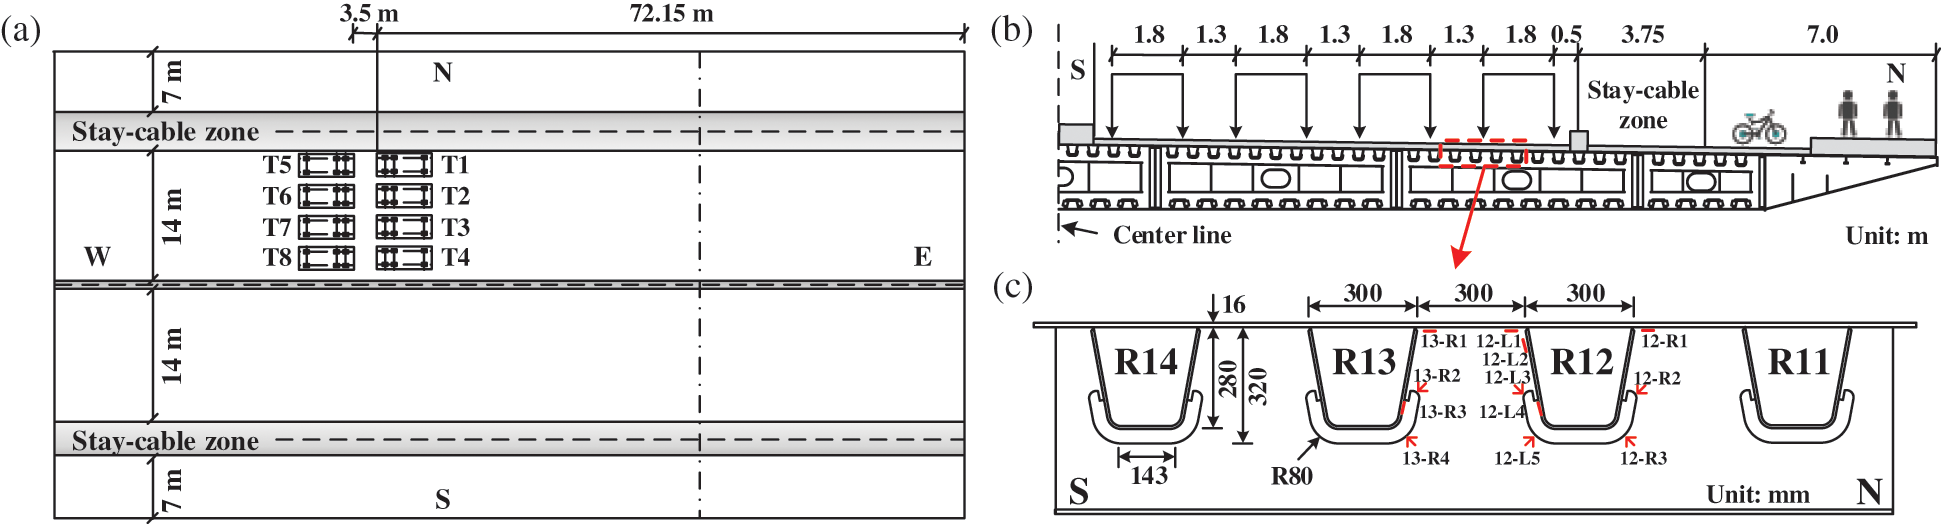
Figure 3: Schematic diagrams of static load conditions, (a) Aerial view; (b) Transverse view; (c) Arrangement of strain gauges
4 Stress Behaviors Analysis of Steel Box Girder
To investigate the stress behaviors of the steel box girder induced by the vehicle loads, the typical details of the OSDs, including the rib-to-deck weld (Detail 1), the diaphragm cutout (Details 2 and 4), and the rib-to-diaphragm weld connection (Detail 3), are evaluated in this study, as shown in Fig. 4. It should be noted that the width of the steel box girder in the case bridge is very large, which results in the deformation of the girder under the vehicle load would be obvious, so the stress behaviors analysis should be conducted before the fatigue performance analysis.
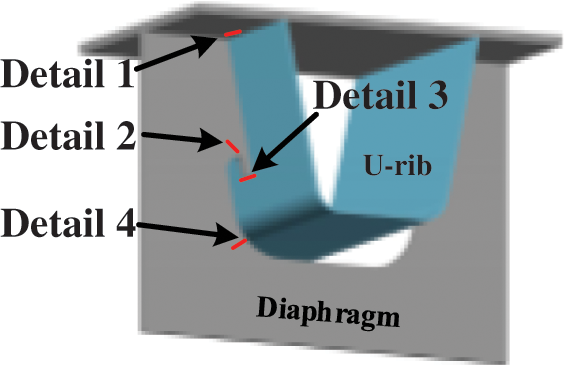
Figure 4: Typical fatigue-prone details of OSD
To study the effect of the vehicle loads on the steel box girder, the test truck T1 in Table 1 is selected as the loading vehicle, and stress-time history analysis of the details at D3 is performed, as shown in Fig. 5. For stress analysis of details, the most unfavorable loading locations corresponding to four lanes are selected. In addition, the transverse (i.e., Y direction) stress, the in-plane stress, the vertical (i.e., Z direction) stress, and the in-plane stress are selected as the concerned stress at the check point for Detail 1, Detail 2, Detail 3, and Detail 4, respectively [8,11,23]. To avoid the influence of stress concentration, the position of the check point is defined at 6 mm away from the weld toe or cutout edge [24,25].
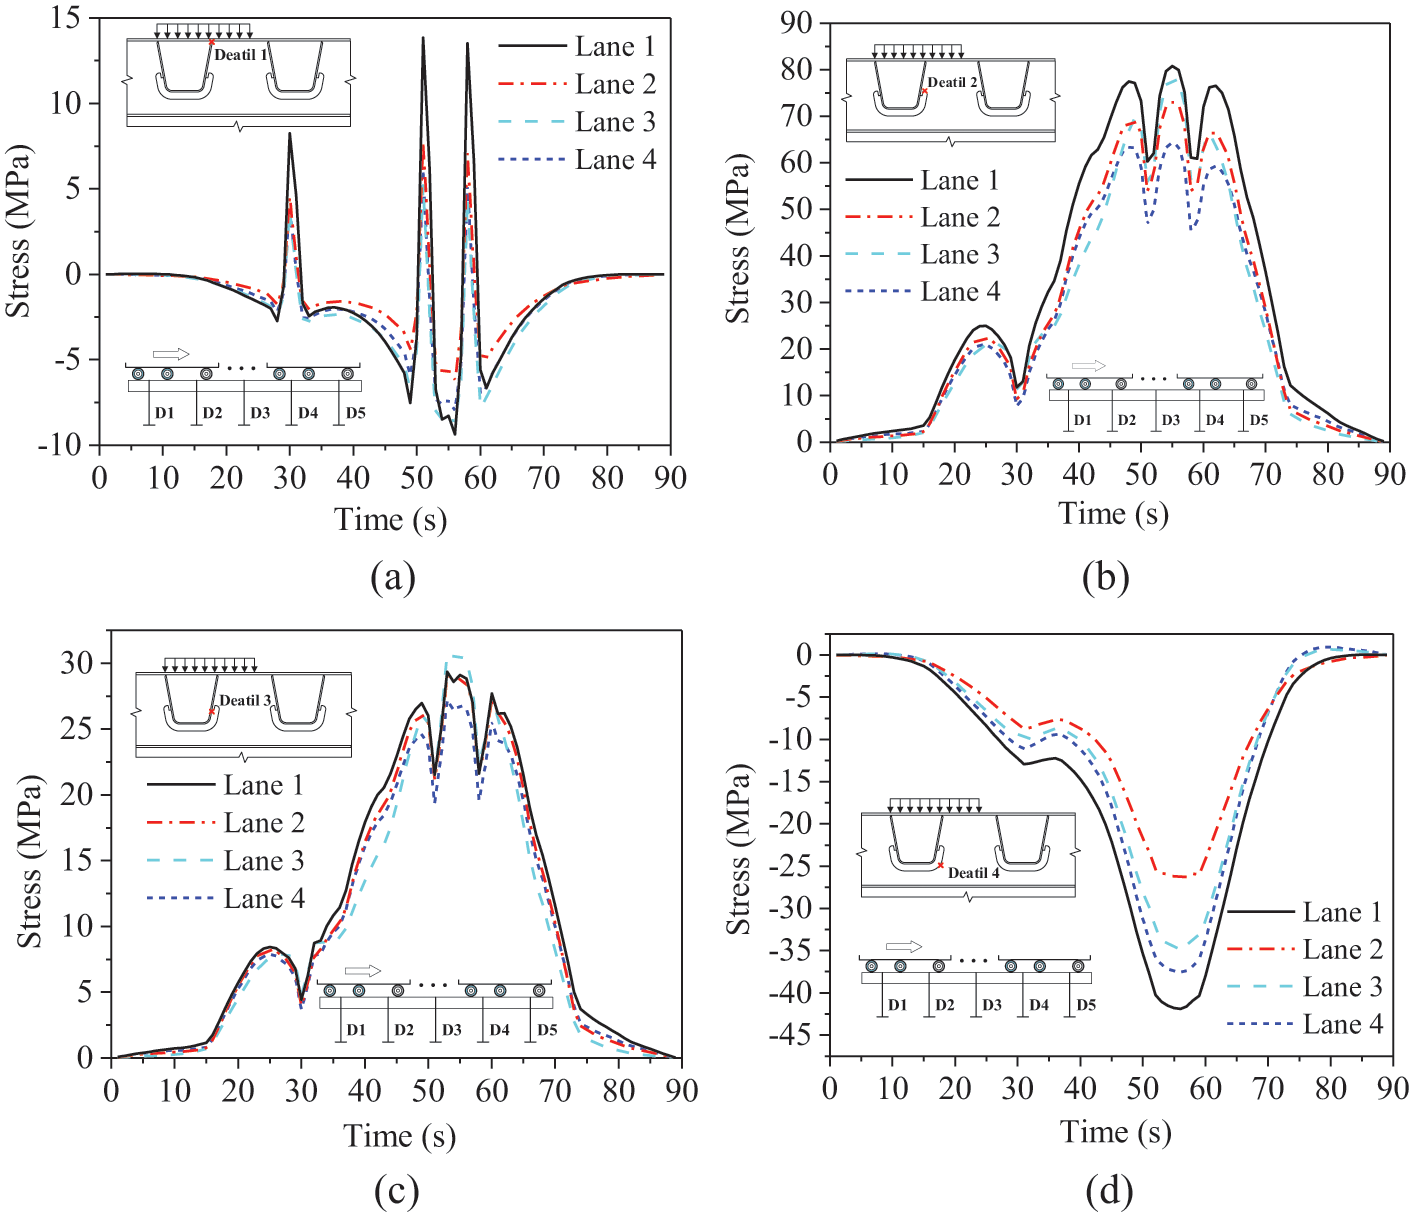
Figure 5: Stress-time history of the details (a) Detail 1 (b) Detail 2 (c) Detail 3 (d) Detail 4
It can be observed from Figs. 5a–5c that the stress response of each axle load is obvious, which demonstrates that the zone of the stress influence line in longitudinal direction for Details 1, 2, and 3 would be small, and the maximum stress amplitude caused by the loading vehicle occurs on Lane 1. As for Detail 4, as shown in Fig. 5d, one peak is discovered in the history line as the load moves, and the maximum stress amplitude also occurs on Lane 1, which indicates that Lane 1 (i.e., the outermost lane) would be the concerned location of fatigue analysis. In the meantime, to demonstrate the structural response under vehicle load, the analysis of Y-component of stress, Z-direction displacement, and two principal stress (i.e., 1st and 2st) at different lanes are performed, respectively, as shown in Figs. 6–9.
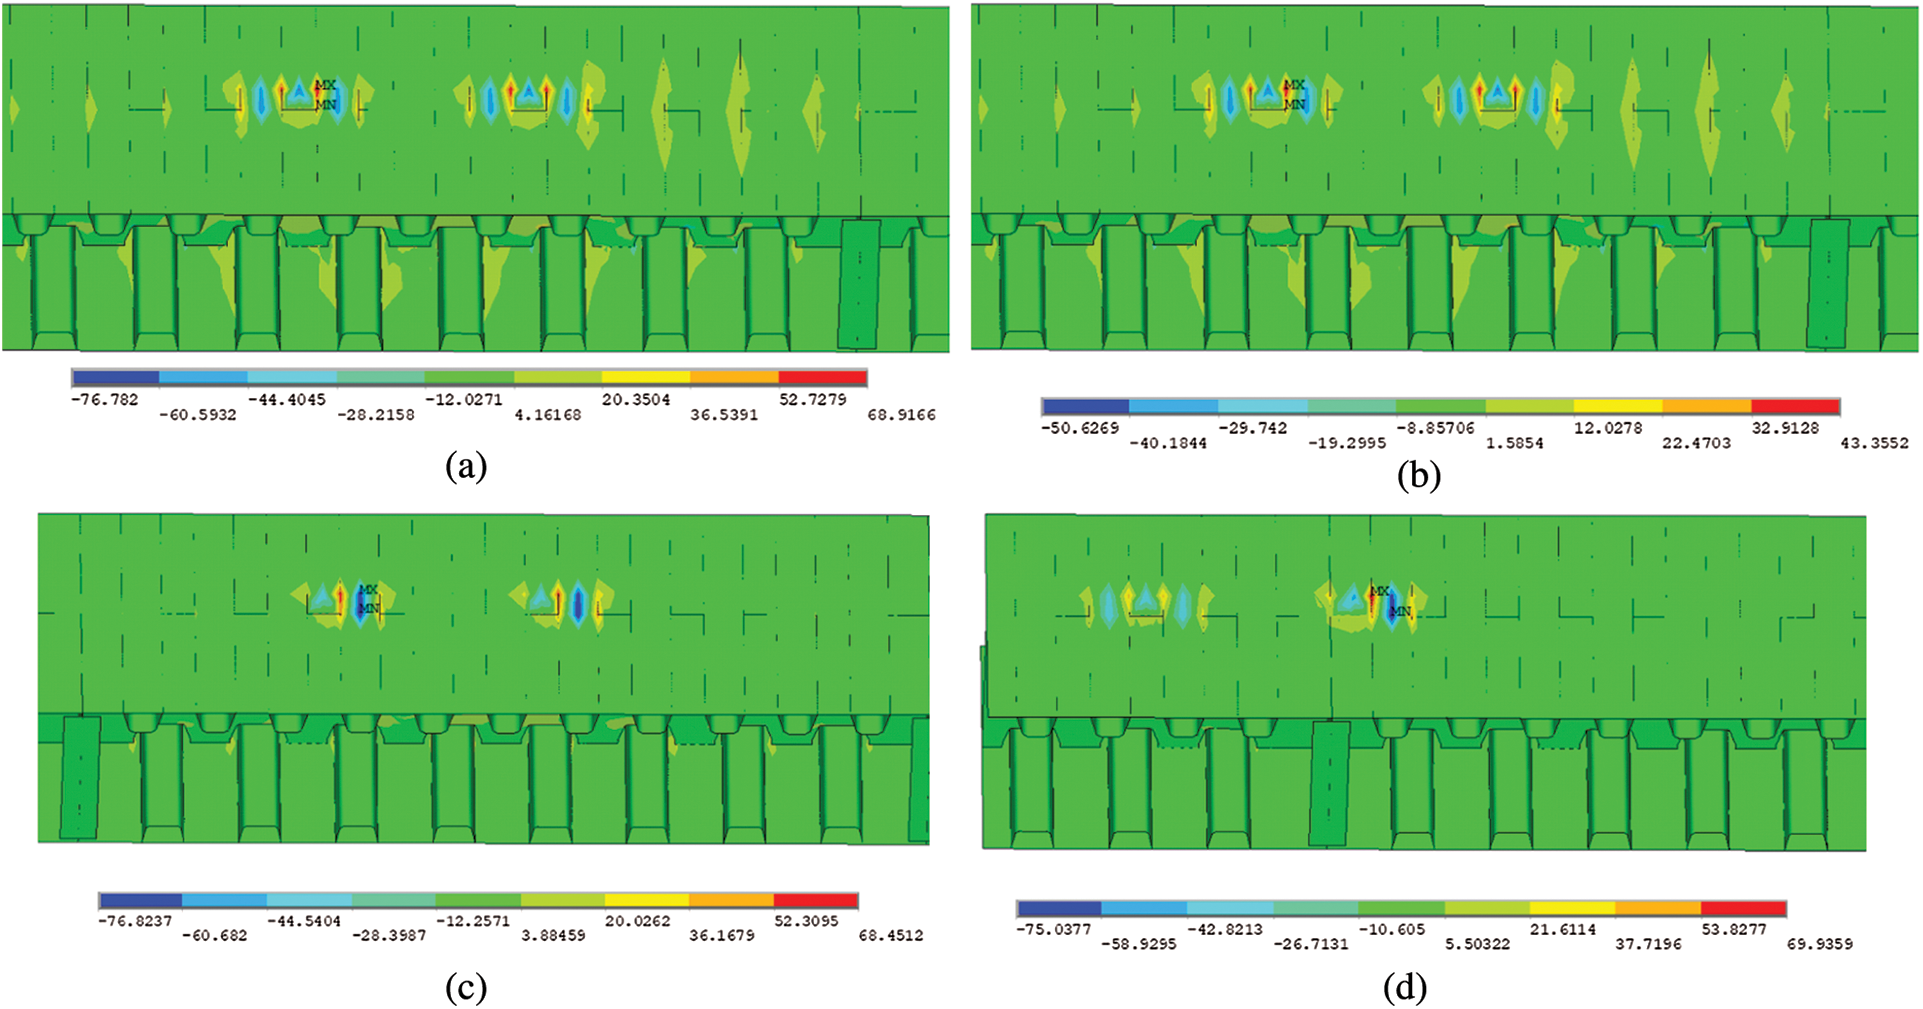
Figure 6: Y-Component of stress in different lanes (Unit: MPa) (a) Lane 1 (b) Lane 2 (c) Lane 3 (d) Lane 4
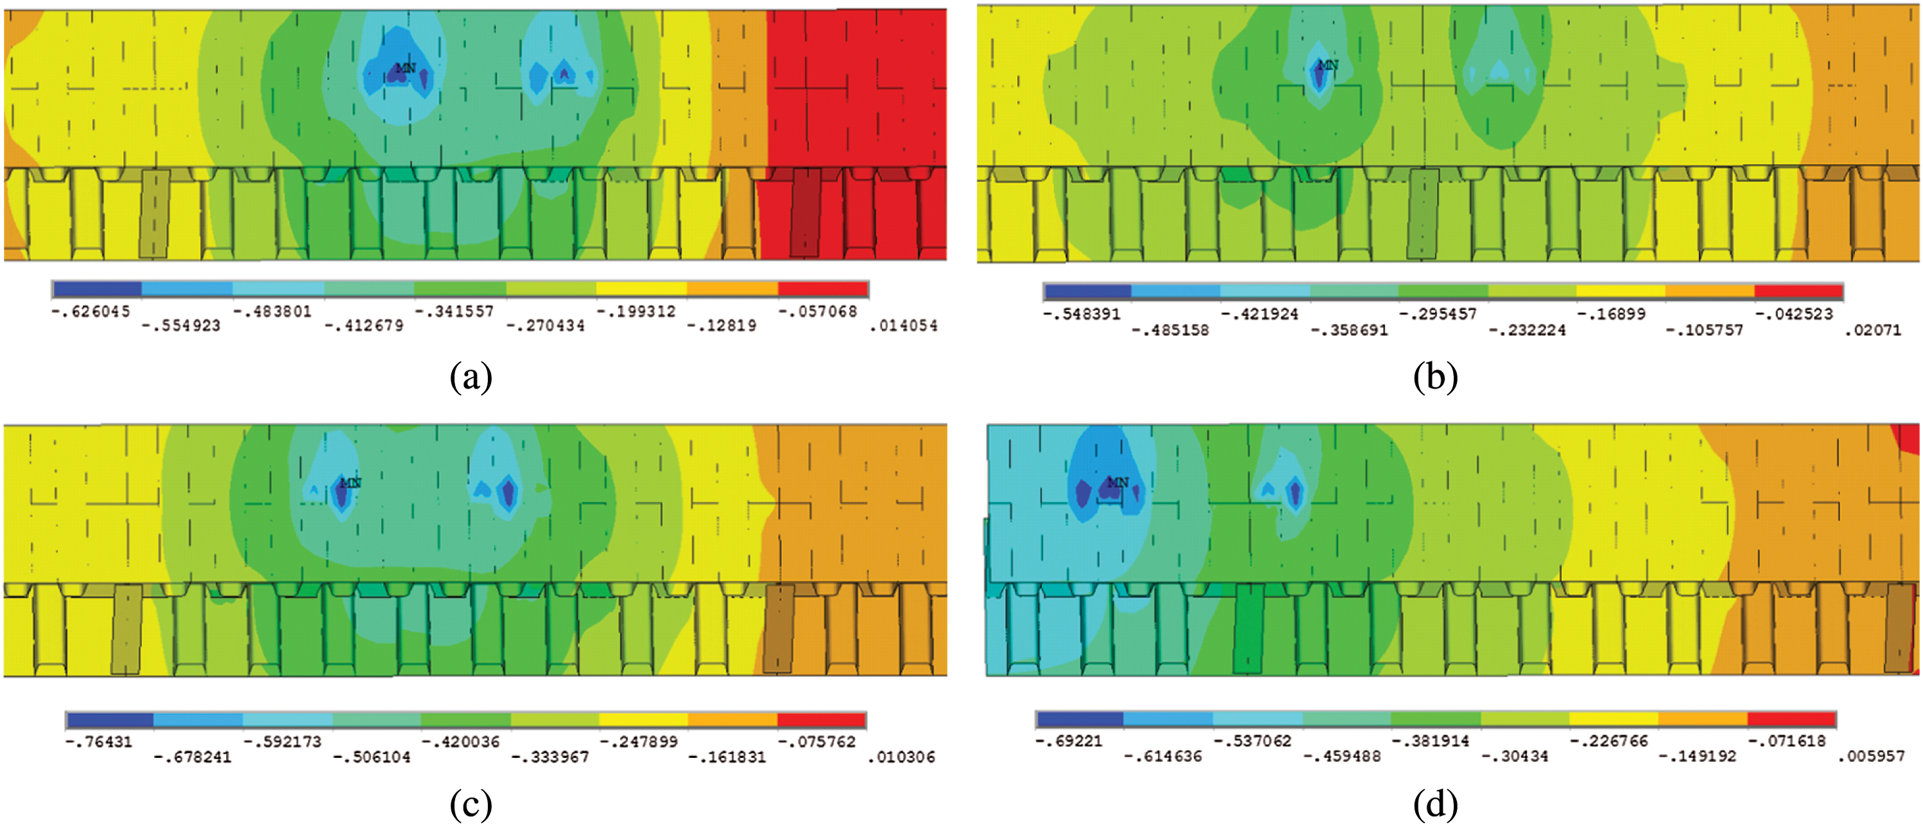
Figure 7: Z-Component of displacement in different lanes (Unit: mm) (a) Lane 1 (b) Lane 2 (c) Lane 3 (d) Lane 4
It is apparent from Figs. 6 and 7 that the effect of the wheel load on the junction of the deck plate and U-rib is significant. Due to the lack of vertical support at the center of the U-rib, the wheel load produces vertical deformation at the center of the U-rib, resulting in tensile stress at the junction of the U-rib and the deck plate. This phenomenon is more obvious at the junction of the U-rib, the deck plate, and the diaphragm. At the same time, it can be seen that the influence zone produced by the wheel load at the deck plate is small, which means the local effect of OSDs is obvious and the zone of the stress influence line in transverse direction is small.
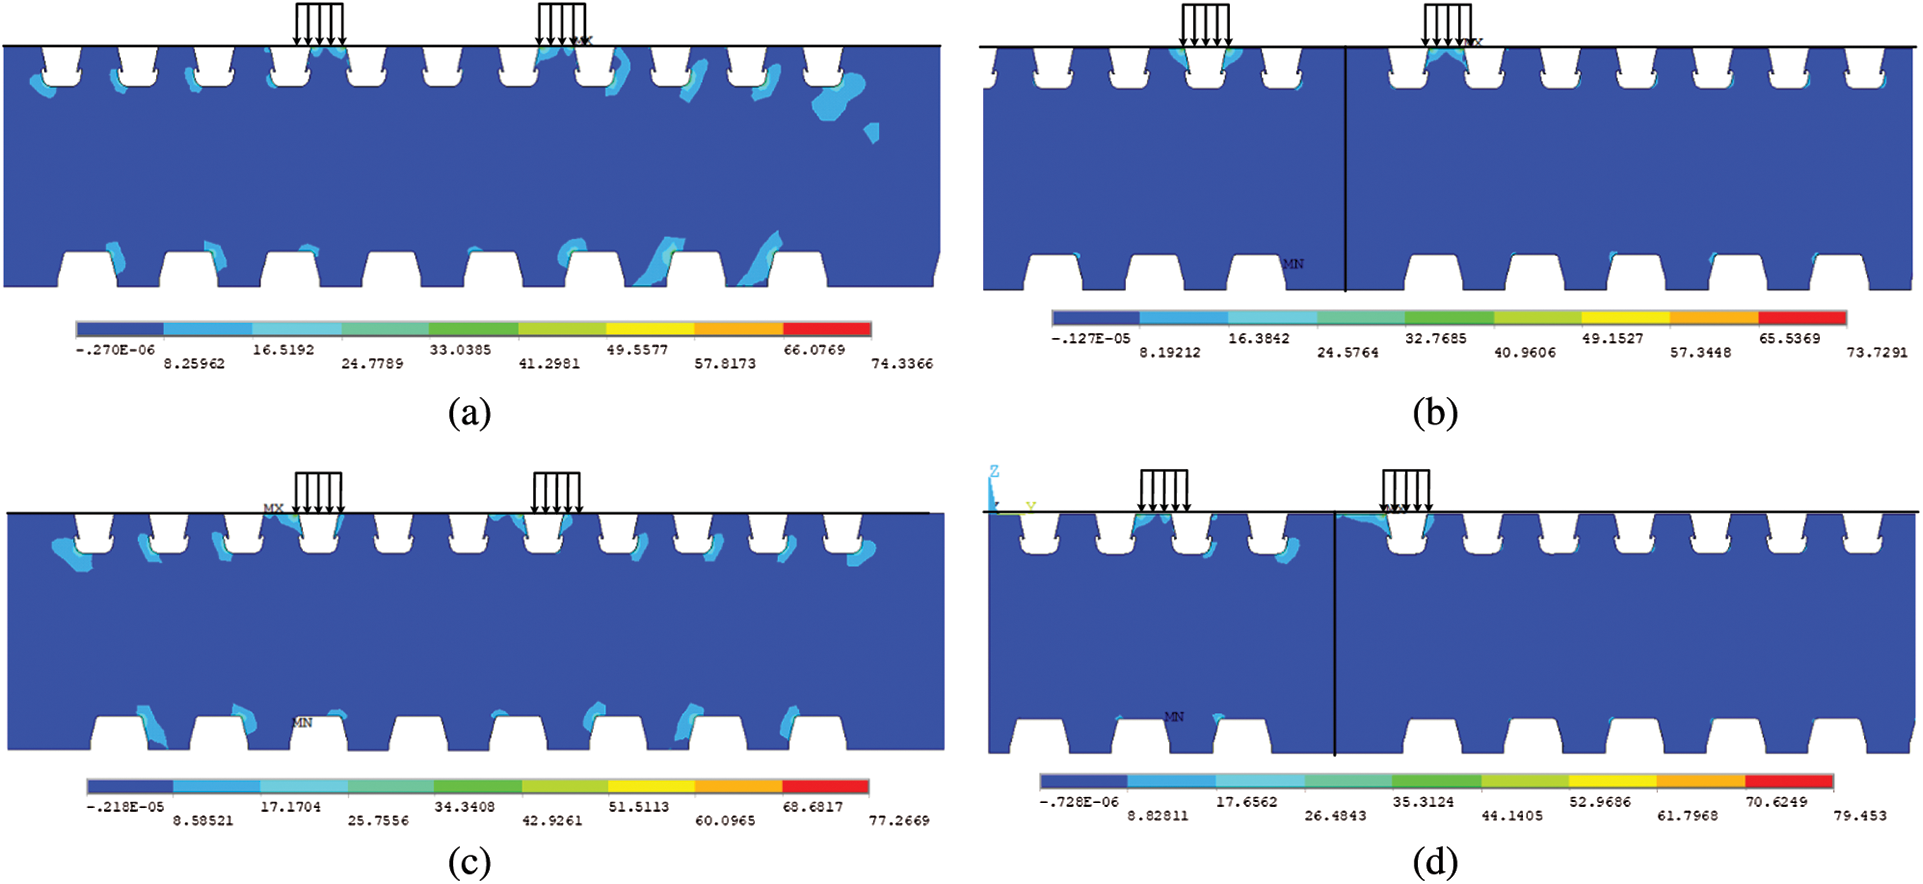
Figure 8: 1st Principal stress at different lanes (Unit: MPa) (a) Lane 1 (b) Lane 2 (c) Lane 3 (d) Lane 4
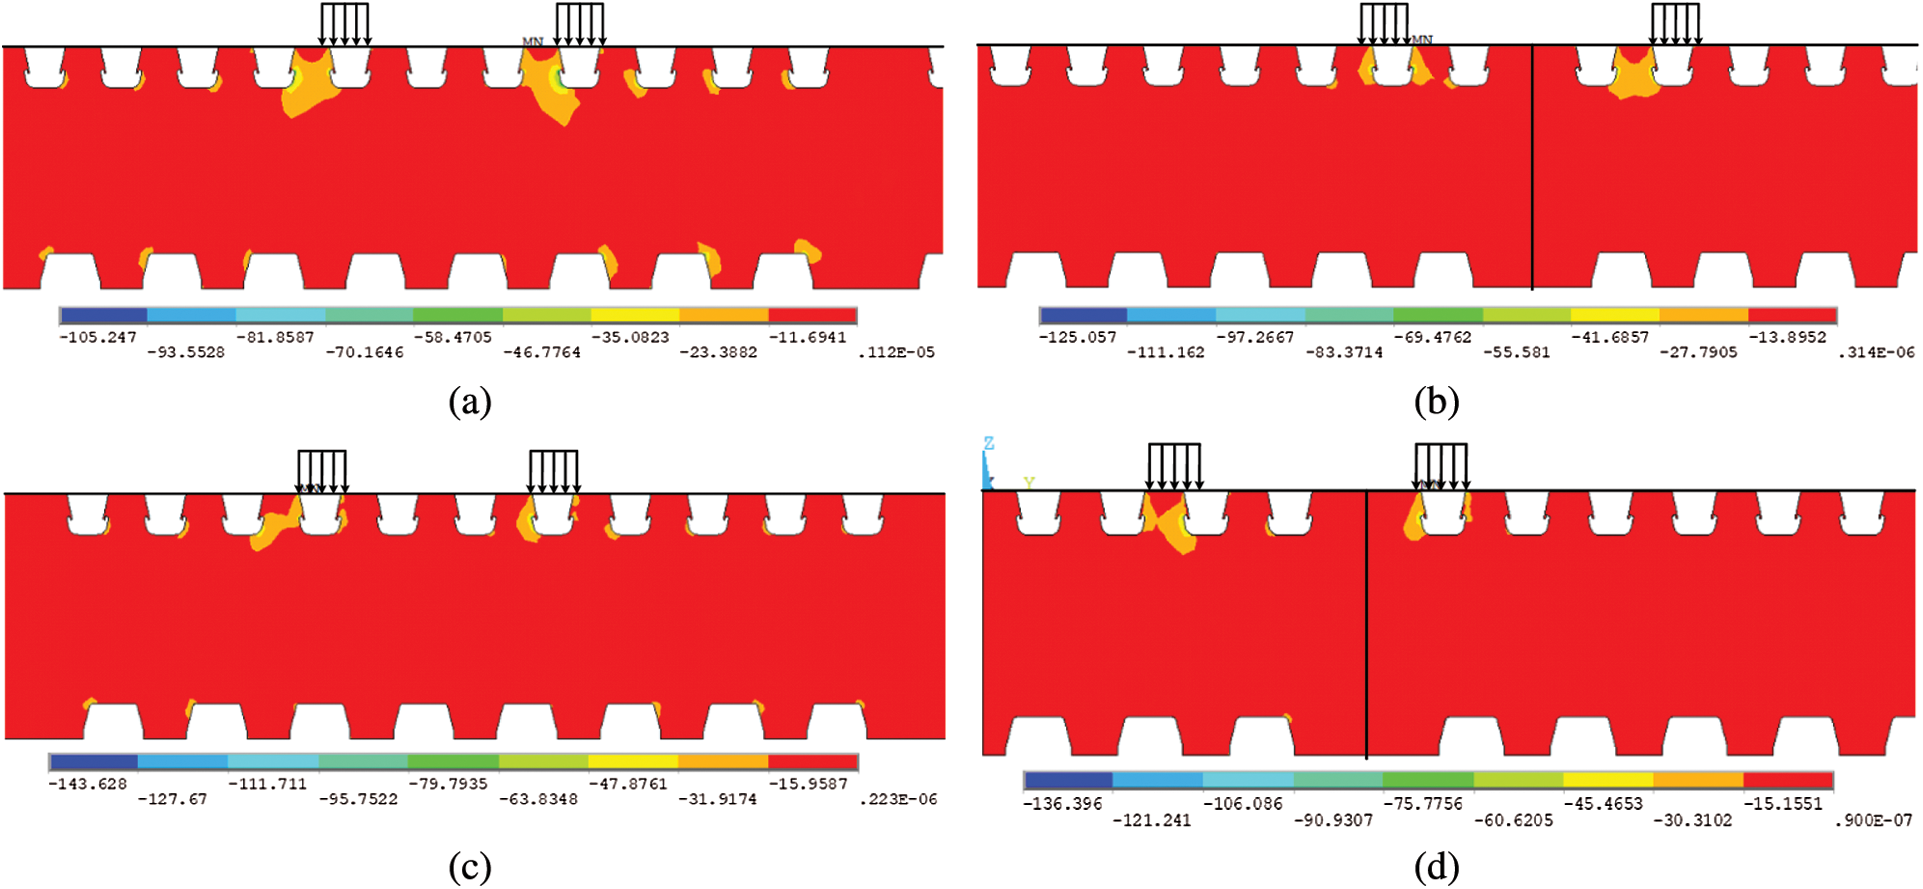
Figure 9: 3st Principal stress at different lanes (Unit: MPa) (a) Lane 1 (b) Lane 2 (c) Lane 3 (d) Lane 4
It is apparent from Figs. 8a–8d that the stress concentration at the cutout of the diaphragm is obvious, and the maximum tensile stress is about 40 MPa. The influence of the wheel load is mainly found in the 1 to 3 U-rib near the loading position. Similarly, it can also be seen from Figs. 9a–9d that the maximum compressive stress at the cutout is about 70 MPa, and the stress influence range is also limited to the 1 to 3 U-rib near the loading position.
From the analysis hereinbefore, it can be concluded that Lane 1 is the most unfavorite lane under the vehicle loads. Considering the heavy trucks, the main fatigue vehicle, often drive in it, the typical details at Lane 1 are selected as the object for further fatigue analysis.
5 Fatigue Life Analysis Integrating the VTDM
5.1 Vehicle Transverse Distribution Model (VTDM)
Considering the vehicle trace is dispersed in the lane and the stress of details is sensitive to the vehicle transverse location [26], the effect of vehicle loads location is investigated in this study. Compared to the abundant research achievements concerning VTDM given in many standards, such as British Standard [27], European Standard [28], and American Standard [29], the body of research on the VTDM in Chinese standard is far from complete.
Considering the case bridge is located on the main road between the central city and the suburbs, with many trucks passing through, the VTDM proposed by Cui et al. [30], which is suitable for Chinese traffic conditions, is adopted in this study. The proposed VTDM is based on the statistical vehicle data of Humen Bridge, hence called HVTDM. In the HVTDM, the normal distribution of vehicle trace is considered, and the vehicle transverse location is distributed within 0.6 m on both sides of the lane centerline. The histogram of the frequency distribution of HVTDM is shown in Fig. 10.
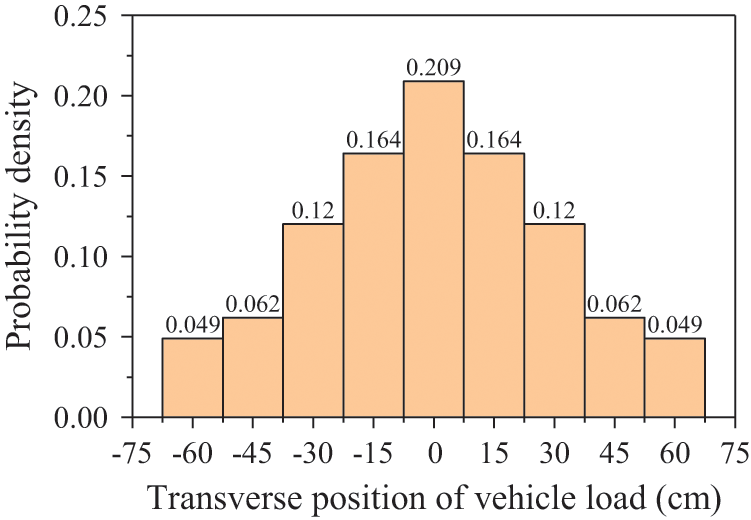
Figure 10: Frequency distribution of HVTDM
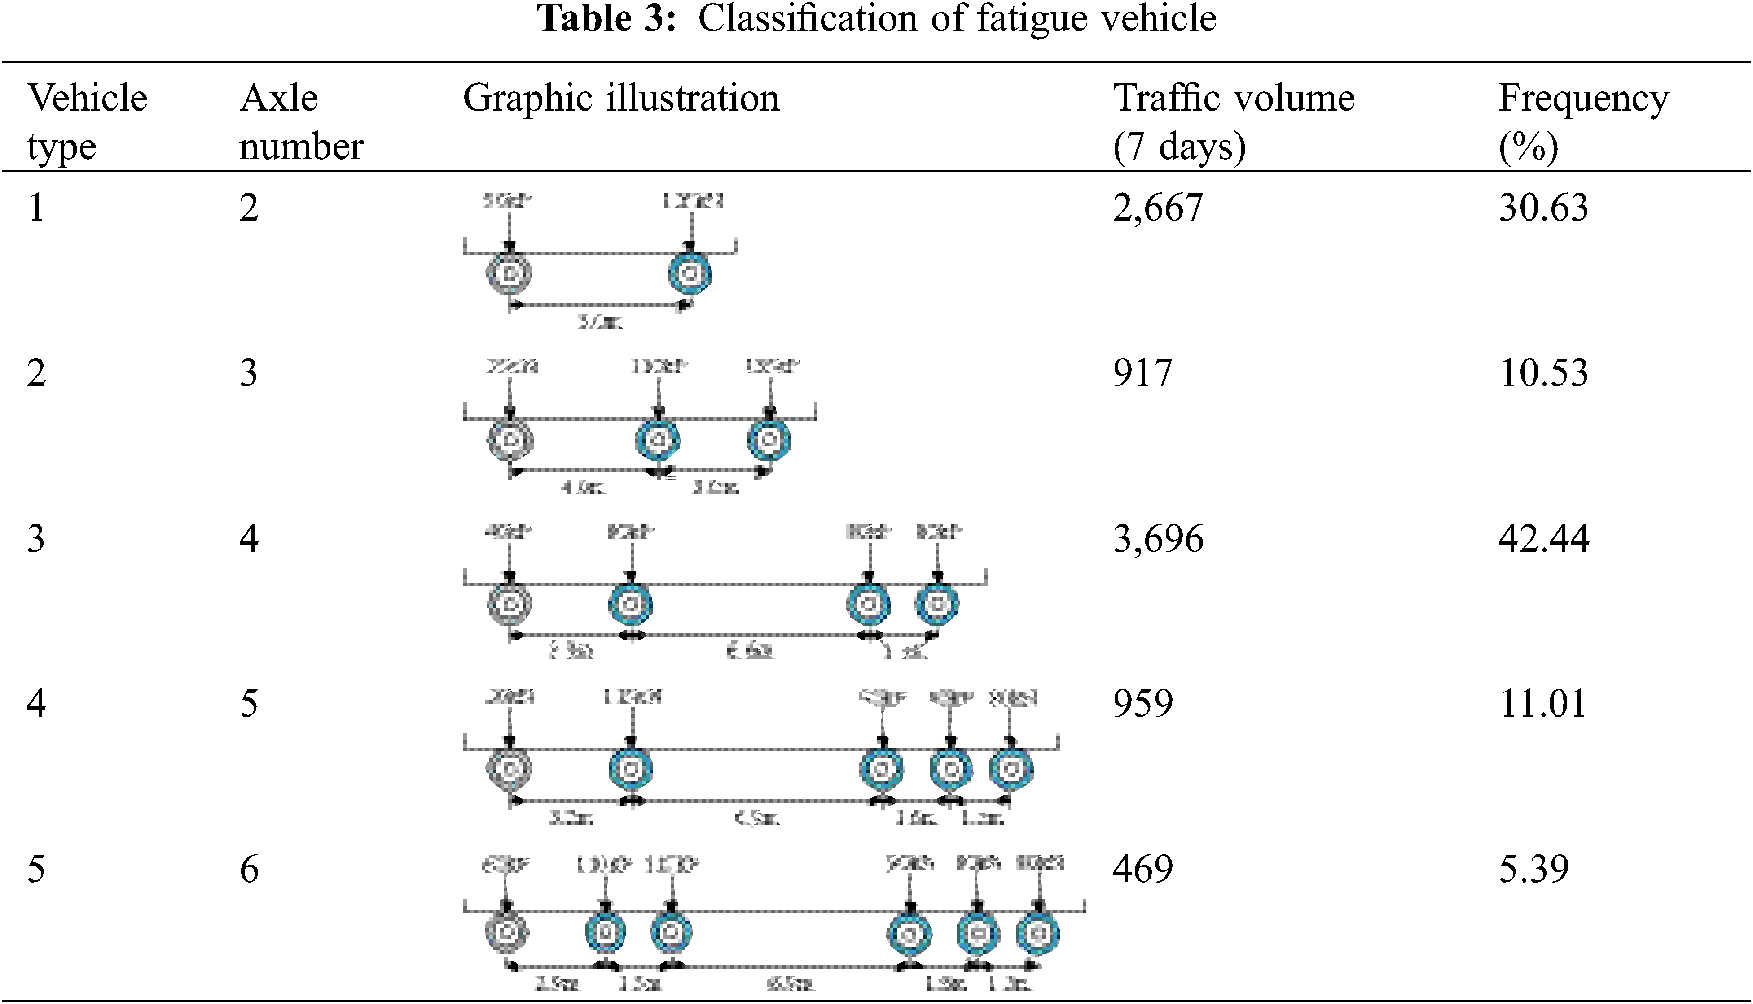
In this study, due to the measured traffic volume data of the Weier bridge is insufficient, the fatigue vehicle model and traffic volume data from the studies by Li et al. [31], which could partially represent the traffic situation of Chinese suburbs, is adopted, as shown in Table 3. The determination of the fatigue vehicle is based on the analysis of the actual traffic volume. The average weekly traffic volume of a single lane in the design life of the bridge is 8,708, and the proportion of each type of fatigue vehicle is shown in Table 3.
During the loading process of the fatigue vehicle, the effect of the thickness of the pavement, 50 mm in this study, on the load area is considered. Therefore, the design load of the single-wheel, as shown in Table 3 with the gray color, distributes over an area of 300 mm (in the longitudinal direction) by 400 mm (in the transverse direction). Moreover, the design load of the double-wheel, as shown in Table 3 with the cyan color, distributes over an area of 300 mm (in the longitudinal direction) by 700 mm (in the transverse direction).
5.3 Influence Surface Analysis of Stress
To accurately apply the wheel load on the most unfavorite location of OSD corresponding to the fatigue details while considering the HVTDM, the influence surface analysis of stress is performed, and the unit load (1 kN) is applied on the OSD. With this analysis, the study will focus on these details near the junction of Rib11 and D3, which is underneath the wheel load in Lane 1. The analysis result is shown in Fig. 11.
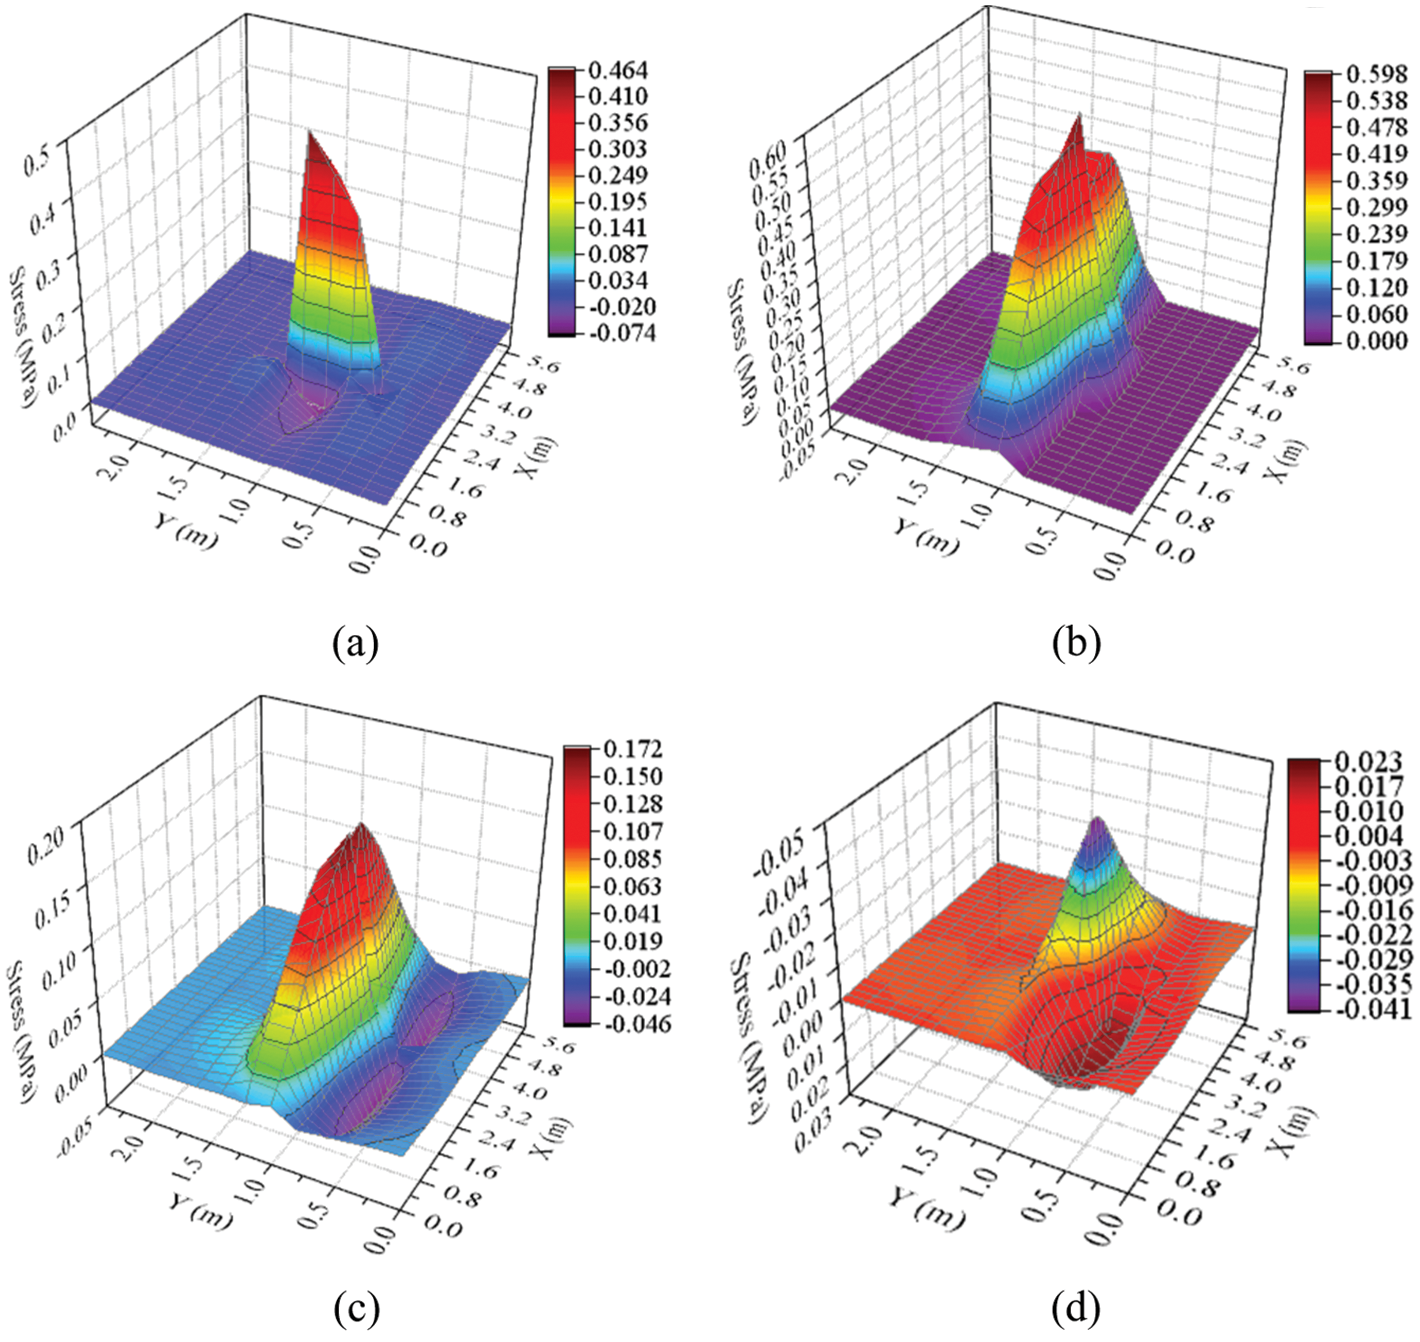
Figure 11: Influence surface of stress on the details (a) Detail 1 (b) Detail 2 (c) Detail 3 (d) Detail 4
Fig. 11 presents the influence surface of stress at the examined location of details. The following observations can be drawn from these influence surfaces: (1) For influence surface of Detail 1, the tensile stress is mainly observed, as shown in Fig. 11a. The stress is significantly decreased when the loading location is away from the measured location, and the influence of the load distributes over an area of 4.2 m (in the longitudinal direction) by 1 m (in the transverse direction); (2) From Fig. 11b, we can see that the tensile stress is mainly observed in the influence surface and the stress increases gradually near the examined location, where the influence of the load distributes over an area of 5.4 m (in the longitudinal direction) by 1.1 m (in the transverse direction); (3) As shown in Fig. 11c, the bimodal state of stress is observed for Detail 3, which means the stiffness far away from the diaphragm is small and large deformation would be obtained. Moreover, the influence of the load distributes over an area of 5.6 m (in the longitudinal direction) by 1 m (in the transverse direction); (4) For influence surface of Detail 4, the peaks of tensile and compress stress is obvious, as shown in Fig. 11d, and a loading location further than 5.6 m in the longitudinal direction and 1.2 m in the transverse direction has a negligible contribution to the effect.
In general, the influence of the load on details distributes over a small area (about 5.6 m in the longitudinal direction and 1 m in the transverse direction) compared to the whole area of the deck, and the loading location has a great influence on the stress of details. It also should be noted that the wheel load instead of axle load could be considered in the transverse direction, and the effect of the multi-axle load should not be ignored in the longitudinal direction.
5.4 Calculation of Fatigue Life
The BS5400 standard [27] defines many S-N curves to describe the fatigue life of metals. Each curve is determined according to the relationship between the stress range and the life cycles, and corresponds to different Category details. The empirical formula for the S-N curve is:
where N is the fatigue life in cycles; S is the constant stress range; m is the slope factor of the S-N curve; K2 is the detail category constant.
Considering the details undergo variable amplitude loading, the Palmgren-Miner linear damage rule (PMLDR) is adopted to quantify the accumulative degree of damage at the details, and the damage index D is defined by Eq. (2).
where ni is the total number of cycles in the ith constant stress range Si; Ni is fatigue life in cycles under Si.
Based on the PMLDR and the HVTDM, the equivalent constant-amplitude stress range Seq, which represents the same fatigue damage caused by a stress range spectrum, is determined by Eq. (3).
where Pj is the probability density of wheels traverse distribution.
According to the BS5400 standard [27], the ni should be reduced in proportion
According to the PMLDR, the fatigue failure will occur when D ≥ 1, hence the fatigue life of details can be calculated by Eq. (5).
where Y is the fatigue life (year); nyi is the average number of cycles of the ith year; Sreqi is the revised equivalent stress range of the ith year.
Since the location of the details near the R11 is the most unfavorite location of Lane 1 under the wheel load, these details at D3 are selected as the objects for fatigue investigation. For this purpose, the fatigue vehicle loads which include two types of wheel are applied on the deck plate, as shown in Fig. 12. In the transverse direction, the wheel loads start from the loading case LC1 in the northern side, then moving to the southern side of the deck till reaching the loading case LC9, as shown in Fig. 12a. Meanwhile, in the longitudinal direction, the front of the axle group starts at D1, and moves to the eastern side until the axle group leaves the deck completely, as shown in Fig. 12b. Hence, there are a total of 9 × 63 loading cases to simulate the moving of fatigue vehicles along Lane 1.
After the analysis of stress time history is performed, the stress range spectrums of monitored stress records at four details under fatigue vehicles are calculated by the rain-flow counting method [32]. The result of loading case LC5 is adopted as an illustration, as shown in Fig. 13. It can be seen from Fig. 13 that the most of stress is concentrated in a certain range, such as 12.5~15 MPa for Detail 1 and there is a single apex for the distribution of the stress range.
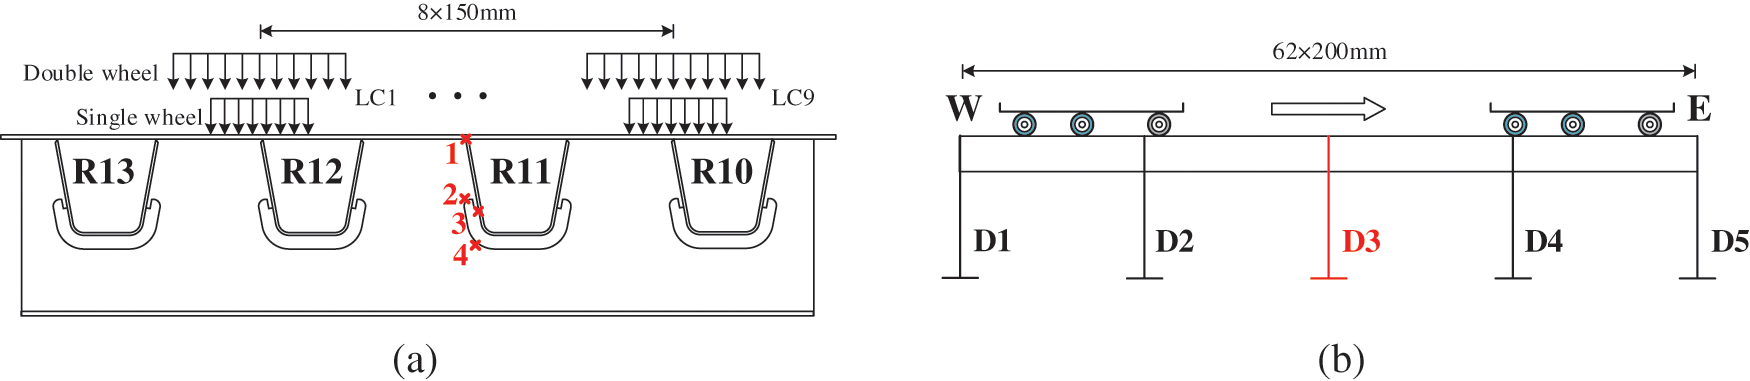
Figure 12: Wheel loads arrangement in (a) Transverse direction; (b) Longitudinal direction
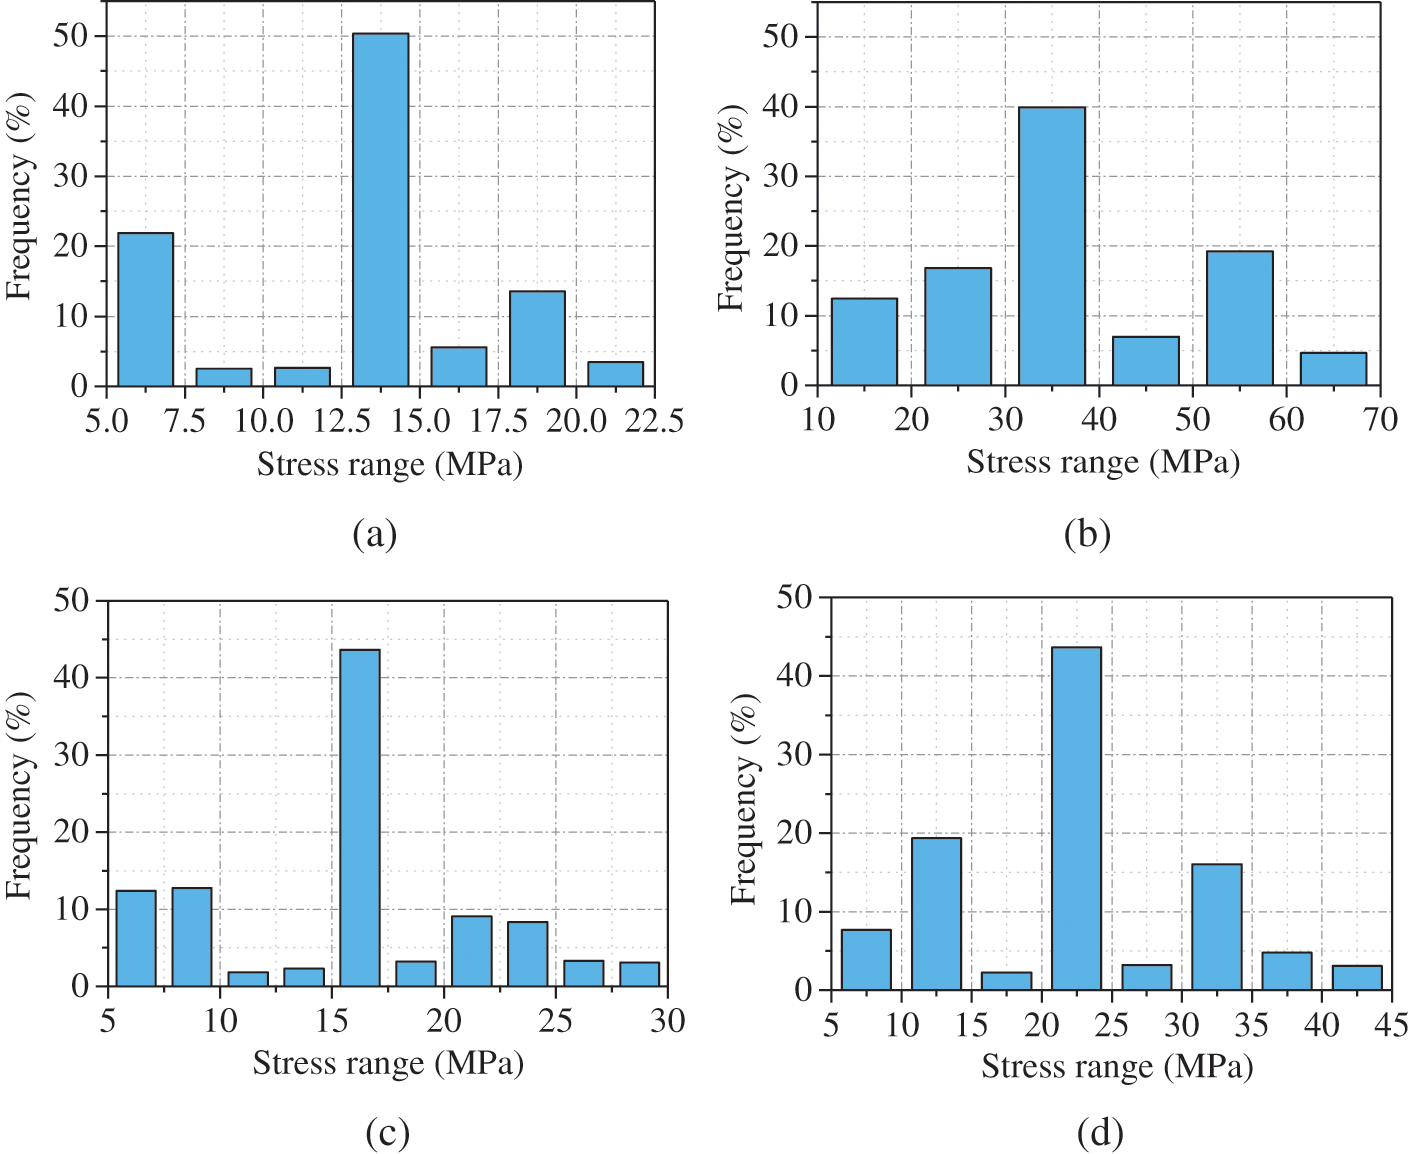
Figure 13: Stress range spectrum (a) Detail 1 (b) Detail 2 (c) Detail 3 (d) Detail 4
To improve the accuracy of the traffic flow simulation, the annual traffic growth rate of 4% is considered in calculating the fatigue life of the details [33]. The calculation process of fatigue life is shown in Fig. 14, and the fatigue life analysis is performed according to the following procedure:
1. Validation of the FE model. In order to improve the accuracy of the analysis results, the data obtained by the field test or health monitoring system are adopted to compare with the finite element calculation results. The verified FE model is constructed as the benchmark model for fatigue analysis.
2. Applying a unit load to the FE model, after k load steps, the influence surfaces for different details are obtained, and the most unfavorable influence area is determined. In order to consider the influence of vehicle transverse distribution, a certain range is selected on both sides of the most unfavorable loading position in the cross section. The stress time history of each position is calculated for the subsequent fatigue life calculation.
3. Determine the fatigue vehicle model and the traffic volume. These two parameters can be obtained by on-site traffic volume survey, weigh-in-motion system, and reference, etc., but it should be noted that these two parameters have a great influence on the fatigue life calculation results, and they should be chosen carefully.
4. The rain-flow counting method program is written using the Matlab software package to calculate the stress range spectrum of details. Then, considering the effect of VTDM, the parameter D is calculated using the PMLDR. Finally, the fatigue life of detail is calculated by Eq. (5), and the corresponding index (e.t. m, K2, and S0) are shown in Table 4.
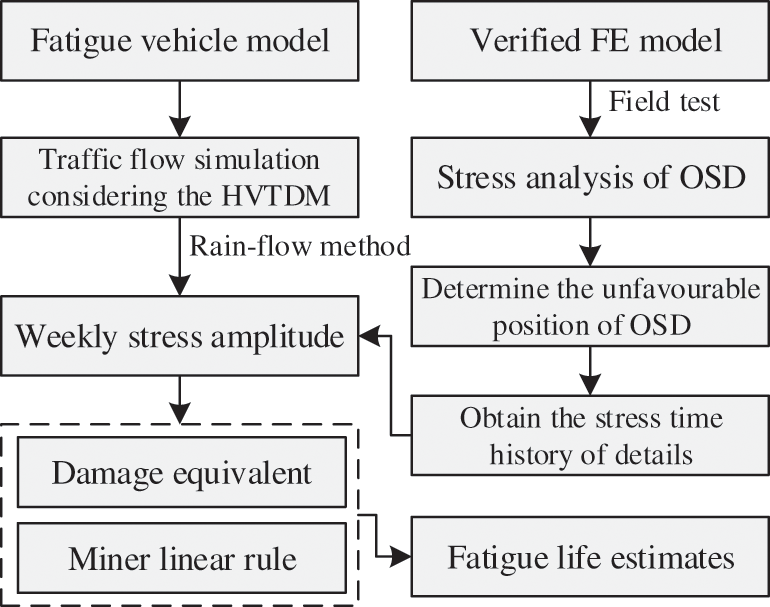
Figure 14: Flowchart of fatigue life analysis
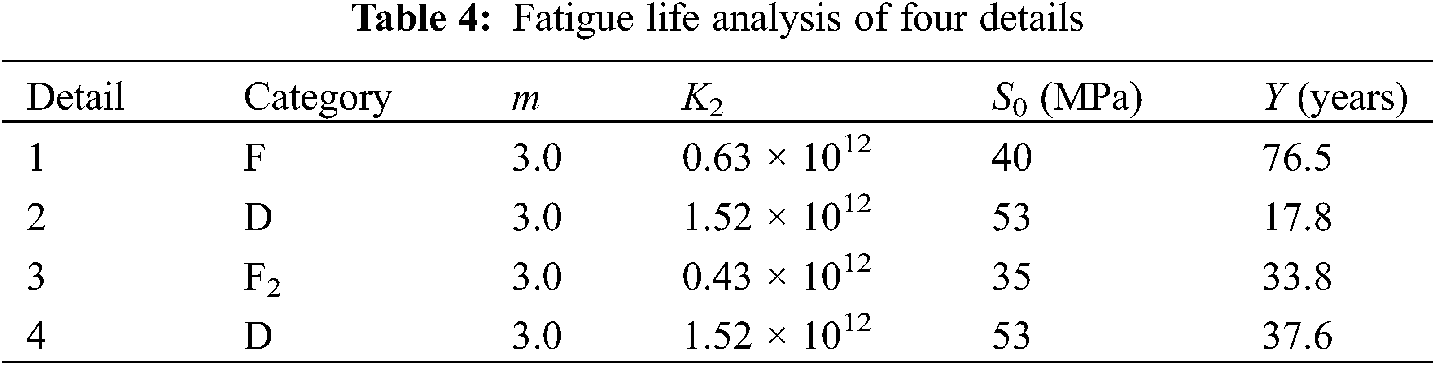
It is apparent from Table 4 that the fatigue life of Detail 2 is significantly lower than that of other details, mainly because there is obvious stress concentration in Detail 2. Fig. 15 shows the development of accumulative damage in each detail with the increase of time. It can be seen that the accumulative damage of Detail 2 presents a linear relationship with time, and its fatigue life is about 18 years, which is far less than the design fatigue life. Considering the actual traffic flow and FE calculation error, the fatigue life of Detail 2 may be different from the result, but this detail should be attended to carefully during bridge service. Moreover, other details (i.e., Details 1, 3, and 4) show a nonlinear relationship with the increase of time, which indicates that the longer the bridge operation time is, the faster the growth rate of D is. This phenomenon also indicates that the details will accelerate the damage without repair intervention, so the routine inspection of the bridge is very important.
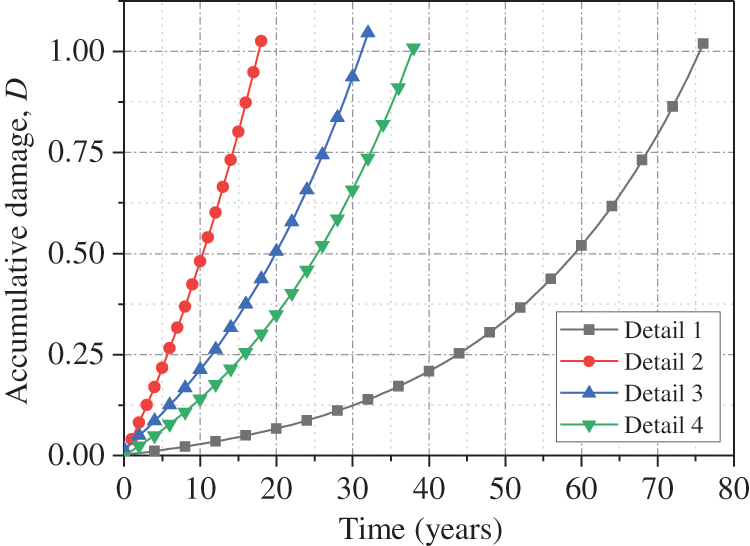
Figure 15: Development of accumulative damage at four details
6 Parametric Analysis of Fatigue Life
Considering the possibility of overloading vehicles during bridge service, the effect of axle load on fatigue life is investigated, as shown in Fig. 16, and five levels of growth rate, including 0%, 20%, 40%, 60%, and 80%, are performed. It can be concluded that the fatigue life decreases linearly with the increase of axle load. The average fatigue life from Details 1 to Detail 4 decreases by 14%, 35%, 13%, and 14%, respectively, when the axle load increases by 20%. In addition, the fatigue life from Detail 1 to Detail 4 decreases by 41%, 85%, 42%, and 52%, respectively, when the axle load increases by 80%, which indicates that the overload vehicles have a great influence on the fatigue life of details.
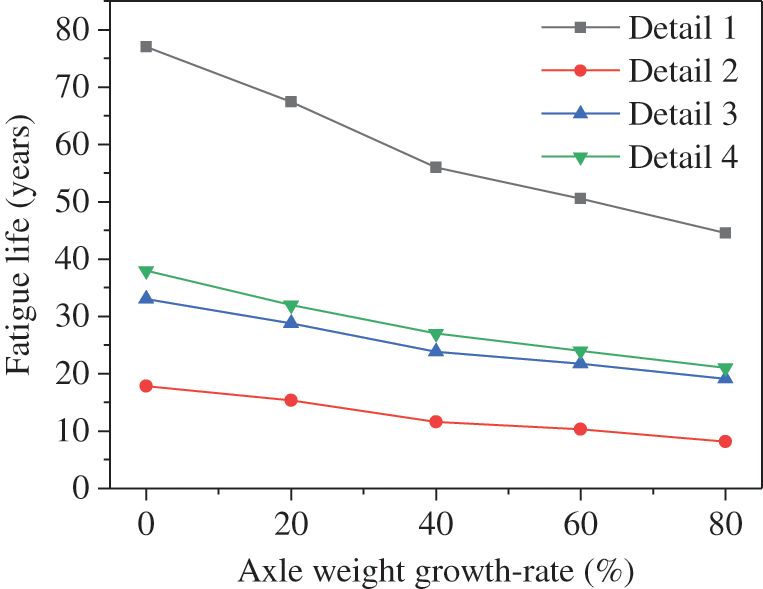
Figure 16: Effect of axle weight on fatigue life
6.2 Effect of the Thickness of the Deck Plate
In order to investigate the effect of the deck plate thickness on the fatigue life of OSDs, five levels of plate thickness, including 10, 12, 14, 16, and 18 mm, are performed, as shown in Fig. 17. It can be concluded that the fatigue life increases nonlinearly with the increase of plate thickness. When the plate thickness increases from 10 to 16 mm, the fatigue life is improved significantly, but when the plate thickness is greater than 16 mm, increasing the plate thickness has almost no effect on the improvement of the fatigue life. The change in plate thickness has the largest effect on the fatigue life of Detail 1 and the smallest effect on the fatigue life of Detail 2. This is mainly because the change in plate thickness has a direct influence on the stress response of the details at the junction of the U-rib and the deck plate, while it has less influence on the diaphragm cutout.
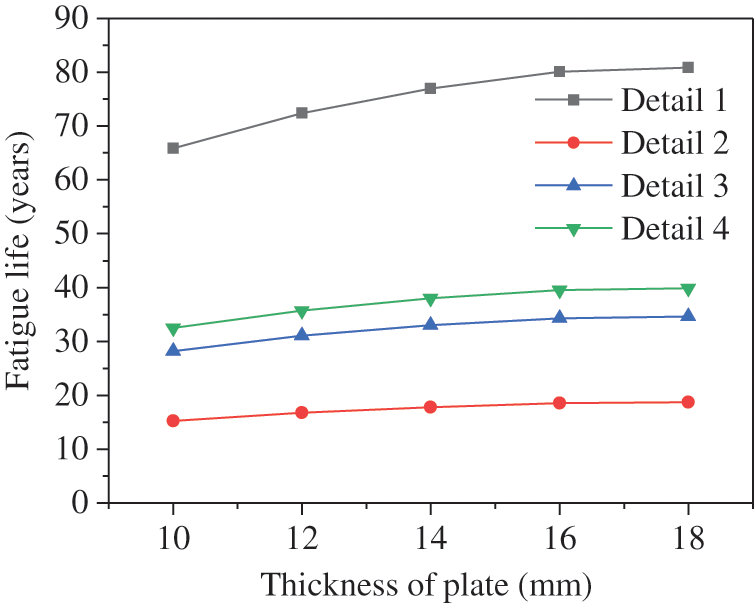
Figure 17: Effect of plate thickness on fatigue life
To study the effect of different VTDM on fatigue life, four conditions are adopted in this study, including considering the HVTDM, the VTDM in BS5400 (i.e., BS5400 model), the VTDM in Eurocode 3 (i.e., Eurocode 3 model), and without considering VTDM. As shown in Fig. 18, compared to the condition of considering VTDM, the fatigue life under the condition of not considering VTDM is significantly reduced, which indicates that the real fatigue life would be underestimated if the VTDM is not considered. In addition, the fatigue life calculated by HVTDM is close to that calculated by the BS5400 model, and there is a big difference between the calculation results of the Eurocode 3 model and the HVTDM, which means that the HVTDM and BS5400 model are more suitable for the simulation of vehicle transverse distribution in China. Considering the probability distribution curve of the Eurocode 3 model is sharper than that of the HVTDM and BS5400 model, so the result of accumulative damage calculated by the Eurocode 3 model is different from those calculated by other models.
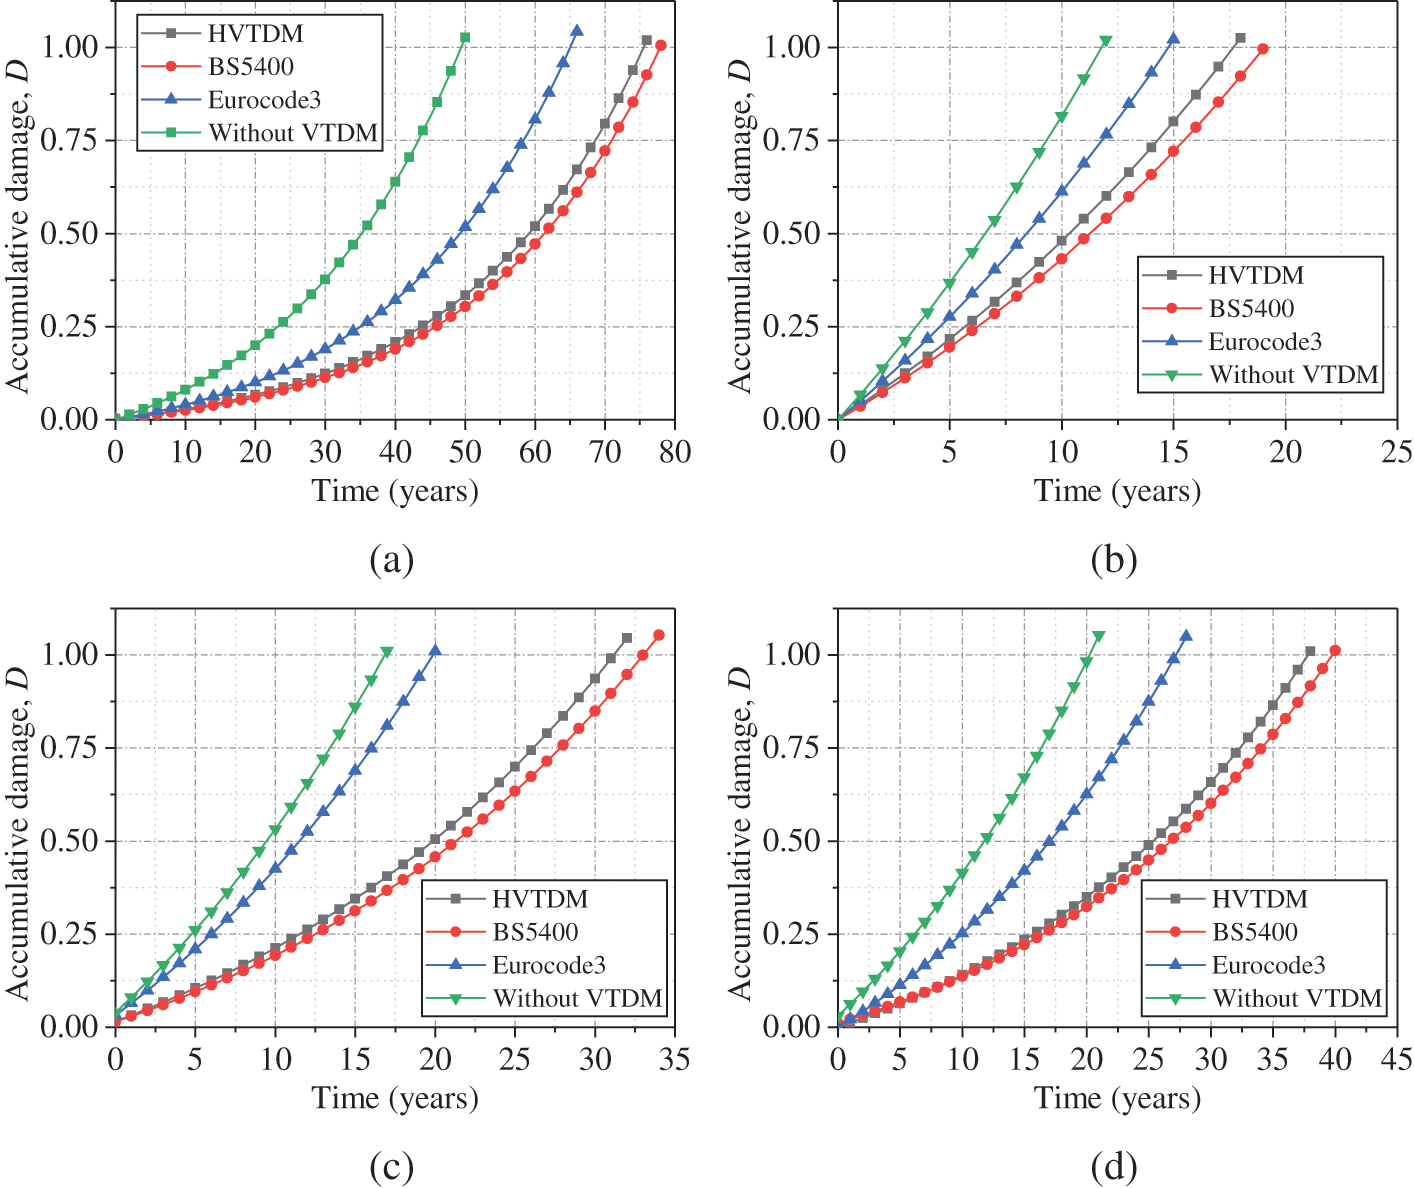
Figure 18: Effect of VTDM on fatigue life (a) Detail 1 (b) Detail 2 (c) Detail 3 (d) Detail 4
The effects of VTDM on the fatigue performance of typical details in super-wide steel box girders are investigated quantitatively based on the high-fidelity FE model revised by the field test. The main conclusions are as follows:
1. The fatigue analysis of typical details demonstrates that the diagram upper cutout (i.e., Detail 2) is more vulnerable to cracking initiation than other details, and fatigue damage of the rib-to-deck weld (i.e., Detail 1) is significantly lower than other details during the bridge service.
2. The stress behavior analysis of the super-wide box girder in different lanes shows that the stress generated by the vehicle in the outermost lane (i.e., Lane 1) is greater than that of the other lanes. Considering the outermost lane is usually arranged as the truck lane, the fatigue analysis should be carefully performed in this area.
3. The influence surface analysis shows the vehicle transverse location has a great influence on the stress behavior of details with a sharp influence surface. The loading strategy, where the wheel load is applied in the transverse direction and the axle group load is applied in the longitudinal direction, is recommended when simulating the traffic-load effect.
4. The parametric analysis revealed that the overloading vehicles could result in a remarkable decrease in fatigue life of details, and the influence of the plate thickness on fatigue life gradually decreases with the increase of the thickness. By comparing different VTDMs, the BS5400 model and HVTDM are determined to be more appropriate than the Eurocode 3 model for the simulation of vehicle transverse distribution in China.
5. Since the VTDM and the traffic volume data in this paper are not obtained based on the field test, the calculation results of the fatigue life may be different from the actual situation. For future work, the measured traffic data will be adopted in the fatigue life analysis, and the fatigue reliability assessment will also be performed.
Funding Statement: This research has been supported by the National Natural Science Foundation of China (Grant Nos. 51778135, 52178119), the Distinguished Young Scientists of Jiangsu Province (Grant No. BK20190013), and the National Key R&D Program Foundation of China (Grant No. 2017YFC0806001).
Conflicts of Interest: The authors declare that they have no conflicts of interest to report regarding the present study.
1. Zhuang, M., Miao, C., Chen, R. (2019). Analysis for stress characteristics and structural parameters optimization in orthotropic steel box girders based on fatigue performance. KSCE Journal of Civil Engineering, 23(6), 2598–2607. DOI 10.1007/s12205-019-1618-5. [Google Scholar] [CrossRef]
2. Cui, C., Xu, Y., Zhang, Q. (2021). Multiscale fatigue damage evolution in orthotropic steel deck of cable-stayed bridges. Engineering Structures, 237(3), 112144. DOI 10.1016/j.engstruct.2021.112144. [Google Scholar] [CrossRef]
3. Zhu, J., Zhang, W., Li, X. (2019). Fatigue damage assessment of orthotropic steel deck using dynamic Bayesian networks. International Journal of Fatigue, 118, 44–53. DOI 10.1016/j.ijfatigue.2018.08.037. [Google Scholar] [CrossRef]
4. Wang, B., Backer, H. De, Zhou, X. Y., Chen, A. (2020). Two-stage crack growth-based fatigue damage evaluation of orthotropic steel decks considering vehicle overload. Structure and Infrastructure Engineering, 51(2), 1–14. DOI 10.1080/15732479.2020.1859555. [Google Scholar] [CrossRef]
5. Zhu, J., Zhang, W. (2018). Probabilistic fatigue damage assessment of coastal slender bridges under coupled dynamic loads. Engineering Structures, 166, 274–285. DOI 10.1016/j.engstruct.2018.03.073. [Google Scholar] [CrossRef]
6. Zhu, Z., Xiang, Z., Li, J., Carpinteri, A. (2020). Fatigue damage investigation on diaphragm cutout detail on orthotropic bridge deck based on field measurement and FEM. Thin-Walled Structures, 157(1), 107106. DOI 10.1016/j.tws.2020.107106. [Google Scholar] [CrossRef]
7. Kainuma, S., Jeong, Y. S., Ahn, J. H., Yamagami, T., Tsukamoto, S. (2015). Behavior and stress of orthotropic deck with bulb rib by surface corrosion. Journal of Constructional Steel Research, 113, 135–145. DOI 10.1016/j.jcsr.2015.05.014. [Google Scholar] [CrossRef]
8. Fu, Z., Ji, B., Zhang, C., Li, D. (2018). Experimental study on the fatigue performance of roof and U-rib welds of orthotropic steel bridge decks. KSCE Journal of Civil Engineering, 22(1), 270–278. DOI 10.1007/s12205-017-1725-0. [Google Scholar] [CrossRef]
9. Marsh, K. J. (2013). Full-scale fatigue testing of components and structures. Oxford, UK: Butterworth-Heinemann. [Google Scholar]
10. Zhang, W., Cai, C. (2012). Fatigue reliability assessment for existing bridges considering vehicle speed and road surface conditions. Journal of Bridge Engineering, 17(3), 443–453. DOI 10.1061/(ASCE)BE.1943-5592.0000272. [Google Scholar] [CrossRef]
11. Zhu, Z., Xiang, Z., Li, J., Huang, Y., Ruan, S. (2020). Fatigue behavior of orthotropic bridge decks with two types of cutout geometry based on field monitoring and FEM analysis. Engineering Structures, 209(2), 109926. DOI 10.1016/j.engstruct.2019.109926. [Google Scholar] [CrossRef]
12. Tian, L., Yang, M., Chang, S., Qian, J. (2020). Effects of a new method on stress amplitude and fatigue life of orthotropic steel box girder. KSCE Journal of Civil Engineering, 24(6), 1858–1867. DOI 10.1007/s12205-020-1479-y. [Google Scholar] [CrossRef]
13. Huang, Y., Zhang, Q., Bao, Y., Bu, Y. (2019). Fatigue assessment of longitudinal rib-to-crossbeam welded joints in orthotropic steel bridge decks. Journal of Constructional Steel Research, 159(1), 53–66. DOI 10.1016/j.jcsr.2019.04.018. [Google Scholar] [CrossRef]
14. Wu, F., Wen, Y., Dai, J., Cai, C., Luo, J. et al. (2020). The girder’s transverse static characteristics of the bilateral steel box girder self-anchored suspension bridge under the action of a vehicle. 20th CICTP, Xi’an, China. [Google Scholar]
15. Wang, Y., Ren, W., Han, B., Romberg, M. (2021). Conceptual design of cable-supported bridges with road and railway traffic. Structural Engineering International, 31(4), 1–10. DOI 10.1080/10168664.2020.1856019. [Google Scholar] [CrossRef]
16. Nader, M., Manzanarez, R., Tang, M. (2004). Design of the New San Francisco–Oakland Bay Bridge Self-anchored Suspension Span, 126, 200–201. Los Angeles, California, USA: GeoTrans. DOI 10.1061/9780784407448. [Google Scholar] [CrossRef]
17. Lertsima, C., Chaisomphob, T., Yamaguchi, E., Sa-Nguanmanasak, J. (2005). Deflection of simply supported box girder including effect of shear lag. Computers & Structures, 84(1–2), 11–18. DOI 10.1016/j.compstruc.2005.09.008. [Google Scholar] [CrossRef]
18. Zhuang, M., Miao, C., Chen, R. (2020). Fatigue performance analysis and evaluation for steel box girder based on structural health monitoring system. Structural Durability & Health Monitoring, 14(1), 51–79. DOI 10.32604/sdhm.2020.07663. [Google Scholar] [CrossRef]
19. Zhou, X. Y., Treacy, M., Schmidt, F., Brühwiler, E., Toutlemonde, F. et al. (2015). Effect on bridge load effects of vehicle transverse in-lane position: A case study. Journal of Bridge Engineering, 20(12), 4015020. DOI 10.1061/(ASCE)BE.1943-5592.0000763. [Google Scholar] [CrossRef]
20. Battista, R. C., Pfeil, M. S., Carvalho, E. M. (2008). Fatigue life estimates for a slender orthotropic steel deck. Journal of Constructional Steel Research, 64(1), 134–143. DOI 10.1016/j.jcsr.2007.03.002. [Google Scholar] [CrossRef]
21. Guo, T., Frangopol, D. M., Chen, Y. (2012). Fatigue reliability assessment of steel bridge details integrating weigh-in-motion data and probabilistic finite element analysis. Computers & Structures, 112(1), 245–257. DOI 10.1016/j.compstruc.2012.09.002. [Google Scholar] [CrossRef]
22. Cui, C., Xu, Y., Zhang, Q., Wang, F. (2020). Vehicle-induced fatigue damage prognosis of orthotropic steel decks of cable-stayed bridges. Engineering Structures, 212(2), 110509. DOI 10.1016/j.engstruct.2020.110509. [Google Scholar] [CrossRef]
23. Shi, Z., Yang, S., Pu, Q., Zhang, Y. (2019). Fatigue performance of orthotropic steel decks in long-span cable-stayed steel-box girder railway bridges. Journal of Bridge Engineering, 24(5), 4019035. DOI 10.1061/(ASCE)BE.1943-5592.0001399. [Google Scholar] [CrossRef]
24. Connor, R. J., Fisher, J. W. (2006). Consistent approach to calculating stresses for fatigue design of welded rib-to-web connections in steel orthotropic bridge decks. Journal of Bridge Engineering, 11(5), 517–525. DOI 10.1061/(ASCE)1084-0702(2006)11:5(517). [Google Scholar] [CrossRef]
25. Ji, B., Liu, R., Chen, C., Maeno, H., Chen, X. (2013). Evaluation on root-deck fatigue of orthotropic steel bridge deck. Journal of Constructional Steel Research, 90(4), 174–183. DOI 10.1016/j.jcsr.2013.07.036. [Google Scholar] [CrossRef]
26. Yu, Y., Cai, C., Deng, L. (2018). Nothing-on-road bridge weigh-in-motion considering the transverse position of the vehicle. Structure and Infrastructure Engineering, 14(8), 1108–1122. DOI 10.1080/15732479.2017.1401095. [Google Scholar] [CrossRef]
27. BSI (1980). Steel, concrete and composite bridges-Part 10: Code of Practice for Fatigue. London: BSI. [Google Scholar]
28. CEN (2005). Design of steel structures—Part 1–9: Fatigue. Belgium, Brussels: CEN. [Google Scholar]
29. AASHTO (2012). LRFD bridge design specifications. Washington DC: AASHTO. [Google Scholar]
30. Cui, B., Wu, C., Ding, W., Tong, Y. (2010). Influence of acting position of vehicle wheels on fatigue stress range of steel deck. Journal of Architecture and Civil Engineering, 27(3), 19–23 (in Chinese). [Google Scholar]
31. Li, L., Gao, H. (2009). Special research report on vehicle load of highway bridge in feasibility study stage of humen second bridge in Guangdong Province. Beijing, China: CCCC Highway Planning and Design Institute Co., Ltd. (in Chinese). [Google Scholar]
32. Rychlik, I. (1987). A new definition of the rainflow cycle counting method. International Journal of Fatigue, 9(2), 119–121. DOI 10.1016/0142-1123(87)90054-5. [Google Scholar] [CrossRef]
33. Jiang, Y., Ma, Y., Li, S., Zhao, G., He, X. (2014). Economic analysis of highway design exception projects. 10th APTDC, Beijing, China. [Google Scholar]
 | This work is licensed under a Creative Commons Attribution 4.0 International License, which permits unrestricted use, distribution, and reproduction in any medium, provided the original work is properly cited. |