| Structural Durability & Health Monitoring |
DOI: 10.32604/sdhm.2021.016889
ARTICLE
Assessment of Seismic Damage in Nativity Church in Bethlehem Using Pushover Analysis
1Civil and Architectural Engineering Department, College of Engineering, Palestine Polytechnic University, Hebron, Palestine
2Civil Engineering Department, Faculty of Engineering, Najjah National University, Nablus, Palestine
*Corresponding Author: Belal Almassri. Email: mbelal@ppu.edu
Received: 07 April 2021; Accepted: 24 September 2021
Abstract: This study focuses on advanced finite element (FE) analyses on The Church of Nativity located in Bethlehem (Palestine), one of the most historic structures in the world. To ensure the model quality, a 3D FE model was created using two types of typical commercial software, DIANA FEA and SAP2000. From analyses, one of the expected behaviors for this kind of masonry structure “low modal period” was found. The seismic behavior of the church was studied using pushover analyses, which were conducted using DIANA FEA. The first unidirectional mass proportional load pattern was created in both directions, X-direction as a longitudinal direction and Y-direction as the transversal direction. An incremental iterative procedure was used with monotonically increasing horizontal loads, using constant gravity loads. The results showed that the transversal direction is the most vulnerable and the damage concentrates at the main lateral (longitudinal) walls, mainly at the south and north alignment walls, and also at the vaults and at the connections of the vaults to the apse. Crack width was at the upper limit in the in-plane direction (X-direction). While, in Y-direction, it exceeded the limits of IBC code in width and length with a maximum width of 13.7 mm. A more accurate nonlinear dynamic analysis is recommended in the near future, which takes into account the material nonlinearity for more reasonable seismic behavior simulation.
Keywords: Masonry; seismic assessment; FE model; non-linear analysis; DIANA FEA; SAP 2000
Inadequately tied masonry structures, such as monumental old buildings in urban areas, do not have enough resistance in case of strong earthquakes [1]. The natural catastrophes have always been the main reason behind the damage of cultural heritage. Masonry buildings are generally able to carry vertical loads safely but do not resist well the horizontal loads, as the masonry structures have very low tensile strength [1,2]. Conducting a structural analysis of heritage masonry structure is considered complicated [3,4]. Some studies discussed the seismic damage and vulnerability of old historical buildings affected by earthquake activities around the world [5–8].
There is an increasing need in the engineering society to conserve the heritage buildings, there has been progress recently in the finite element FE based numerical modeling tools, and some of these tools were adapted to be used in the analysis of masonry structures [9,10].
Pushover analysis method is a simple method used to predict the nonlinear behavior of the structure under seismic loads, it employs the lateral forces with increasing load used to push the structure until the ultimate displacement is reached, this method provides useful data about the peak response in terms of floor’s displacement, story’s drift, and other deformations quantities, it also can demonstrate how progressive failures in structure can occur [11]. The post-earthquake problems are to evaluate the most suitable strategy of retrofitting and to have enough information on the resistance of non-collapsed structures [12–14]. Both previous activities are difficult to be done because churches cannot be reduced to any standard static scheme. Recently, researchers have studied the seismic assessment and performance of historical buildings, including their details, difficulties, mechanisms, regions, and rehabilitation process. One of the important studies was done by [15] for the St. James Church, using pushover analysis (Before and after the New Zealand Earthquake), after the nonlinear pushover analyses were carried out on both principal directions, the church was no longer safe. The analysis results of the model showed moderate agreement with the visual inspection performed in the site, which validated the model, and finally, the limit analysis using macro block analysis was also carried out to validate the main local collapse mechanisms of the church. Recently, there are many papers focused on the failure mechanisms of old masonry churches around the world, using different numerical modeling approaches, while other researchers studied the retrofitting possibilities using different approaches [16–25].
Alessandri et al. [26] proposed an innovative technique for reinforcing the wall of the Nativity Church in Bethlehem against earthquakes, 3-D modal analysis of the entire church revealed that the structure is characterized by clear local modes of vibration. This showed that in the event of an earthquake, a Crusade-era wall addition is at risk of collapse via simple overturning around its base, due to the lack of firm connections with the orthogonal walls of the façade and the transept. Hence, a novel double system of horizontal steel tension structures was designed to consolidate the wall.
Bethlehem is located between two areas of low to medium seismicity, one to the east and one to the west side. It is situated close to the fault line separating the African and Arabian tectonic plates and has been affected by several minor and major earthquakes with epicenters in the surrounding areas, such as the 1927 Palestinian earthquake, also called Jericho Earthquake. Many Palestinian cities were heavily damaged, thousands of people were left homeless, and at least 500 were estimated to be killed [27]. Strong earthquake events occurred in Palestine averagely, every one hundred years, i.e., the 1837 earthquake that occurred in the northern part of Palestine, and the 1927 earthquake, which left hundreds of victims and a lot of damage. Therefore, the engineers and researchers should focus on the vulnerability of Palestine to earthquake events. As a result, the need for this research was produced to study the architectural complex of historical structures in Palestine and to discuss its behavior against seismic vulnerability. A 3-D Finite Element model was created, a comparative modal analysis was done using both SAP 2000 and DIANA FEA to ensure the quality of the FE model, finally, a pushover analysis was conducted to investigate the phenomena of crack propagation in this masonry church.
2.1 Case Study: The Nativity Church
The Nativity Church is one of the earliest Christian structures in the world, which is the birthplace of Jesus. The original Basilica, created in the 4th century by Emperor Constantine, which was completely damaged in the Samaritan Revolt [28]. Fig. 1 shows an old plan of the church which was drawn by Fr. Bernardino Amico in 1609 [29].
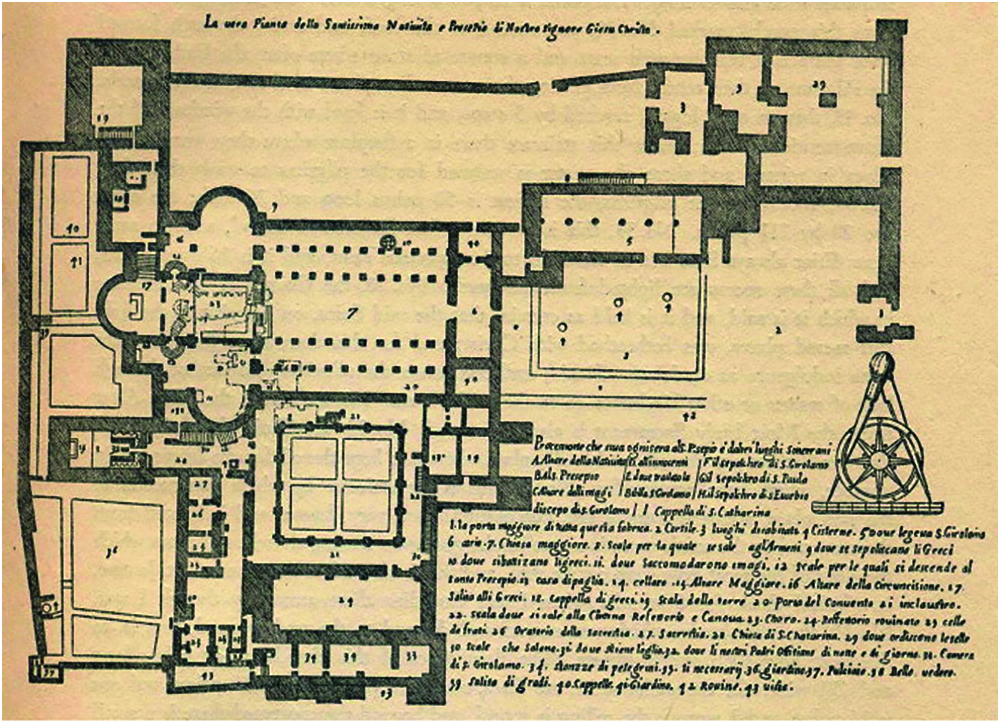
Figure 1: Old plan of nativity church
It was replaced later on the same site, by another basilica; which was different in its plan and had at that time, modified parts of the original building [28], Fig. 2 presents the current basilica, which is located in Bethlehem, over a fertile limestone hills, the figure gives a visualization of the whole structure of the church, its mainly constructed of masonry walls, which are composite material consisting of an assemblage of stones and mortar joints, each of them has different properties, and due to the low tensile and shear bond strength, mortar joints act as a plane of weakness.
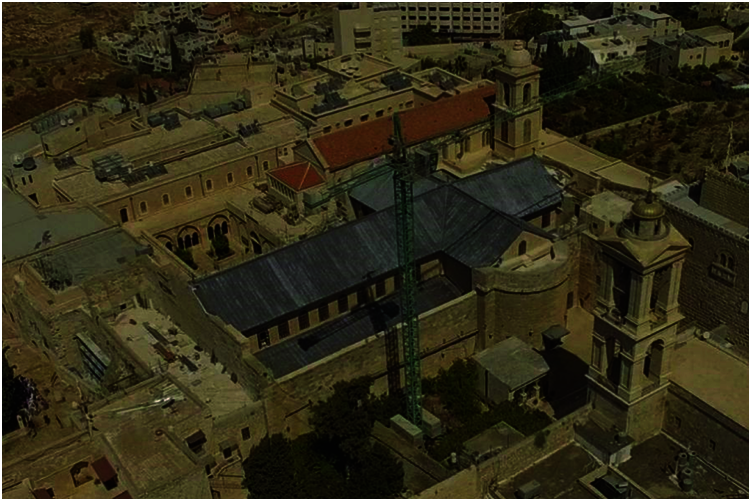
Figure 2: Perspective picture of nativity church
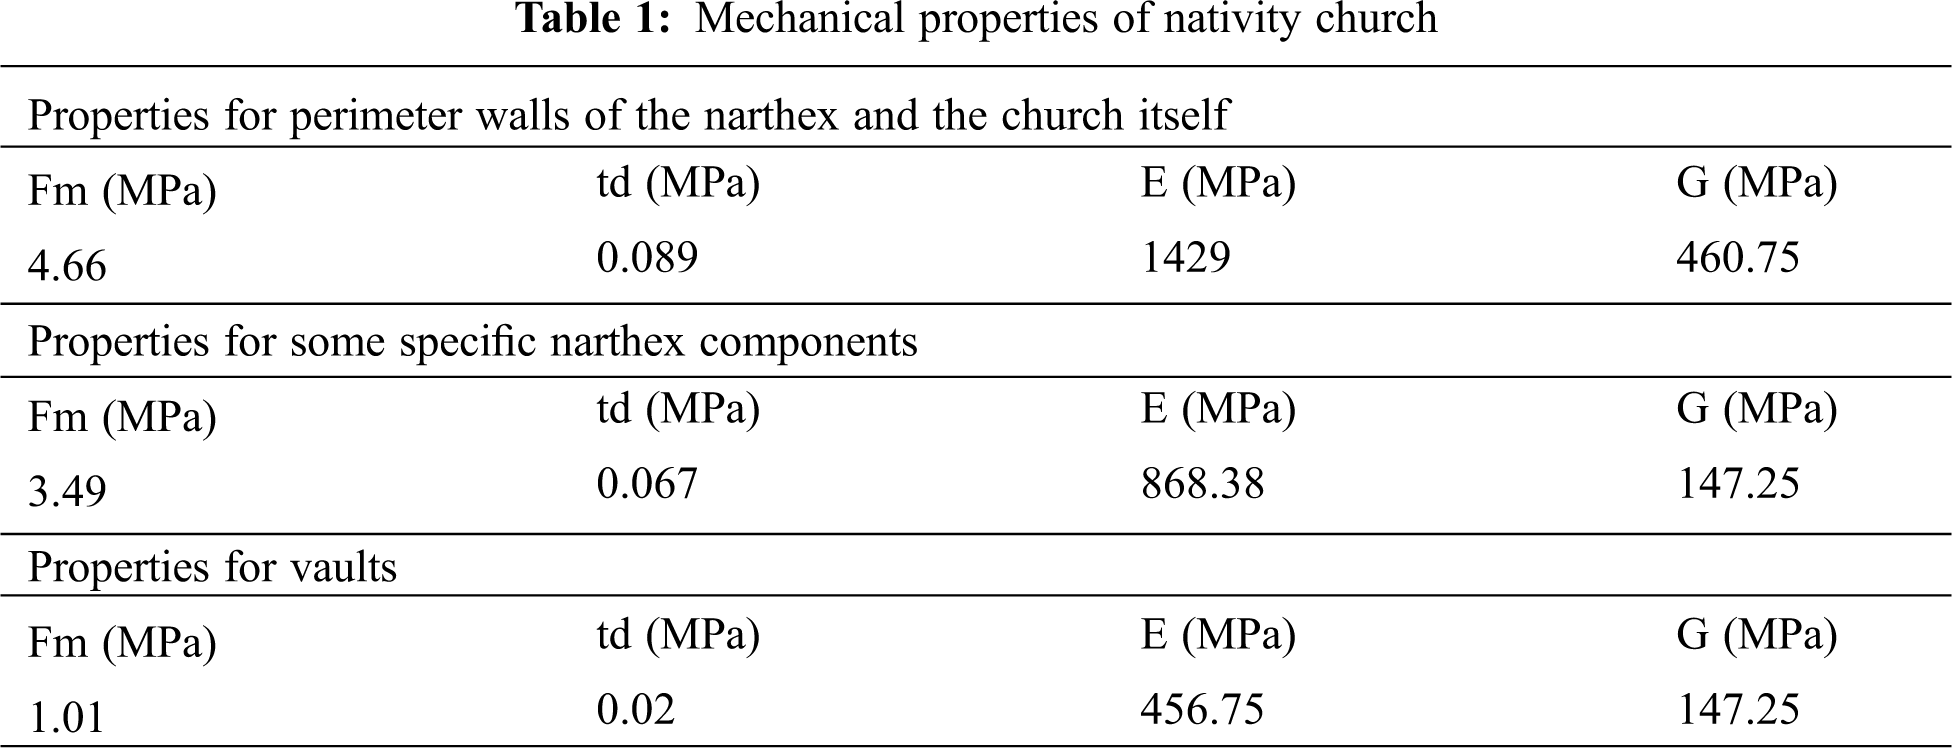
The Nativity Church restored and some components rebuilt again many times, so it has different materials which can be noticed through visual inspection, but it is difficult to use in-situ inspection techniques such as coring, flat jack test, sonic tomography, thermo vision, etc., due to privacy and saintliness, as well as the political situation and lack of technology and available devices. The mechanical properties of the materials used in the numerical model will be used based on onsite tests, which have been carried out by [26]. These tests focused on the structural components of the Church and the material properties of masonry walls like compressive strength (Fm), shear strength (td), Young’s modulus (E), shear modulus (G), Poisson coefficient (υ), and self-weight (w). Table 1 summarizes these values for the components of the church as published before. On the other hand, the assumptions used in this paper refer to that masonry structures have very low tensile strength, so in the analysis, the tensile strength is assumed 5% of the compression strength. In more detail, for narthex and church walls, the tensile strength is 0.233 mPa, for some specific narthex components, 0.175, and 0.05 MPa for the vaults.
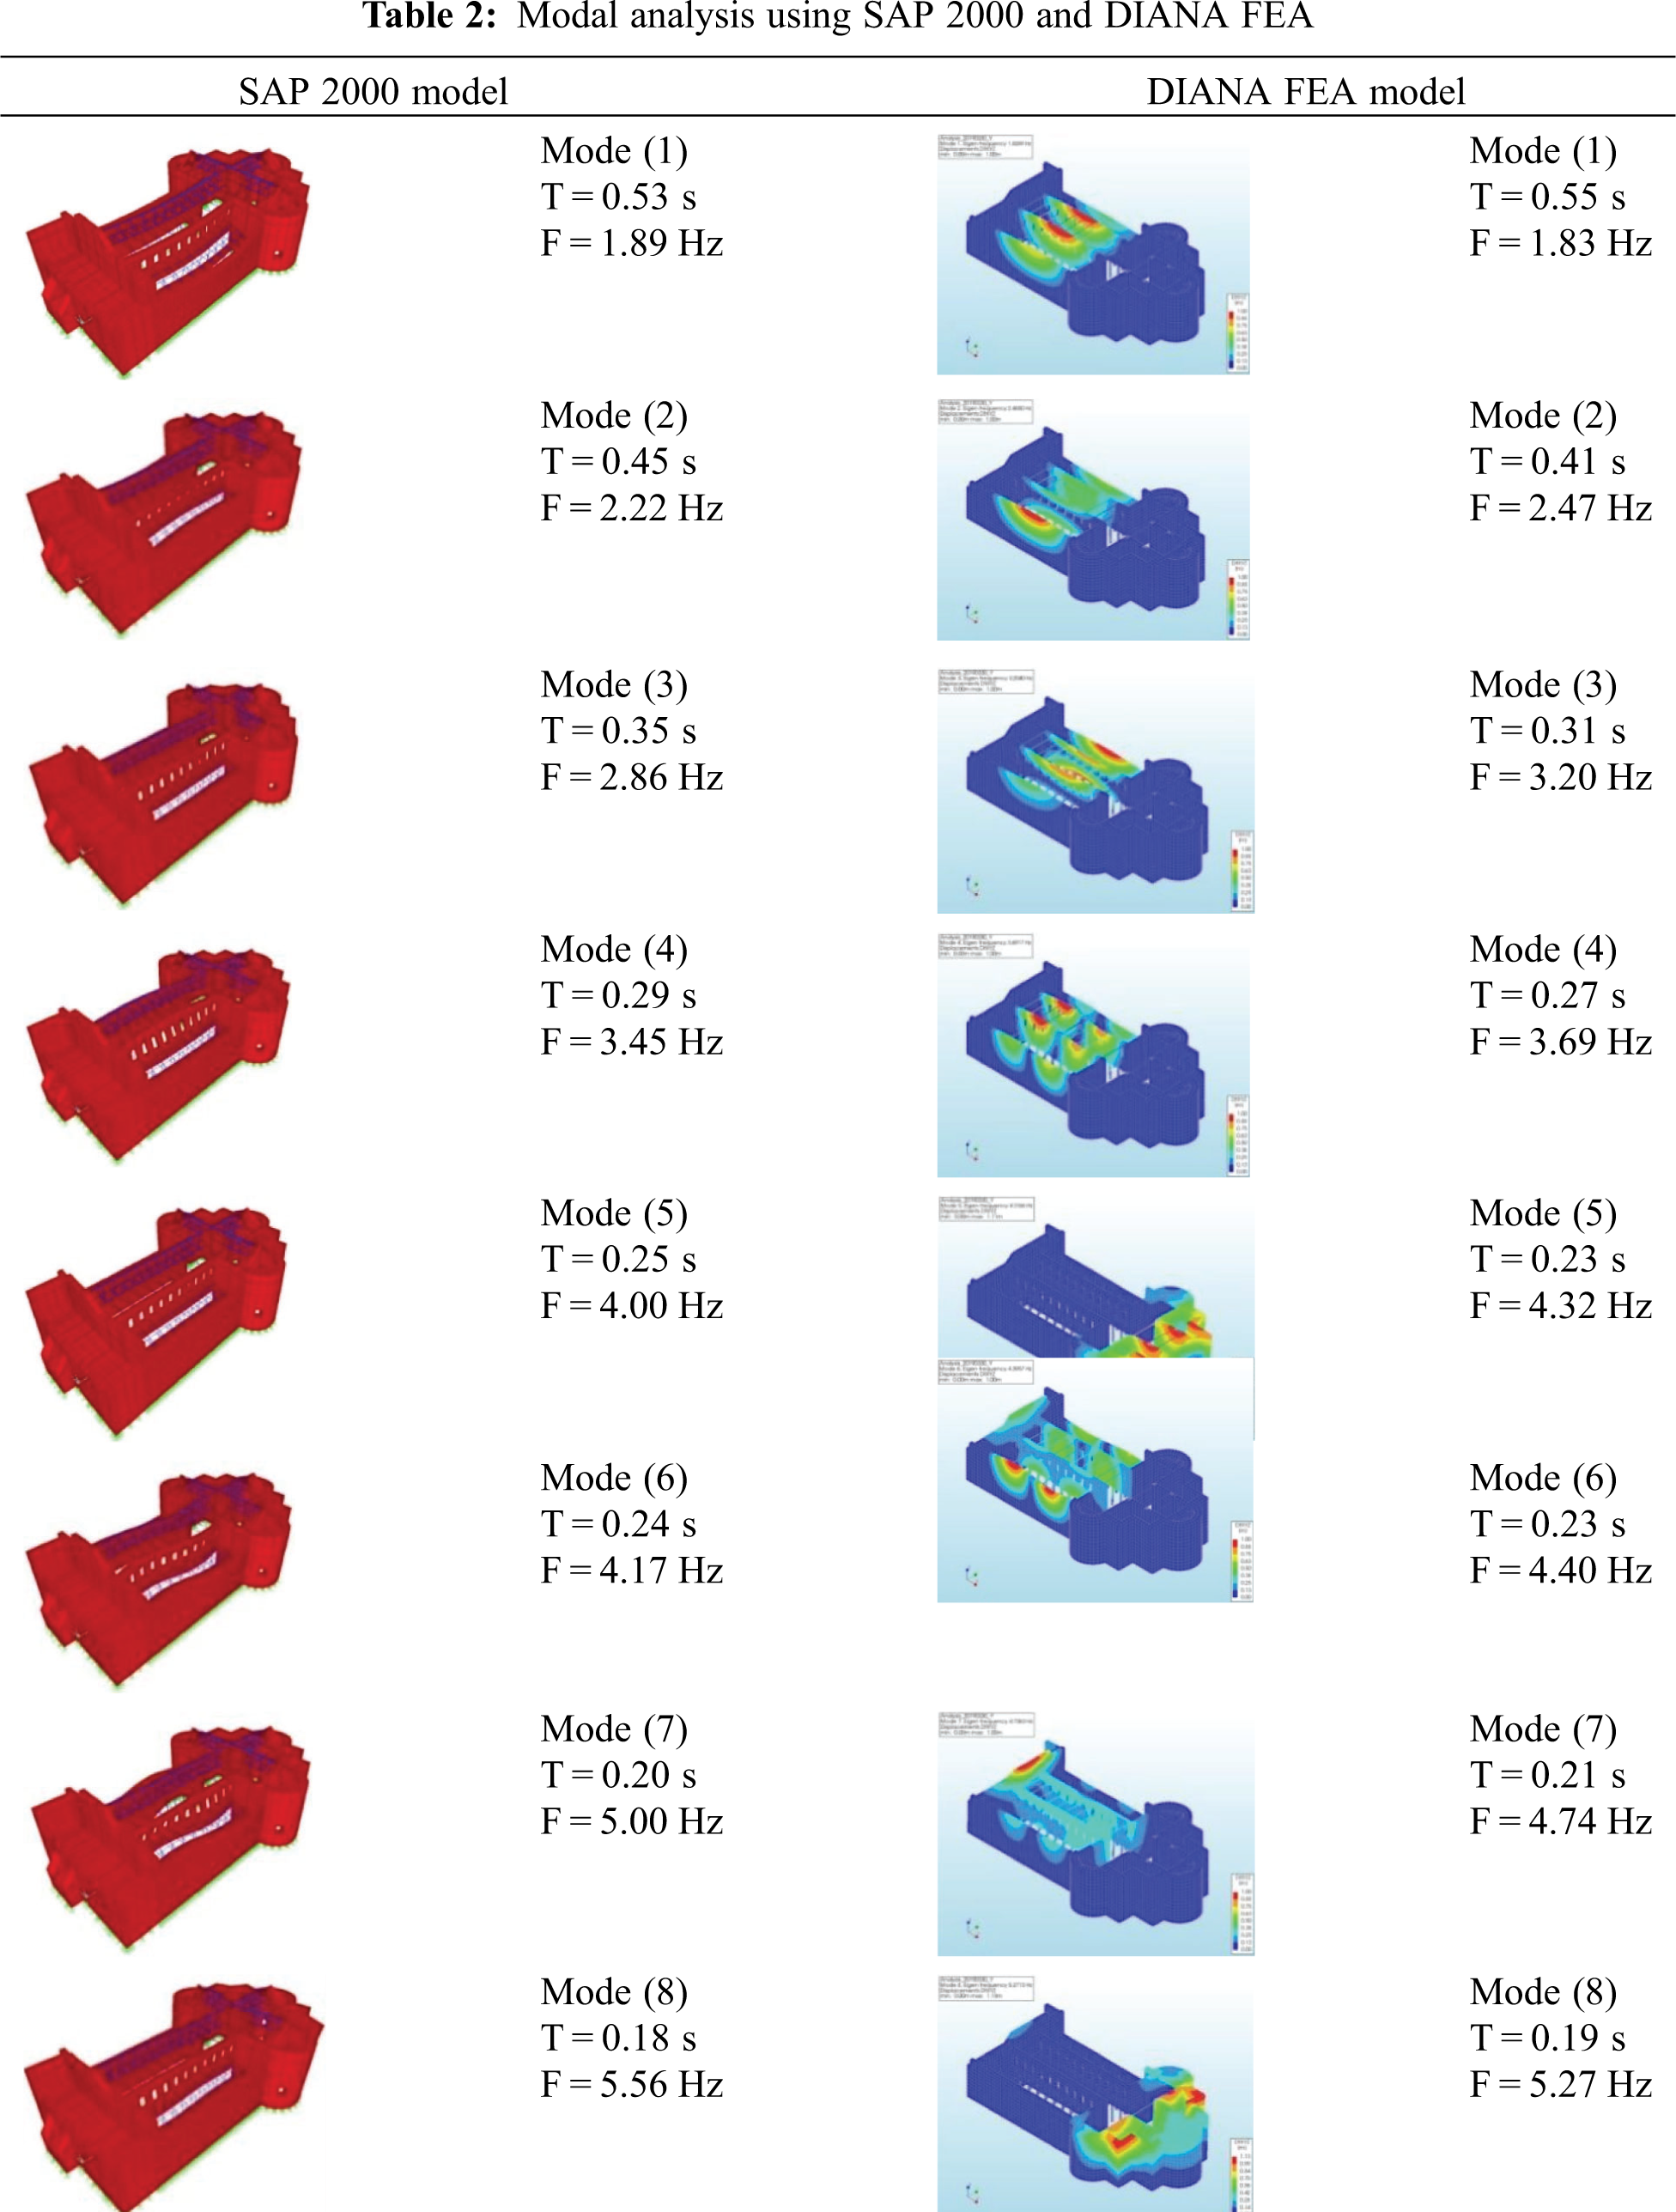
In this section, the investigation of modal analysis will be done to show the vulnerability and possibility for out-of-plane mechanisms. Table 2 shows the corresponding modal periods for the first 8 modes, generated from SAP 2000 and DIANA FEA and followed by a comparison between them for verification. In detail, the first, fourth, and sixth modes show the applicability of the interior walls to overturn and move in harmonically motion. In addition, out-of-plane mechanisms are possible also for the southern and northern walls, whose safety assessment would be necessary for local analysis, and can be confirmed in the second and third modes. As similar, the five and eight modes of the “as it is” model involves the translation motion in the two principal directions of church shoulders, these shoulders which have the properties of perimeter walls, play an important role in the connections between semi circular apses, and finally, the seventh mode shows the overturning mechanism of façade, which undergoes larger displacement.
Figs. 3 and 4 show the modal frequencies and the errors corresponding to the modal periods, respectively, after the assumption of DIANA FEA results as more accurate. It is obvious that the modal periods are very close to each other and the maximum percentage error is 11.23%.
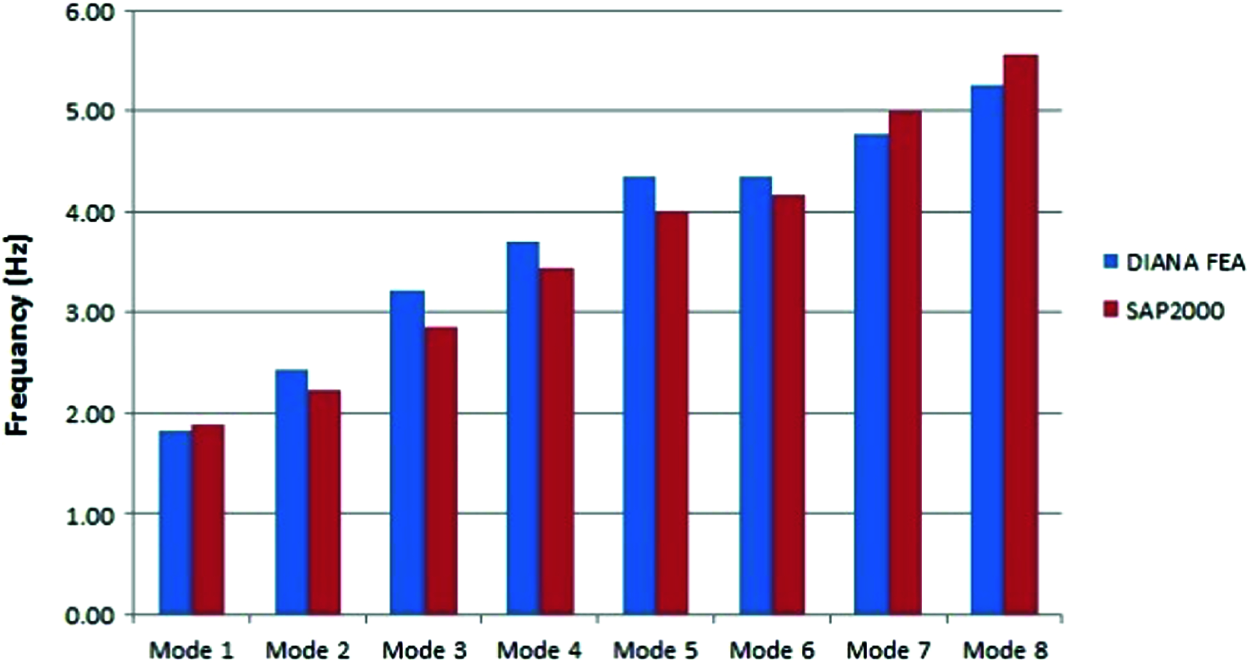
Figure 3: Frequencies for the two models
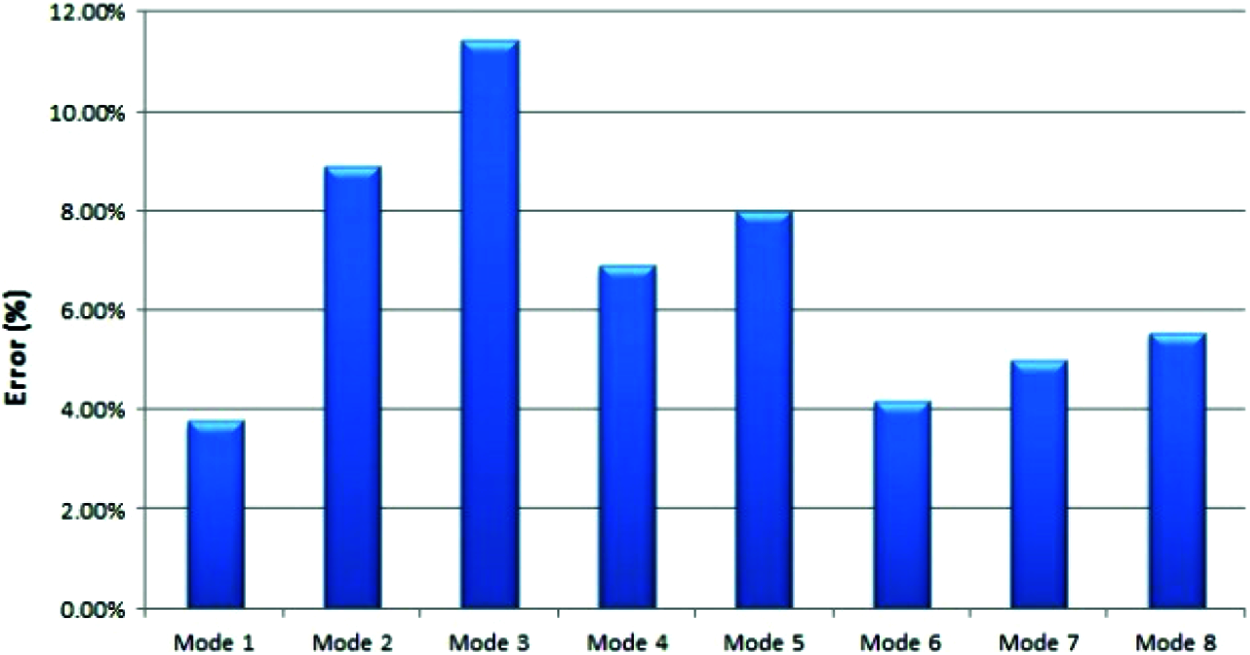
Figure 4: Errors % for the two models
3.2 Pushover Analysis Using DIANA FEA
The material model which was used for the behavior of the masonry structure consists of two models which are the smeared cracking model for tension (Rankine failure criterion) and the plasticity model for compression (Drucker-Prager failure criterion, as shown in Fig. 5). The Smeared cracking is specified as a combination of tension softening, shear retention, and tension cut-off with constant stress cut-off is chosen. The linear tension softening based on the energy of the fracture which was selected, and the crack bandwidth was used, the cracks continuously spread within the element, and the stiffness was reduced, finally, a constant shear retention factor is chosen due to the cracking of the material.
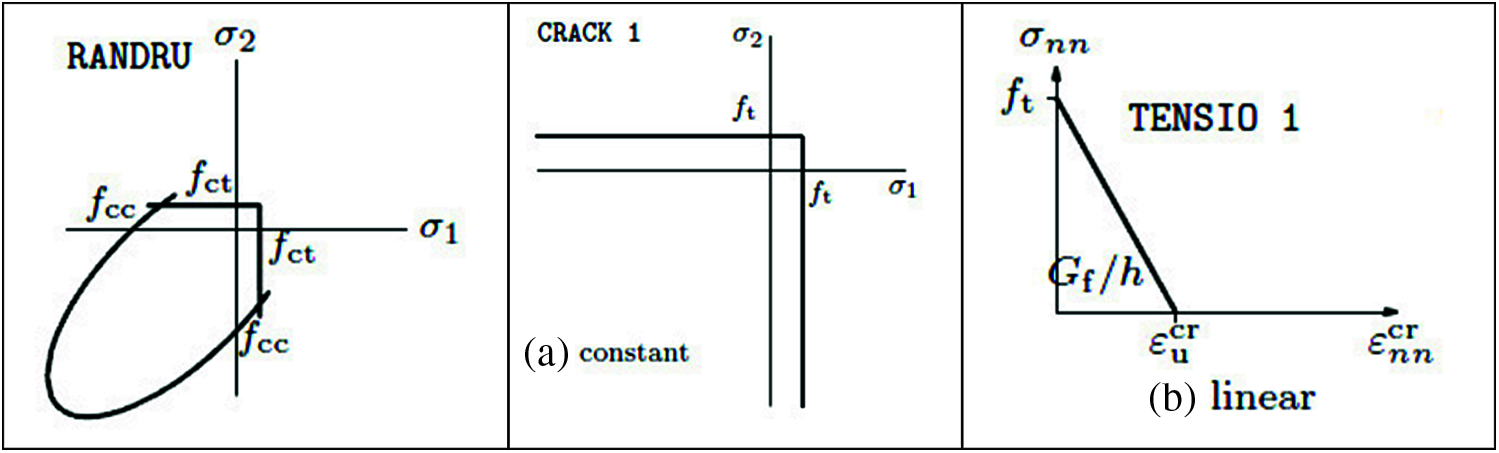
Figure 5: Material constitutive models used for masonry behavior Rankine & Drucker-Prager tension cut-off tension softening
For the entire aforementioned pushover analyses, the regular Newton-Raphson method was used for the iteration process, an energy convergence control with a tolerance of −106. In displacement control analysis, the displacement of a reference point is incrementally applied, but in force control method, and for the models experiencing softening, this method cannot lead to a solution when the load applied is higher than the capacity, Fig. 6 shows the two procedures.
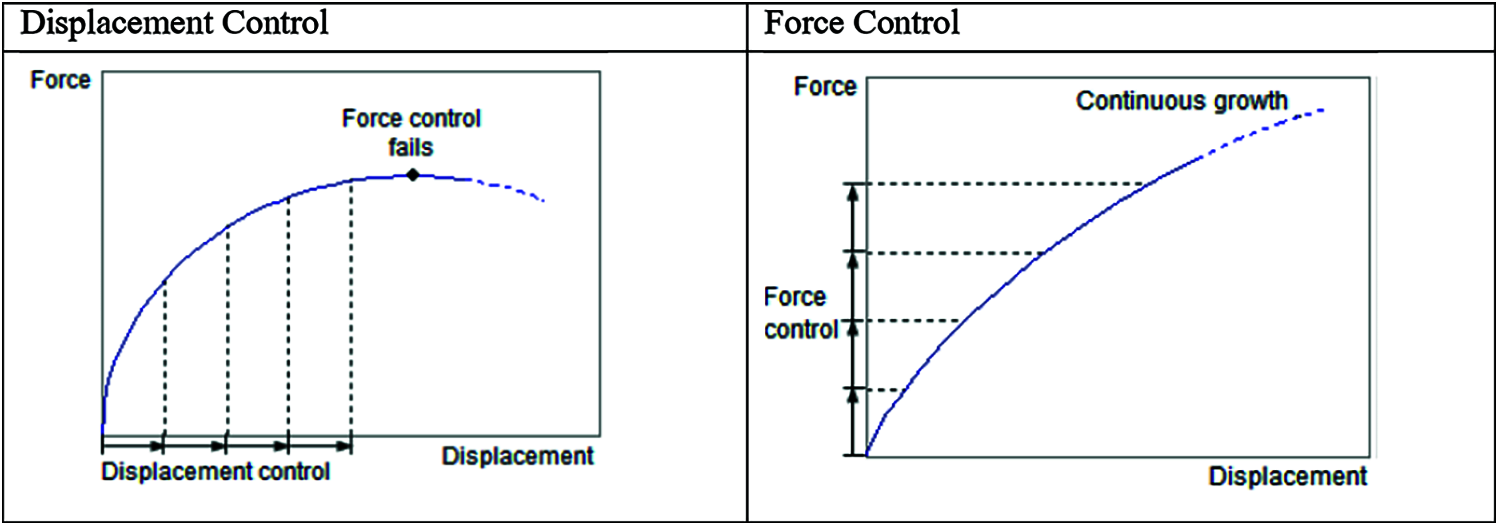
Figure 6: Displacement control vs. force control [30]. Displacement control force control
The arch length should be taken into account, as the load-displacement curve is almost horizontal, the prediction of the displacements’ increment is large, and when the loads’ increment is fixed, the results of displacements will be also large. The analysts use arc-length control, where the increment is adjusted, and this method is illustrated in Fig. 7.
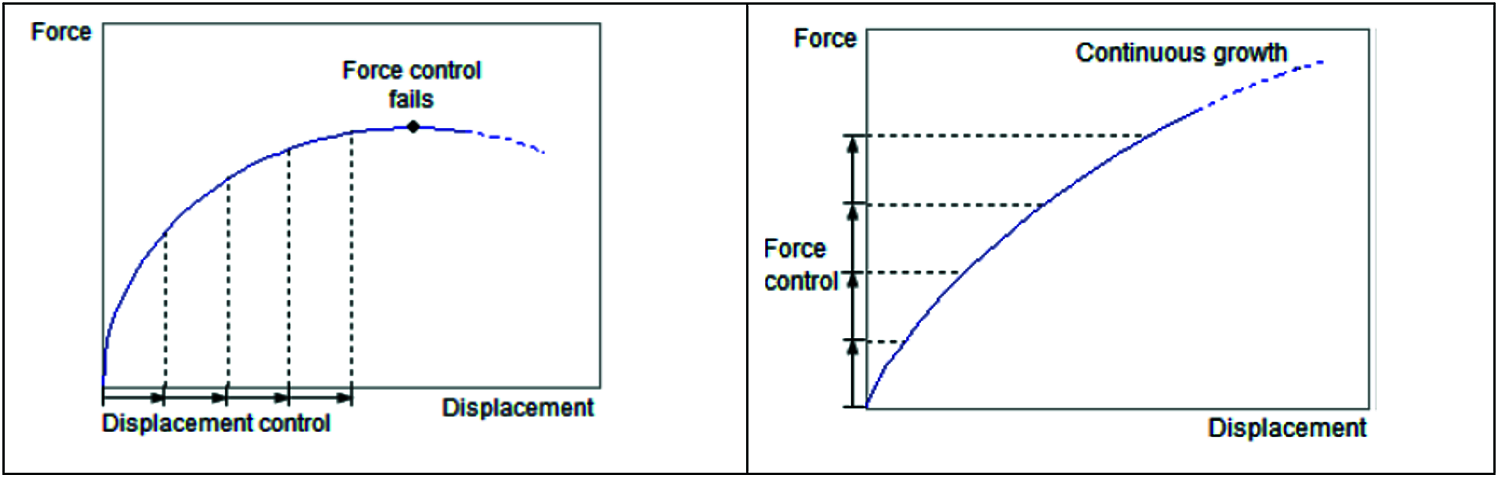
Figure 7: Load increment methods characteristics and arc-length control [30]
The iterative process was defined by DIANA FEA. Adapted iteratively by the increment until equilibrium is achieved. The total displacement of the iteration is therefore defined as:
where Δui + 1 represents the total displacement increment at iteration (i), Δui is the total displacement increment at iteration (i + 1), and бui + 1 is the iterative increment.
The results are reported in terms of crack propagation, as the main goal of this study is to investigate the phenomena of crack initiation in masonry structures during an earthquake activity, so the FE model was constructed using DIANA FEA, using the pushover analysis. This analysis method is usually used to appreciate the seismic performance of masonry structures by making a simulation using static horizontal forces. Moreover, the material exhibits a nonlinear behavior, by which the cracking pattern can be generated. The results present crack propagation in the whole church in both directions X and Y, which helps in understanding the general failure pattern.
The analysis of the Nativity Church determines the critical elements by monitoring the crack propagation in each element, i.e., some church elements often present significant cracks in gravity loads without any lateral load excitation, in detail, the contours show the values of cracks in some locations, concerning load steps of the self-load of the structure only, it is obvious that the cracks reached the max value of 5.97 mm in the vaults of the narthex, and the apses (shown in Fig. 8).
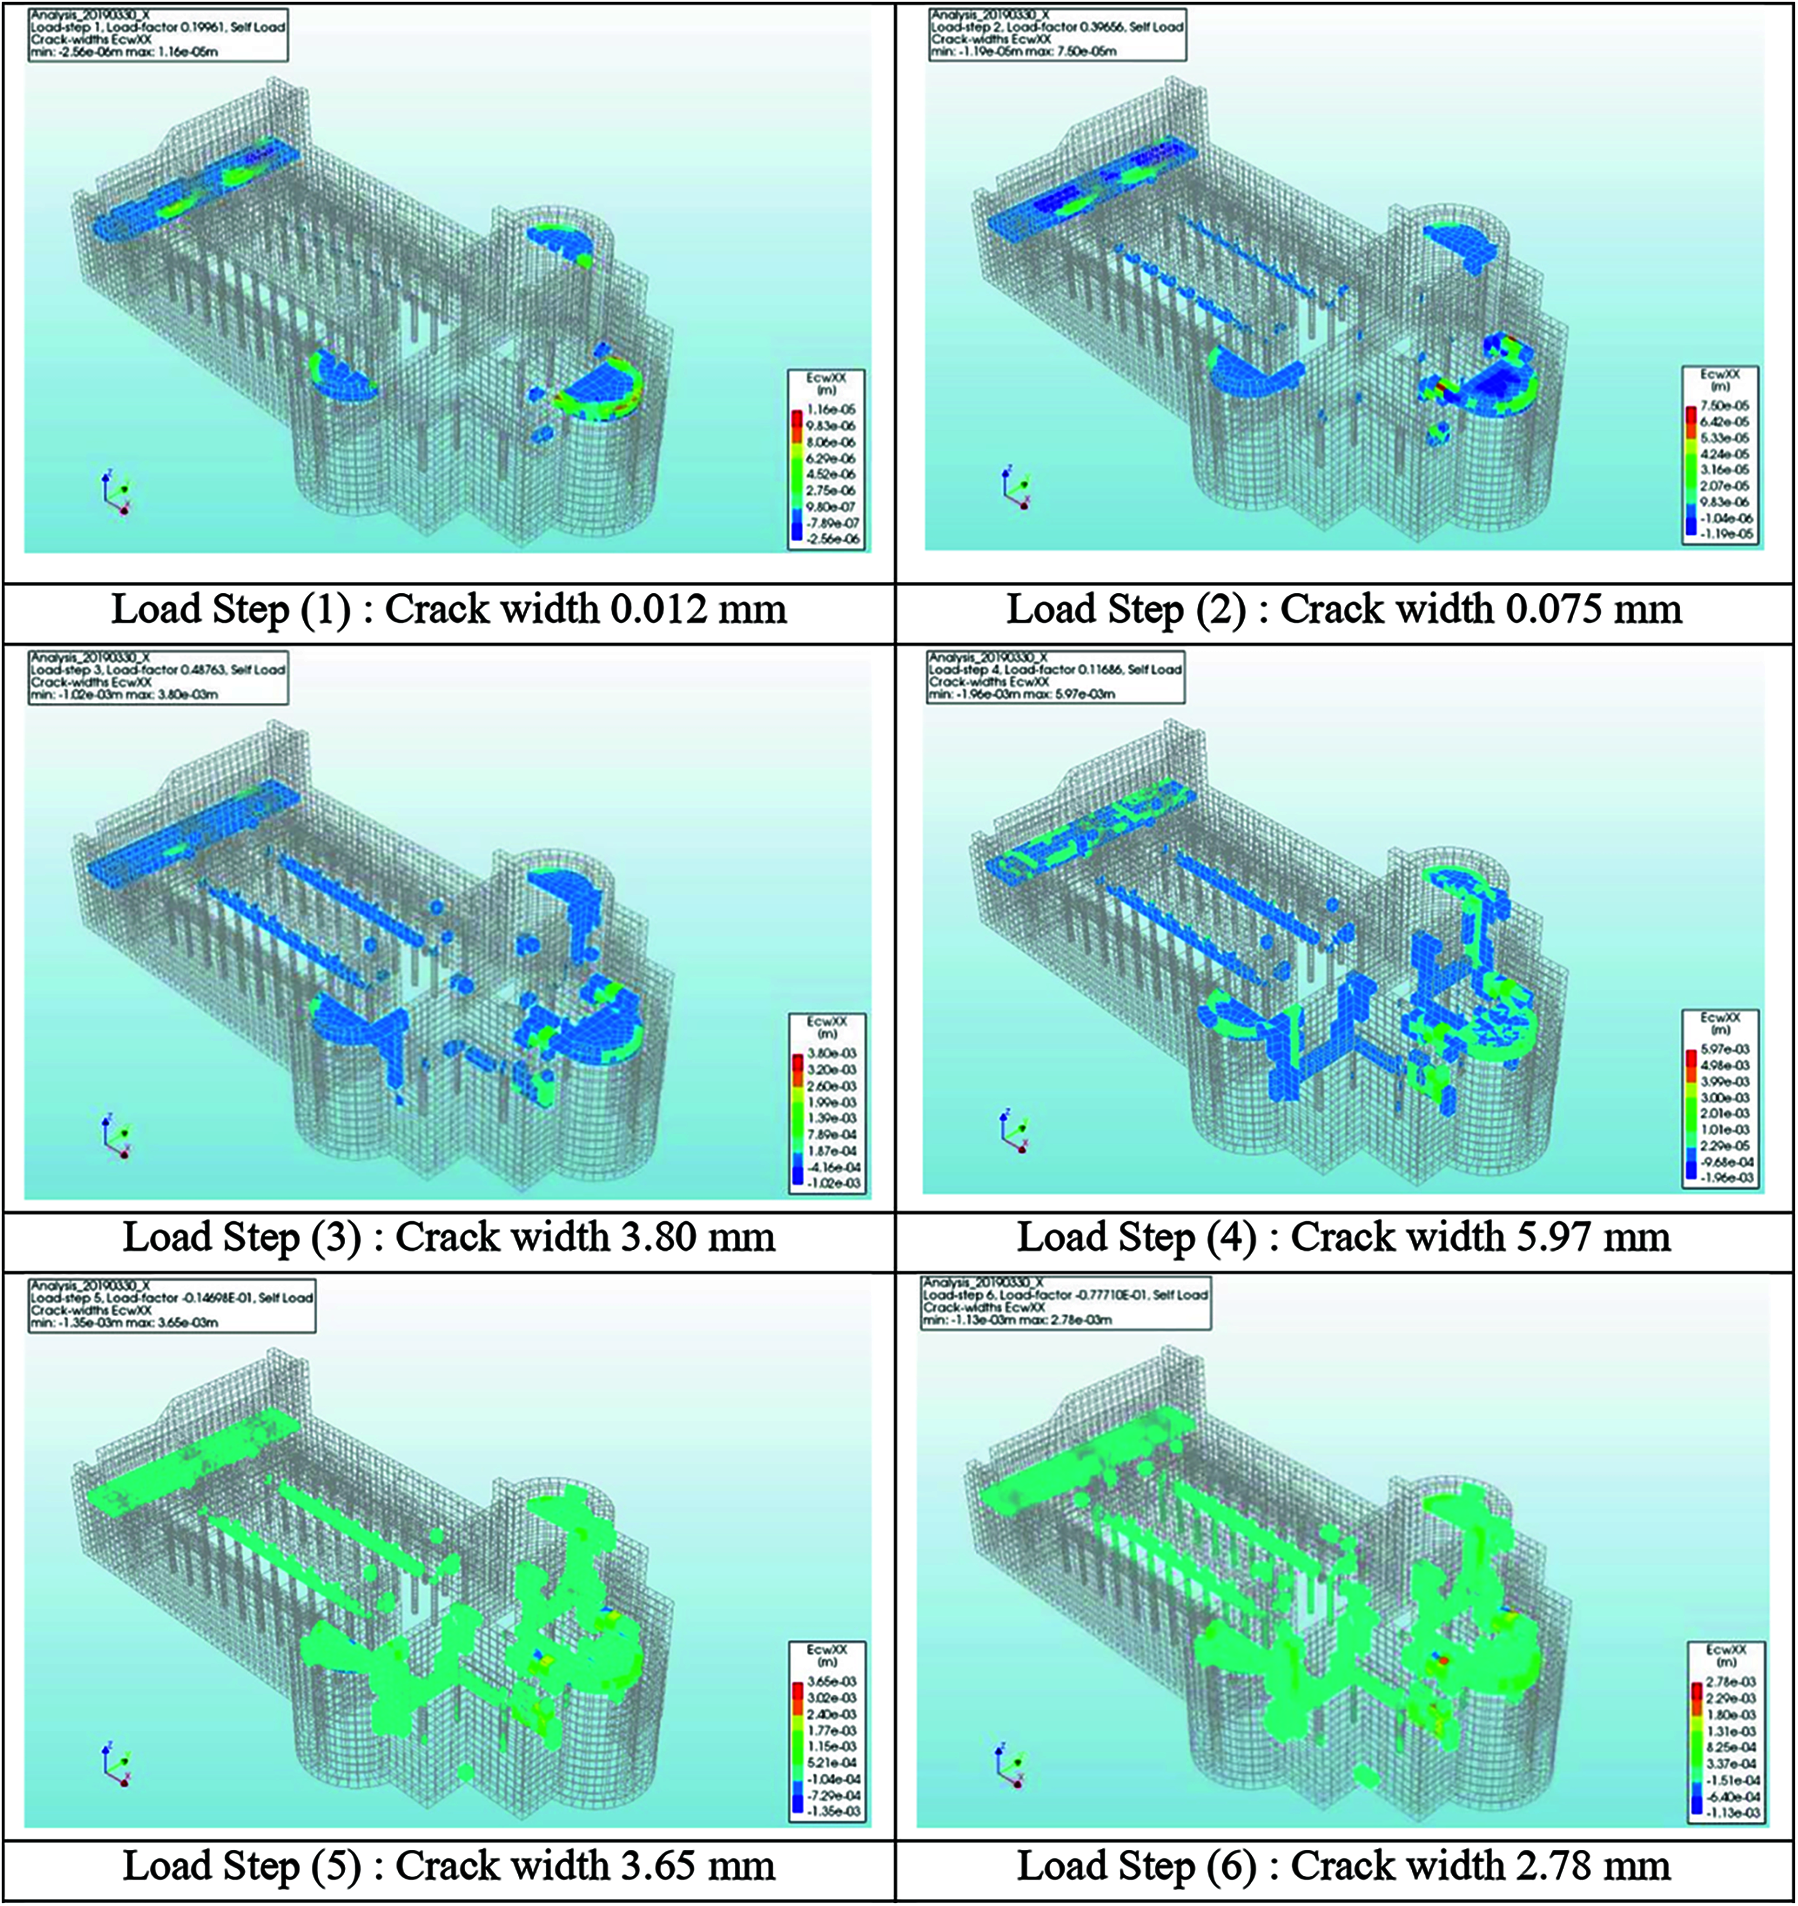
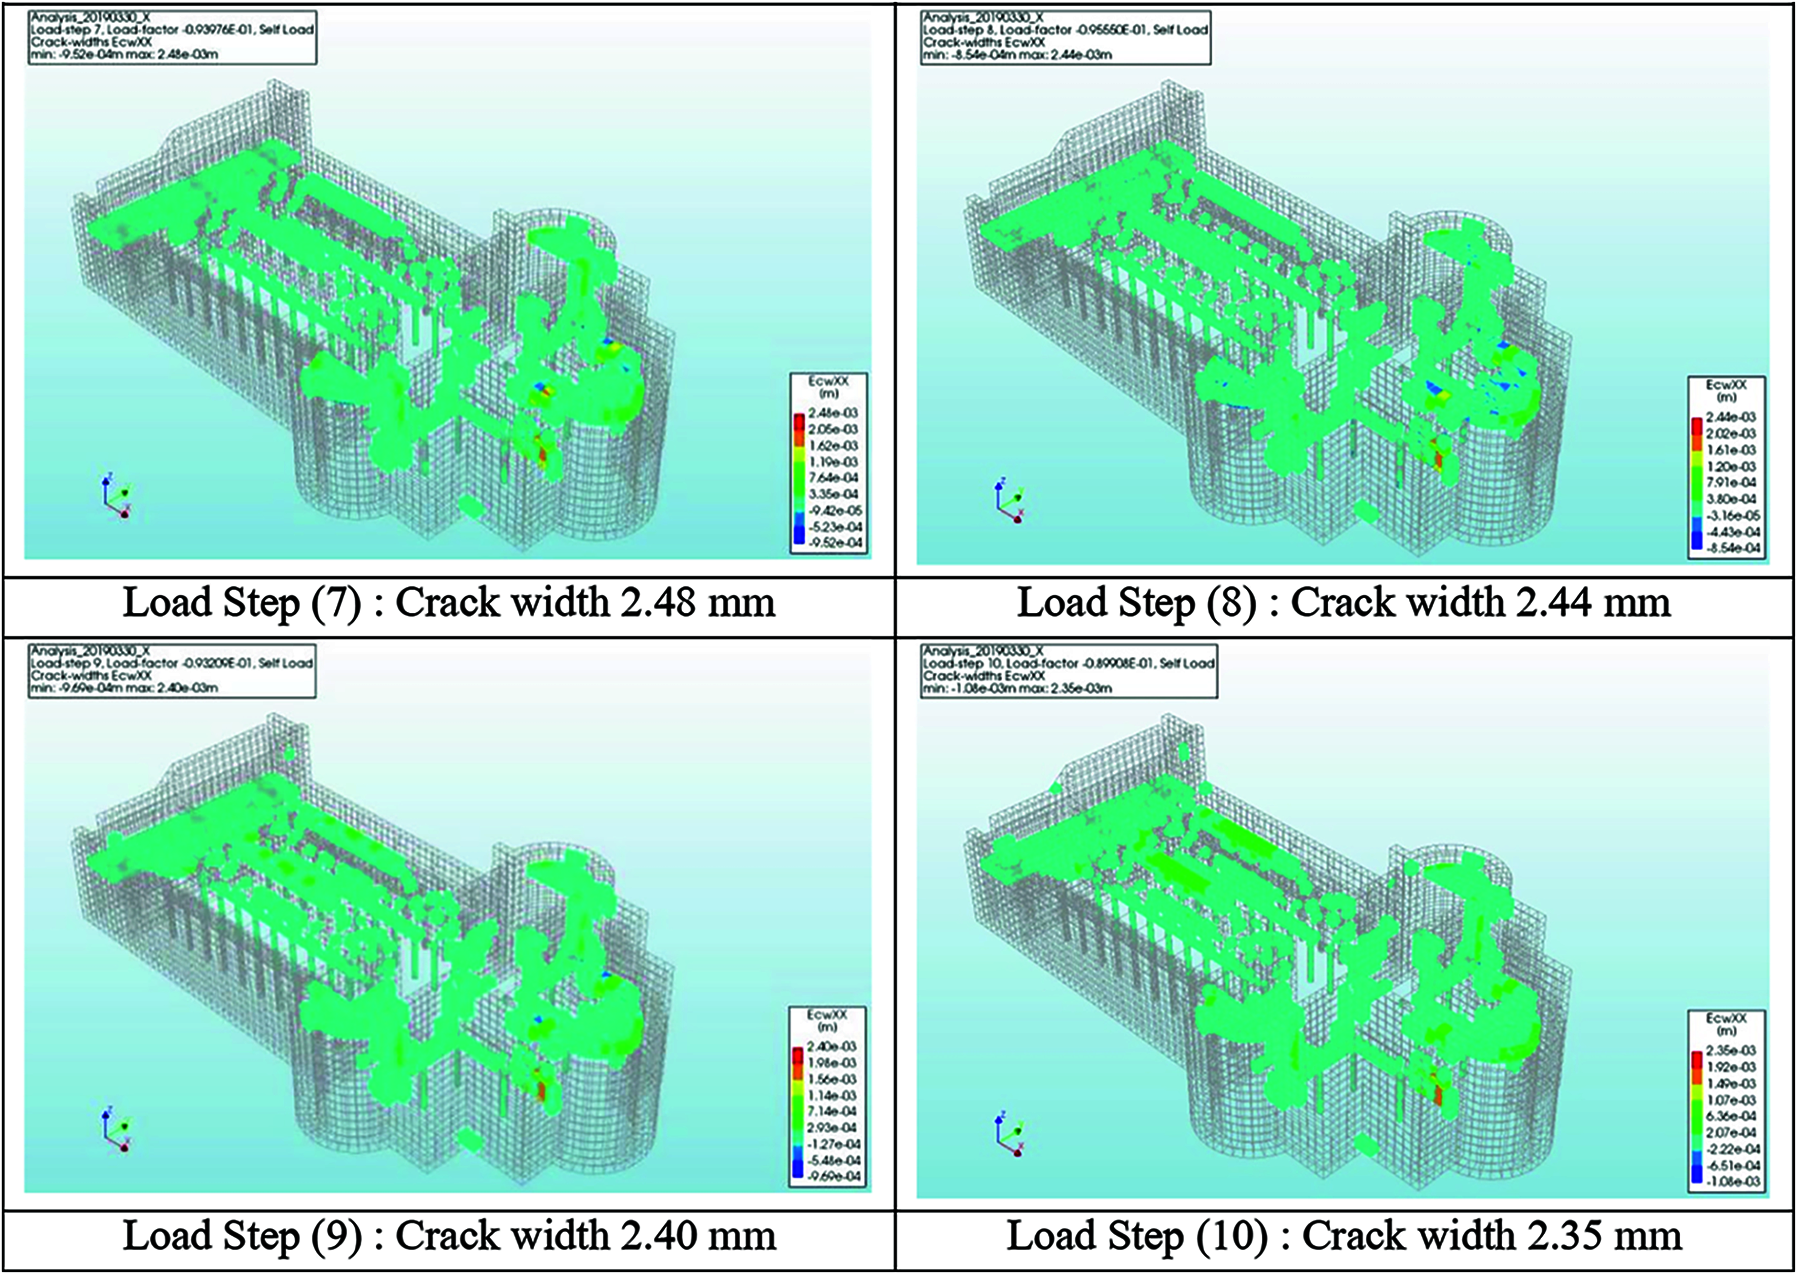
Figure 8: Crack widths generated by gravity loads analysis in X-direction. Load Step (1): Crack width 0.012 mm Load Step (2): Crack width 0.075 mm Load Step (3): Crack width 3.80 mm Load Step (4): Crack width 5.97 mm Load Step (5): Crack width 3.65 mm Load Step (6): Crack width 2.78 mm Load Step (7): Crack width 2.48 mm Load Step (8): Crack width 2.44 mm Load Step (9): Crack width 2.40 mm Load Step (10): Crack width 2.35 mm
It is clear that the church components are coherent under gravity loads, suffering from a superficial deposit of atmospheric particulate, but the gross cracks generated from pushover excitations have to be monitored and require an assessment of the structural soundness of the elements. For this purpose, the model of Nativity Church which used as a damage monitoring method to check the crack stability and integrity state of elements was also used for the determination of cracks after the application of lateral loads, as shown in Fig. 9. The results showed that the masonry building is subjected to partially collapse during nonlinear static monotonic load, due to the loss of equilibrium of masonry portions, and enlargement of cracks widths as shown from Load Step (11) to Load Step (20). Expected local mechanisms that are generated from the analysis are essential issues in the seismic analysis of masonry buildings.
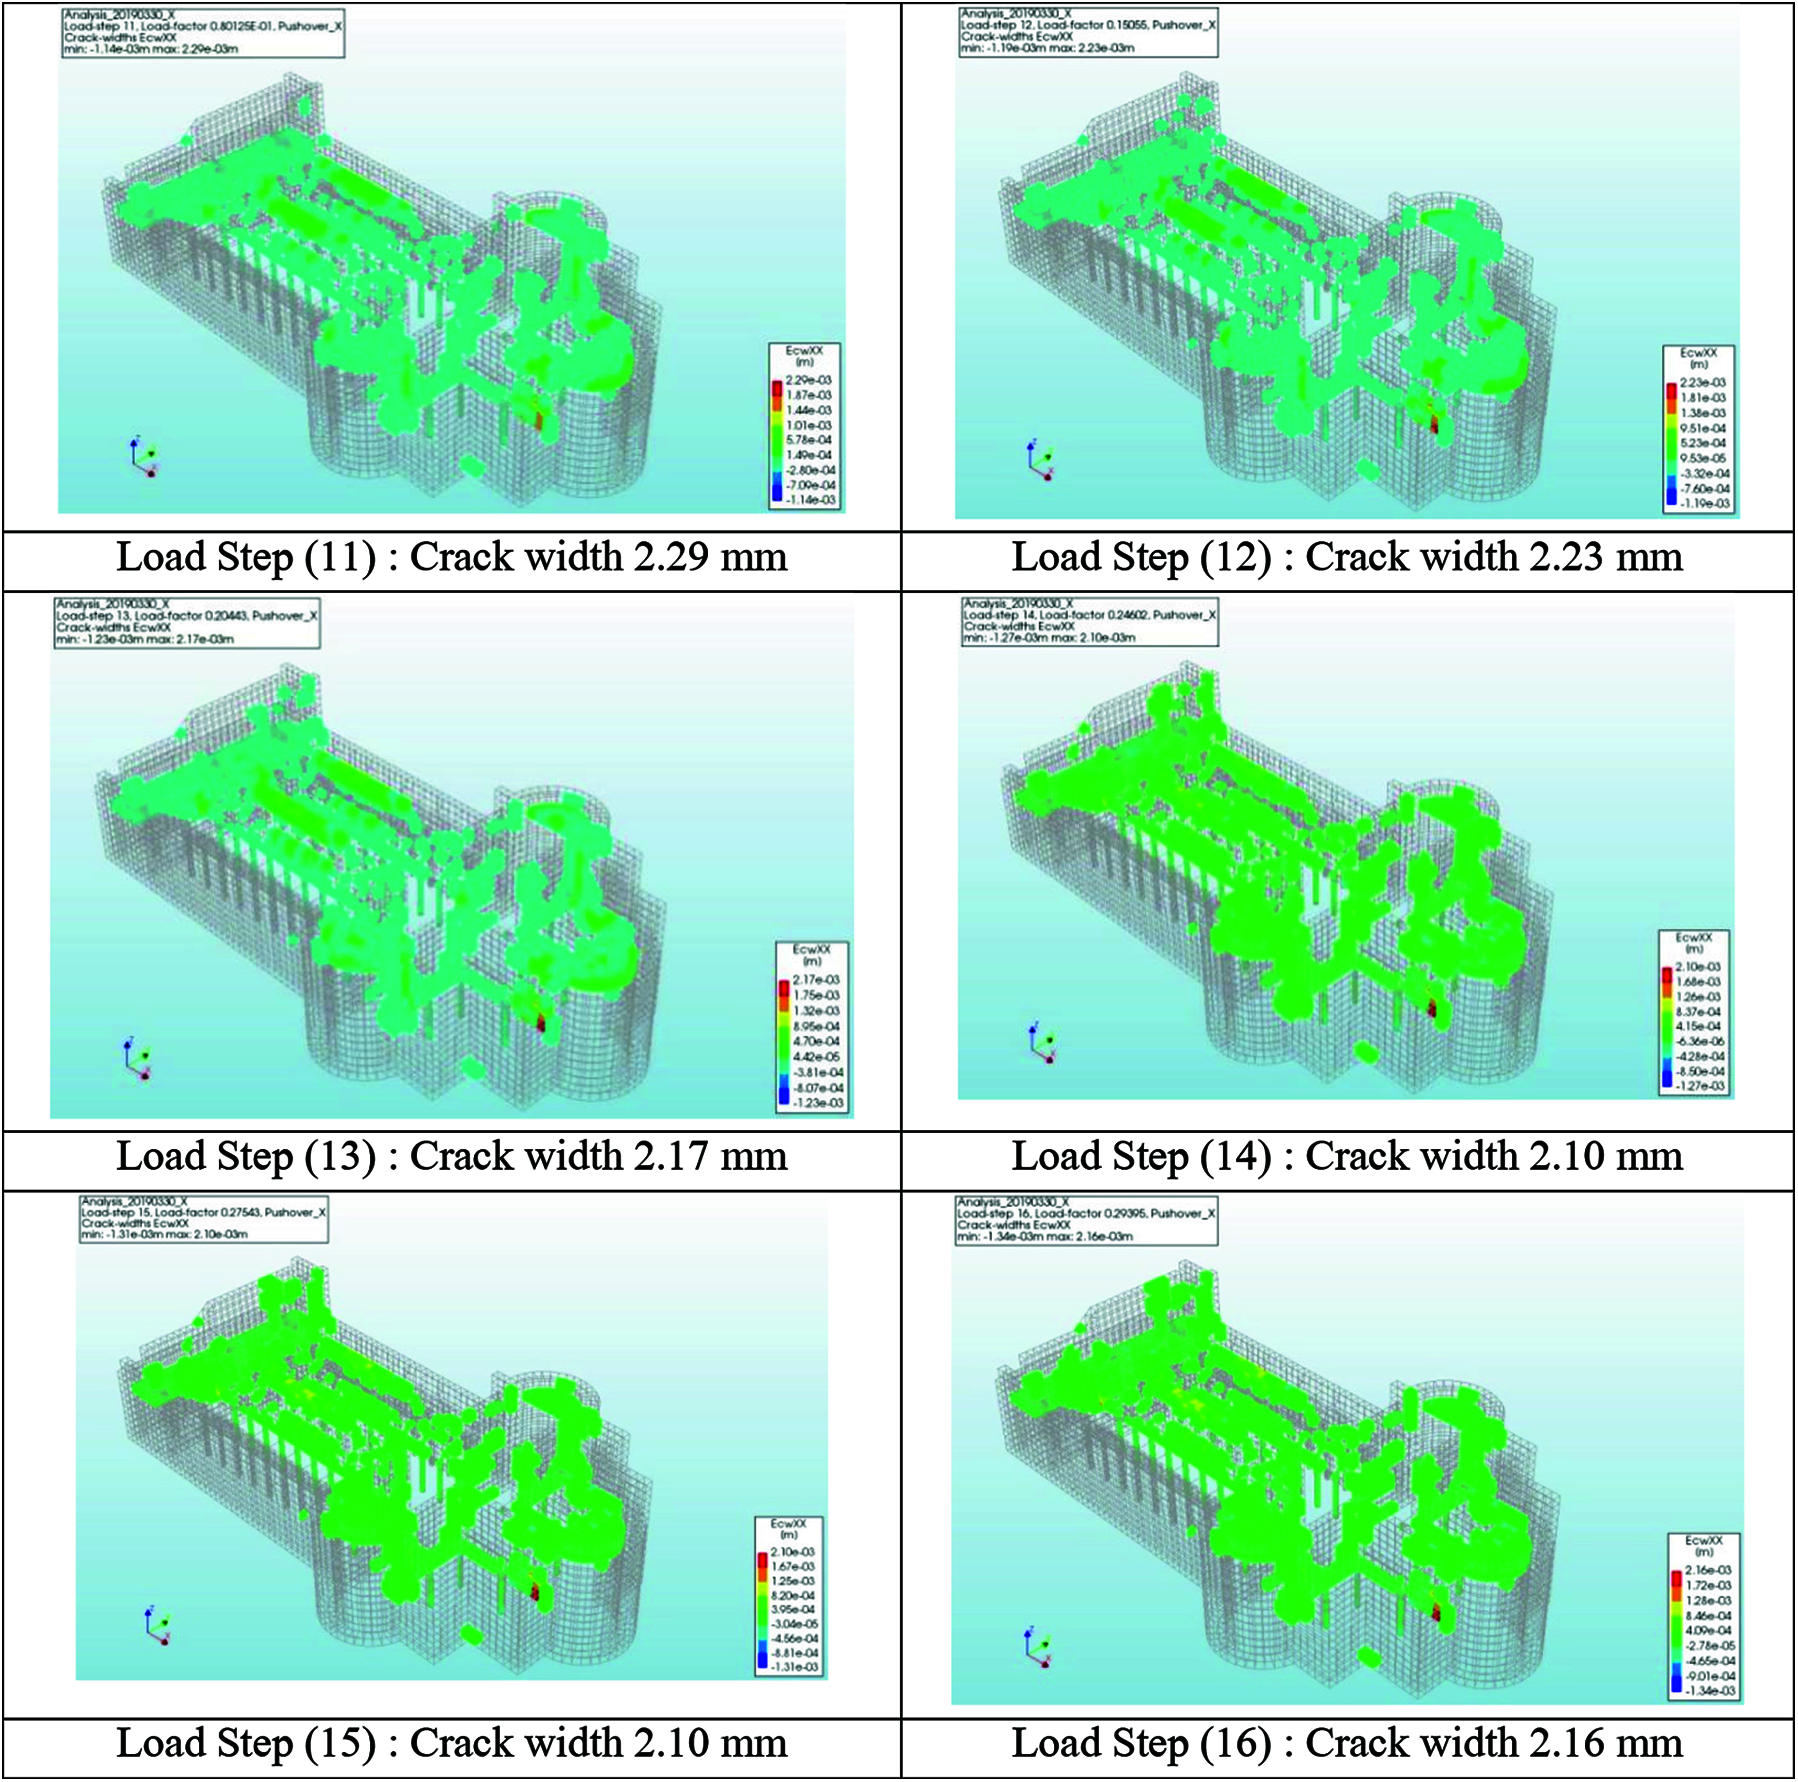
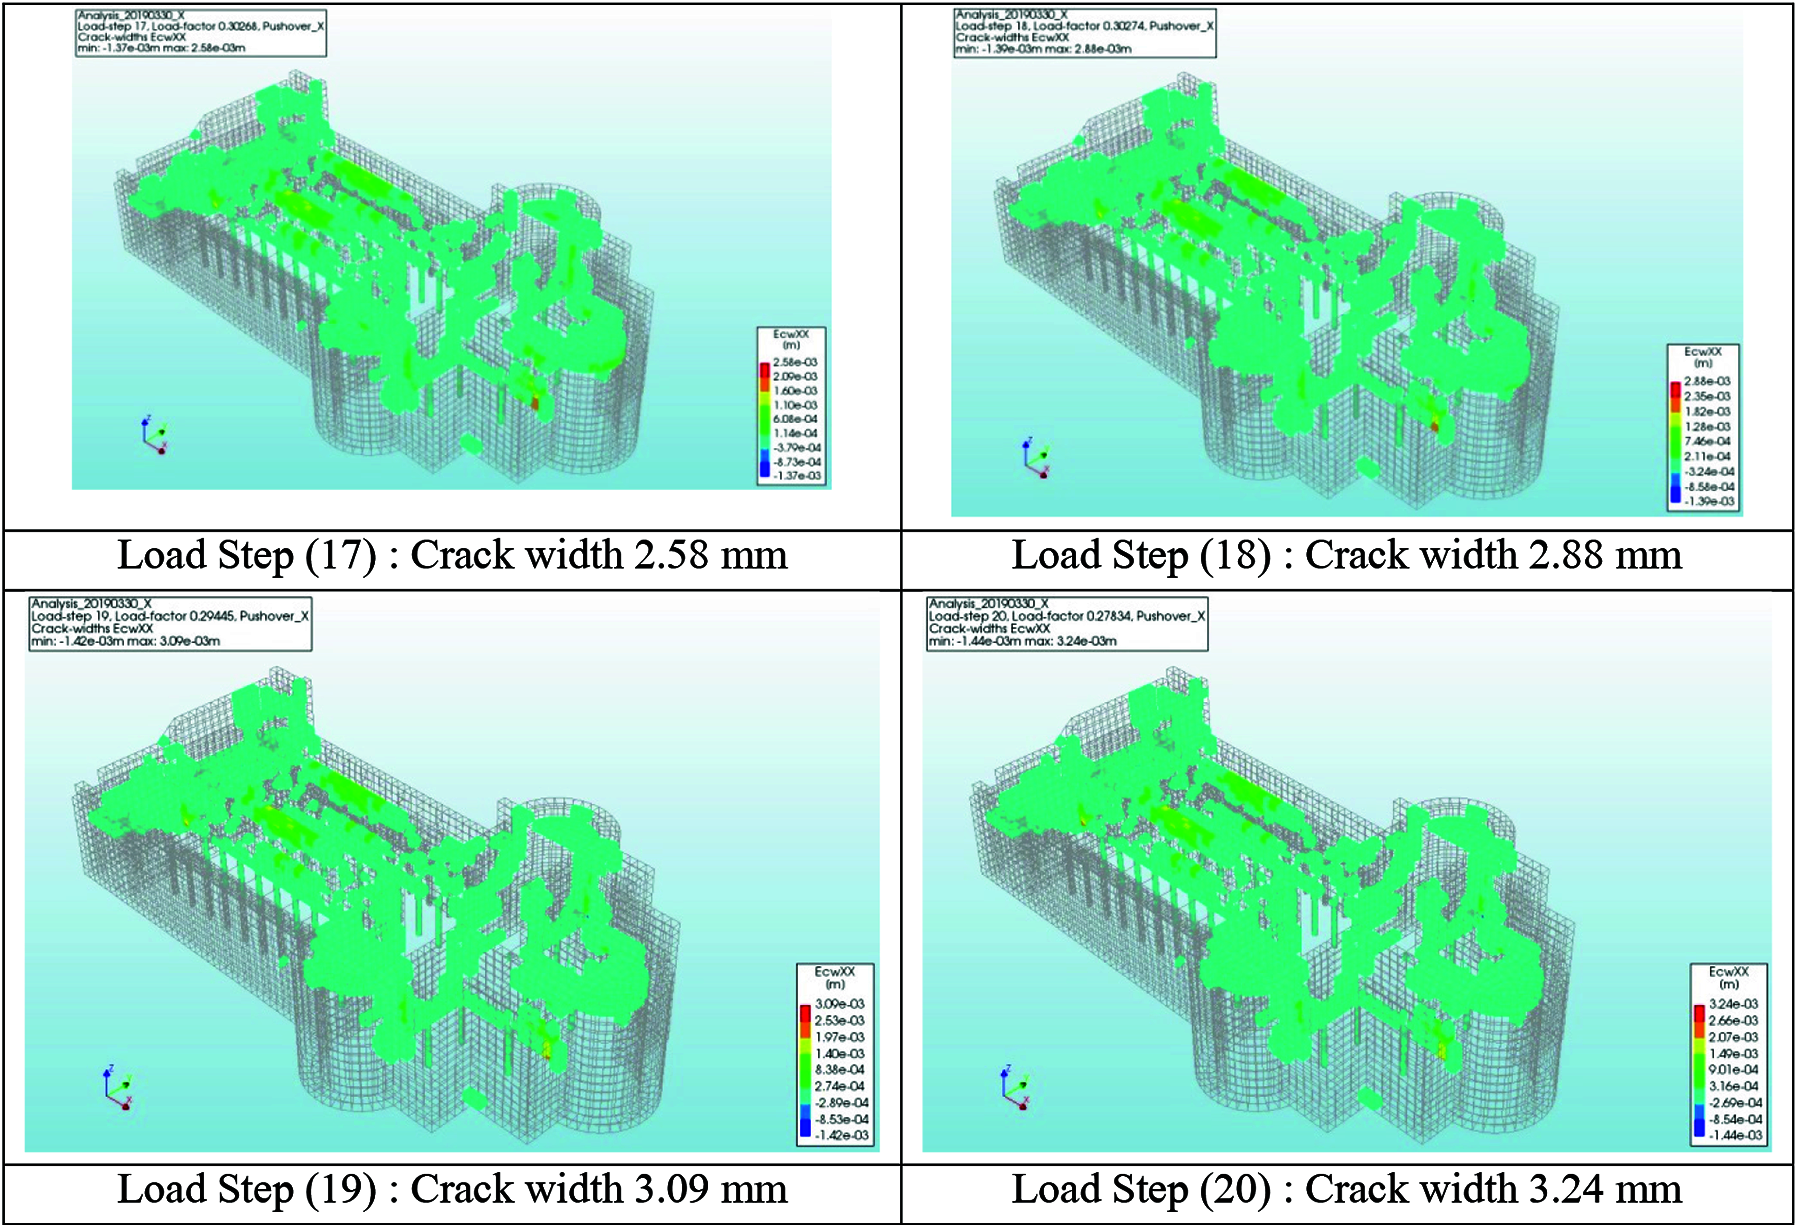
Figure 9: Crack widths generated by pushover analysis in X-direction. Load Step (11): Crack width 2.29 mm Load Step (12): Crack width 2.23 mm Load Step (13): Crack width 2.17 mm Load Step (14): Crack width 2.10 mm Load Step (15): Crack width 2.10 mm Load Step (16): Crack width 2.16 mm Load Step (17): Crack width 2.58 mm Load Step (18): Crack width 2.88 mm Load Step (19): Crack width 3.09 mm Load Step (20): Crack width 3.24 mm
In the other direction Y, the damage propagation generated as a result of gravity load is symmetrical around the longitudinal east-west axis as shown in Fig. 10. Most cracks are situated above the narthex vaults, the apses vault also propagates in the bottom parts of the lateral walls of the nave and shoulders of the church (premier walls). Generally, the structure presented a global damage behavior in the Y-direction, without evident damage causing localized failures, the counters of Fig. 10 also show the values of cracks in some locations with reference to the load steps for the self-load, it is obvious that the cracks reached a maximum value of 4.94 mm in the vaults of the narthex, and the apses.
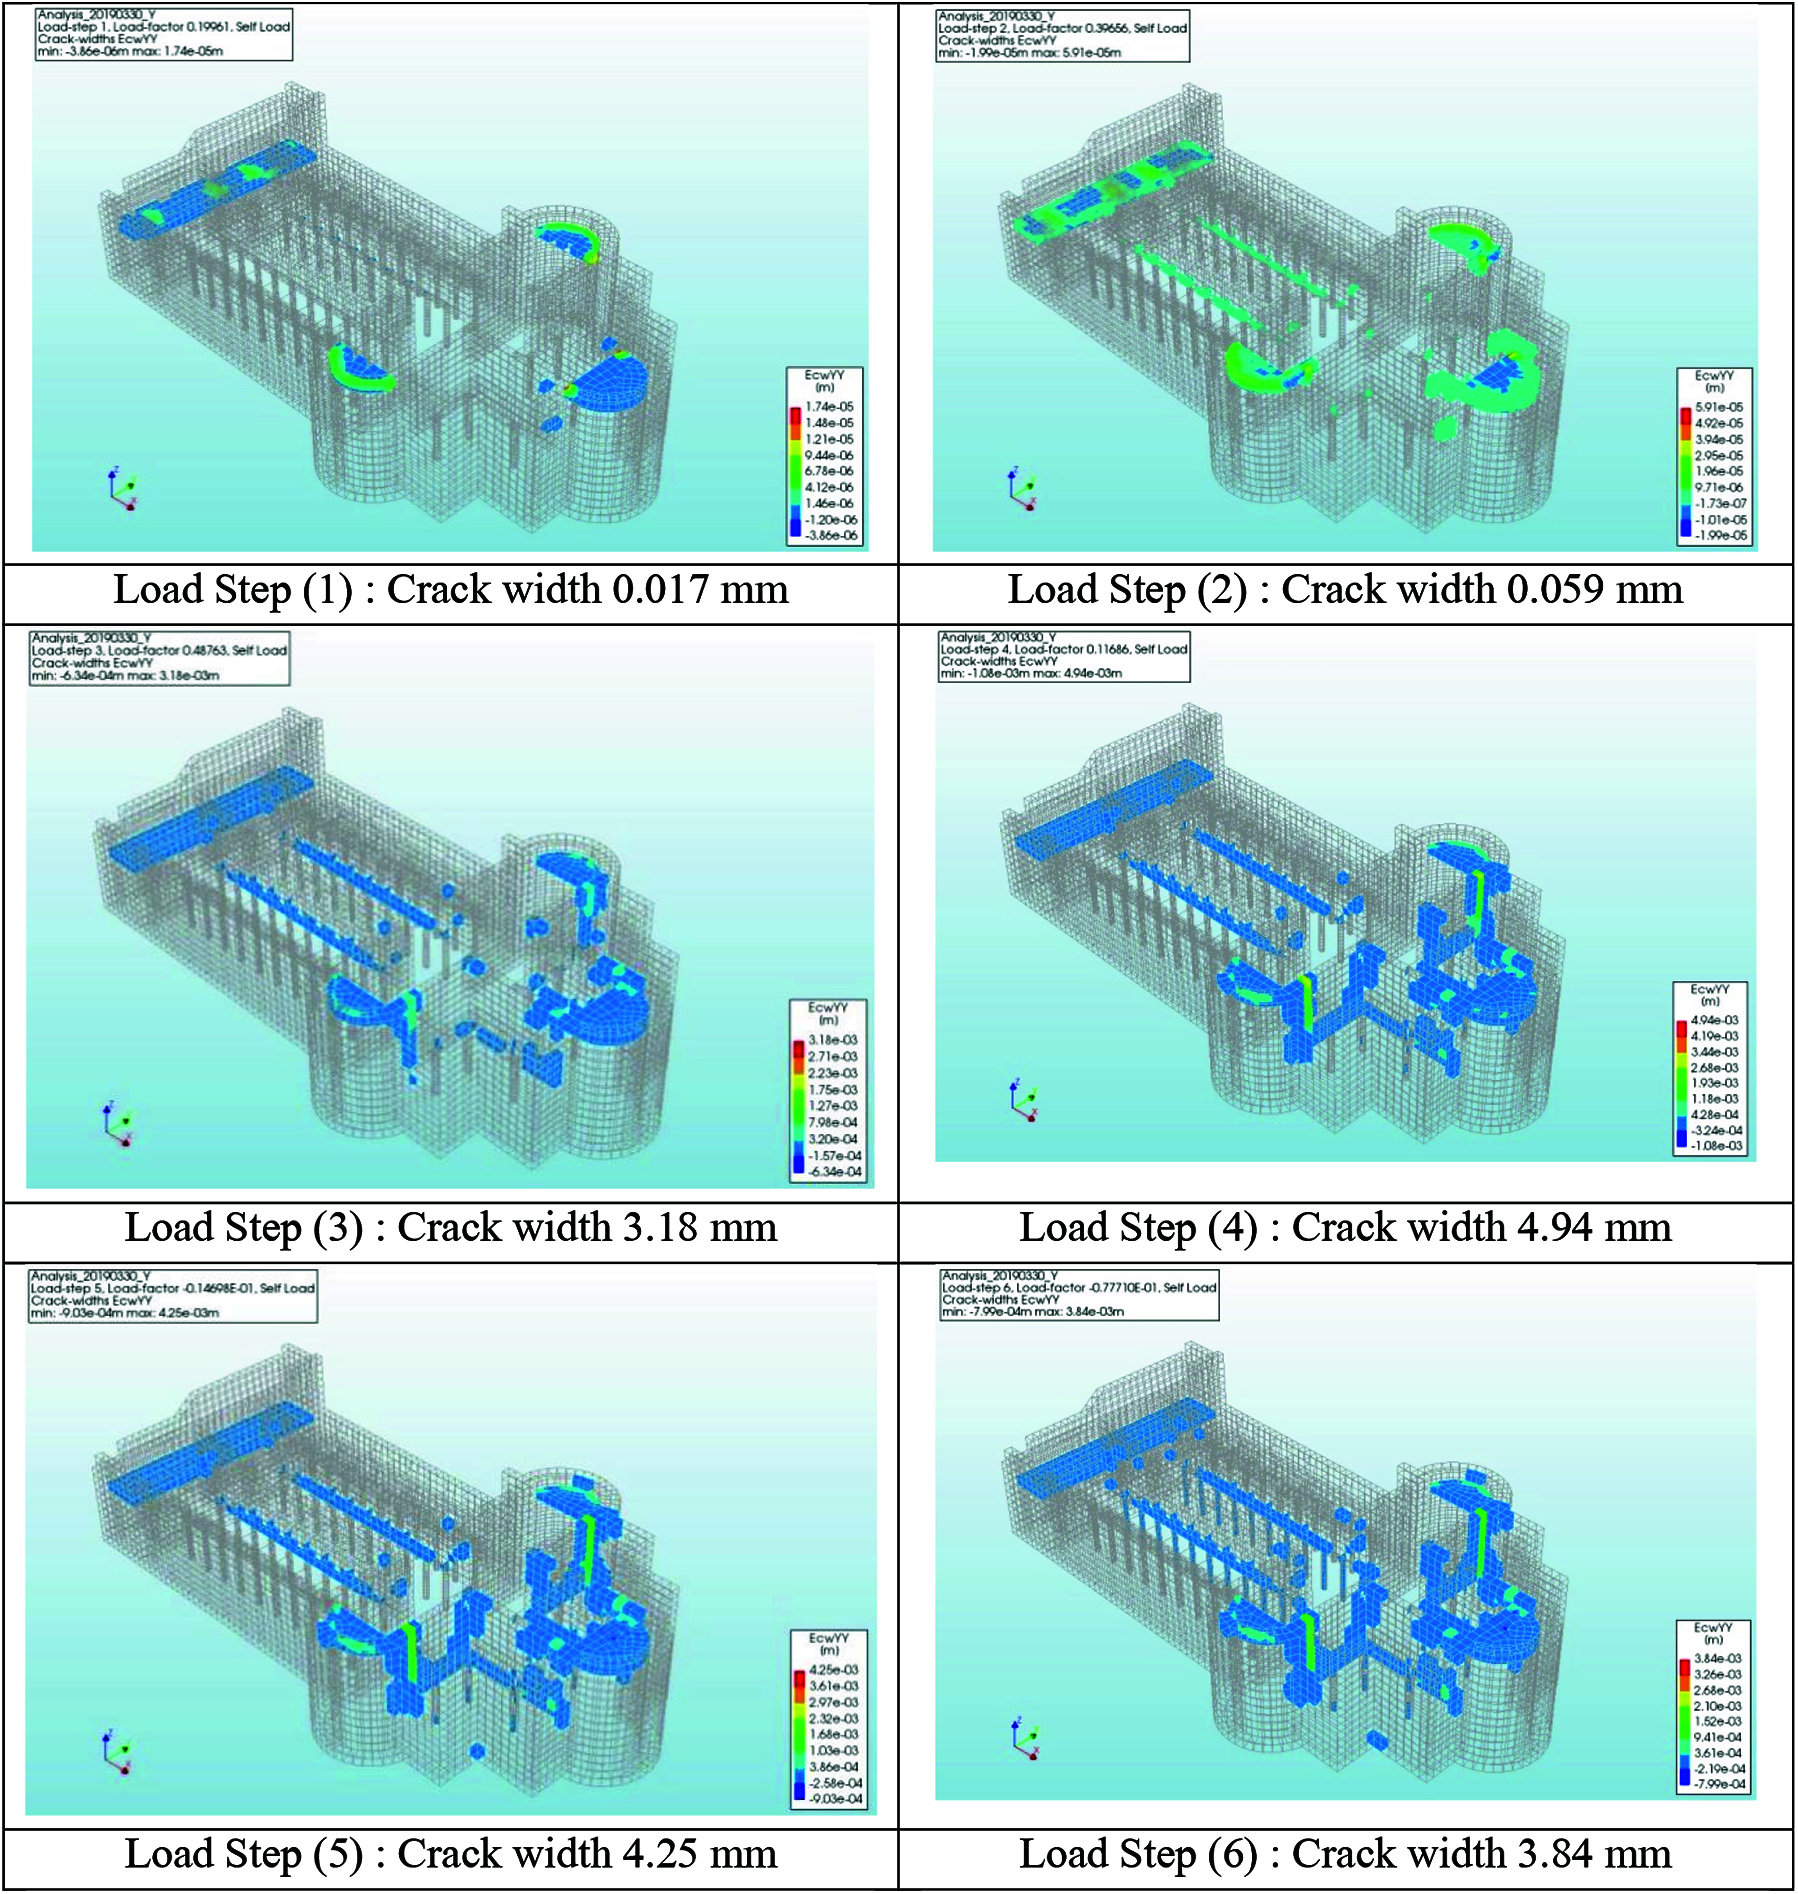
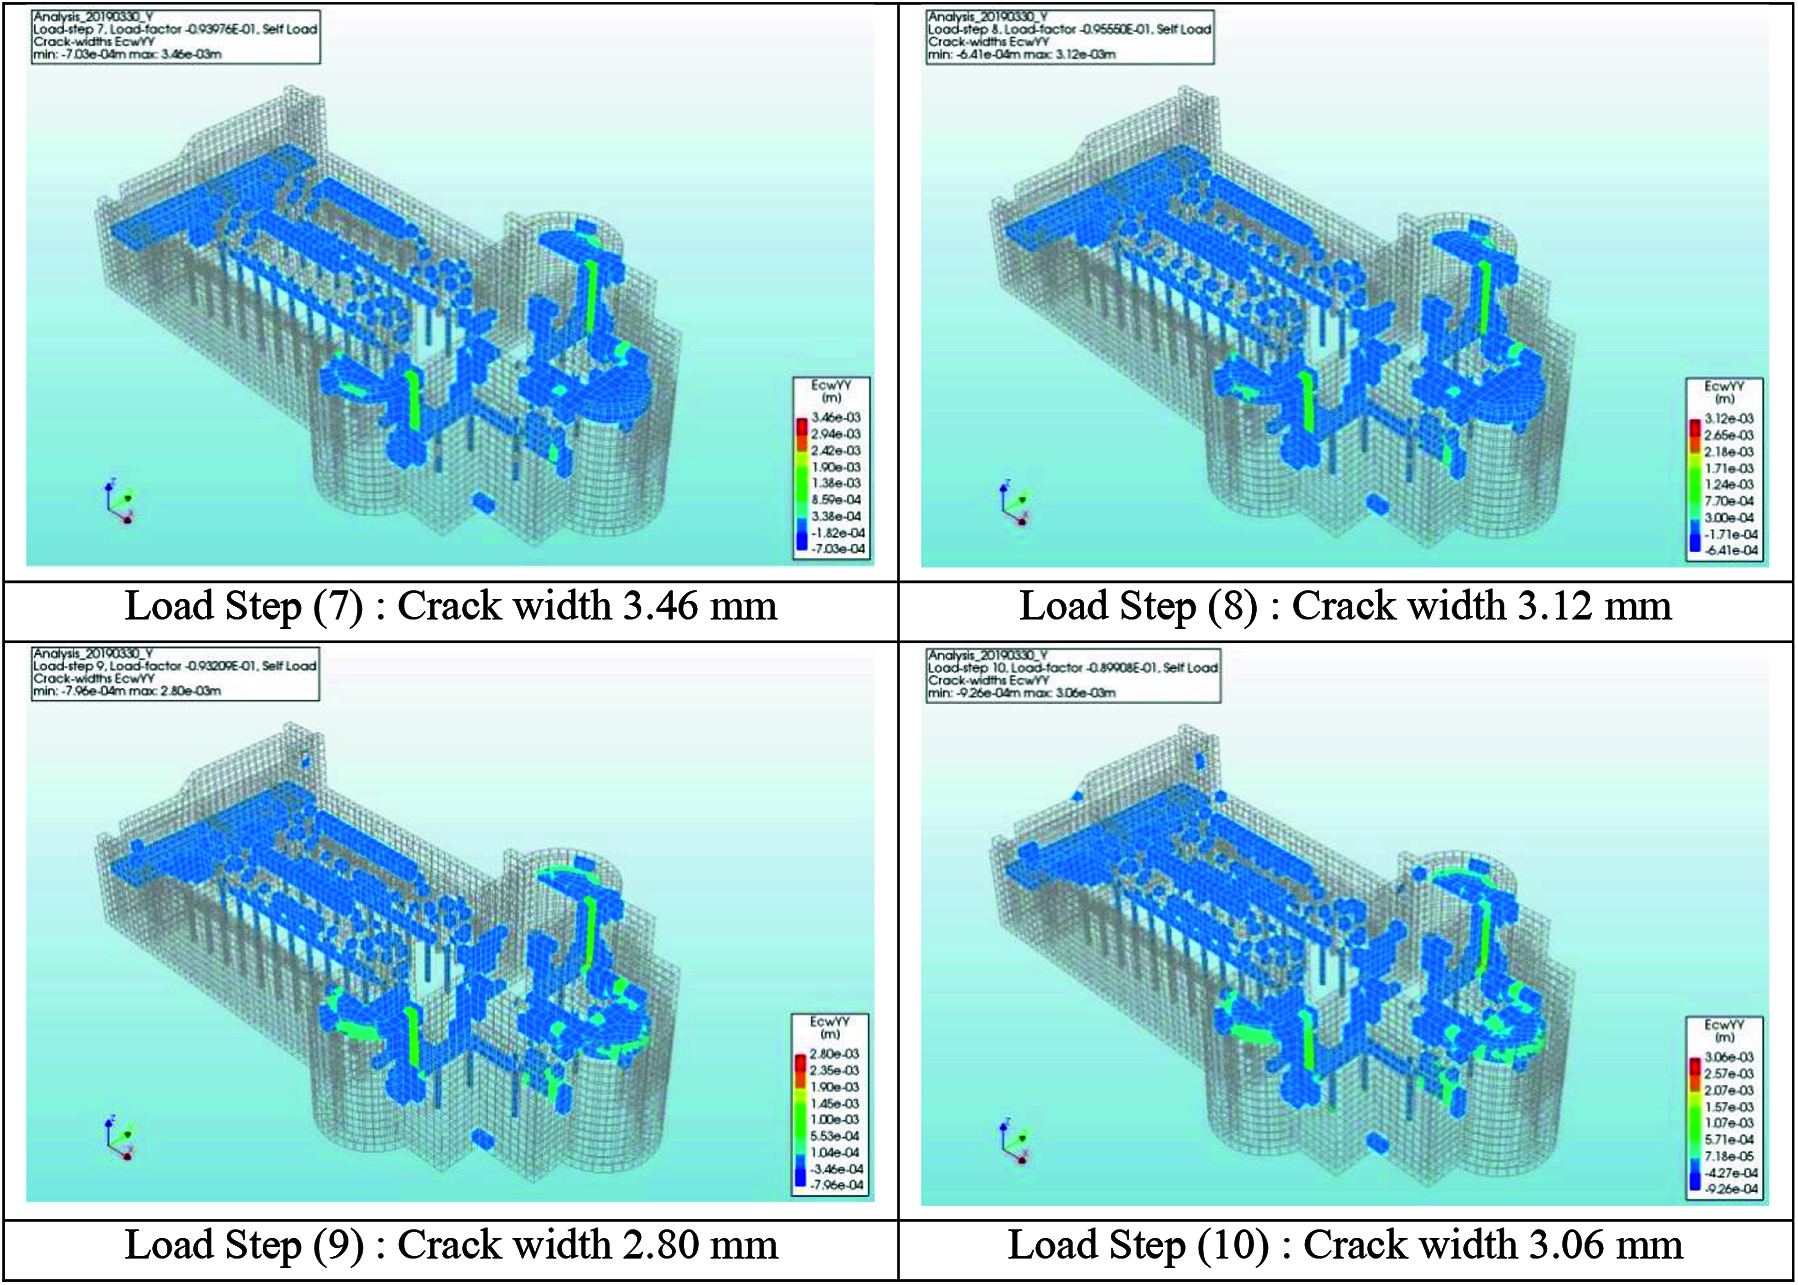
Figure 10: Crack widths generated by gravity loads analysis in Y-direction. Load Step (1): Crack width 0.017 mm Load Step (2): Crack width 0.059 mm Load Step (3): Crack width 3.18 mm Load Step (4): Crack width 4.94 mm Load Step (5): Crack width 4.25 mm Load Step (6): Crack width 3.84 mm Load Step (7): Crack width 3.46 mm Load Step (8): Crack width 3.12 mm Load Step (9): Crack width 2.80 mm Load Step (10): Crack width 3.06 mm
One of the benefits of using the pushover analysis tool, the out-of-plane behavior, can also be investigated. It is rather difficult to suggest detailed or realistic out-of-plane mechanisms, but the excitations of lateral loads, verified and shown in Fig. 11, the enlargement of the widths and locations of the cracks are presented, which reach a maximum width of 13.7 mm.
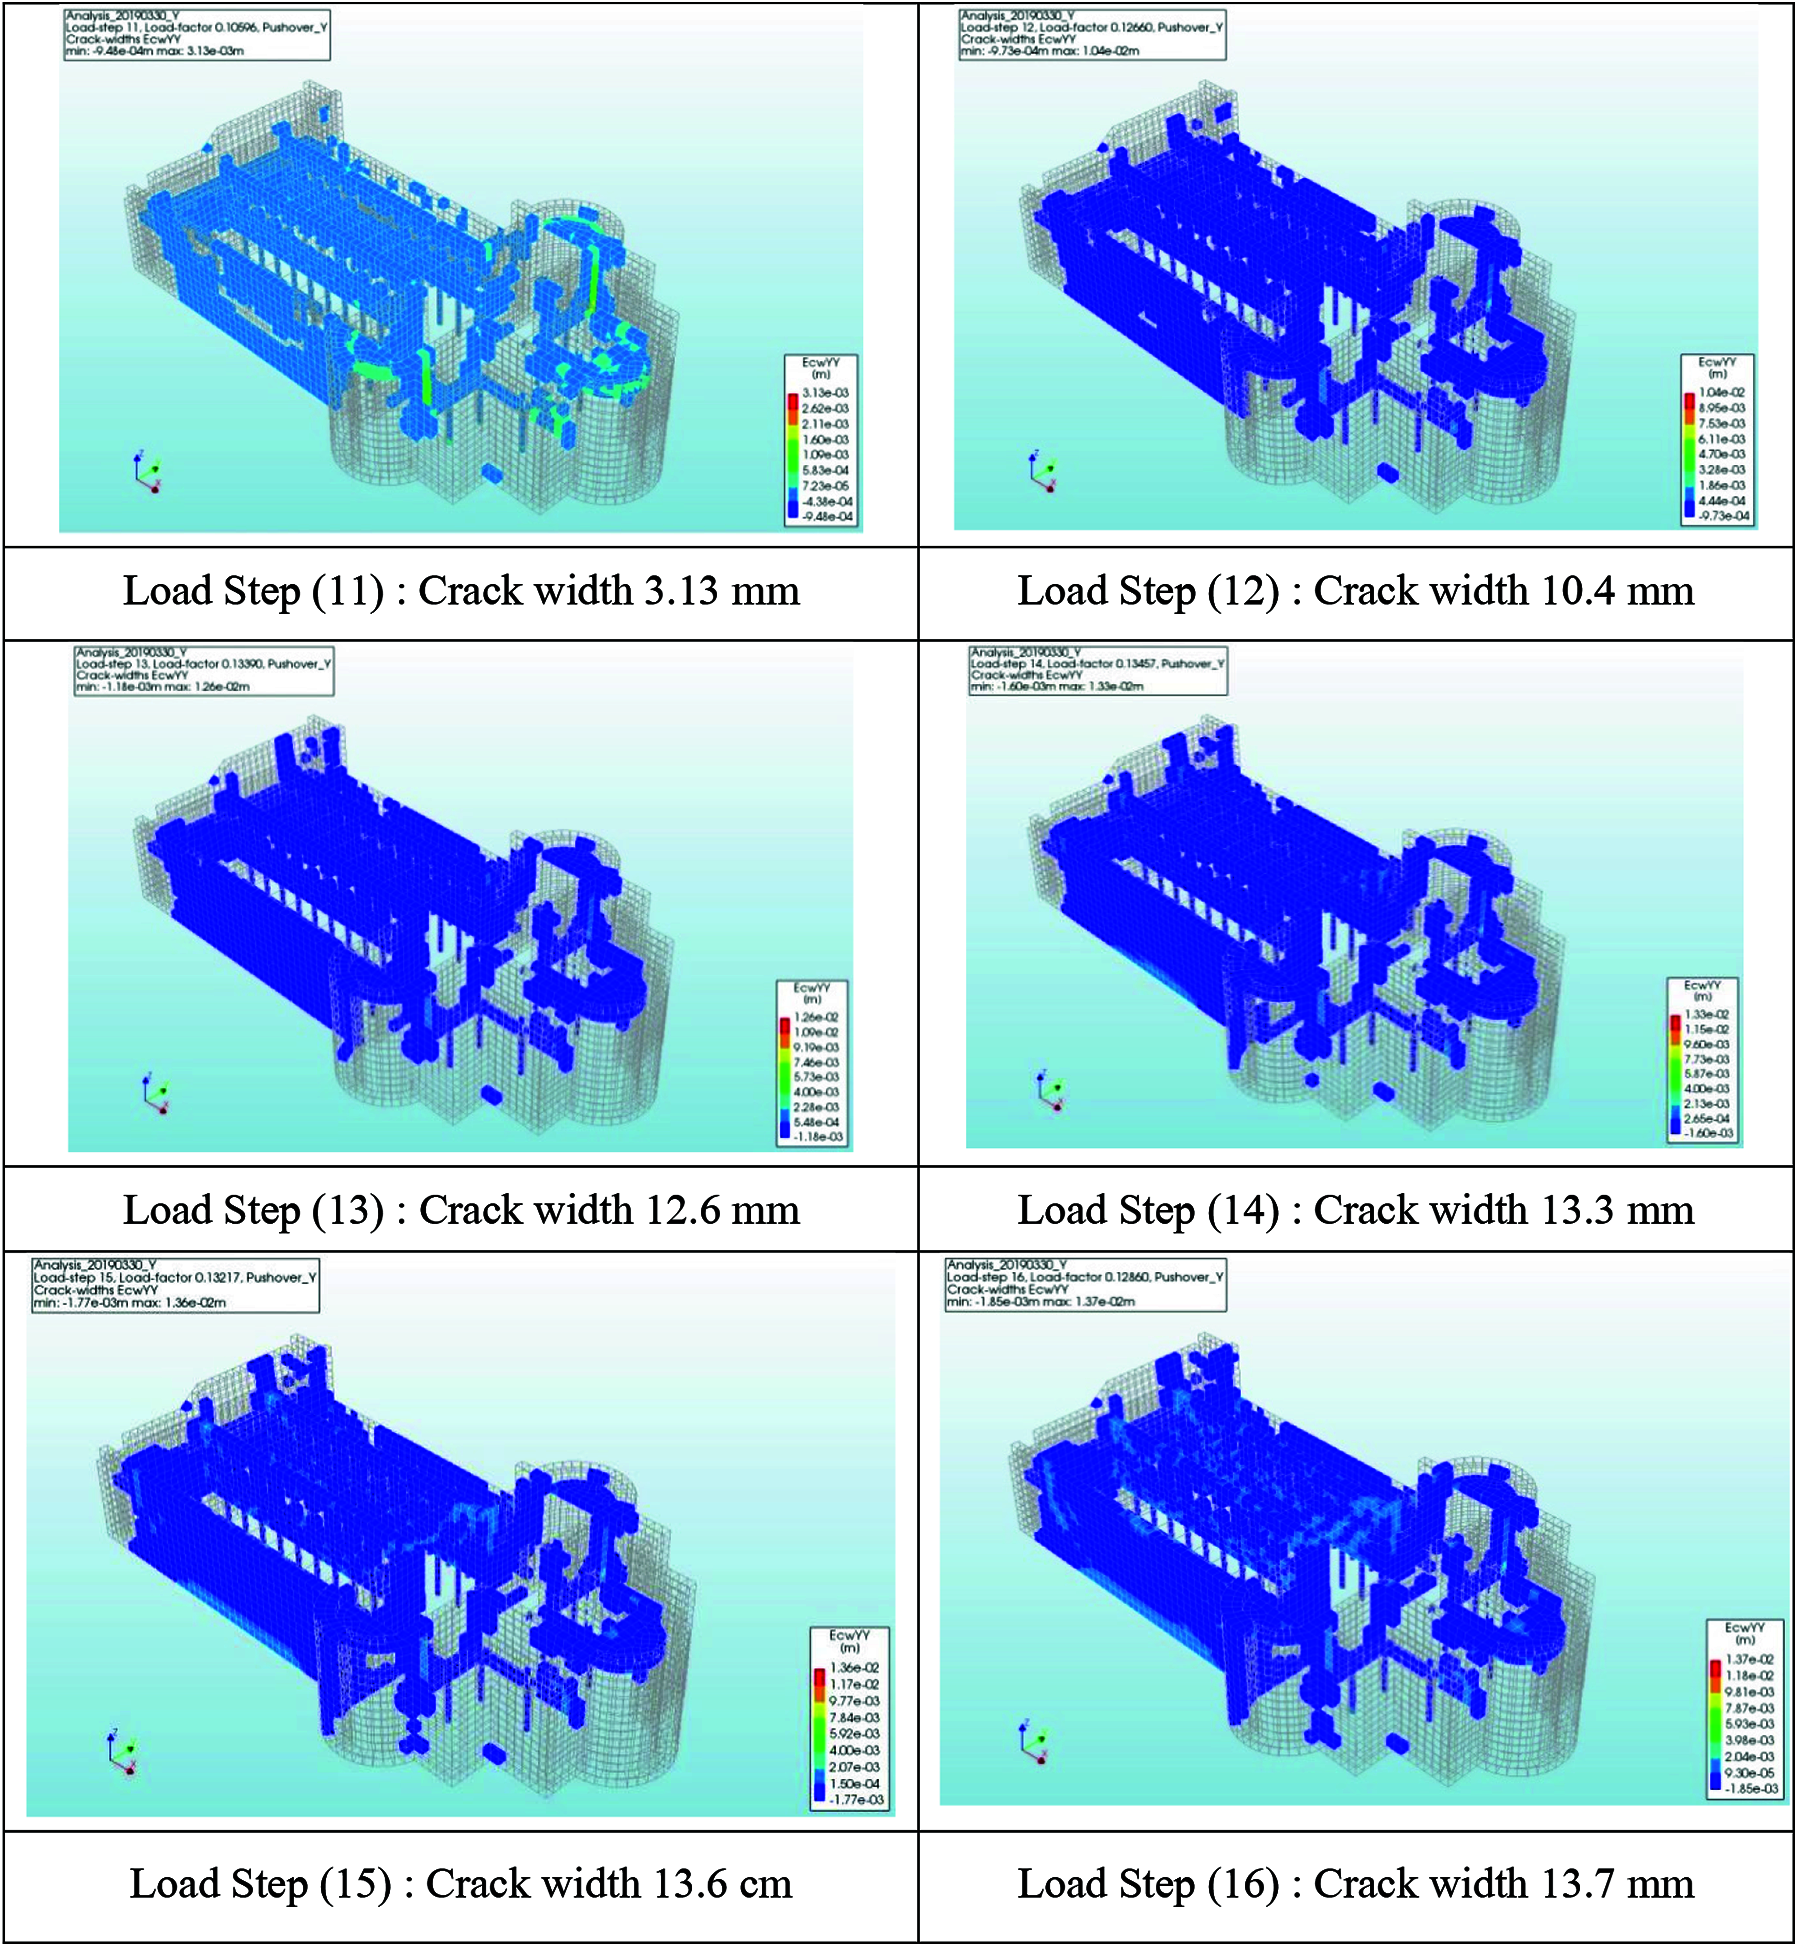
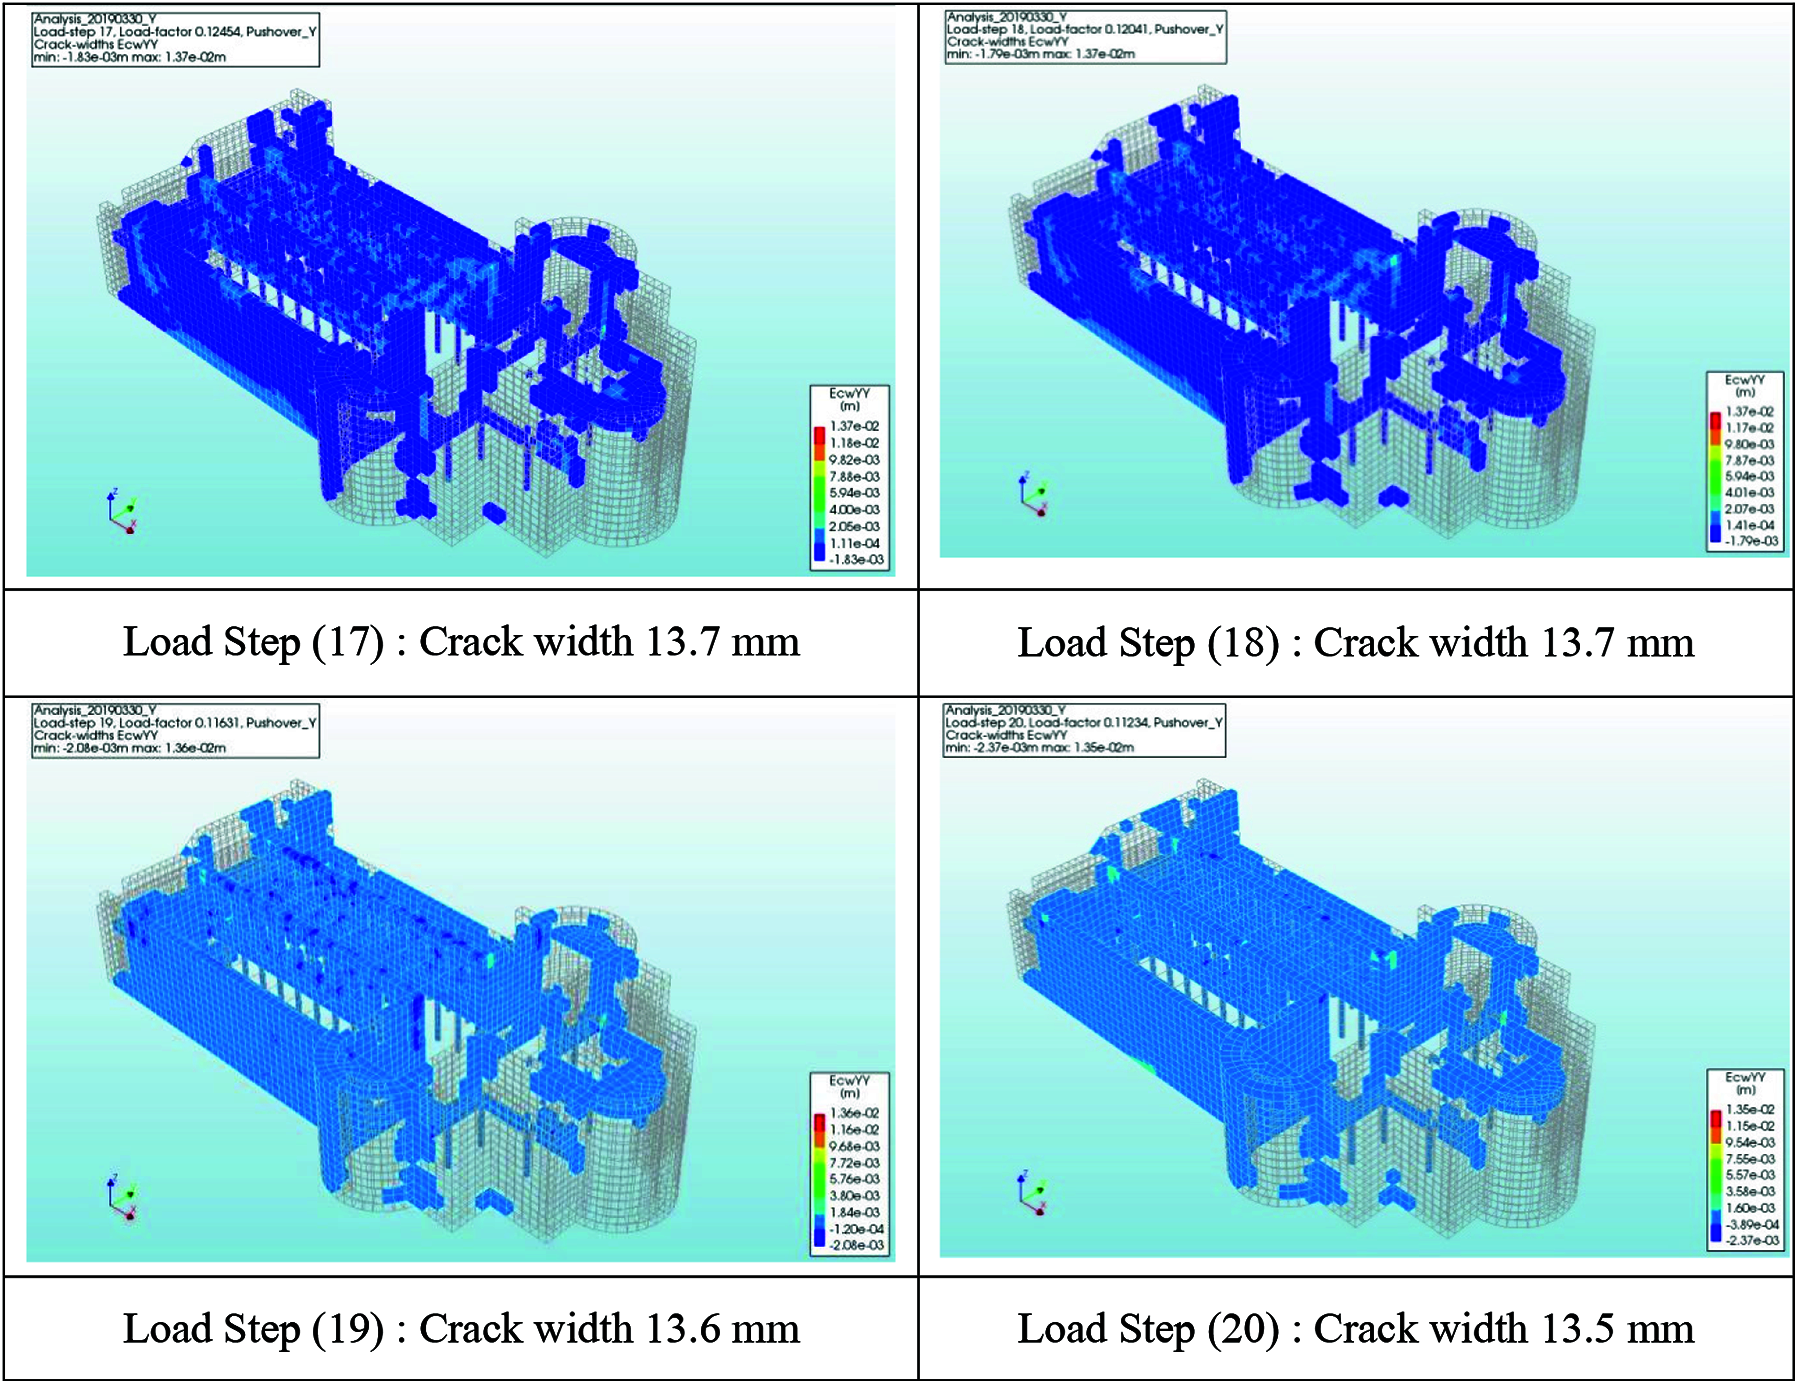
Figure 11: Crack widths generated by pushover analysis in Y-direction. Load Step (11): Crack width 3.13 mm Load Step (12): Crack width 10.4 mm Load Step (13): Crack width 12.6 mm Load Step (14): Crack width 13.3 mm Load Step (15): Crack width 13.6 cm Load Step (16): Crack width 13.7 mm Load Step (17): Crack width 13.7 mm Load Step (18): Crack width 13.7 mm Load Step (19): Crack width 13.6 mm Load Step (20): Crack width 13.5 mm
The out-of-plane movement is the most dangerous in this case, the vertical cracks on the connection between frontal and lateral facades indicate the activation of the façade overturning and the formation of hinges. The main structural causes of this mechanism are the weak connection with the orthogonal walls (90° walls), poor masonry quality, no box behavior, and the absence of links on the top, these results allow the researchers to verify the possibility of collapse caused by the plasticization of the material.
The pushover analysis results showed two types of local mechanisms in the Nativity Church, in-plane direction, and out-of-plane direction. The first type of mechanism has more stiffness than the second one, from Fig. 12, which presents the comparison between the maximum crack propagation in each direction concerning the load step, the maximum crack width generated in X-direction approximately remains slightly small with a modest difference, this is evident by examining the points before the Load Step (10), which refer to gravity loads excitations, and after Load Step (10) which refer to the pushover excitations. For example, the Load Step (9), has a crack width of 2.40 mm, and for the Load Step (11), the crack width was 2.29 mm, which means that the difference was 5%.
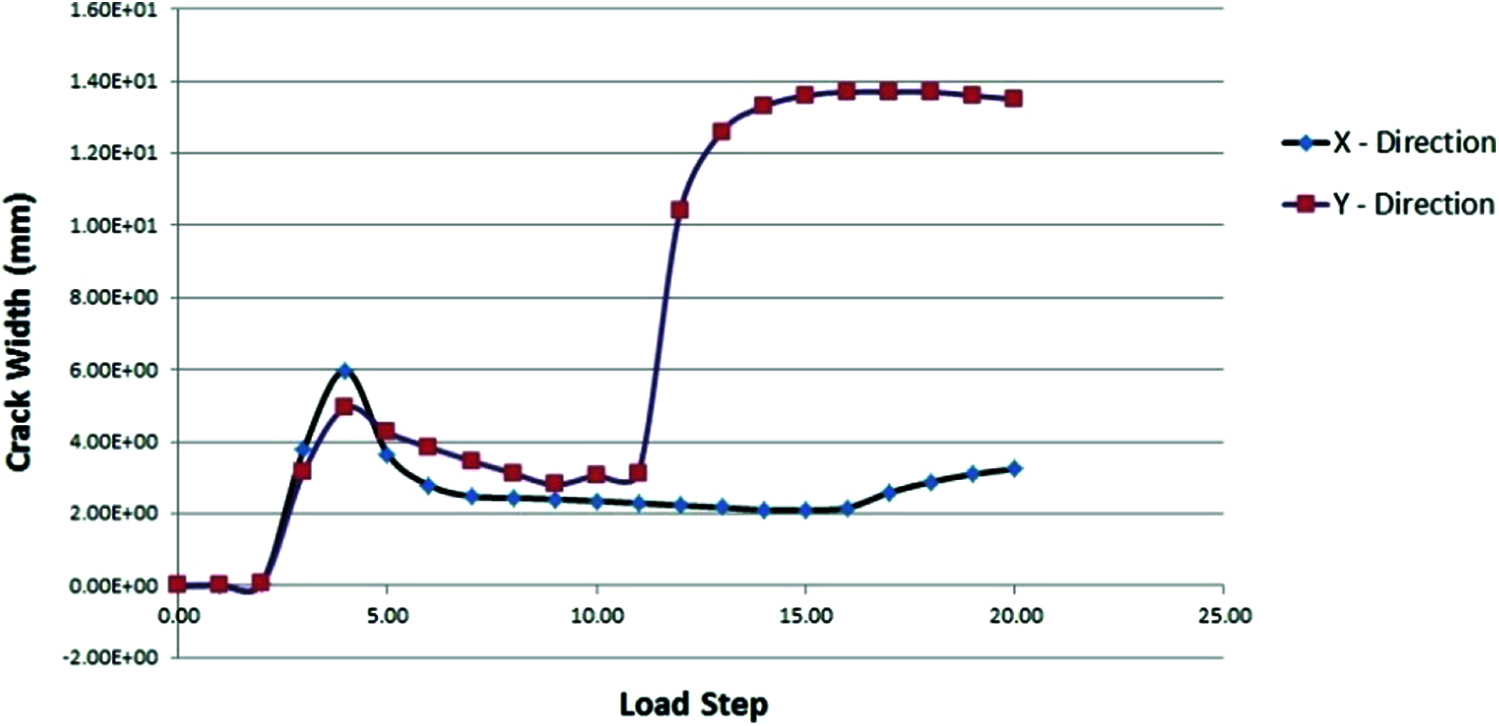
Figure 12: Maximum crack propagation in each direction with respect to load step
Alessandri et al. [26] found that it is obvious that crack propagation is reliable in the investigation of the historical masonry structures, as not only the bandwidth of cracks is checked, but also the length of cracks can be checked and investigated, and give a good indication of what will happen for seismic loads. On another hand, the out-of-plane stiffness of the church is lower than in-plane stiffness, the Y-direction was more deformed and had a larger crack width, numerically, the maximum crack width before Load Step (10), i.e., Load Step (9) was 2.80 mm, and after the Load Step (10), i.e., Load Step (12), was 10.40 mm. Fig. 12 also presents the jump between the two directions.
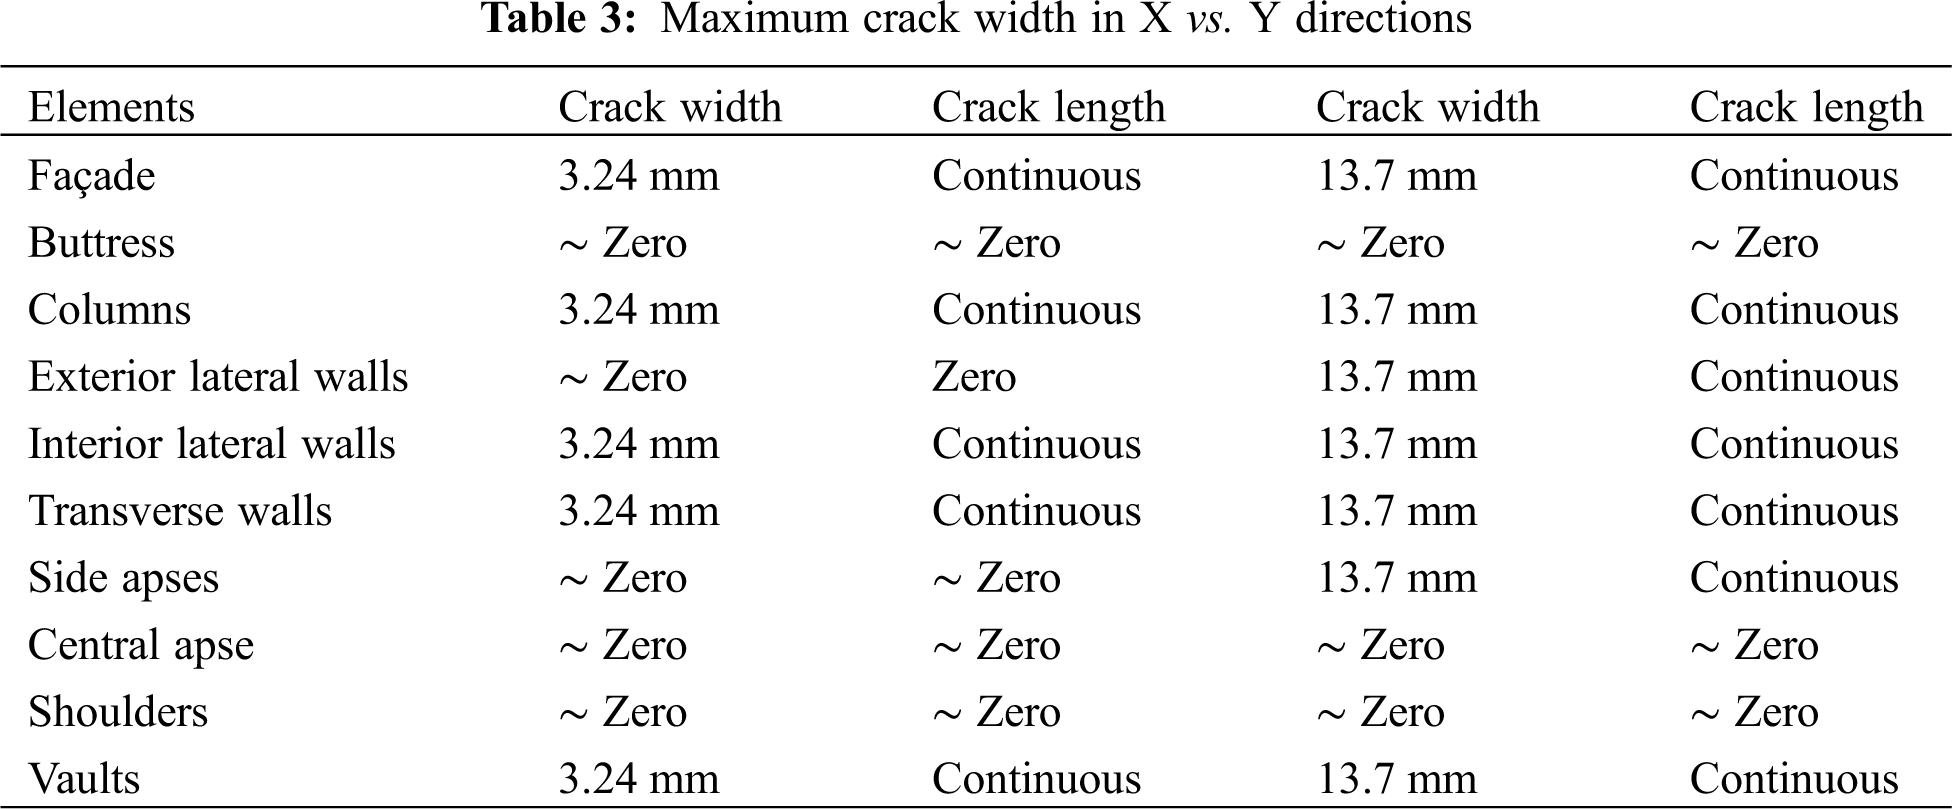
To determine the limit state, and according to the IBC 2015–(2109.3.1.4) “The Shrinkage cracks in adobe units shall not contain more than three shrinkage cracks and any single shrinkage crack shall not exceed 3 inches (76 mm) in length or 1/8 inch (3.2 mm) in width”. The researchers decided to make the limit state of (the values larger than shrinkage cracks are critical and must be given high attention and good treatment), the decision will be that; crack propagations indicates there is a large problem in out-of-plane direction (Y-direction), but still at the upper limit in the in-plane direction (X-direction), in more details, Y-direction, exceeds the limits in width and length with a maximum width of 13.7 mm (approximately more than 400% of the values considered in the IBC 2015 as shrinkage crack), also in length of cracks, they are continues with each other (no specified length). Otherwise, X-direction is failed in length but still at most width, with no ignoring to the problem of a lot of cracks. Table 3 summarizes the results of crack details for each structural element of the church.
A numerical simulation procedure employing pushover analysis predicting the seismic behavior of the nativity church has been proposed in this study, the crack propagation was observed in both X and Y directions, and the following points can be concluded:
• The results showed that the masonry building is subjected to partial collapses in many locations during nonlinear static monotonic load, due to the loss of equilibrium of masonry portions and enlargement of crack widths.
• The pushover analysis showed that the seismic performance of the Nativity church was dependent on its critical transversal Y-direction, it had more deformation and larger crack width than in X-direction.
• The out-of-plane movement (Y-direction) is the most dangerous case, the vertical cracks on the connection between frontal and lateral facades indicate the activation of the façade overturning and the formation of hinges.
• Crack width was at the upper limit in the in-plane direction (X-direction). While, in Y-direction, it exceeded the limits of IBC code in width and length with a maximum width of 13.7 mm.
• The modal analysis indicated frequencies ranging from 1.82 to 5.56 Hz of the first eight modes of vibration for the structure. These modes possess cumulative mass participation above 70% in both orthogonal directions (X and Y directions). The comparison of the numerical frequencies and mode shapes, made for the first eight modes of vibration, resulted in a significant variation of the frequencies with a maximum error of 11.23%.
• A nonlinear dynamic analysis is recommended in the near future for the Nativity church, which takes into account the materials nonlinearity.
Funding Statement: The authors received no specific funding for this study.
Conflicts of Interest: The authors declare that they have no conflicts of interest to report regarding the present study.
1. Lagomarsino, S. (2006). On the vulnerability assessment of monumental buildings. Bulletin of Earthquake Engineering, 4(4), 445–463. DOI 10.1007/s10518-006-9025-y. [Google Scholar] [CrossRef]
2. Betti, M., Vignoli, A. (2008). Assessment of seismic resistance of a basilica-type church under earthquake loading: Modelling and analysis. Advances in Engineering Software, 39(4), 258–283. DOI 10.1016/j.advengsoft.2007.01.004. [Google Scholar] [CrossRef]
3. Lourenço, P. B. (2002). Computations on historic masonry structures. Progress in Structural Engineering and Materials, 4(3), 301–319. DOI 10.1002/pse.120. [Google Scholar] [CrossRef]
4. Lourenço, P. B., Mendes, N., Ramos, L. F., Oliveira, D. V. (2011). Analysis of masonry structures without box behavior. International Journal of Architectural Heritage, 5(4–5), 369–382. DOI 10.1080/15583058.2010.528824. [Google Scholar] [CrossRef]
5. Dogangun, A., Sezen, H. (2012). Seismic vulnerability and preservation of historical masonry monumental structures. Earthquake and Structures, 3(1), 83–95. DOI 10.12989/eas.2012.3.1.083. [Google Scholar] [CrossRef]
6. Hadzima-Nyarko, M., Pavić, G., Lešić, M. (2016). Seismic vulnerability of old confined masonry buildings in Osijek, Croatia. Earthquakes and Structures, 11(4), 629–648. DOI 10.12989/eas.2016.11.4.629. [Google Scholar] [CrossRef]
7. Karantoni, F., Tsionis, G., Lyrantzaki, F., Fardis, M. N. (2014). Seismic fragility of regular masonry buildings for in-plane and out-of-plane failure. Earthquakes and Structures, 6(6), 689–713. DOI 10.12989/eas.2014.6.6.689. [Google Scholar] [CrossRef]
8. Ranjbaran, F., Hosseini, M. (2014). Seismic vulnerability assessment of confined masonry wall buildings. Earthquakes and Structures, 7(2), 201–216. DOI 10.12989/eas.2014.7.2.201. [Google Scholar] [CrossRef]
9. Fajfar, P. (2000). A nonlinear analysis method for performance-based seismic design. Earthquake Spectra, 16(3), 573–592. DOI 10.1193/1.1586128. [Google Scholar] [CrossRef]
10. Magenes, G. (2000). A method for pushover analysis in seismic assessment of masonry buildings. Proceedings of the 12th World Conference on Earthquake Engineering, vol. 42. Upper Hutt, New Zealand Society for Earthquake Engineering. [Google Scholar]
11. Reyes, J. C., Chopra, A. K. (2012). Modal pushover-based scaling of two components of ground motion records for nonlinear RHA of structures. Earthquake Spectra, 28(3), 1243–1267. DOI 10.1193/1.4000069. [Google Scholar] [CrossRef]
12. Milani, G., Valente, M. (2015). Comparative pushover and limit analyses on seven masonry churches damaged by the 2012 emilia-romagna (Italy) seismic events: Possibilities of non-linear finite elements compared with pre-assigned failure mechanisms. Engineering Failure Analysis, 47, 129–161. DOI 10.1016/j.engfailanal.2014.09.016. [Google Scholar] [CrossRef]
13. Milani, G., Valente, M. (2015). Failure analysis of seven masonry churches severely damaged during the 2012 emilia-romagna (Italy) earthquake: Non-linear dynamic analyses vs. conventional static approaches. Engineering Failure Analysis, 54, 13–56. DOI 10.1016/j.engfailanal.2015.03.016. [Google Scholar] [CrossRef]
14. Lagomarsino, S., Podestà, S. (1999). Metodologie per l’analisi di vulnerabilità delle chiese. Atti del. 1999;9. [Google Scholar]
15. Lourenço, P. B., Roque, J. C. A., Oliveira, D. V. (2012). Seismic safety assessment of the church of monastery of Jeronimos, Portugal. [Google Scholar]
16. Kalkbrenner, P., Pelà, L., Sandoval, C. (2019). Multi directional pushover analysis of irregular masonry buildings without box behavior. Engineering Structures, 201, 109534. DOI 10.1016/j.engstruct.2019.109534. [Google Scholar] [CrossRef]
17. Karantoni, F. V. (2013). Seismic retrofitting of fragavilla monastery. Earthquakes and Structures, 5(2), 207–223. DOI 10.12989/eas.2013.5.2.207. [Google Scholar] [CrossRef]
18. Karim, M. (2019). Explorative nonlinear pushover analyses for historical unreinforced masonry churches: A case study in Zandeweer. Groningen. [Google Scholar]
19. Moratti, M., Gaia, F., Martini, S., Tsioli, C., Grecchi, G. et al. (2019). A methodology for the seismic multilevel assessment of unreinforced masonry church inventories in the Groningen area. Bulletin of Earthquake Engineering, 17(8),4625–50. DOI 10.1007/s10518-019-00575-7. [Google Scholar] [CrossRef]
20. Noel, M. F., Moreira, S., Briceño, C., López-Hurtado, E., Aguilar, R. (2019). Seismic assessment of the church of San Sebastian in Cusco, Peru by means of pushover nonlinear analysis. Structural Analysis of Historical Constructions, pp. 1462–1470. Springer, Cham, (Peru). [Google Scholar]
21. Ramírez, R., Mendes, N., Lourenço, P. B. (2019). Diagnosis and seismic behavior evaluation of the church of São miguel de refojos (Portugal). Buildings, 9(6), 138. DOI 10.3390/buildings9060138. [Google Scholar] [CrossRef]
22. Roque, J., Oliveira, D. V., Ferreira, T. M., Lourenço, P. B. (2019). Nonlinear dynamic analysis for safety assessment of heritage buildings: Church of santa maria de belém. Journal of Structural Engineering, 145(12), 4019153. DOI 10.1061/(ASCE)ST.1943-541X.0002437. [Google Scholar] [CrossRef]
23. Soulis, V., Manos, G. (2019). Numerical simulation and failure analysis of St. Konstantinos Church, after the Kozani earthquake. International Journal of Civil Engineering, 7(7), 949–967. DOI 10.1007/s40999-018-0345-5. [Google Scholar] [CrossRef]
24. Tezcan, S., Tambe, N., Muir, C., Aguilar, R., Perucchio, R. (2019). Nonlinear FE analysis of the response to lateral accelerations of the triumphal arch of the church of Andahuaylillas. Peru. Structural Analysis of Historical Constructions, pp. 1301–1309, Peru: Springer. [Google Scholar]
25. Tzanakis, M. J., Papagiannopoulos, G. A., Hatzigeorgiou, G. D. (2016). Seismic response and retrofitting proposals of the St. Titus Chruch, Heraklion, Crete, Greece. Earthquakes and Structures, 10(6), 1347–1367. DOI 10.12989/eas.2016.10.6.1347. [Google Scholar] [CrossRef]
26. Alessandri, C., Turrioni, J. (2018). The church of the nativity in Bethlehem: Analysis of a local structural consolidation. International Journal of Civil Engineering, 16(5), 457–474. [Google Scholar]
27. Touqan, A. R., Salawdeh, S. (2013). Major steps needed towards earthquake resistant design, pp. 1–24. [Google Scholar]
28. Shomali, Q. (2003). Church of the Nativity: History & Structure. In Citeseer. [Google Scholar]
29. Milani, G., Valente, M., Alessandri, C. (2016). Nativity church in bethlehem: Full 3D non-linear FE approach for structural damage prediction, pp. 5287–5300. Greece: National Technical University of Athens. [Google Scholar]
30. Palacio, K. (2013). Practical recommendations for nonlinear structural analysis in DIANA. TNO DIANA BV, Delft. [Google Scholar]
 | This work is licensed under a Creative Commons Attribution 4.0 International License, which permits unrestricted use, distribution, and reproduction in any medium, provided the original work is properly cited. |