| Structural Durability & Health Monitoring |
DOI: 10.32604/sdhm.2021.010725
ARTICLE
Damage Detection in CFST Column by Simulation of Ultrasonic Waves Using STFT-Based Spectrogram and Welch Power Spectral Density Estimate
1Anbar Technical Institute, Middle Technical University, Baghdad, 10013, Iraq
2Department of Civil and Structural Engineering, National University of Malaysia, Selangor, 43600, Malaysia
*Corresponding Author: Nadom K. Mutlib. Email: nadomkhalifa@mtu.edu.iq
Received: 23 March 2020; Accepted: 20 November 2020
Abstract: Structural health monitoring employs different tools and techniques to provide a prediction for damages that occur in various structures. Damages such as debond and cracks in concrete-filled steel tube column (CFST) are serious defects that threaten the integrity of the structural members. Ultrasonic waves monitoring applied to the CFST column is necessary to detect damages and quantify their size. However, without appropriate signal processing tools, the results of the monitoring process could not be crucial. In this research, a monitoring process based on a Multiphysics numerical simulation study was carried out. Two signal processing tools: short time Fourier transform (STFT) and Welch Power Spectral Density Estimate (PSD) were used to analyse the captured raw signals. The STFT spectrogram was effective in identifying the different size of damage based on a graphical interpretation. The results show that the increasing of frequency of the excited signal give a better results. The increase in peak magnitude values in Welch PSD was found to be proportionate to the change in damage length whereas the damage depth has a less effect. The results for the crack size identification were less promising than those of debond damage because of the different type of the signal’s propagation path. Simulation process conducted by COMSOL software has proved the validity of the adopted signal processing techniques in detecting such damages in CFST columns.
Keywords: CFST; debond; cracks; ultrasonic waves; piezoelectric sensor; STFT; Welch PSD
Concrete and steel structures experience numerous kinds of damage such as cracks, delamination, and corrosion because of loading and environmental conditions. These types of damage are subject to the type of loading. Damage will destructively affect the reliability of the structural elements. Structural health monitoring (SHM) aims to predict and detect damage at the early stages to maintain the structure against failure and collapse.
Concrete-filled steel tube columns (CFST) are used widely as compression members and to resist flexural buckling. Local buckling in CFST is resisted by concrete core which gives it a merit over hollow section steel columns [1]. Because of their high load-carrying capacity, they are employed in high rise buildings and in bridges. However, debond between concrete core and steel encasement weakens the structural performance of CFST columns. Detection of such damage by traditional techniques is of great challenge due to its inaccessibility. Non-destructive evaluation techniques play a vital role in detection of similar defects. Ultrasonic wave is one of these techniques that are adopted in many researches to investigate the health state of structural elements [2,3].
Many researchers have employed ultrasonic waves monitoring in steel and concrete structural members but few of them dealt with composite elements. Guided waves have been employed to detect debond in CFST columns [4–6]. They are suitable for investigating damages close to a guide. When damage is far from a boundary (i.e., lies inside bulk of structure), bulk waves are used. Ultrasonic waves are excited using many types of sensors but many researchers have used the piezoelectric type [7–9]. Piezoelectric sensors are cheap, easy to setup, and can be used as transmitter/receiver. In researches relevant to CFST specimens, piezoelectric sensors are installed either on surface of the column (mounted) or inside it (embedded) depending on the location of the monitored area and the type of the propagated wave. When more flexibility and high accuracy is required phased array sensors are used. These sensors are widely used in the applications of NDT and structural health monitoring. Yang et al. [10] employed the phased array sensors in their research to detect corrosion defects in engine cylinders. Tagami [11] also used phased array sensors in inspection of weld joints in steel structures.
It is not totally understood the behaviour of wave response when it reacts with debond of various size and location. It is even more complex when the monitored damage extends to a point far from the propagation line of the exited wave. Another issue could be emerged when more than one type of wave (i.e., surface and bulk waves) are generated as in the case of a sensor amounted on a steel surface of CFST column. Testing many specimens covering the aforementioned parameters could give a comprehensive view for the behaviour of ultrasonic waves in such investigation. Since experimental work for too many specimens is costly and time consuming, physics-based simulation study could be more practical.
COMSOL is a Multiphysics software has been adopted successfully in many ultrasonic based researches [12–14]. The simulated raw wave signals captured by the receiving sensors are usually processed to extract the potential features using signal processing approaches. In most of the cases, time domain approach is not decisive in detecting the existing damages. Therefore, there is a pressing need to employ different domains such as frequency and time-frequency domains. Many signal processing techniques have been used in CFST structures for this purpose. Wavelet transform [7,15–17], fast Fourier transform [18], Time Reversal [19], Hilbert-Huang transform [7,19] and S-transform [20,21]. Li et al. [22] used continuous wavelet transform to study numerically and experimentally the detection process of inclusion in a cantilever beam. Strain signals was extracted and analysed using Gabor wavelet transform. The authors concluded that the detection of inclusion location is proportional to the inclusion depth ratio. Numerical results shows that when the inclusion depth ratio is larger than 10%, the detecting error in inclusion location is not more than 10%.
Short time Fourier transform (STFT) is another signal processing tool presents time-frequency analysis for non-stationary signals. Due to its good performance regarding readability, resolution, and computational time, it has been selected as a time-frequency estimator [23]. While STFT has been used in different SHM-based researches, it has rarely used in composite structure studies. Ke et al. [6] employed STFT to assess debond between steel plate and substrates for CFST member. However, the use of STFT was limited to production of frequency-slowness spectrogram. Petro et al. [24] used STFT to convert the time domain data into frequency domain. They employed ultrasonic pulse velocity to detect delamination in concrete. The fast Fourier trans-form or short-time Fourier transform can be adopted by altering the basis from the time domain to frequency domain [25]. However, such transforms carry limited information regarding the wave spectrum, unlike wavelet transforms such as Morlet, Gabor, and Mexican hat transforms [26]. A different frequency domain approach used in feature extraction of wave signals is called Welch method. It is an approach for power spectral density estimation (PSD). Krejcar et al. [27] applied Welch periodogram to average data segments through an analysis process aiming to improve the nondestructive diagnostics of solid objects. Although Welch method has been used in many studies [28,29], it has not been found in ultrasonic waves-based studies.
In this research, an ultrasonic-based monitoring process has been simulated using COMSOL Multiphysics software to provide a good understanding about damage detection in CFST columns. The resulted raw signals were analysed using STFT spectrogram and Welch PSD periodogram.
2 Numerical Modelling of Ultrasonic Wave-Based Damage Detection System
CFST column specimens with various debond and crack size were modelled. A height of 1 m and cross-section of 35 × 35 cm was selected for CFST column. The steel encasement has 2 mm thickness. Artificial debond size including debond length parallel to the wave propagation direction and debond depth perpendicular to the propagation direction. Debond length has two stages, the first to increase it from 1 to 5 cm by an increment of 1 cm each time. The second stage is to increase it from 5 cm to 75 cm by 5 cm increment. Debond depth was selected to range from 1 to 5 cm. To achieve these parameters, 100 specimens are modelled. Crack damage with various opening width is modelled separately. Crack width sizes are ranged from 1–5 mm. Fig. 1 shows the schematic of the proposed specimen.
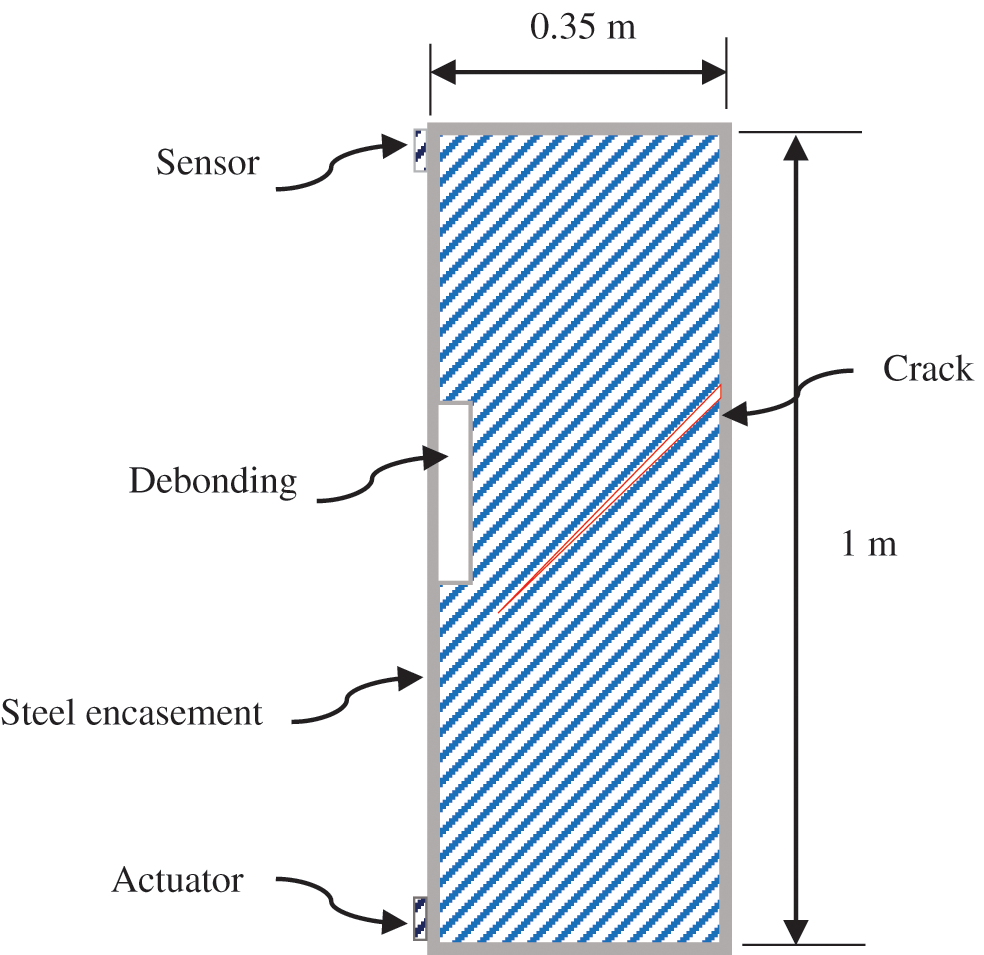
Figure 1: Schematic of the test specimen
PZT sensors were mounted on the surface of the steel encasement at the bottom and top of the CFST column left side. The PZT diameter was 10 mm with 1 mm thickness. PZT-4 material type was selected. Multiphysics simulation was conducted by COMSOL software. Extremely fine mesh was selected. Meshing statistics are found in Tab. 1 and Fig. 2.
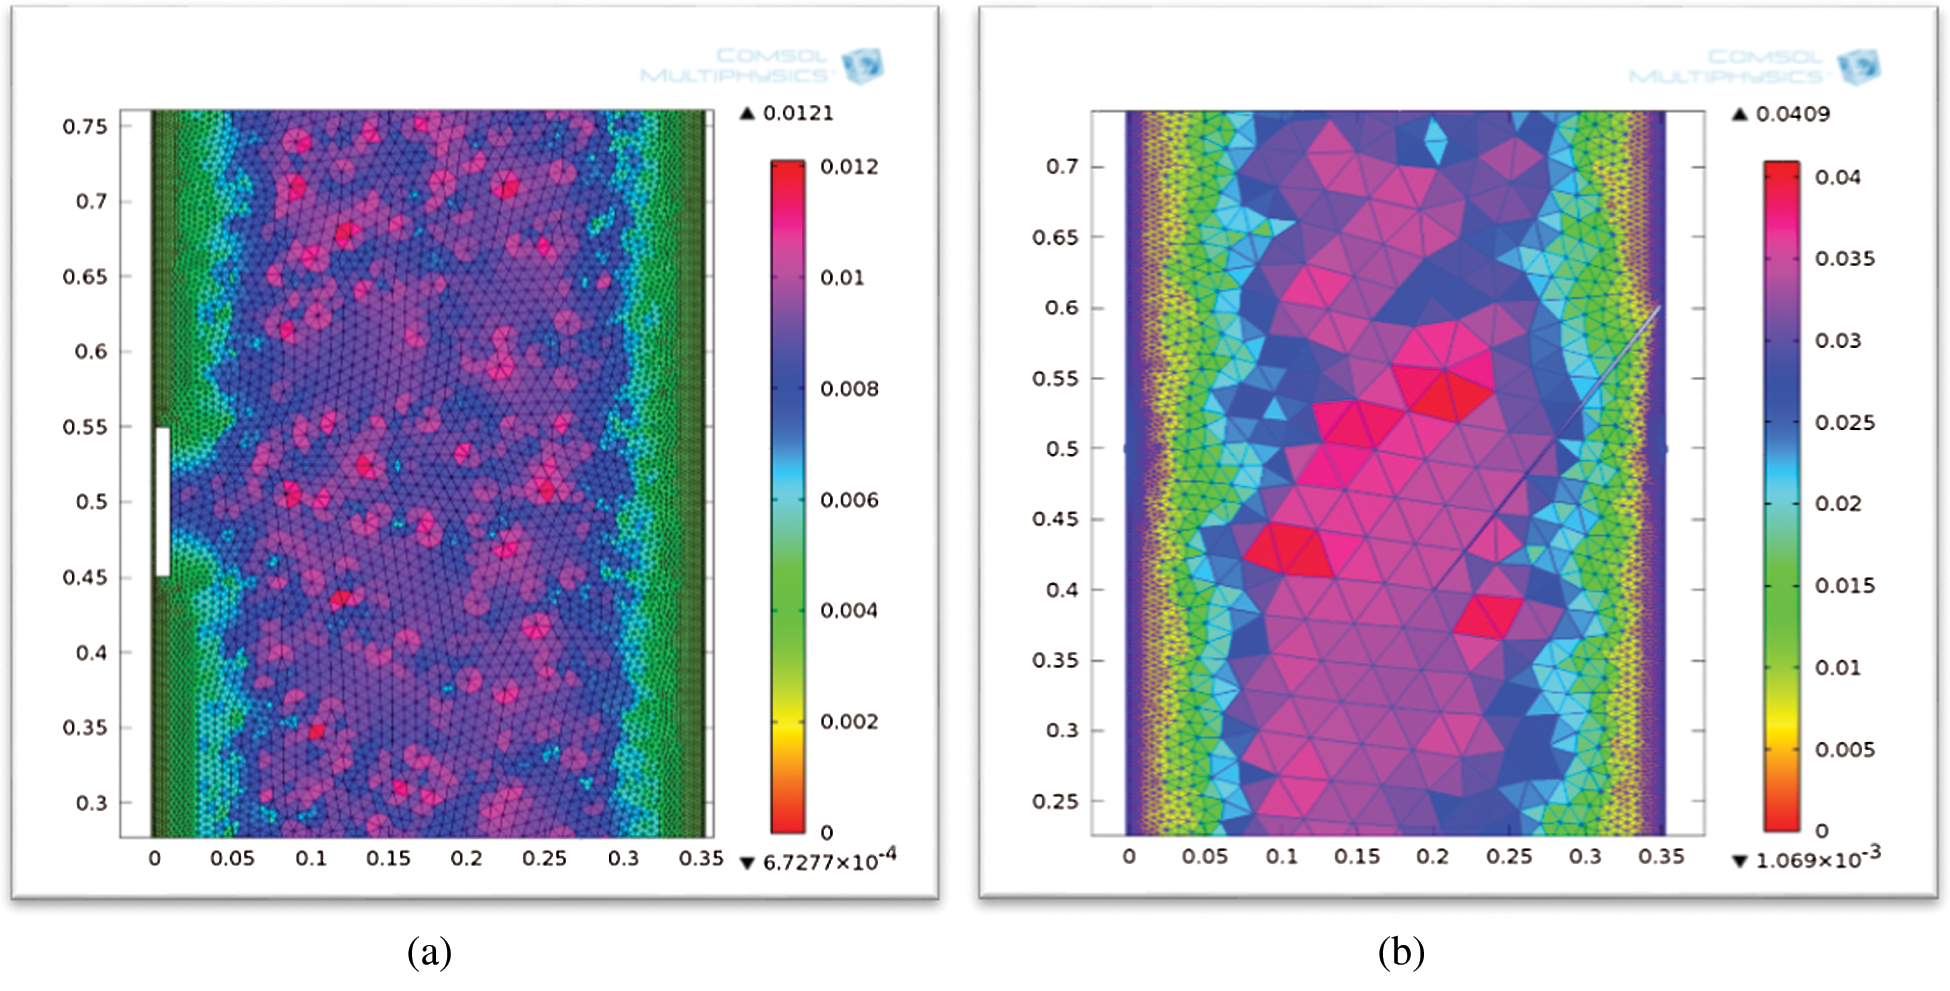
Figure 2: Meshing of the CFST model, (a) debond model, (b) crack model
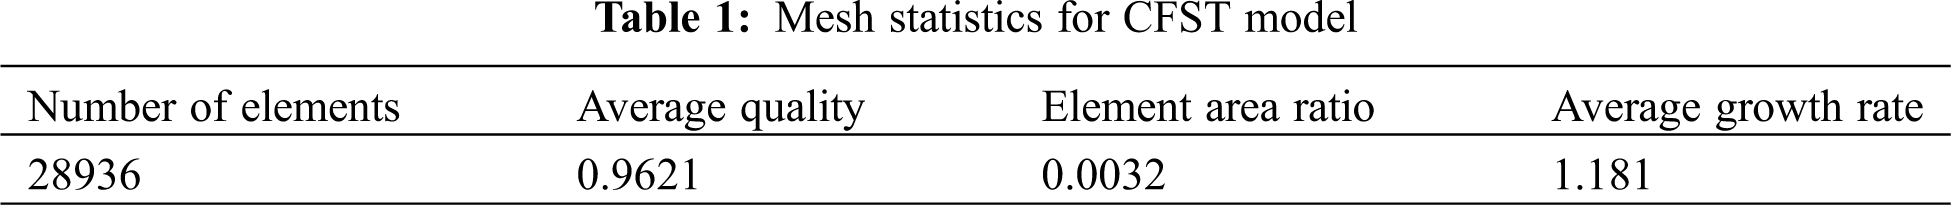
Ultrasonic wave signal with amplitude of 10 V was exited using PZT transmitter sensor. Because the wavelength of a wave is inversely proportional to frequency, the wave was excited with 100 kHz frequency for 5–75 cm debond length whereas 500 kHz was chosen for 1–5 cm. A sinusoidal five cycles Hanning function F(t) was applied on the exited signal, see Eq. (1) and Fig. 3.
where (A) is wave amplitude, (f) is excitation frequency, (t) is time, and (n) is number of cycles of the window. Spatial and temporal resolution was applied based on Eqs. (2) and (3)
where le is the element length , λmin is the minimum wavelength for the wave used, Δt is the time step, and fmax is the maximum frequency.
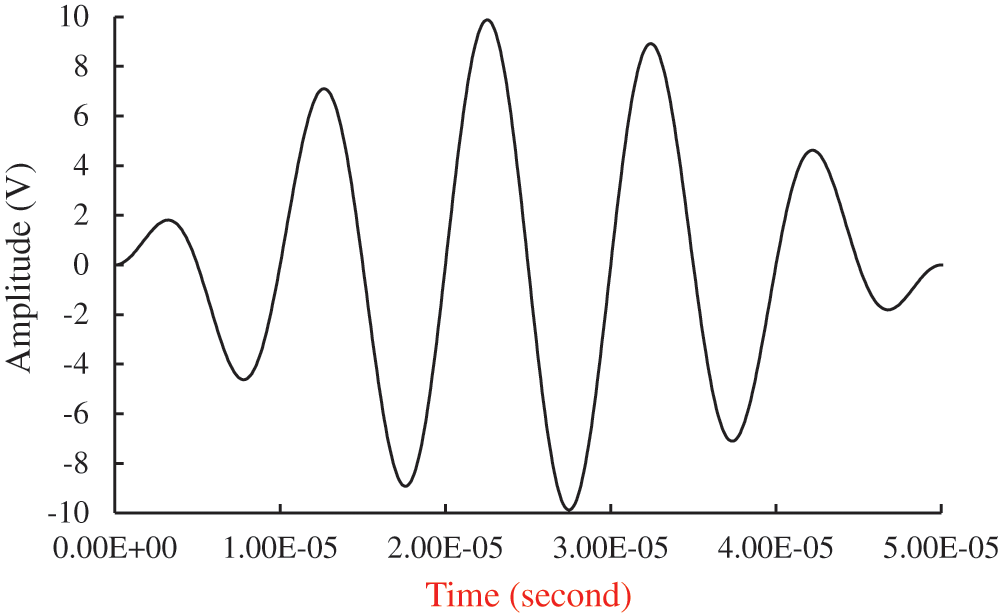
Figure 3: The excited wave endowed with a Hanning window
3 Theoretical Background of Signal Processing Techniques
STFT has a robust capability of representing signals in a frequency domain which is useful in wave-based damage detections. Some of the advantages of the STFT method are the ease of implementing the fast Fourier transform and outcome data in standard Fourier forms [30]. A natural extension of the Fourier transform when the signals are time-varying is the STFT, which is defined as [31]
where h(t1) is a window function centred at time t1. Squaring the magnitude of the STFT gives the spectrogram, as follows:
A spectrogram is a visual representation of the spectrum of frequencies of a signal as it varies with time, see Fig. 4. There are several types of spectrogram according to the signal processing it is formulated from such was Wavelet, Gabor, Wigner-Ville Distribution and STFT spectrogram. Spectrogram (X) returns the spectrogram of the signal specified by vector X. X is divided into a number of segments with 50% overlap, each segment is windowed with a specific window. The number of frequency points used to calculate the discrete Fourier transforms is equal to the maximum of 256 or the next power of two greater than the length of each segment of X. In this research, number of segments taken was 8 and type of window used was Hamming.
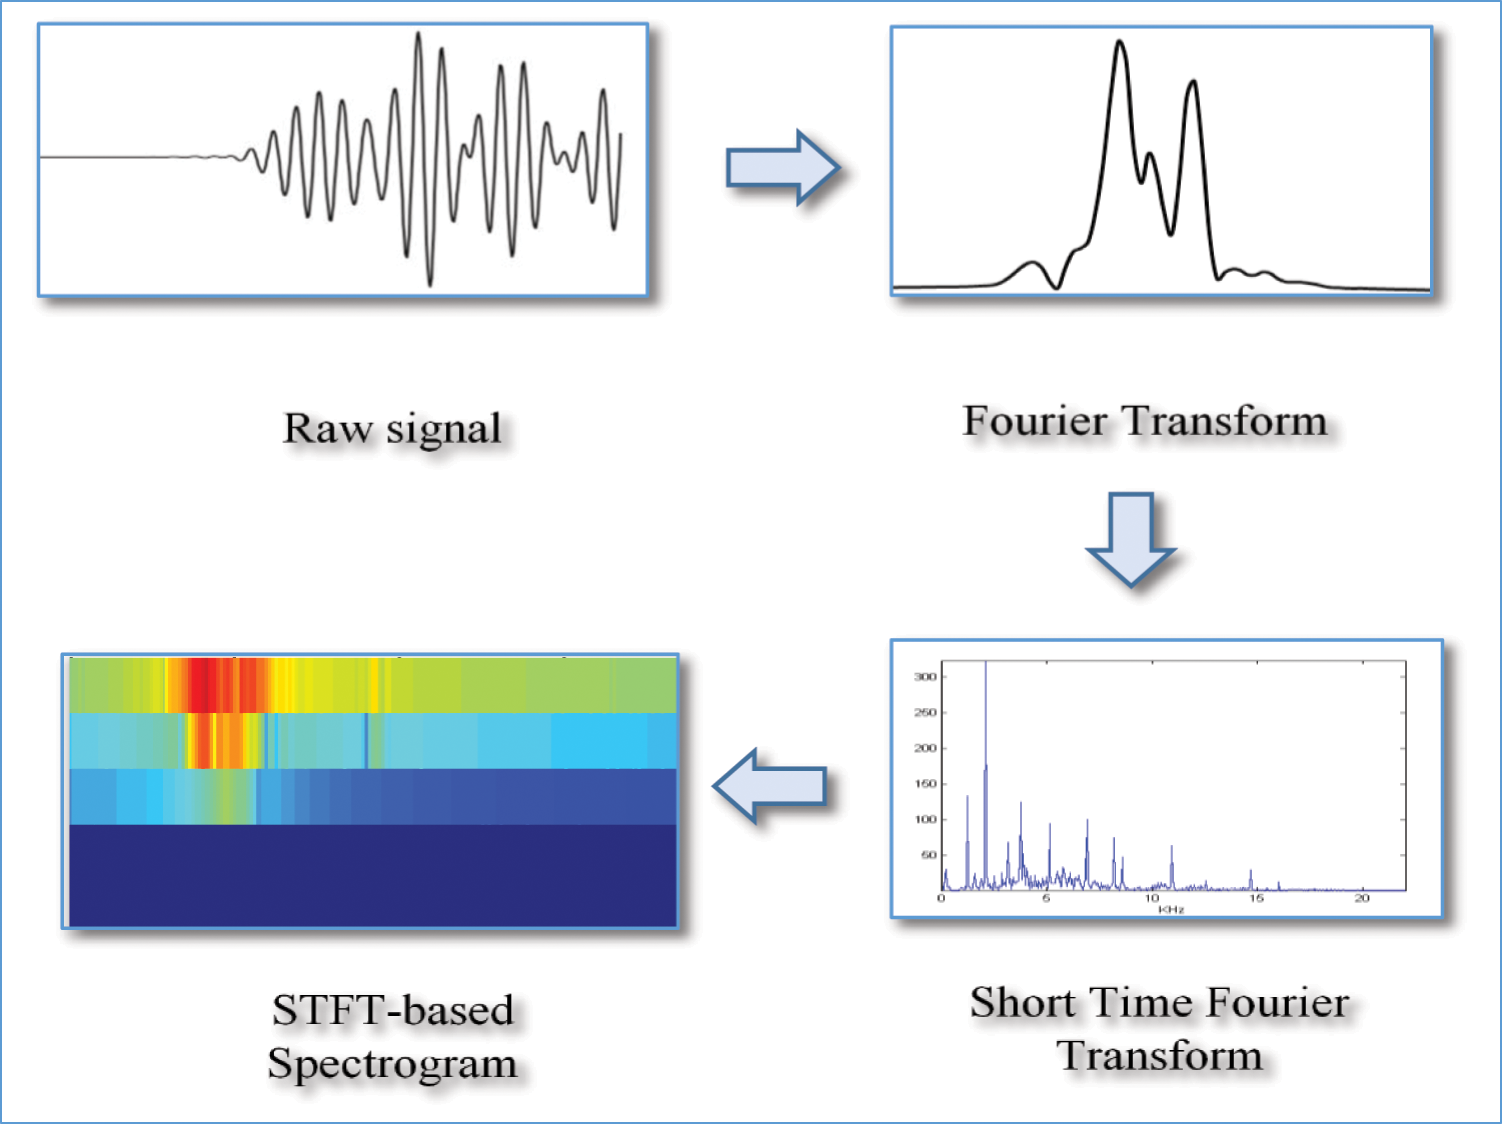
Figure 4: Illustration of STFT process
PSD refers to the spectral energy distribution traced in a specific time. PSD can be computed using many methods such as Power Spectral Capon, Thomson’s multitaper method, and Welch method. It is a discrete Fourier transform (DFT) based method that can be implemented efficiently using the fast Fourier transform (FFT). Welch periodogram uses averaging technique to produce smoother PSD estimate over time. It depends on some parameters that highly affect their results such as number of sampling points, percentage of overlapping between segments and window length. The observation window is divided into sub-segments to reduce the variance. Each sub-segment is multiplied with a windowing function to reduce the side lobes [32]. Welch method can be calculated as follows [29]:
where
and
where nd is the number of the overlapping segments whereas N, Ts, yk are the number of samples, the sampling period and the individual record at position k, respectively. The parameter w[t] denoting the window function and j is the imaginary unit. In this research, the window type used is Hanning window, the value of Ts is 5 × 10⁻⁷ seconds, and Hanning window length is 256. The data were analysed using signal processing toolbox in MATLAB software.
Time domain analysis are usually used in wave propagation because of its ease in use. Moreover, no complex methods are needed. However, for most type of damages, detection process is not useful. In this section time domain analysis is used to decide if it is appropriate for the data in this research. The results are to be shown for different damage sizes in time domain scheme. The propagation of excited wave by the piezoelectric sensor is shown in Fig. 5. It shows that more than one type of waves are generated (i.e., surface and bulk waves). However, the first arriving signal captured by the receiving sensor at specific time was analysed.
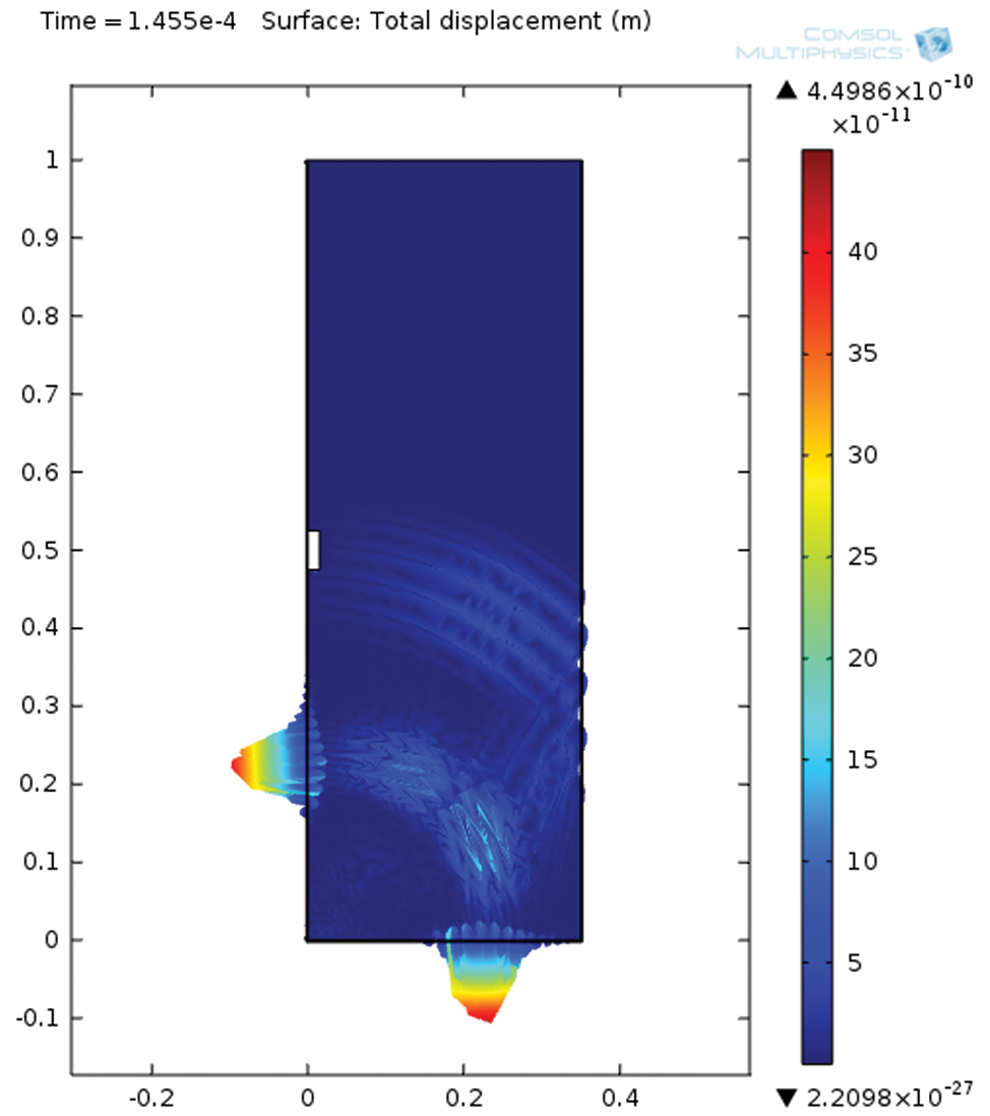
Figure 5: Simulation of propagated waves through CFST model
Raw signals shown in Fig. 6 are plotted to compare between two damage lengths: 5 cm and 10 cm, 5 cm and 35 cm, 5 cm and 60 cm using time domain representation. For graph parts, (a) and (b) it can be noticed that it is difficult to recognise between the two data lines. However, when the damage is bigger in size, the difference became noticeable, as be seen in part (c). This implies that time domain is not suitable for detection of debond concerning this cases particularly when the damage size is small or moderate. To overcome this problem, more suitable signal processing techniques were employed. Time-frequency domain is suggested to investigate the damage detection process. In this research, STFT spectrogram is used. Moreover, Welch PSD which is a statistical method are also suggested for the same purpose.
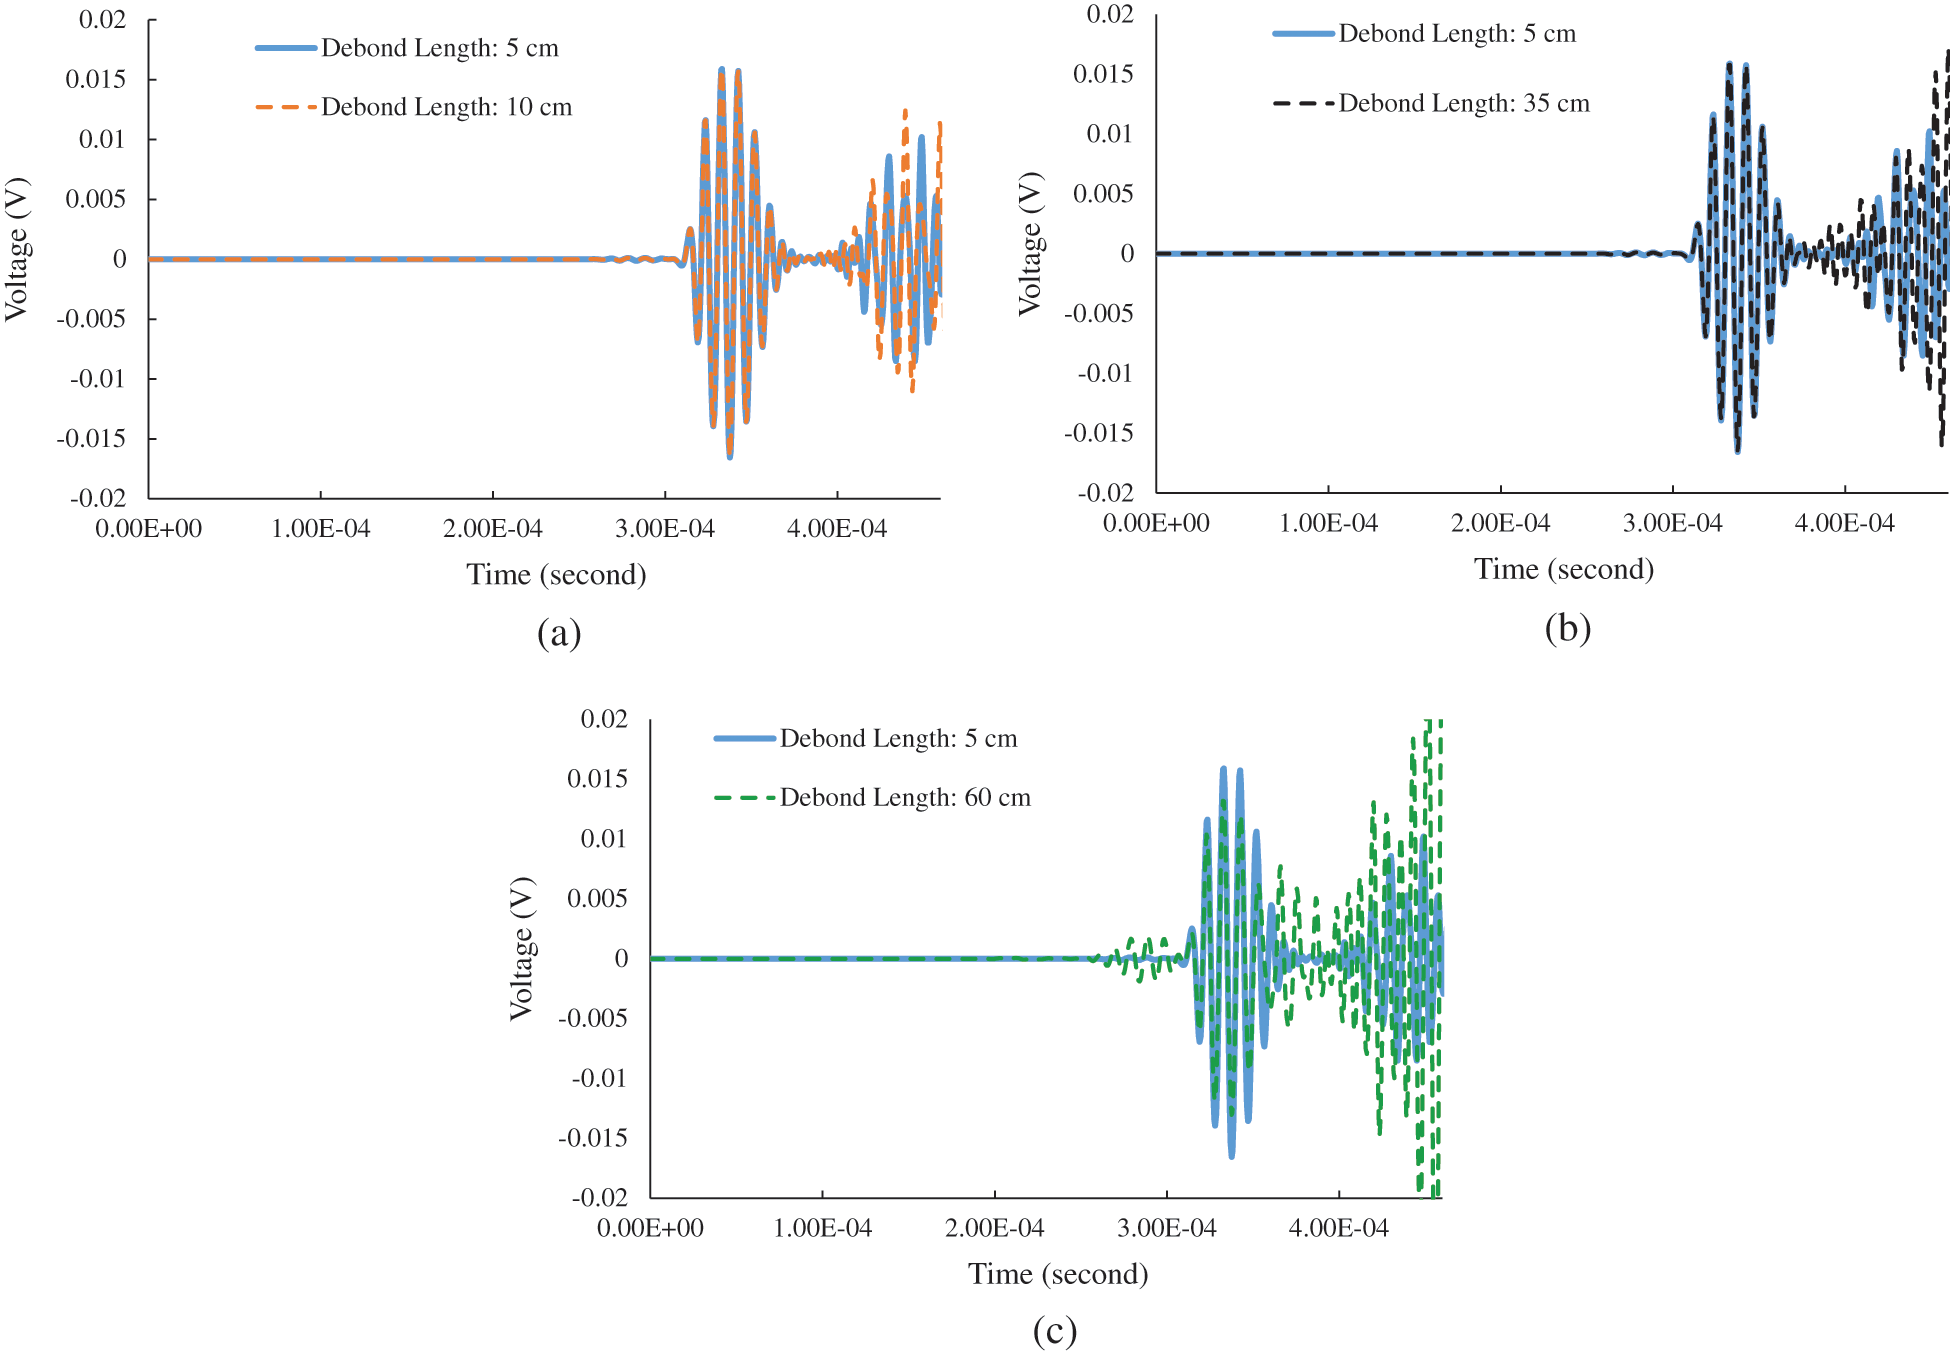
Figure 6: Time domain of two raw signals with debond length, (a) 5 cm and 10 cm, (b) 5 cm and 35 cm, (c) 5 cm and 60 cm
4.1.1 STFT Spectrogram Results
In Fig. 7, the same signals from Fig. 5 are plotted in time-frequency domain using STFT. The frequency segments inside the red ellipse appearing in the second part of the figure form a significant difference between the two results. They reflect the frequency change due to the change in debond length from 5 to 10 cm.
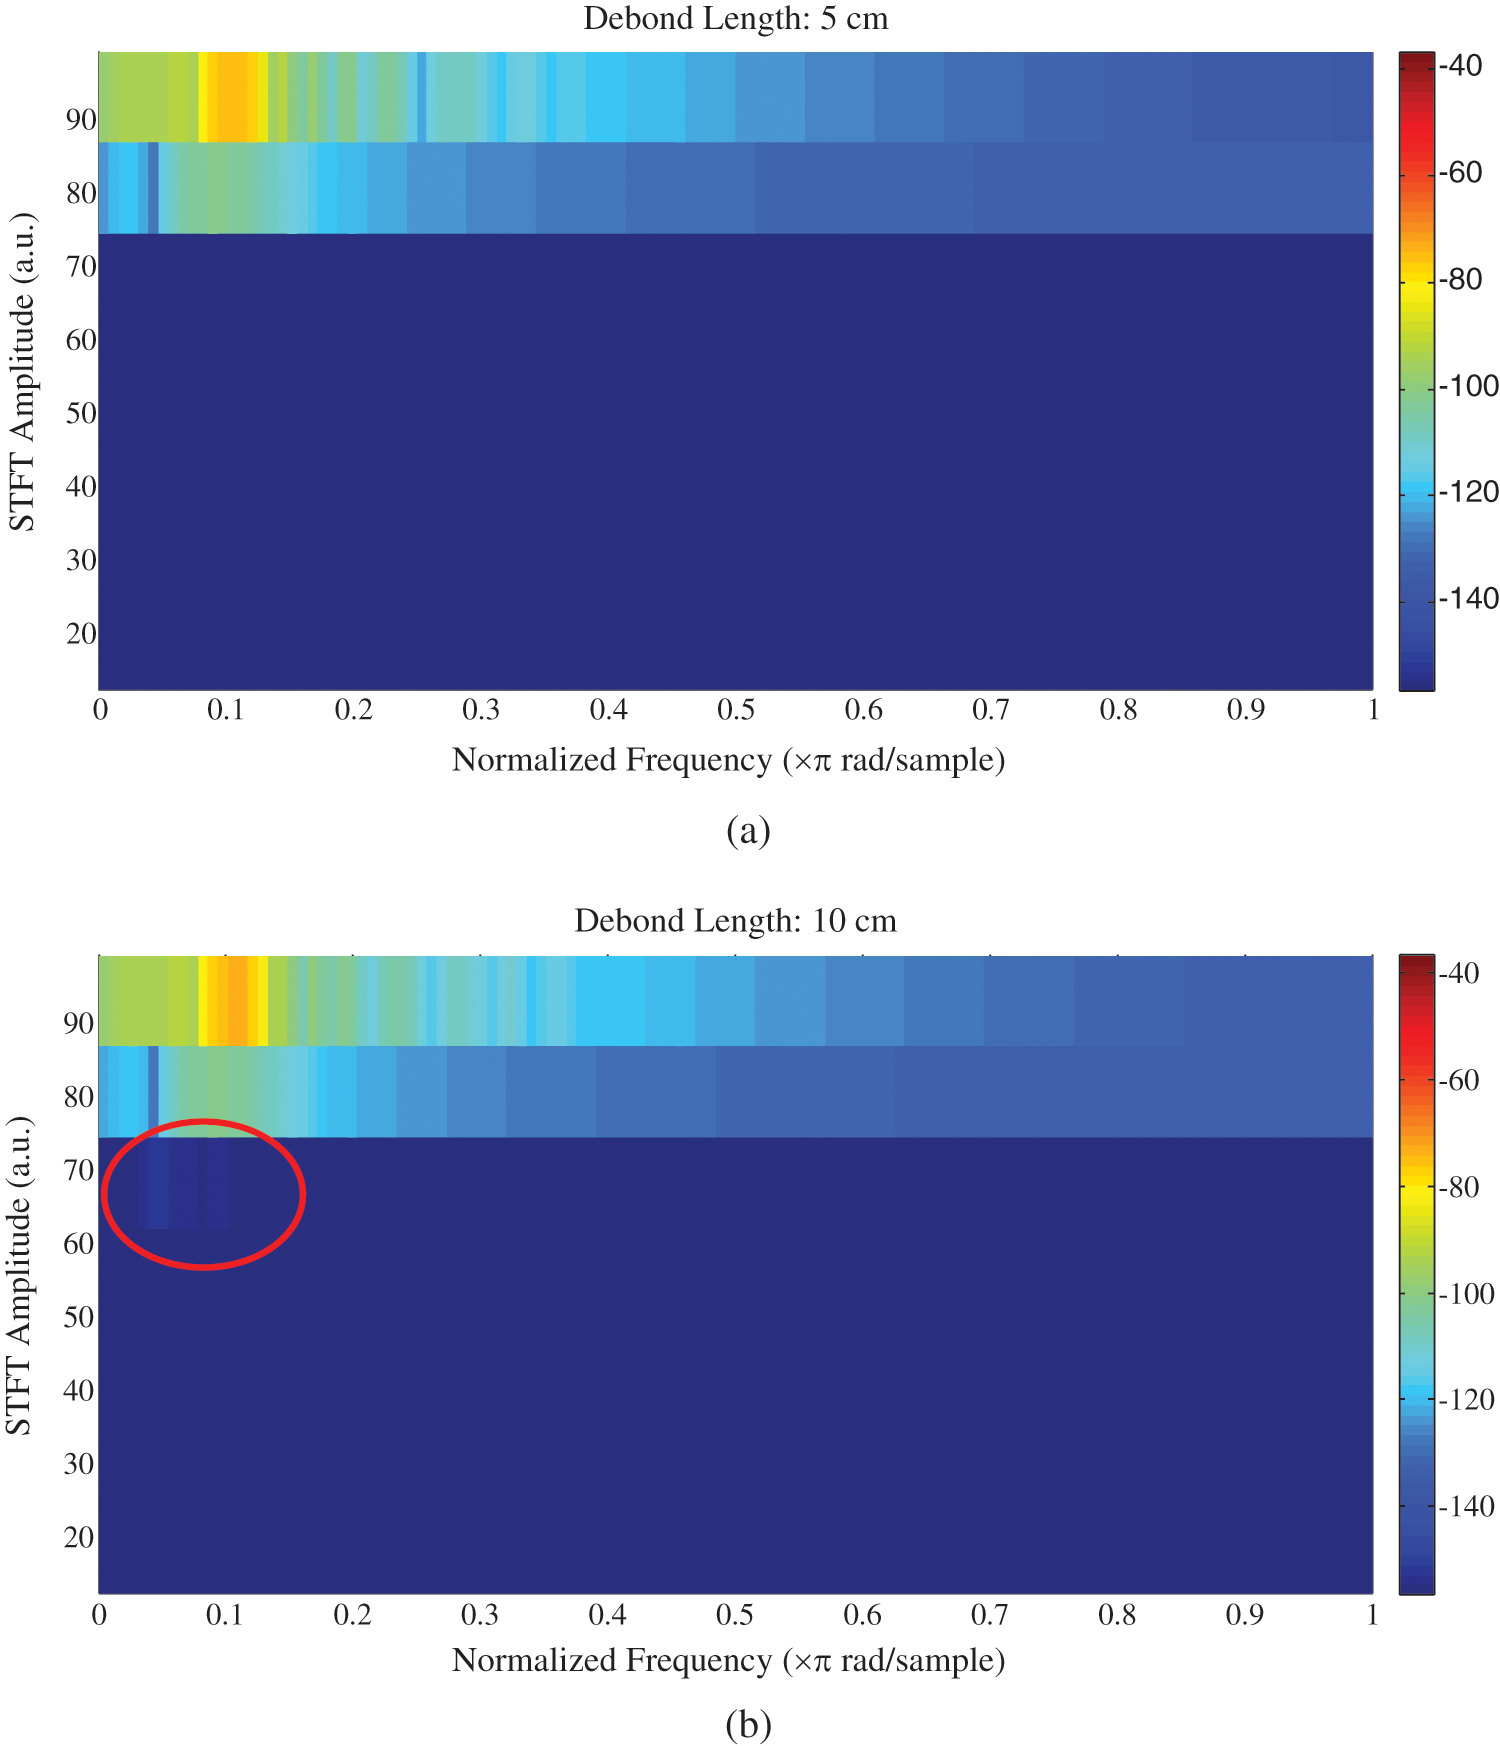
Figure 7: STFT Spectrogram with debond length: (a) 5 cm, (b) 10 cm
More results for different debond length are shown in Fig. 8. It can be noted that the bigger debond length value the more recognizable image is produced. Spectrogram image in part (b) is more recognisable from that in part (a) where the debond length gap is 20 cm. The distinction is less in case of results in Fig. 7 where the debond length gap is only 5 cm.
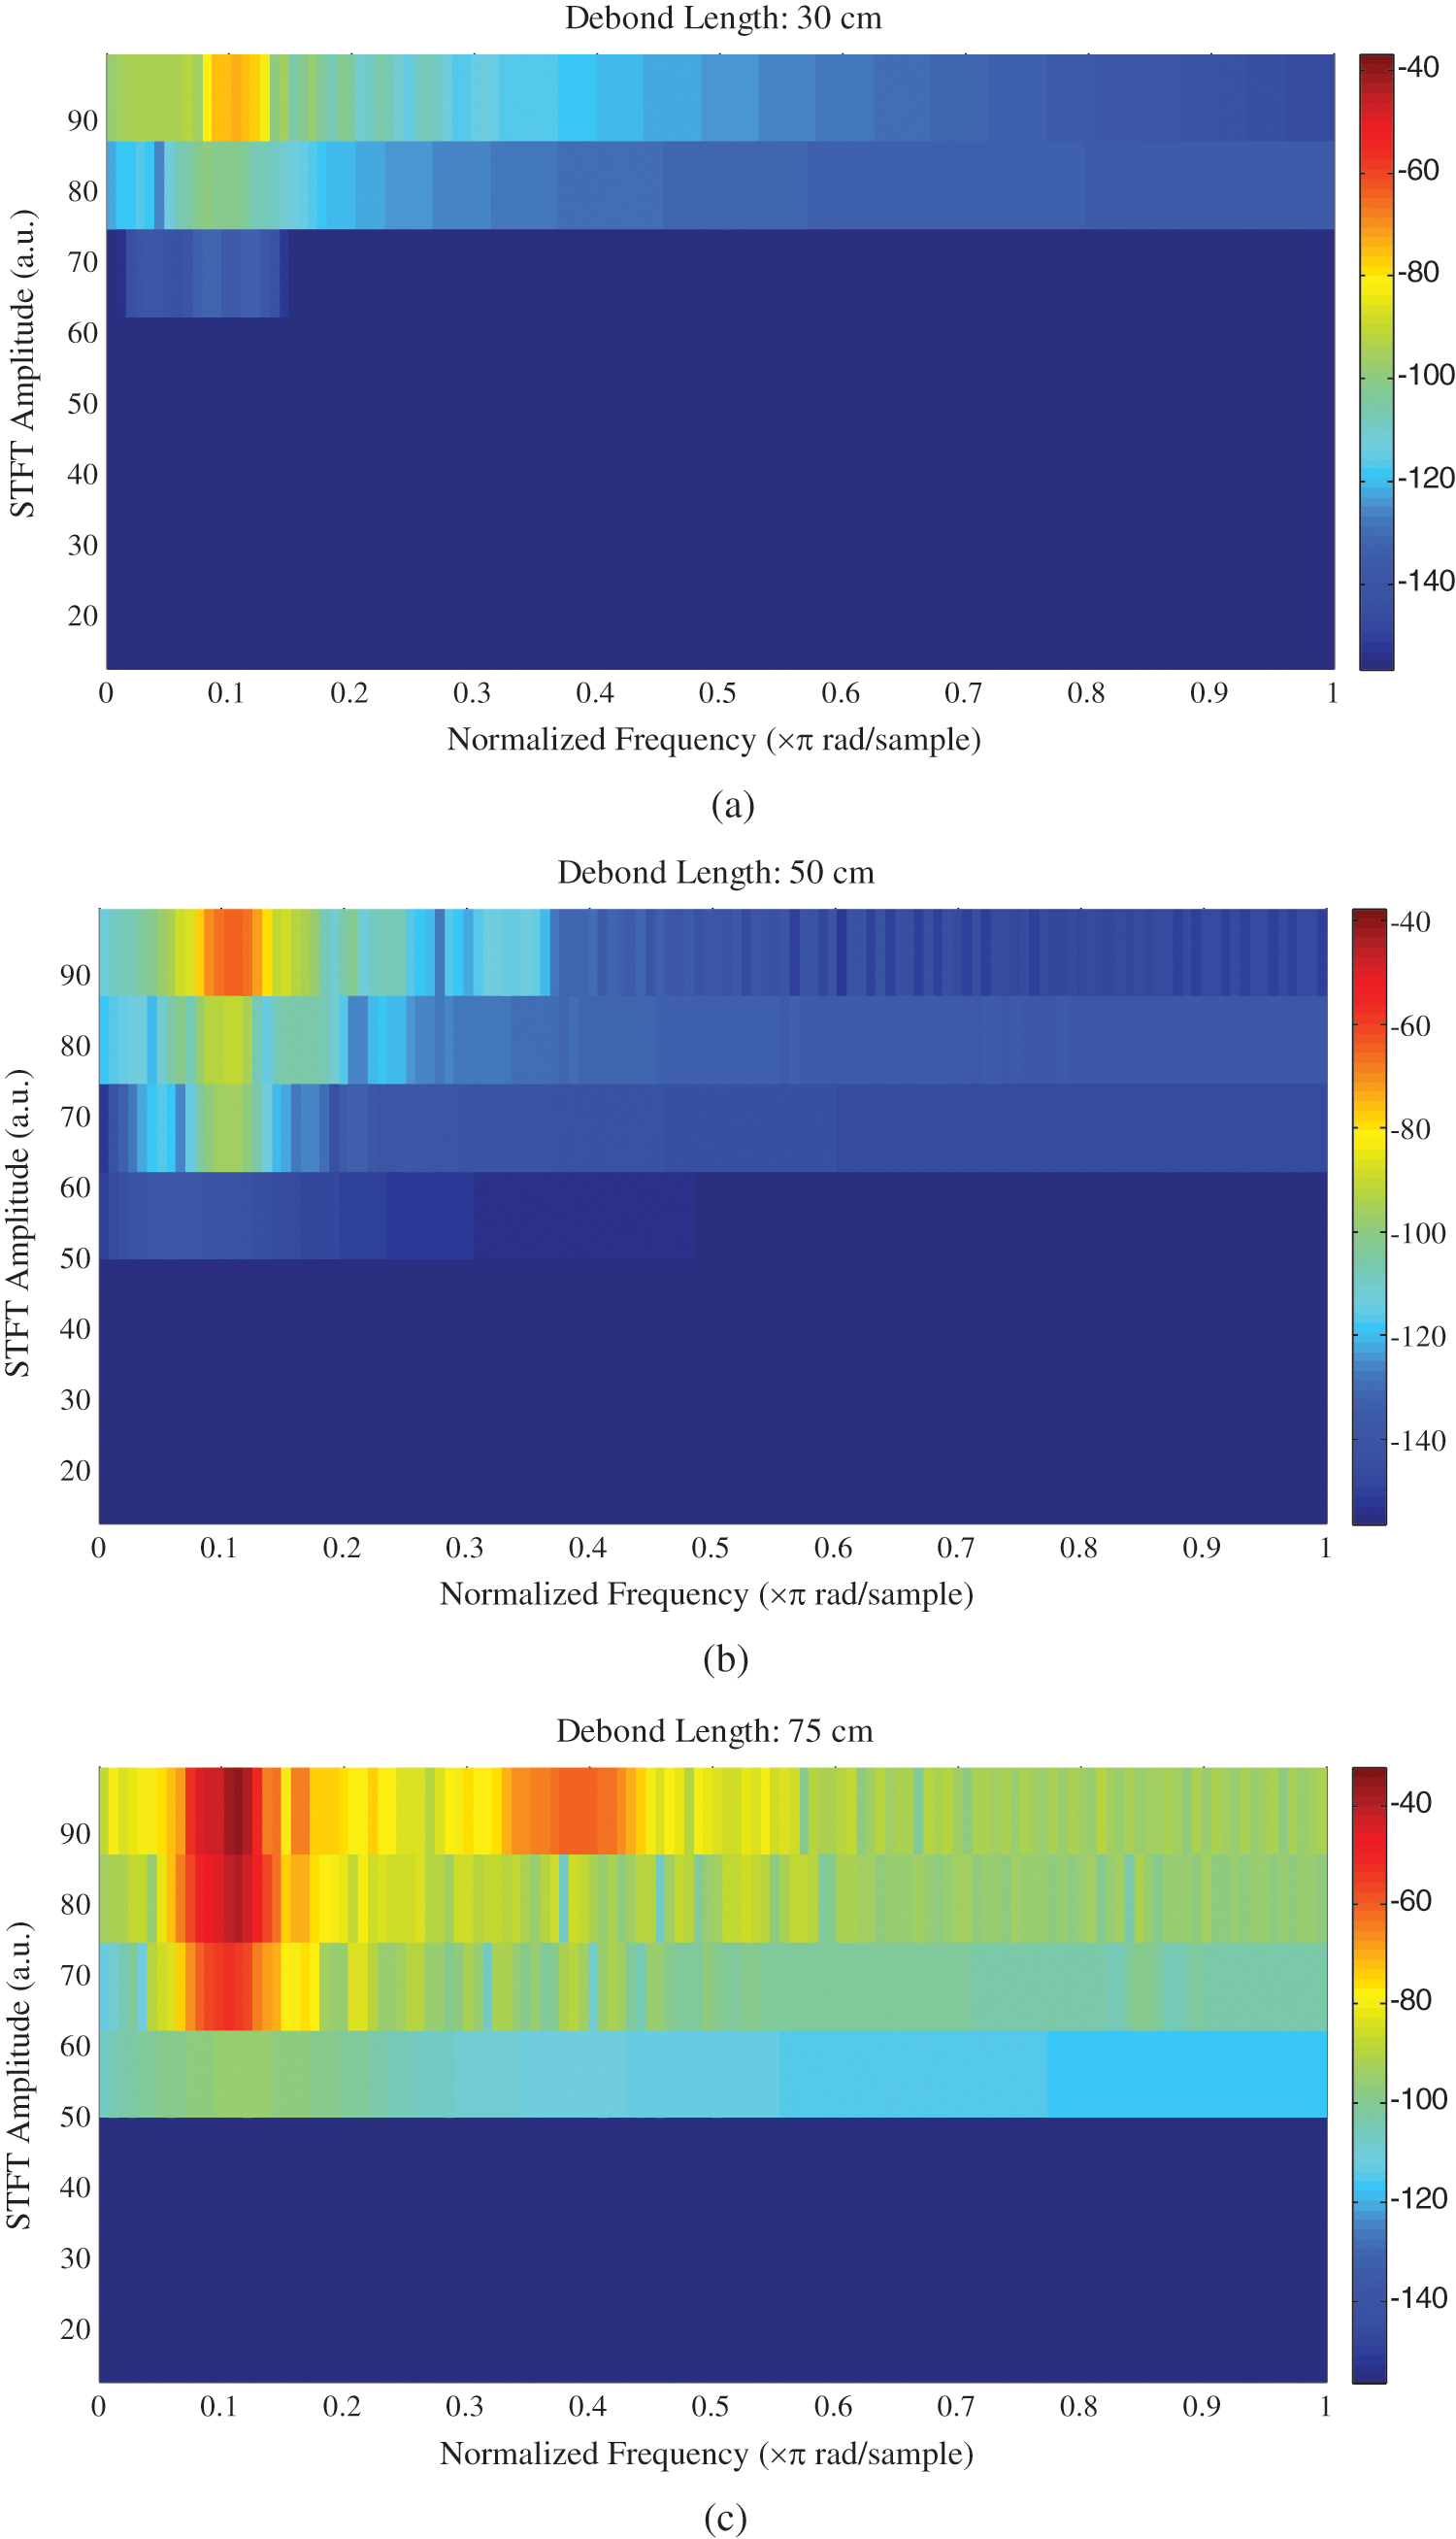
Figure 8: STFT Spectrogram with different debond length: (a) 30 cm, (b) 50 cm, (c) 75 cm
Debond length less than 5 cm has been conducted. Five samples with debond length 1–5 cm have been simulated. Because higher frequency is more suitable for smaller debond lengths, frequency of the exited wave were increase from 100 kHz to 500 kHz. The results shows different behaviour regarding the spectrogram image. All samples have appeared in the same distribution of the magnitude segments. Therefore, it was necessary to interpret the results on the basis of the colour scheme of the spectrogram image. It is well known that the colours of the spectrogram image change based on the change of the intensity of STFT magnitude. As shown in Fig. 9, the area bounded by red ellipse has changed its colours. Red colour was reduced and yellow changed to sky blue. Both colour change means an increase in magnitude according to the accompanied colour map.
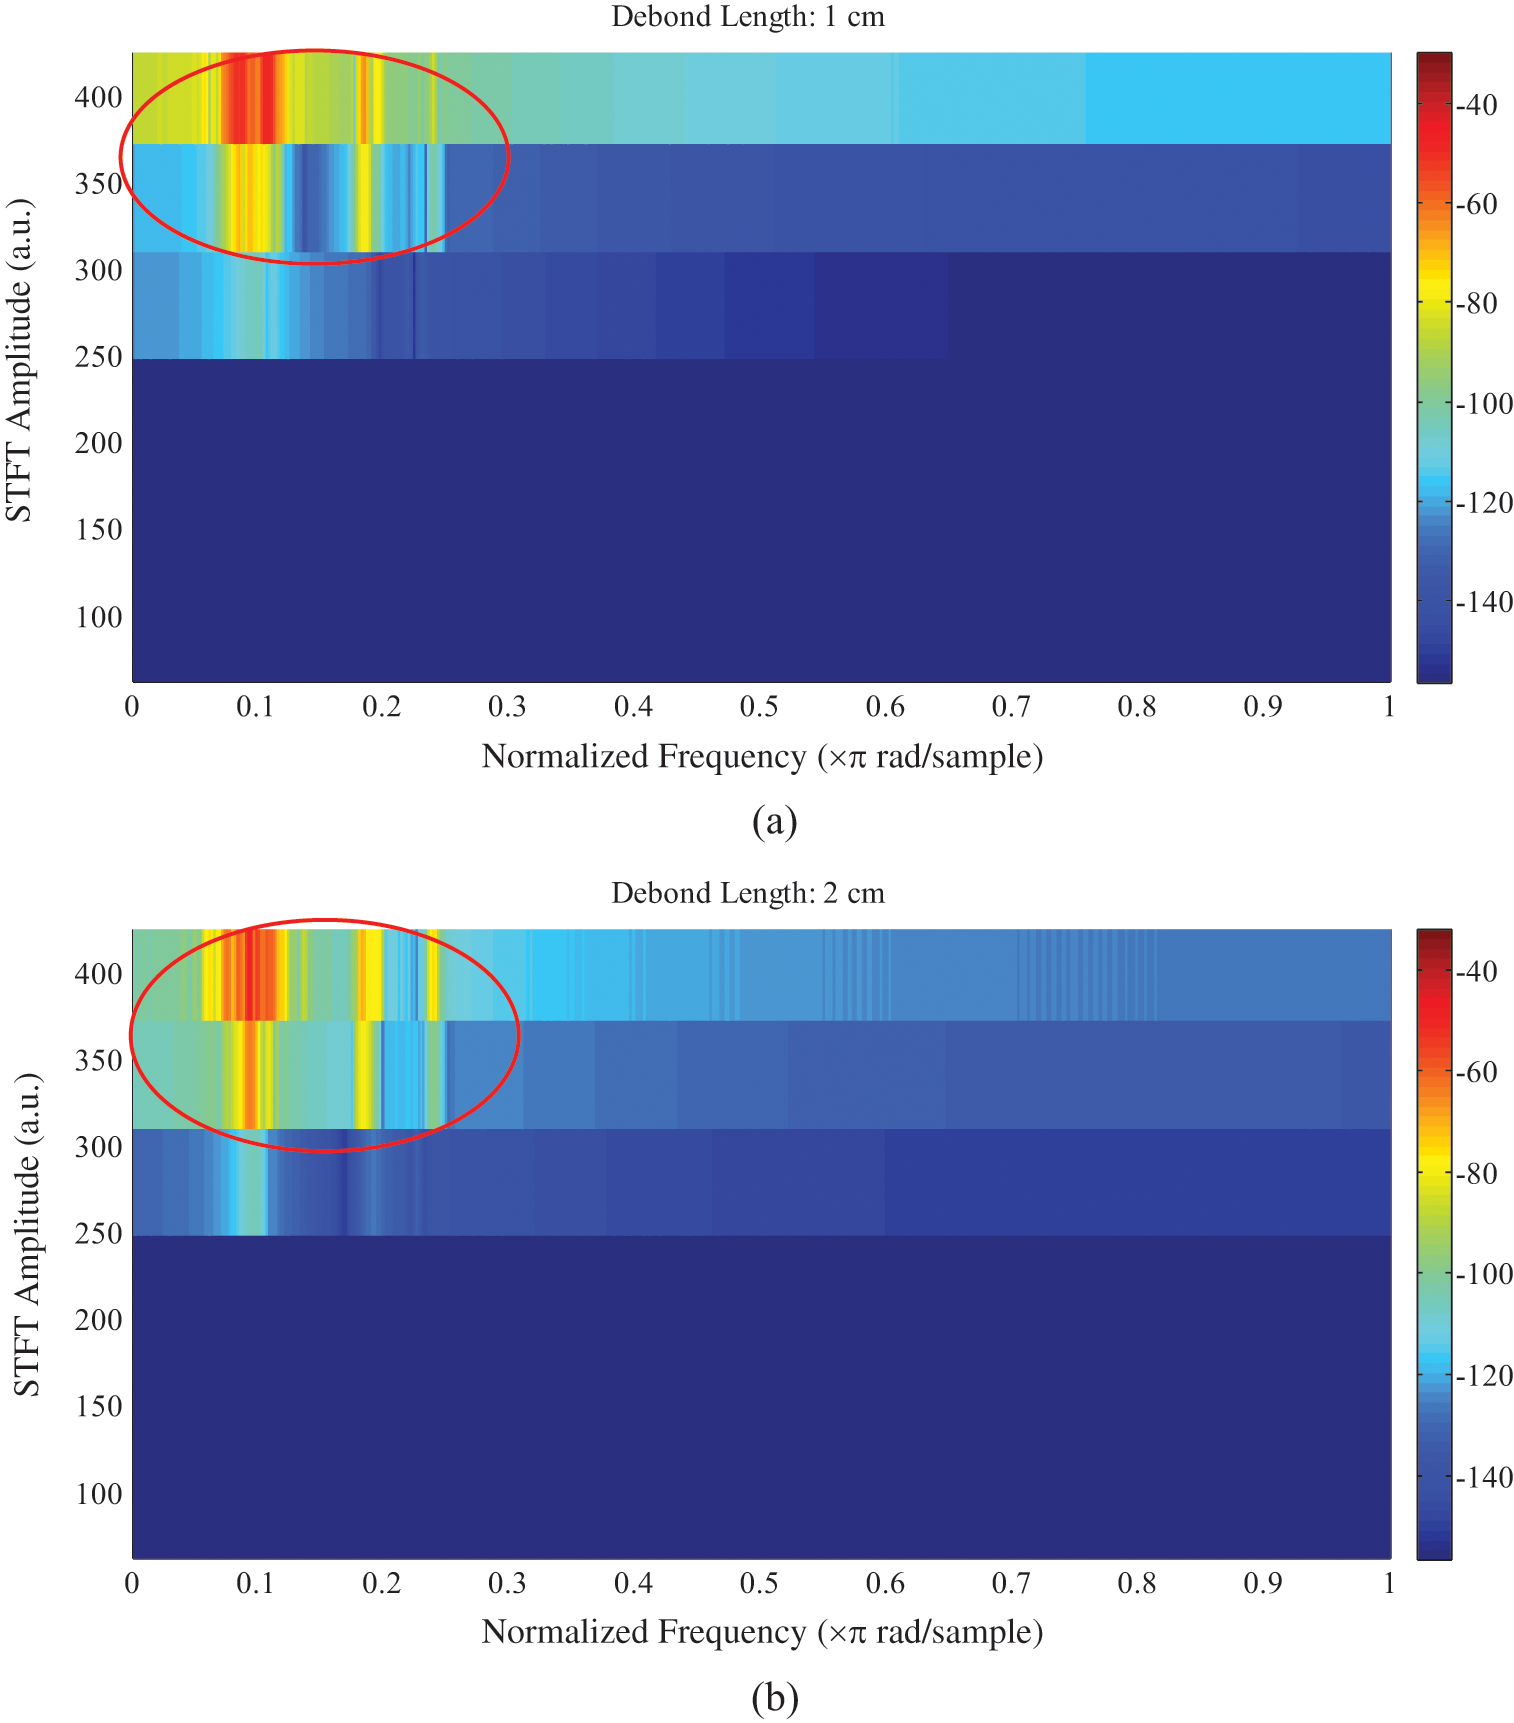
Figure 9: STFT Spectrogram with debond length: (a) 1 cm, (b) 2 cm; excitation frequency is 500 kHz
Based on 100 kHz frequency, increasing debond depth from 1 to 2 cm shows a little effect on the results but changing frequency of excited signal to 500 kHz has given a better results. Fig. 10 shows image spectrograms for four specimens have debond length of 5 cm and debond depth of 1 and 2 cm, respectively. Part (a) is based on a signal frequency of 100 kHz whereas part (b) is based on 500 kHz. It is hard to find the difference between the two images in part (a) where they are almost have the same intensity distribution. In part (b), the difference is better but it is still hard to give a direct decision about the most damaged case. This could be attributed to the fitting of higher frequencies to the smaller damage size.
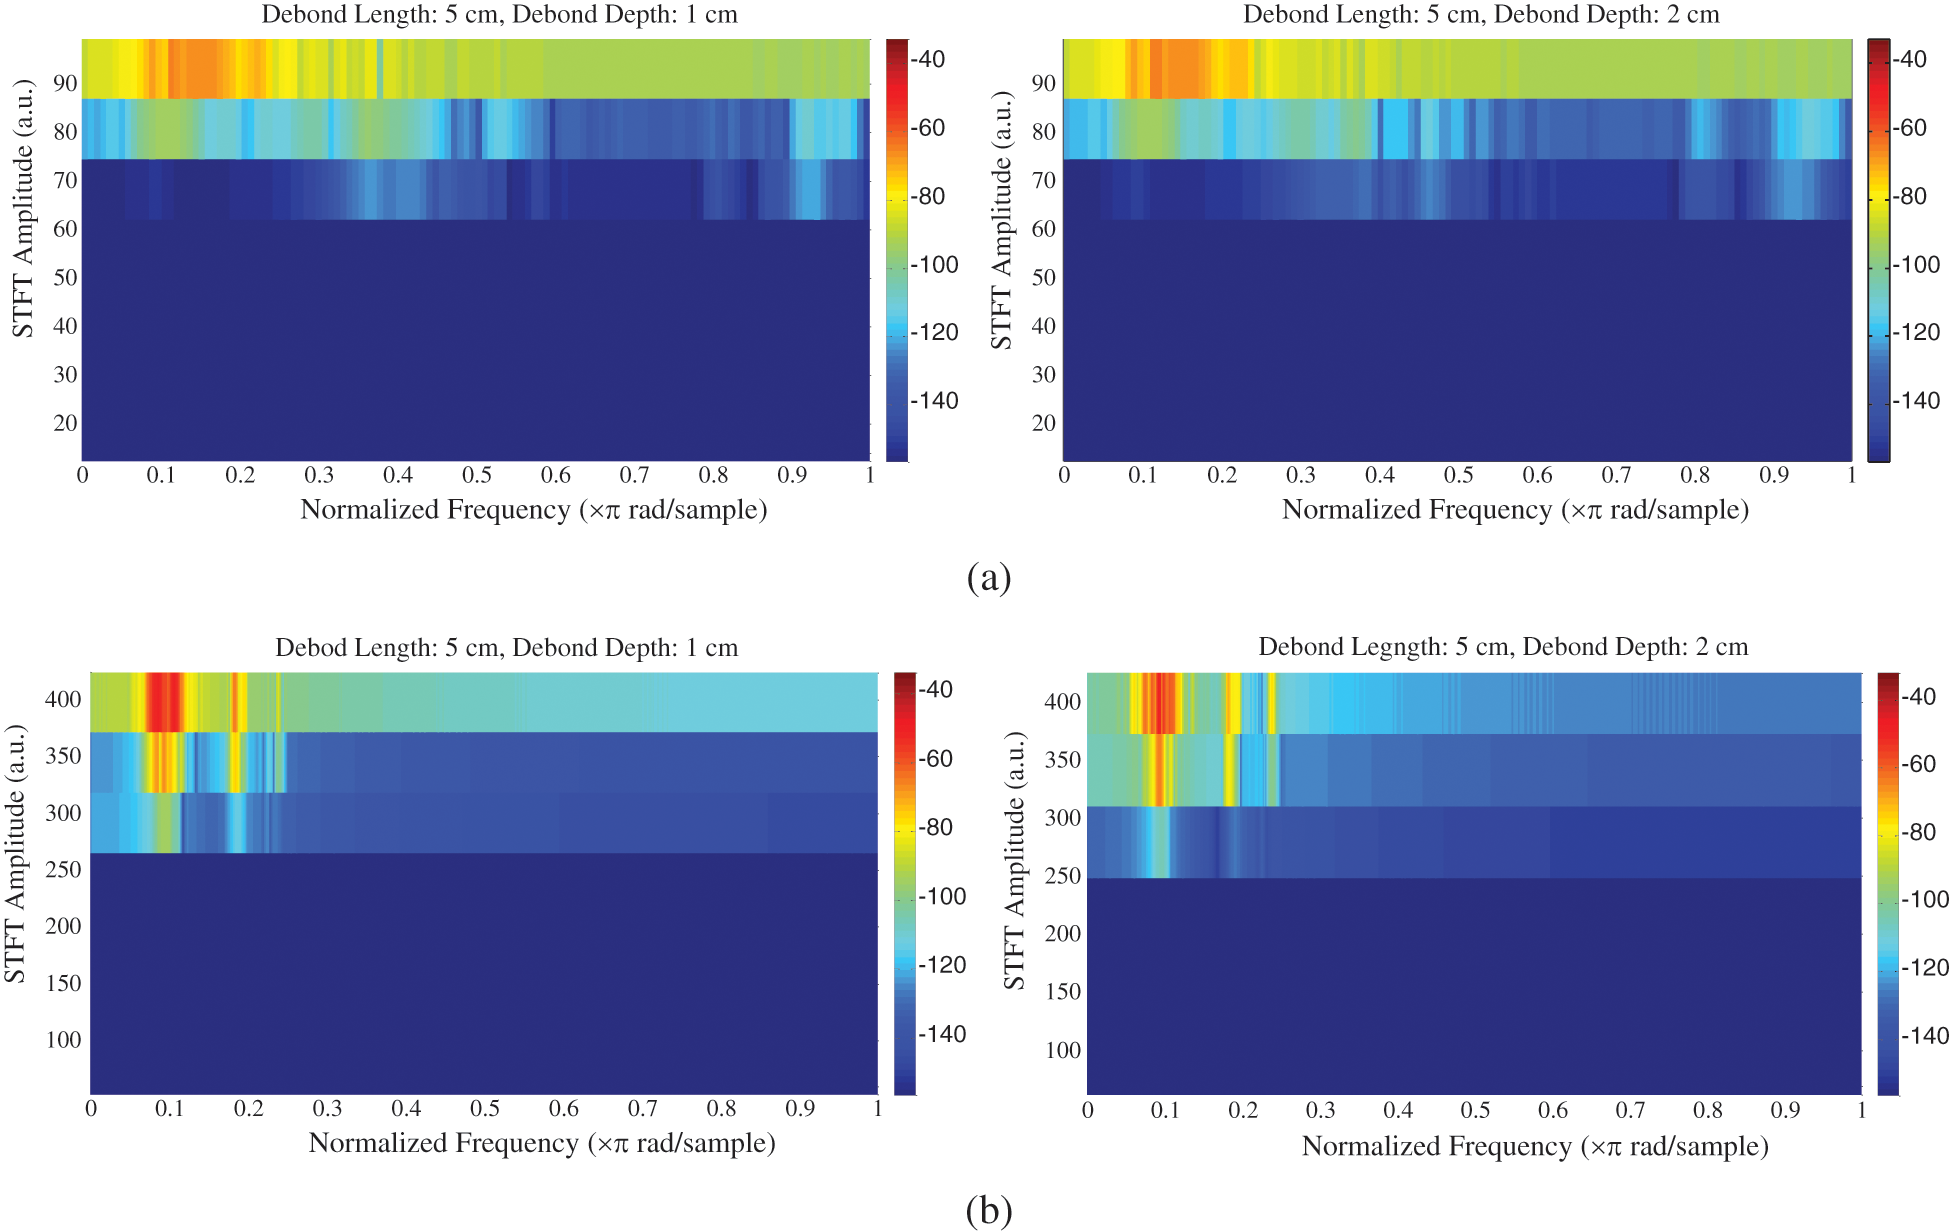
Figure 10: STFT Spectrogram with different frequencies, (a) 100 kHz (b) 500 kHz
4.1.2 Welch PSD Estimate Results
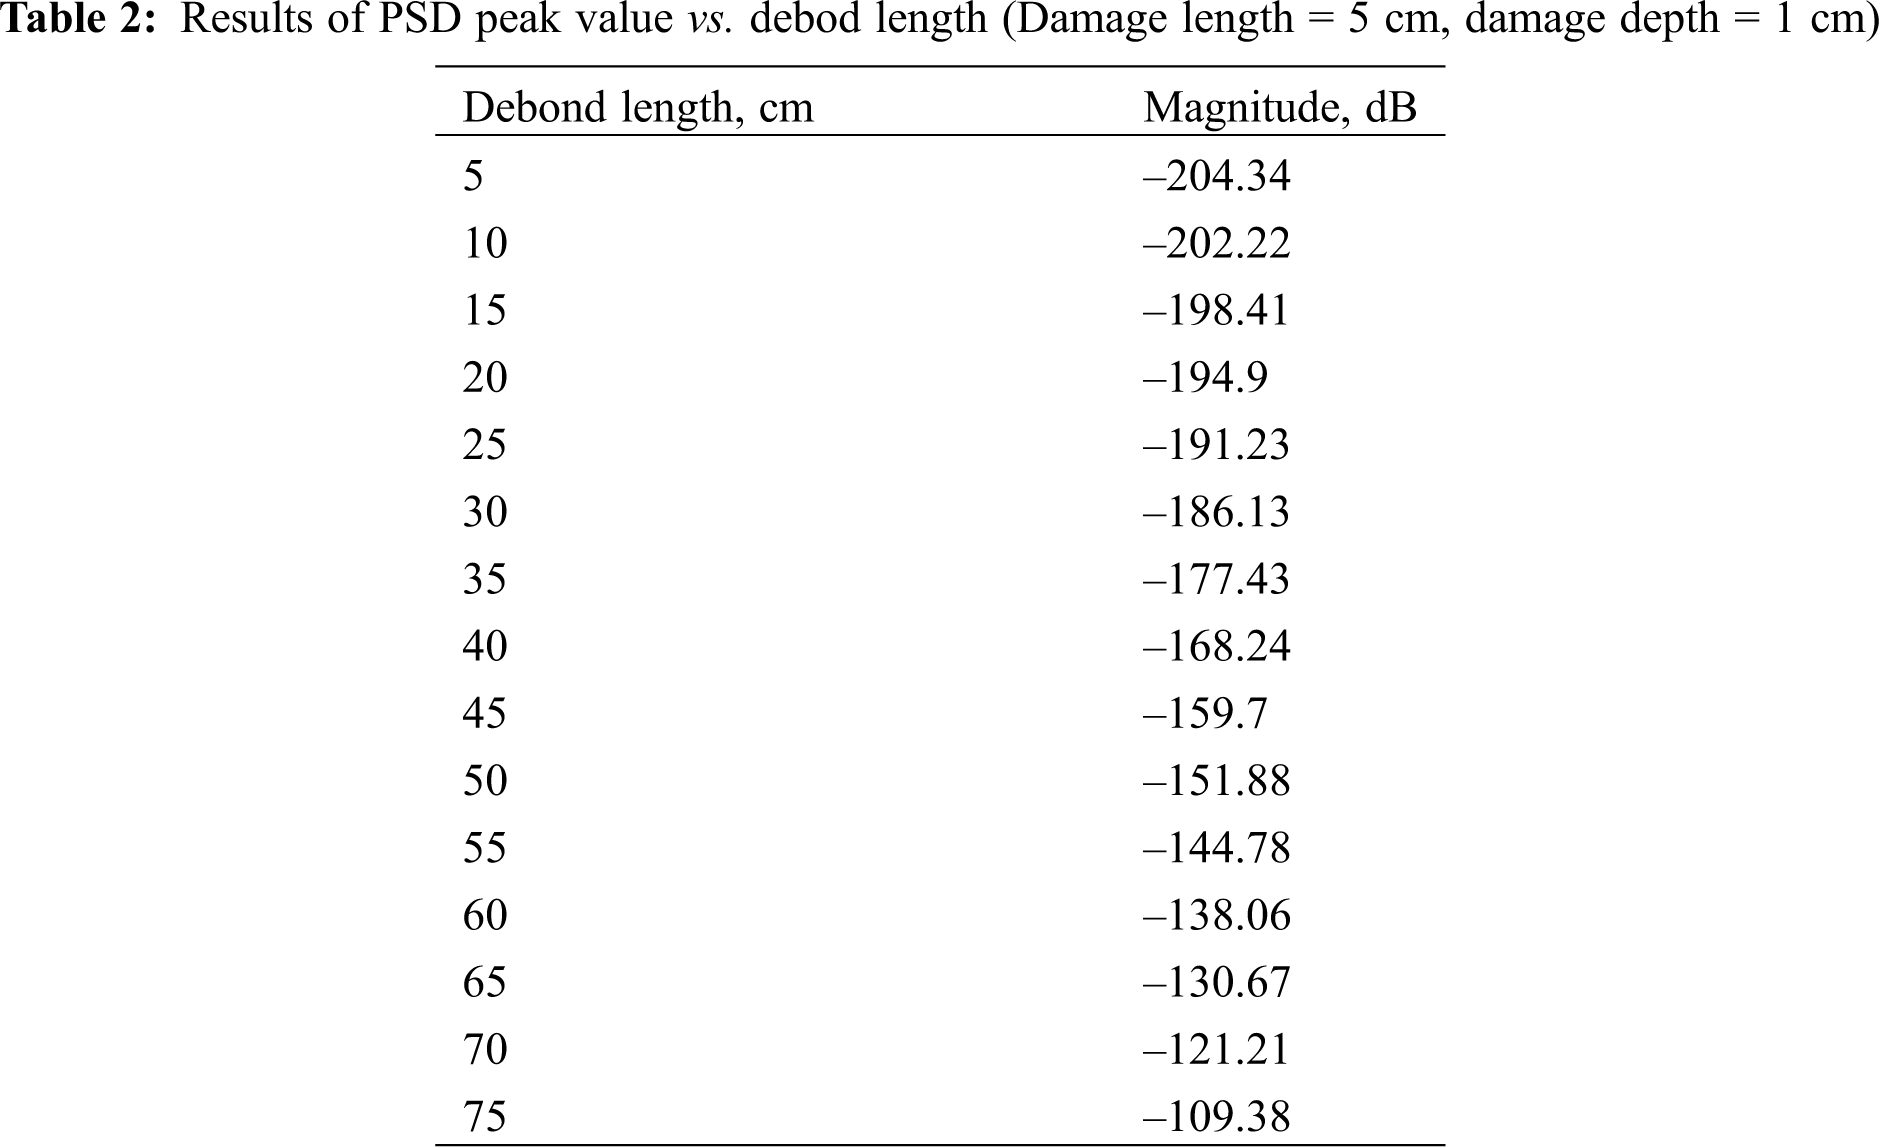
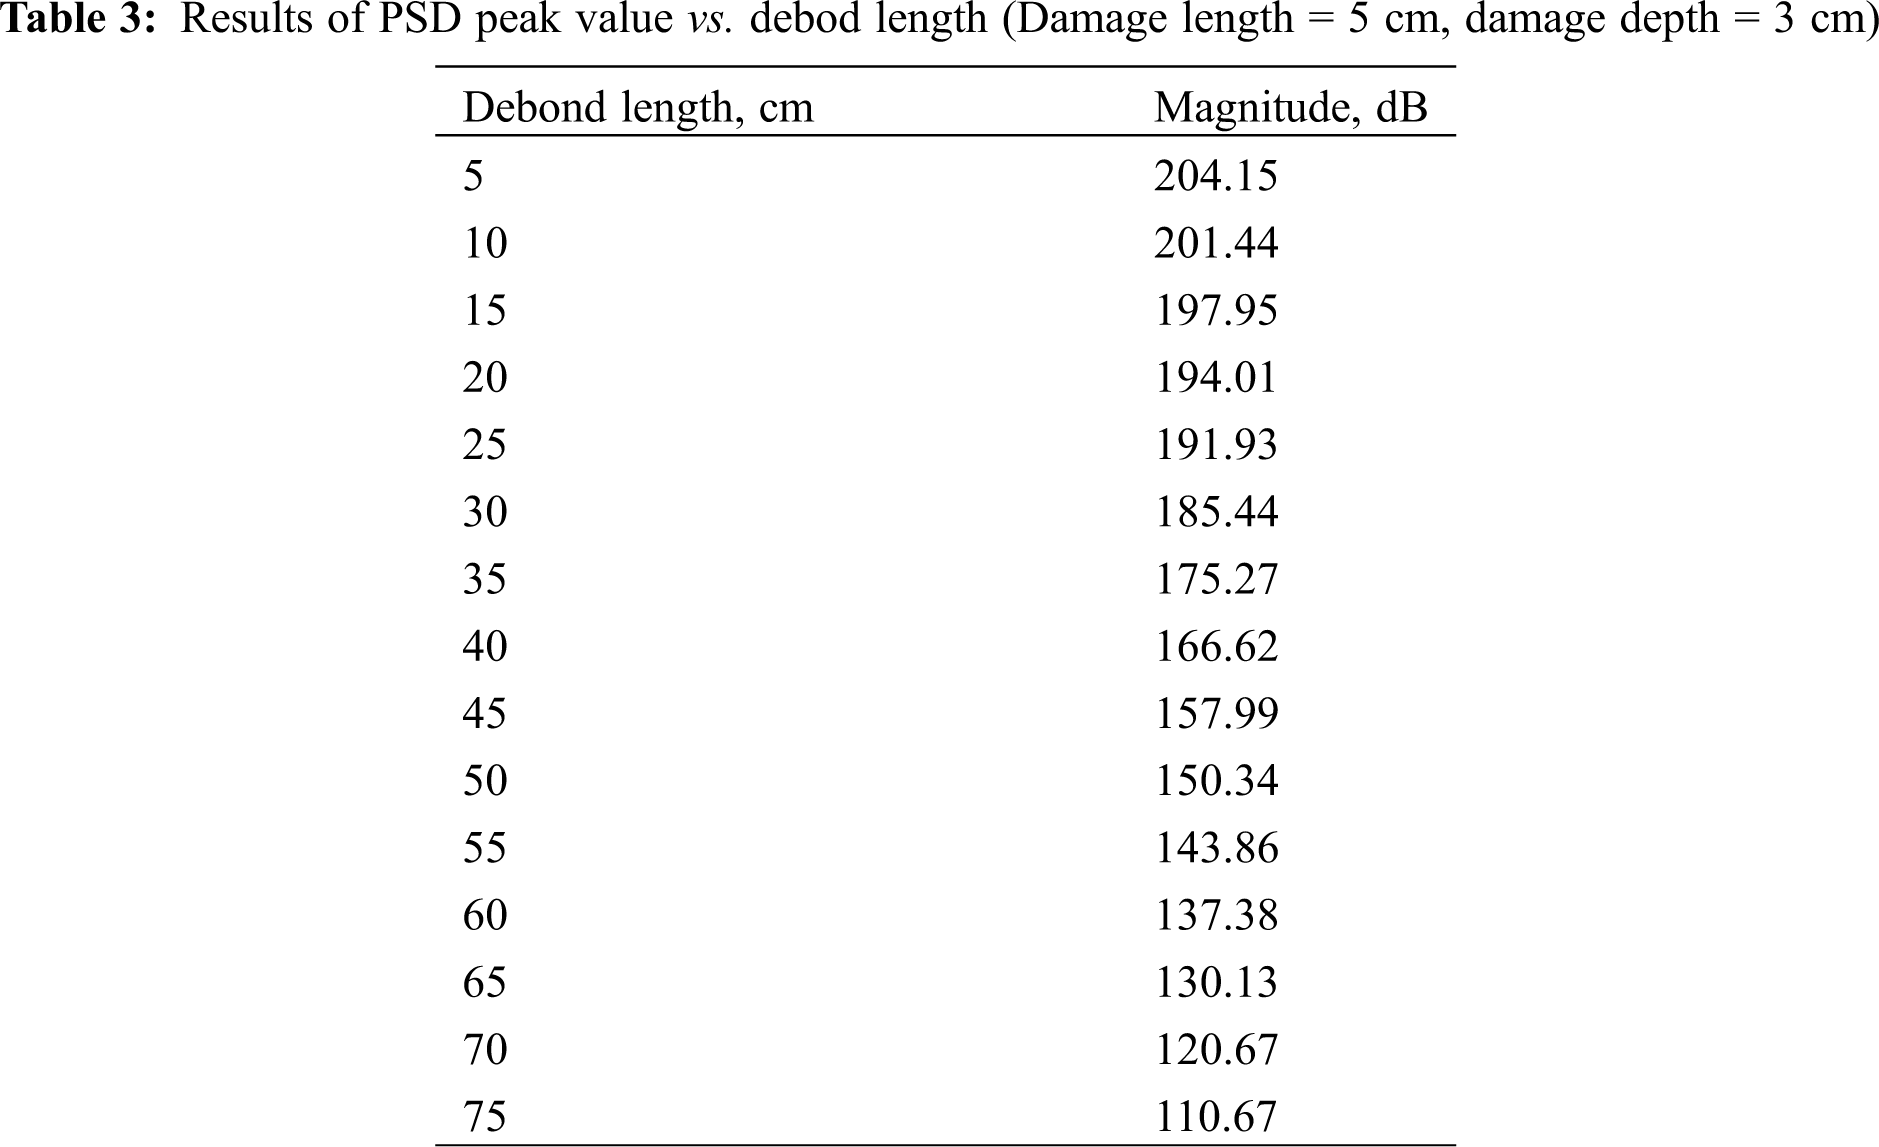
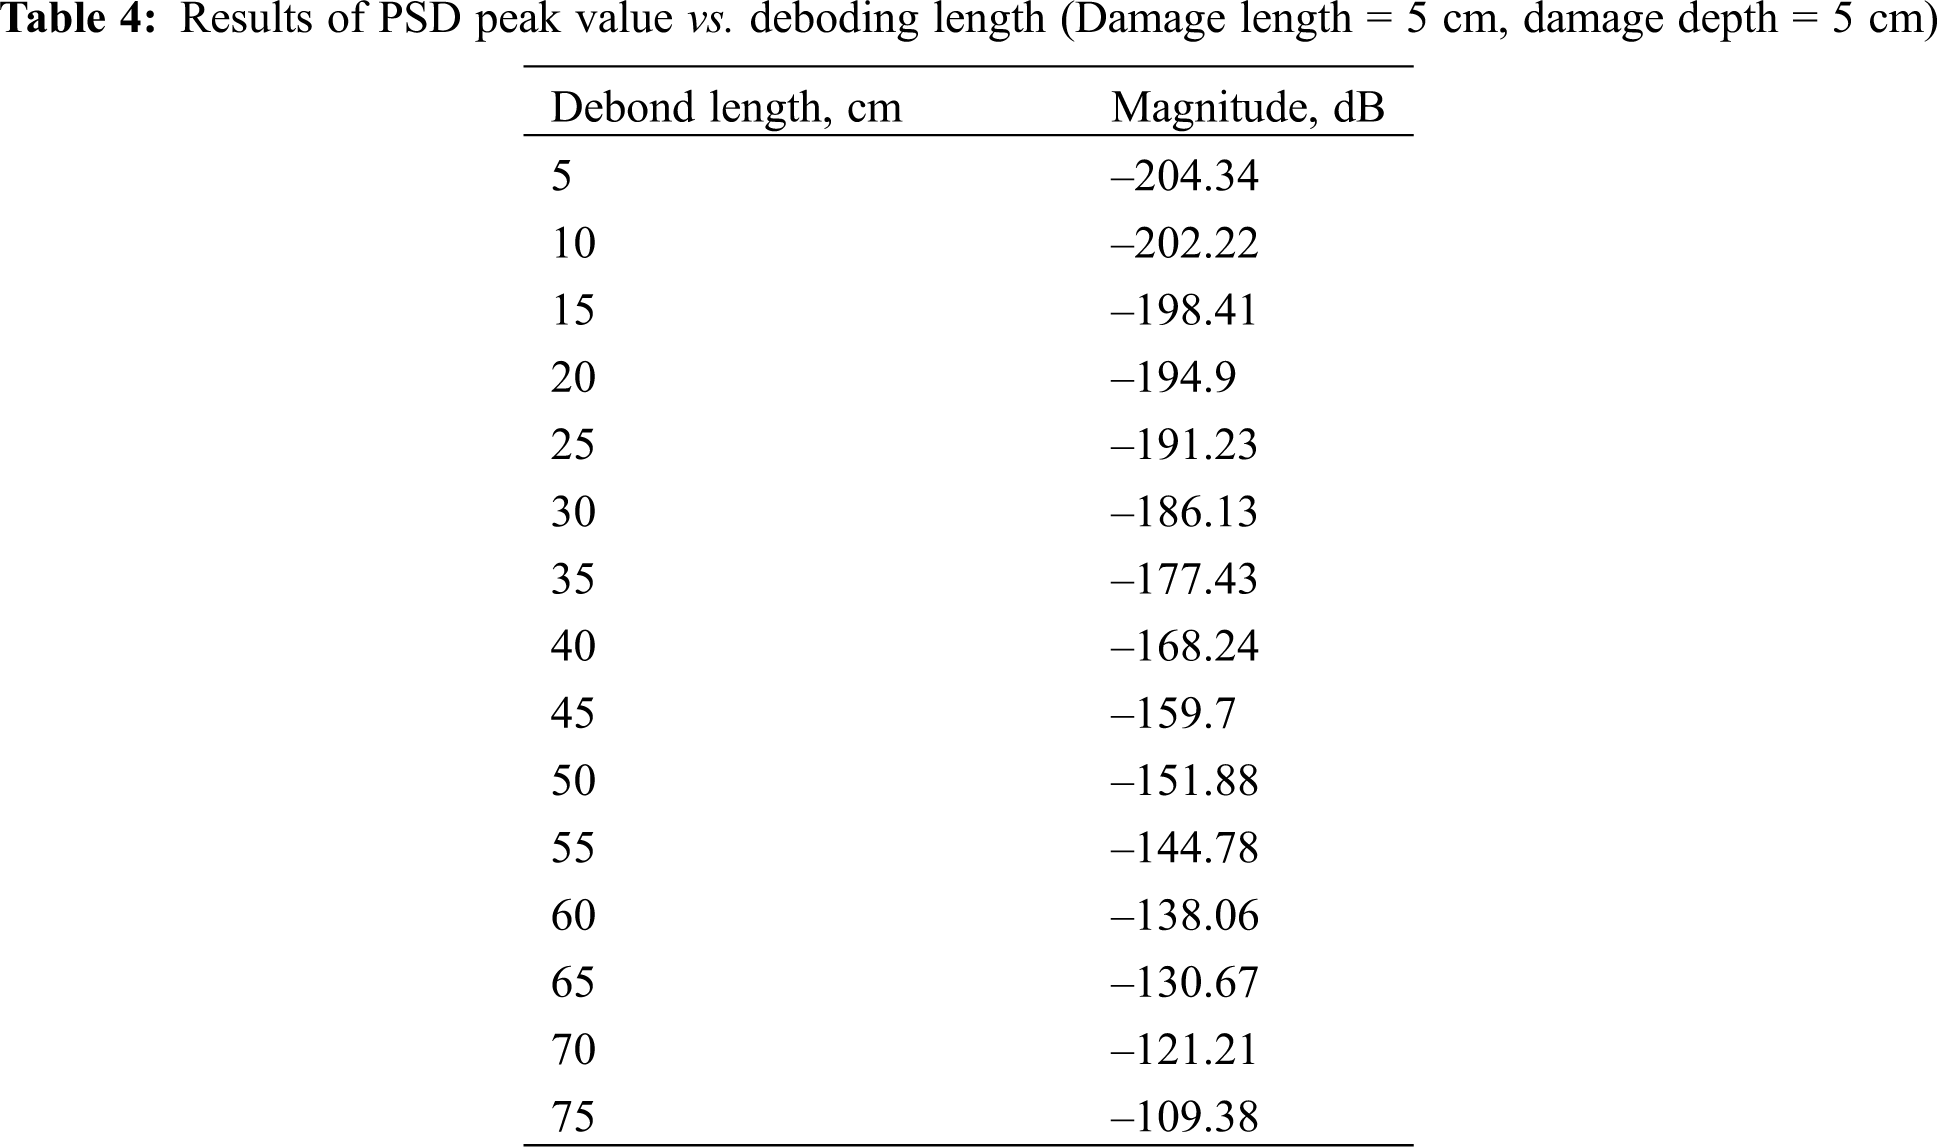
To determine the extent of damage in a quantitative method instead of the graphical method used in the previous section, Welch PSD estimate is used. Fig. 11 shows Welch PSD estimate results for a wave signals passing through a CFST columns with debond length of 5 and 15 cm, respectively. It can be noted easily the difference between the two results regarding the shape of the curves and the difference in the peak values of the magnitude. The peak values of the magnitude in these curves are (–204.34) and (–198.41), respectively. It was noted that the peak values of the magnitude decrease with the increase of debond length. The decrement percentage between the successive steps increased gradually with the increment of debond length. It is only (1.04%) between debond length 5 and 10 cm, (5.17%) between 35 and 40 cm, and (9.76%) between 70 and 75 cm, the results can be seen in Tab. 2. Similar results can be seen in Tabs. 3 and 4 having damage length 3 cm and 5 cm, respectively.
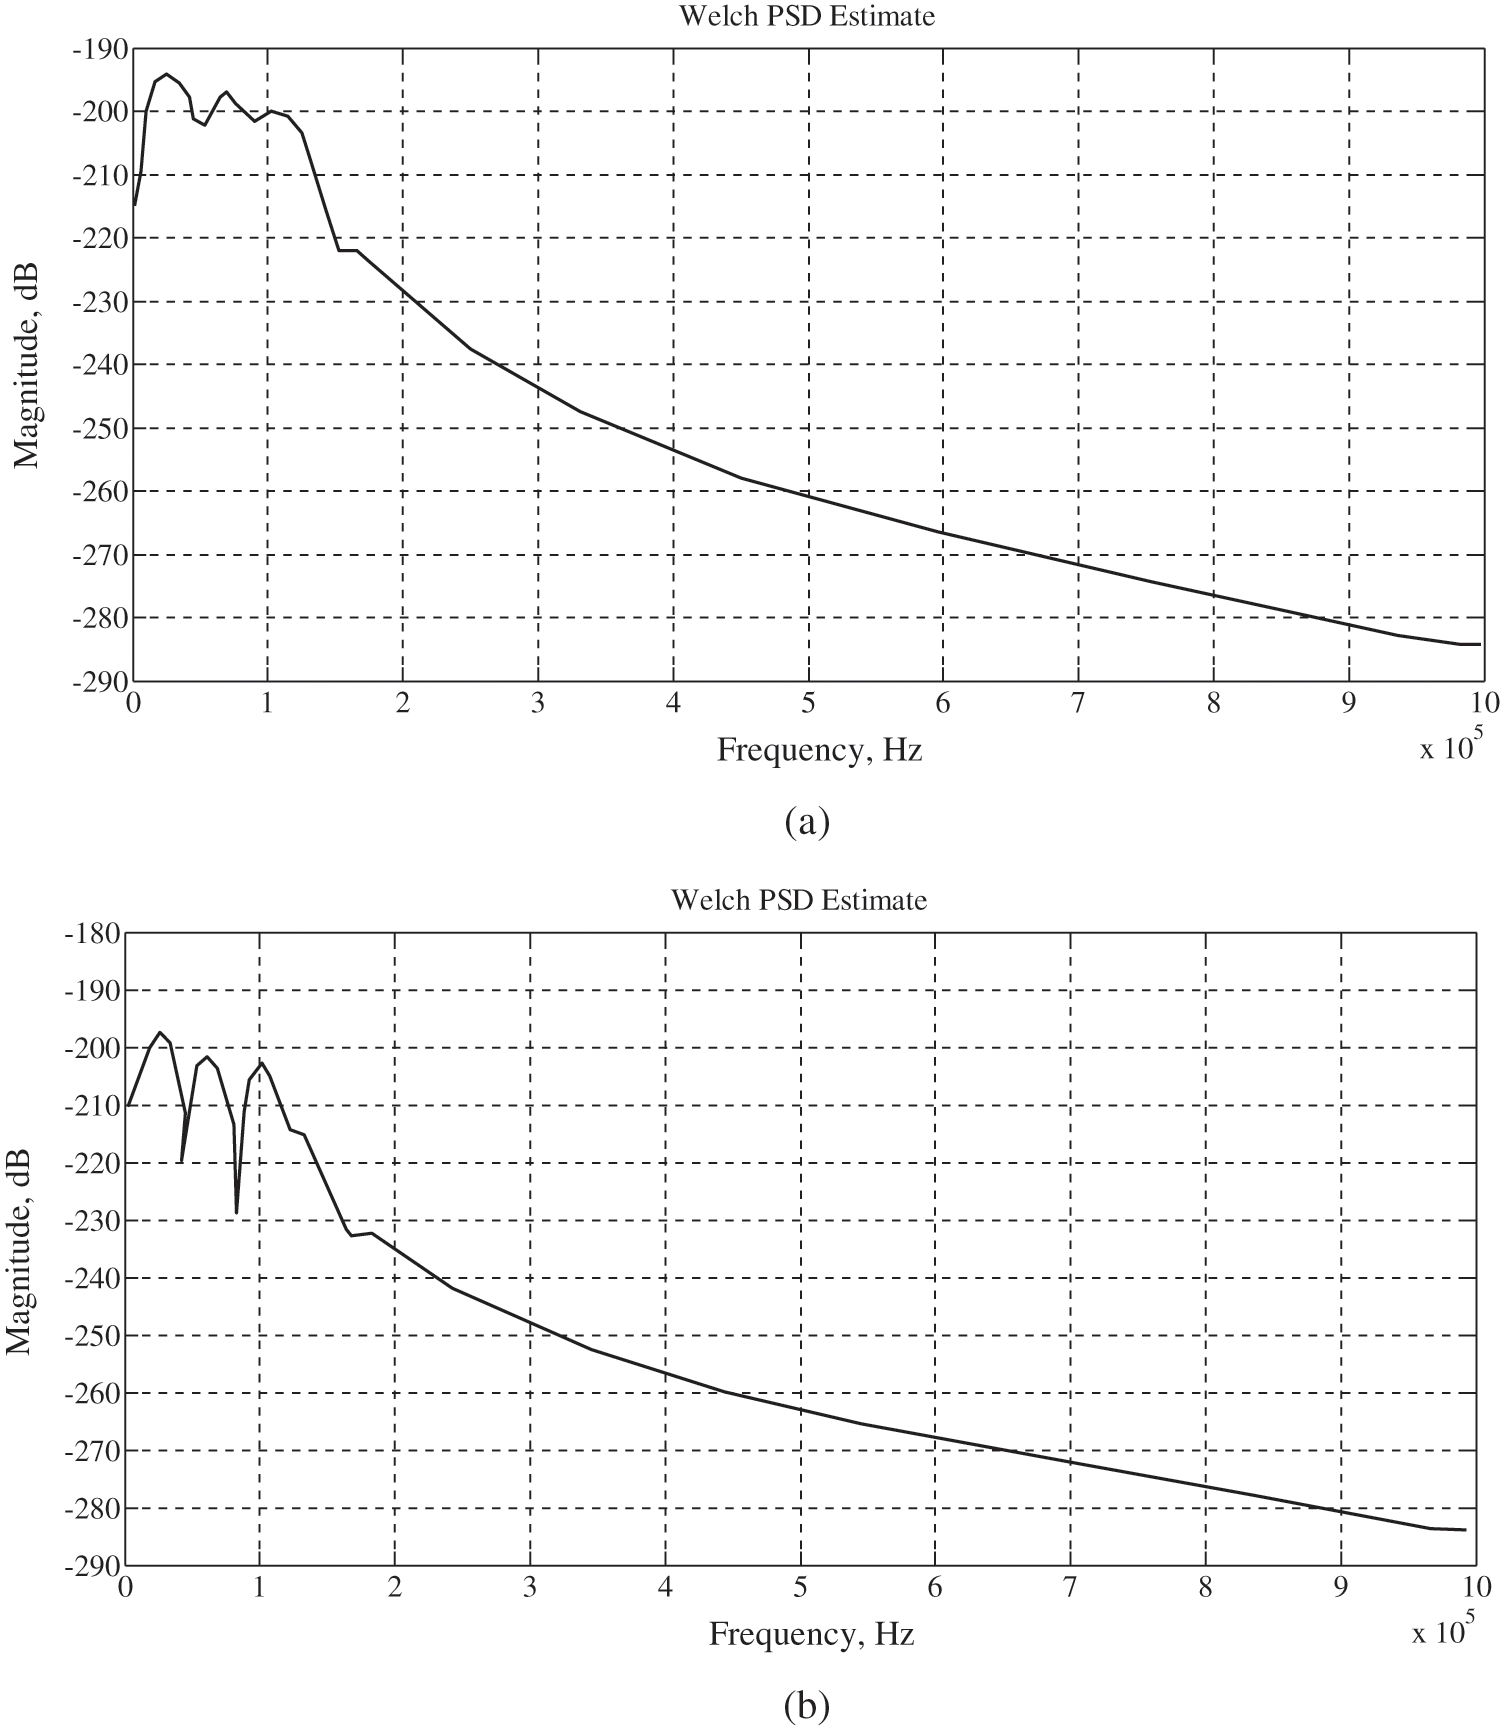
Figure 11: Welch PSD estimate with debond length: (a) 5 cm and (b) 15 cm
To make sense of the results of the peak value of the magnitude versus debond length in a mode of damage index having upward curve, these values have been inversed and then multiplied by (–1000). The resulting curve is proportional and very close to a second degree equation, as can be seen in Figs. 12–14. In these figures, three results with selected damage sizes with fixed 5–75 cm debond length and 1 cm, 3 cm, and 5 cm debond depth were exhibited to show the effect of debond depth. All of the selected cases showed a good proportionality with R2 factor as 0.9948, 0.9962, and 0.9968, respectively. However, the peak magnitude values in Tabs. 2–4 show an insignificant effect of the change in debond depth on the results.
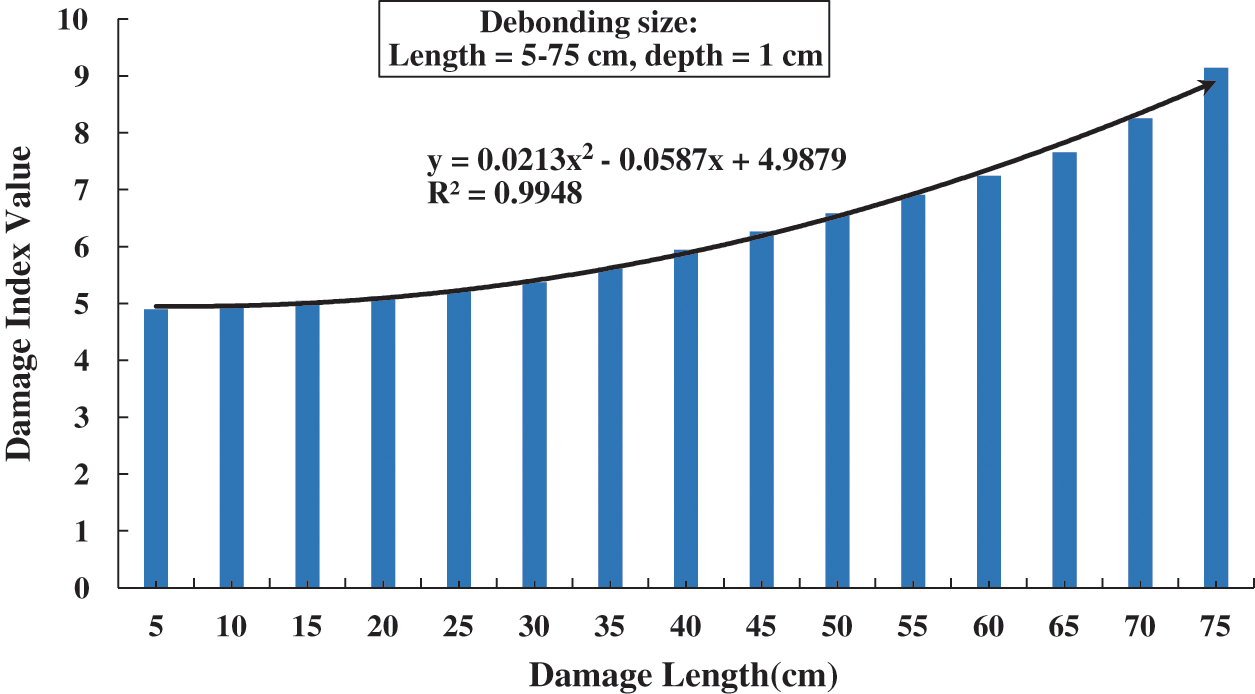
Figure 12: Damage index based on Welch PSD estimate for damage length 5–75 cm and damage depth 1 cm
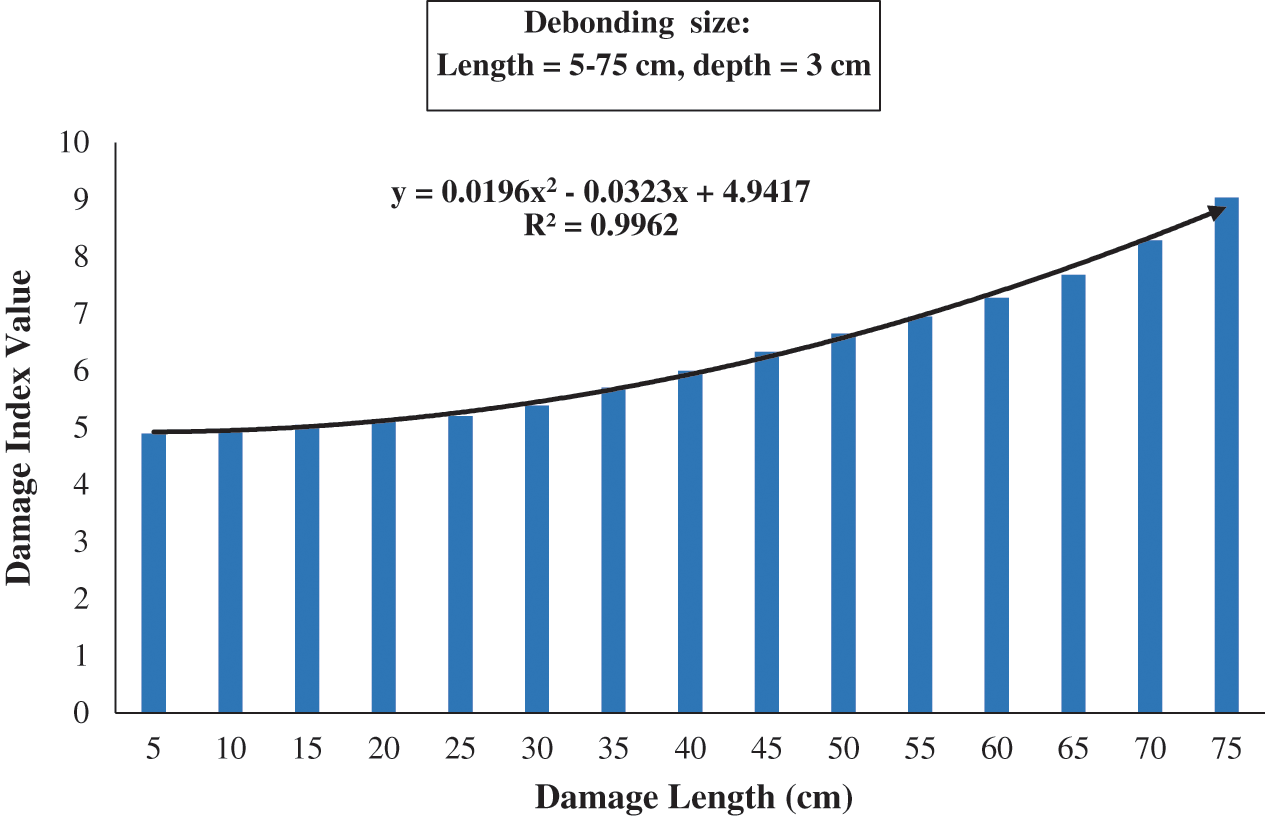
Figure 13: Damage index based on Welch PSD estimate for damage length 5–75 cm and damage depth 3 cm
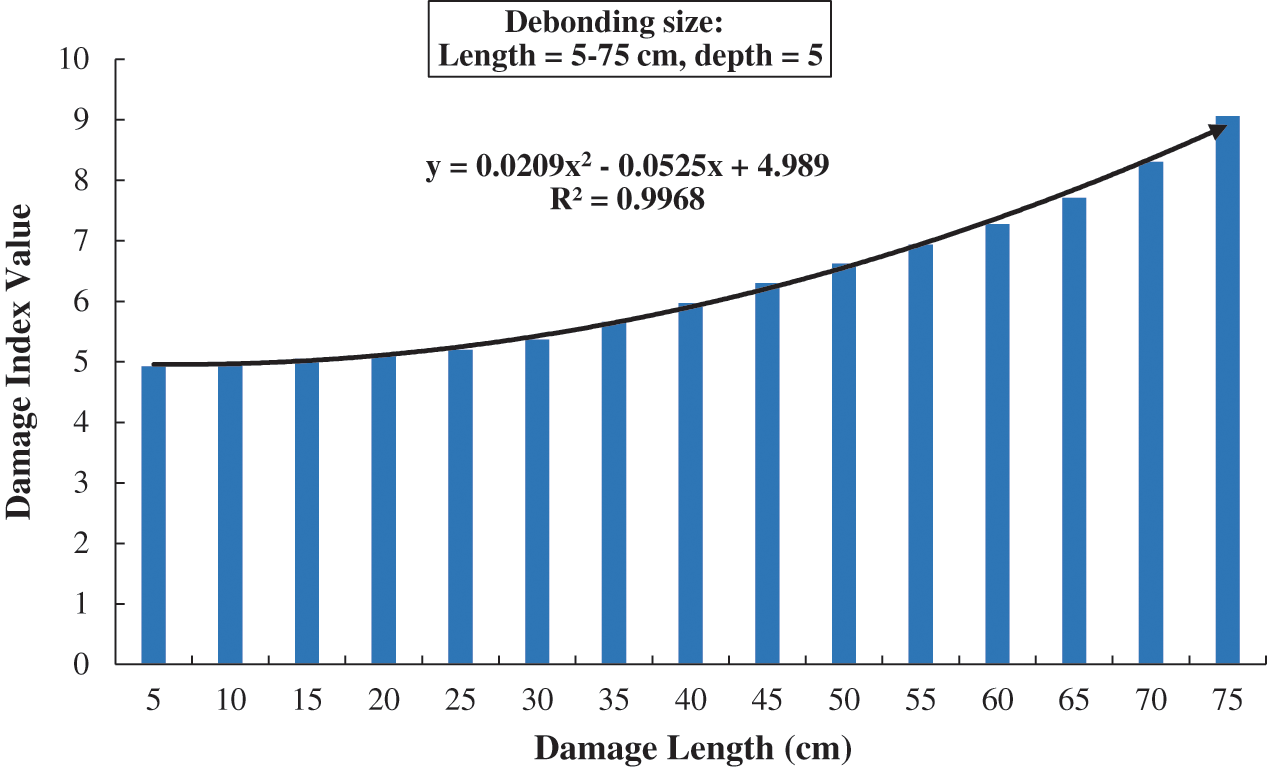
Figure 14: Damage index based on Welch PSD estimate for damage length 5–75 cm and damage depth 5 cm
Time domain raw signals shown in Fig. 15 below are selected for four signals with no crack case and 1, 3, and 5 mm crack width. The identification of each signal is easier than that in of debond damage. However, no suitable pattern is found to rely on the time domain analysis to investigate the crack size. To look for more convincing results, STFT technique is inspected in the next section.
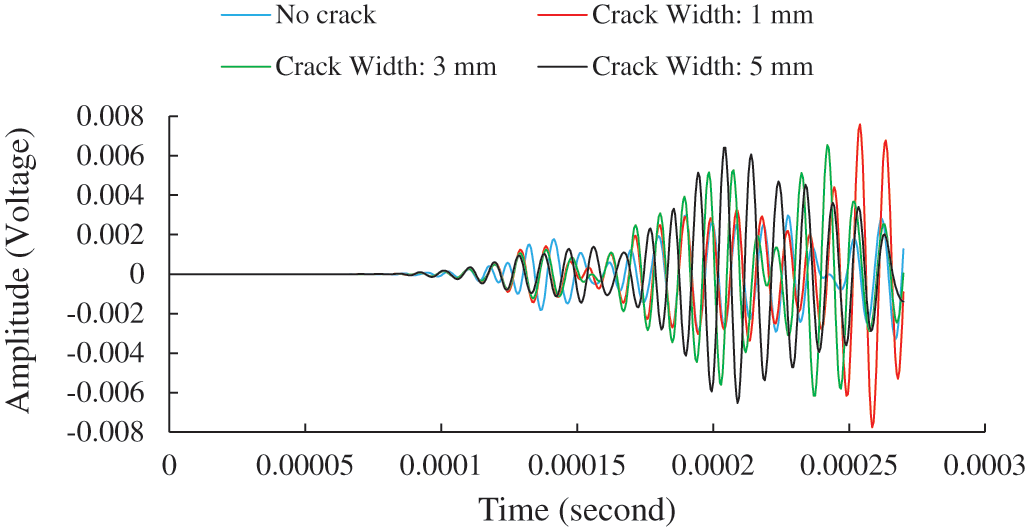
Figure 15: Time domain signal for testing sample with different crack width
4.2.1 STFT Spectrogram Results
Results of the STFT spectrogram shown in Fig. 16 below presents three cases one without crack and two with different crack size width, 1 and 5 mm. To identify the effect of crack progress on the signal, upper two bands of the each spectrogram are bounded by a box to make the comparison easier. It can be noted that bounded area of part (b) has more color variation of small strips similar to a comb’s teeth. This could be attributed to the fluctuation of signal energy due to the initiated crack. This is true for the bounded area of part (c) with more yellow color which means less energy because of the widening crack (i.e., 5 mm). Crack damage identification using this technique is not straightforward as it is in the debond detection. This could be attributed to the homogeneity of the path material the signal propagate on where the path of the excited signal in the case of debond detection is a steel cover of the CFST column whereas in the second case the path is mainly concrete core.
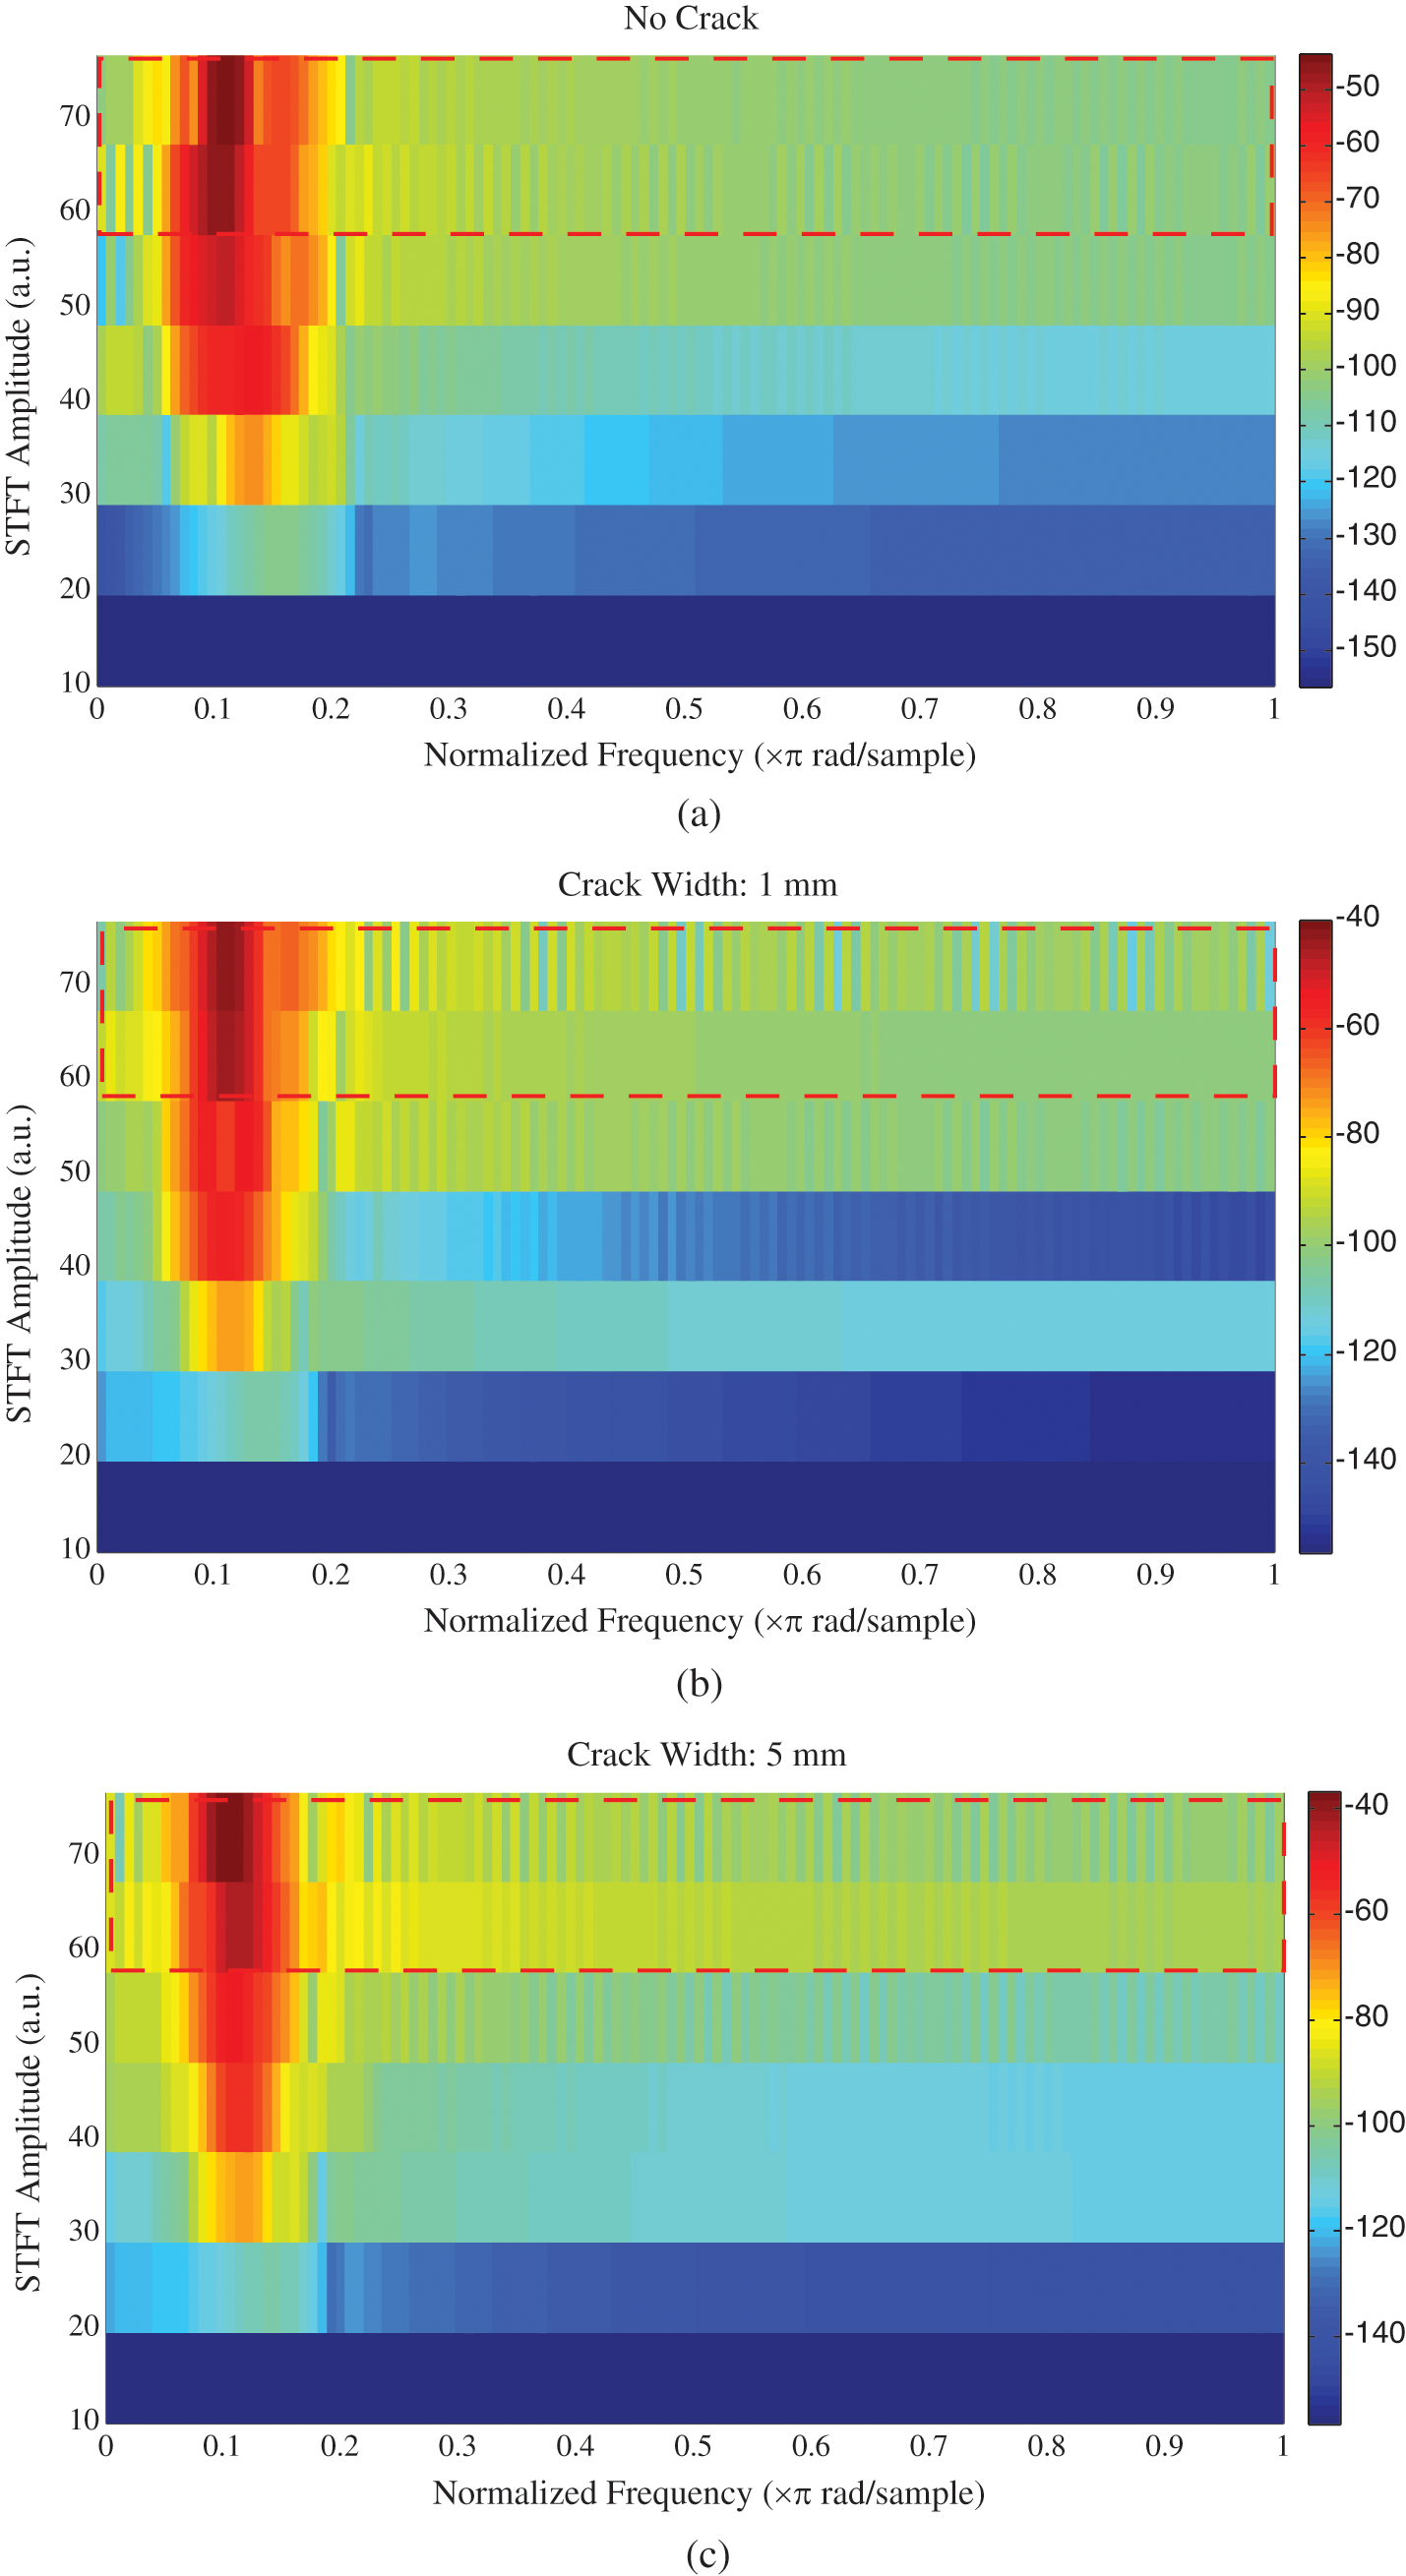
Figure 16: STFT spectrogram for different crack size, (a) No crack, (b) 1 mm, (c) 5 mm
4.2.2 Welch PSD Estimate Results
As in the case of debond detection, Welch PSD method is applied on the raw signals obtained from the simulation process for the case of crack size detection. Fig. 17 below shows the relation between cracks width and the damage index value for six values (i.e., 0–6 mm). Inconsistent values of crack width may belong to the same reasons affecting the STFT results. These include homogeneity of steel plate and inhomogeneity of concrete in the cases of debond and crack damages, respectively.
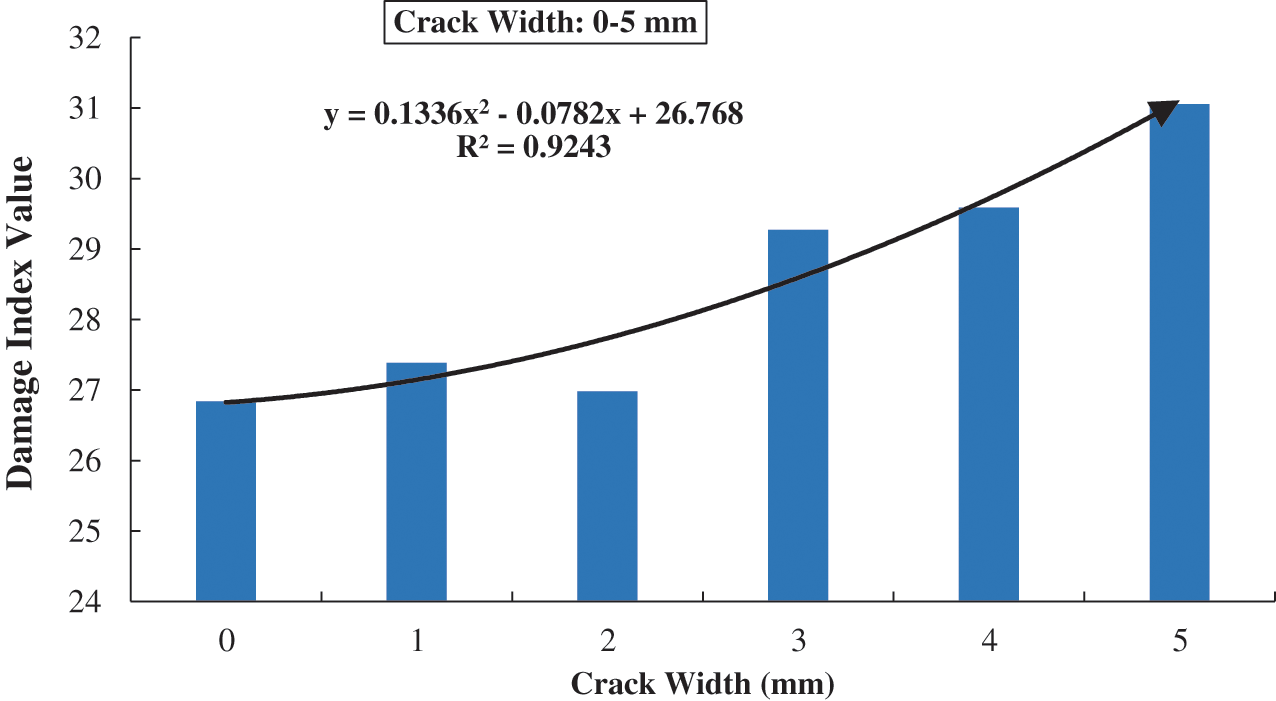
Figure 17: Damage index based on Welch PSD estimate for crack width 0–5 mm
In this study, debond detection between steel and concrete in CFST column has been investigated. A simulation study was adopted to conduct monitoring process by ultrasonic waves generated and received by piezoelectric sensors. Since time domain representation was not effective in debond identification, the ultrasonic wave signals were analysed using STFT spectrogram and Welch PSD periodogram. The first method was employed graphically to identify the expected damage whereas the latter was used to quantify the damage size through a suitable damage index. STFT spectrogram was successful in recognizing the different size debond based on the distribution change of the magnitude segments. The detection of damage and its size is subject to the change in colour scheme of the STFT spectrogram. The resulted images show that the increasing of frequency of the excited signal give a better results. Moreover, It was noticed that the change of debond depth has less effect on the image change of STFT spectrogram than the effect of the change of debond length. The change in the peak magnitude values in Welch periodogram is proportionate to the change of the debond size. The proportionality was of second order polynomial equation with R2 equal to 0.9948, 0.9962, and 0.9968 for the damage length 5–75 cm and damage depth 1 cm, 3 cm , and 5 cm. It was noted that the peak values of the magnitude decrease with the increase of debond length but almost no effect of the increasing of damage depth on these results. The decrement percentage of the successive steps increased gradually with the increasing of debond length. Crack width identification was carried out using the same signal processing techniques. However, these techniques have shown better capabilities in detection of debond than crack damages. This study concludes that it is worth using STFT and Welch PSD approaches in detection debond damage in CFST columns. It is recommended to extend this work to include more parameters taking into accounts new settings for the distribution of transmitting and receiving sensors.
Funding Statement: This research received no specific grant from any funding agency in the public, commercial, or not-for-profit sectors.
Conflicts of Interest: The authors declare that they have no conflicts of interest to report regarding the present study.
1. Ohlers, D. J., Bradford, M. A. (1999). Elementary behavior of composite steel and concrete structural members. 1st ed. Oxford: Butterworth-Heinemann. [Google Scholar]
2. Hutchins, D. A., Watson, R. L., Davis, L. A. J., Akanji, L., Billson, D. R. et al. (2020). Ultrasonic propagation in highly attenuating insulation materials. Sensors, 20, 2285. [Google Scholar]
3. Laureti, S., Ricci, M., Mohamed, M. N. I. B., Senni, L., Davis, L. A. J. et al. (2018). Detection of rebars in concrete using advanced ultrasonic pulse compression techniques. Ultrasonics, 85, 31–38. [Google Scholar]
4. Yan, S., Lin, J. Y., Zhang, B. W. (2018). Feasibility research on interface debond detection in concrete filled steel tubular columns using PZT-based guided waves. 16th Biennial International Conference on Engineering, Science, Construction, and Operations in Challenging Environments. Ohio. [Google Scholar]
5. Xu, B., Luan, L., Chen, H., Wang, J., Zheng, W. (2019). Experimental study on active interface debond detection for rectangular concrete-filled steel tubes with surface wave measurement. Sensors, 19, 3248. DOI 10.3390/s19153248. [Google Scholar] [CrossRef]
6. Ke, Y., Cheng, C., Lin, Y., Huang, C., Hsu, K. (2019). Quantitative assessment of bonding between steel plate and reinforced concrete structure using dispersive characteristics of lamb waves. NDT and E International, 102, 311–321. DOI 10.1016/j.ndteint.01.002. [Google Scholar] [CrossRef]
7. Mustapha1, S., Lu, Y., Li, J., Ye, L. (2014). Damage detection in rebar-reinforced concrete beams based on time reversal of guided waves. Structural Health Monitoring, 13(4), 347–358. DOI 10.1177/1475921714521268. [Google Scholar] [CrossRef]
8. Mutlib, N. K., Baharom, S., Nuawi, M. Z., El-Shafie, A. (2016). Ultrasonic surface wave monitoring for steel fibre-reinforced concrete using gel-coupled piezoceramic sensors: A case study. Arabian Journal for Science and Engineering, 41. DOI 10.1007/s13369-015-1925-1. [Google Scholar] [CrossRef]
9. Benedetti, I., Milazzo, A., Aliabadi, M. (2009). Structures with surface-bonded PZT piezoelectric patches: A BEM investigation into the strain-transfer mechanism for SHM applications. Structural Durability & Health Monitoring, 5(3), 251–274. [Google Scholar]
10. Yang, X., Chen, S., Sun, F., Jin, S., Chang, W. (2013). Simulation study on the acoustic field from linear phased array ultrasonic transducer for engine cylinder testing. Computer Modeling in Engineering & Sciences, 90, 487–500. [Google Scholar]
11. Tagami, M. (2008). Non-destructive inspection for weld joint of steel structure. Welding International, 22, 77–81. [Google Scholar]
12. Malaeb, R. A., Mahfoud, E. N., Harb, M. S. (2018). Decomposition of fundamental lamb wave modes in complex metal structures using COMSOL. Excerpt from the Proceedings of the COMSOL Conference. Lausanne. [Google Scholar]
13. Xu, B., Chen, H., Xia, S. (2017). Numerical study on the mechanism of active interfacial debonding detection for rectangular CFSTs based on wavelet packet analysis with piezoceramics. Mechanical Systems and Signal Processing, 86, 108–121. DOI 10.1016/j.ymssp.2016.10.002. [Google Scholar] [CrossRef]
14. Zhao, G., Zhang, D., Zhang, L., Wang, B. (2018). Detection of defects in reinforced concrete structures using ultrasonic nondestructive evaluation with piezoceramic transducers and the time reversal method. Time Reversal Method, Sensors, 18, 4176. DOI 10.3390/s18124176. [Google Scholar] [CrossRef]
15. Xu, B., Zhang, T., Song, G., Gu, H. (2013). Active interface debonding detection of a concrete-filled steel tube with PZT techniques using wavelet packet analysis. Mechanical Systems and Signal Processing, 36, 7–17. DOI 10.1016/j.ymssp.07.029. [Google Scholar] [CrossRef]
16. Mutlib, N. K., Baharom, S. (2018). Quantification of delamination in a composite floor using a novel damage index. Nondestructive Testing and Evaluation, 33(4), 405–426. DOI 10.1080/10589759.2018.1484919. [Google Scholar] [CrossRef]
17. Meng, C., Jia, Y., Geng, C., Dong, C., Wang, Y. (2019). Research on the damage condition of reinforced concrete filled steel tubes under axial load using ultrasonic testing. Engineering Mechanics, 36(10), 172–179. DOI 10.6052/j.issn.1000-4750.2018.10.0576. [Google Scholar] [CrossRef]
18. Yan, S., Fu, J., Sun, W., Qi, B., Liu, F. (2014). PZT-based detection of compactness of concrete in concrete filled steel tube using time reversal method. Mathematical Problems in Engineering, 14, 1–11. DOI 10.1155/2014/909682. [Google Scholar] [CrossRef]
19. Ye, F., Zha, X., Wang, H. (2011). The application of A HHT based ultrasonic detecting method in quality assessment of CFST. Advanced Steel Construction, 7(2), 182–191. [Google Scholar]
20. Benammar, A., Drai, R., Guessoum, A. (2014). Ultrasonic flaw detection using threshold modified S-transform. Ultrasonics, 54(2), 676–683. [Google Scholar]
21. Liu, N., Xi, J., Zhang, X., Liu, Z. (2017). Damage detection of simply supported reinforced concrete beam by S transform. 2nd International Conference on Materials Science, Energy Technology and Environmental Engineering, vol. 18. [Google Scholar]
22. Li, Z., Zhang, W., Gong, K. (2009). Wavelet-based inclusion detection in cantilever beams. Computers, Materials & Continua, 9, 209–228. [Google Scholar]
23. Wongsaroj, W., Hamdani, A., Thong-un, N., Takahashi, H., Kikura, H. (2019). Extended short-time Fourier transform for ultrasonic velocity profiler on two-phase bubbly flow using a single resonant frequency. Applied Sciences, 9(1), 50. DOI 10.3390/app9010050. [Google Scholar] [CrossRef]
24. Petro, J. T., Kim, J. (2011). Detection of delamination in concrete using ultrasonic pulse velocity test. Construction and Building Materials, 26, 574–582. [Google Scholar]
25. Song, G., Gu, H., Mo, Y. (2008). Smart aggregates: Multi-functional sensors for concrete structures—A tutorial and a review. Smart Materials and Structures, 17, 033001. [Google Scholar]
26. Park, S. (2008). Structural health monitoring for critical members of civil infrastructures using piezoelectric active sensors, in civil and environmental engineering (Ph.D. Thesis). Korea Advanced Institute of Science and Technology. [Google Scholar]
27. Krejcar, O., Frischer, R. (2011). Non destructive defect detection by spectral density analysis. Sensors, 11, 2334–2346. DOI 10.3390/s110302334. [Google Scholar] [CrossRef]
28. Ribeiroa, R. R., Lameiras, R. M. (2019). Evaluation of low-cost MEMS accelerometers for SHM: Frequency and damping identification of civil structures. Latin American Journal of Solids and Structures, 16(7), 1–24. DOI 10.1590/1679-78255308. [Google Scholar] [CrossRef]
29. Vamvoudakis-Stefanou, J. K., Sakellariou, J. S., Fassois, S. D. (2014). Output-only statistical time series methods for structural health monitoring: A comparative study. Le Cam, Vincent and Mevel, Laurent and Schoefs, Franck. EWSHM–7th European Workshop on Structural Health Monitoring. Nantes, France. [Google Scholar]
30. Huston, D. (2011). Structural sensing, health monitoring, and performance evaluation. USA: CRC Press. [Google Scholar]
31. Sandsten, M. (2016). Time-frequency analysis of time-varying signals and non-stationary processes (Lecture Notes). Lund, Sweden: Lund University. http://www.maths.lu.se/fileadmin/maths/personal_staff/mariasandsten/TFkompver2.pdf. [Google Scholar]
32. Karabiyik, Y. (2017). Quantitative Doppler analysis using color flow imaging and adaptive signal processing (Ph.D. Thesis). Norges teknisk-naturvitenskapelige universitet (NTNUTrondheim. [Google Scholar]
 | This work is licensed under a Creative Commons Attribution 4.0 International License, which permits unrestricted use, distribution, and reproduction in any medium, provided the original work is properly cited. |