Health Monitoring
| Structural Durability & Health Monitoring |
DOI: 10.32604/sdhm.2021.011193
ARTICLE
Experimental and Numerical Assessment on Seismic Performance of Earth Adobe Walls
1International Institute for Urban Systems Engineering, Southeast University, Nanjing, 210096, China
2Department of Mechanical Engineering, California Polytechnic State University, San Luis Obispo, CA 93405, USA
3Department of Mechanical Engineering, Faculty of Engineering, Alexandria University, Alexandria, 21544, Egypt
*Corresponding Author: Wael A. Altabey. Email: wael.altabey@gmail.com
Received: 25 April 2020; Accepted: 16 September 2020
Abstract: Earth buildings are common types of structures in most rural areas in all developing countries. Catastrophic failure and destruction of these structures under seismic loads always result in loss of human lives and economic losses. Wall is an important load-bearing component of raw soil buildings. In this paper, a novel approach is proposed to improve the strength and ductility of adobe walls. Three types of analyses, material properties, mechanical properties, and dynamic properties, are carried out for the seismic performance assessment of the adobe walls. These performed studies include that, material properties of the earth cylinder block, mechanical properties of adobe walls under quasi-static loads, and dynamic performance of adobe walls excited by seismic waves. On investigation of material properties, eighteen cylindrical specimens with a diameter of 100 mm and a height of 110 mm were divided into three groups for compressive, tensile, and split pull strength tests, respectively. The results of the three groups of tests showed that the yield strength ratios of compressive, tensile, and shear strength were about 1:0.3:0.2. In order to study the performance of structural components, three 1/3 scale model raw soil walls with a dimension of 1,200 mm in width, 1,000 mm in height, and 310 mm in thickness were tested under cyclic loading. The average wall capacity of the wall obtained by the test was about 13.5 kN and the average displacement angle was about 1/135. The numerical simulation experiment is used to explore the mechanism of structural failure. A three-dimensional finite element model is established by choosing the material parameters based on the above test outcomes. The accuracy of the numerical simulation experiment is verified by simulation and comparison of the above quasi-static test results. Further, the collapse process of raw soil wall under a seismic wave is simulated for exploring the response and damage mechanism of structure. Based on those systematically analyzed, some useful suggested guidelines are provided for improving the seismic performance of raw soil buildings.
Keywords: Raw soil wall; quasi-static experiment; cylindrical specimen; ANSYS/LS_DYNA; collapse
Soil is a low-cost raw construction material, which can be recycled after demolition and has excellent performance for thermal insulation. This material is still widely used as a construction material in developing countries [1–5]. Due to the construction of traditional adobe masonry houses based on practical experience and traditions, currently, there is no reasonable design procedure for their reinforcement. For these reasons, adobe masonry structures suffer serious structural damage or even collapse under an earthquake [6–10]. The special attention to the seismic safety and performance of these structures is an urgent issue. Therefore, a study on the effect of seismic reinforcement of raw soil structures would potentially improve the quality of life in those regions, where this form of construction is dominant [11–30]. There is no standard technical specification in China or other developing countries for the experimental evaluation of the mechanical properties of soil materials. Moreover, the compressive and tensile strength of soil materials is relatively low. The nonstandard test causes a significant influence on the experimental results.
Because the friction between the test specimen and the press constrains the transverse deformation of the specimen, the various parts of the test specimen are in different stress states. The “hoop effect” has a significant influence on the strength of the cubic specimen. In this paper, cylindrical specimens are innovatively fabricated to improve the compressive stress state of the specimens. The cylindrical specimens can be used to reduce the influence of the “hoop effect.” In addition, the specimens are sufficiently compacted in the process of fabrication. The compaction process can significantly reduce the dispersion of experimental results. The experiments are conducted following the standards for the soil test method [31], i.e., standardized compaction of cylindrical specimens. So the implementation of the adopted approach shows a significant reduction in the dispersion in all experimental results. The proposed production process is also in line with the actual construction process of raw soil buildings, such as rammed earth or adobe masonry houses, which require different degrees of compaction on the rammed earth wall or adobe masonry in the production process. The physical experimental results are also verified by finite element analysis, it is demonstrated that the proposed approach can be helpful in practical applications and improve the seismic resistance of earth structures.
As the significant load-bearing member of raw soil buildings, the adobe wall damage often leads to the overall damage of the structure [32–36]. According to the quasi-static experiments, the adobe wall’s ultimate bearing capacity and failure mode can be obtained. The finite element study is adopted in conjunction with the experimental studies, and the soil material test outcome was used in the model parameters of finite element analysis (ANSYS/LS_DYNA). This numerical model developed using experimental data, and the accuracy of the numerical model was verified by comparison the quasi-static results. Furthermore, the earthquake-induced collapse of the adobe wall was also simulated by a numerical simulation experiment. The collapse mechanism of the adobe wall could be explored. Some improved suggestions for strengthening the adobe wall are given. The strengthening measures can increase the bearing capacity of the adobe wall and change its failure mode [37–50].
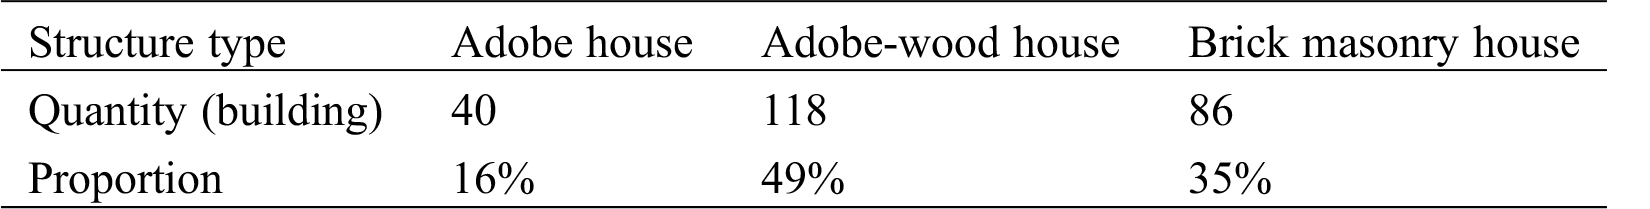
In China, raw soil buildings are mainly distributed in the northwest of the country. Kashgar city and its surrounding areas in Xinjiang are more widely distributed. This area is deep inland, far from the sea, cold and dry in winter, with high temperature and rainless in summer. The survey of 244 rural dwellings has shown that adobe houses and adobe-wood houses account for a considerable proportion of rural dwellings of Kashgar city areas. The distribution of those houses is shown in Tab. 1.
Table 1: Distribution of residential structure types in rural areas of Kashgar
However, the area is located at the edge of the interaction between the Eurasian and Indian plates, with unique structural sites and strong crustal movements, it makes a region of intense and frequent seismic activity. The earthquake disasters have shown that houses in the areas will suffer severe damage or even collapse. Therefore, the present study is focusing on the seismic performance of the raw soil buildings. The significance of this study ensures the safety of the residents living in the adobe masonry buildings and reduces the loss of property and human lives and improves the quality of life and promotes the stability of the local community.
2 Experiment of Cylinder Specimen
The soil materials for the specimens were taken from the suburb of Kashgar City, Xinjiang; the main physical properties are shown in Tab. 2. Presently, there is no uniform test technique to determine the compressive and tensile strength of soil materials. According to the standard for soil test method [31], the cylindrical specimens are innovatively fabricated by sufficiently compacted to improve the compressive stress state of the specimens and reduce the dispersion of experimental results. Firstly, the soil material is thoroughly air-dried, mixed with water according to the optimal water content of the soil material, sealed for 24 h. Subsequently, the mixture is evenly divided into three layers in a cylindrical mold with a diameter of 100 mm, high of 110 mm, 25 times compaction per layer. Finally, the mold is removed by shoveling the upper surface with a spatula. The test specimens are cured at room temperature for 28 days. The inner structure of the specimen is denser due to compaction, as shown in Fig. 1. The density of the specimens is presented in Tab. 3.
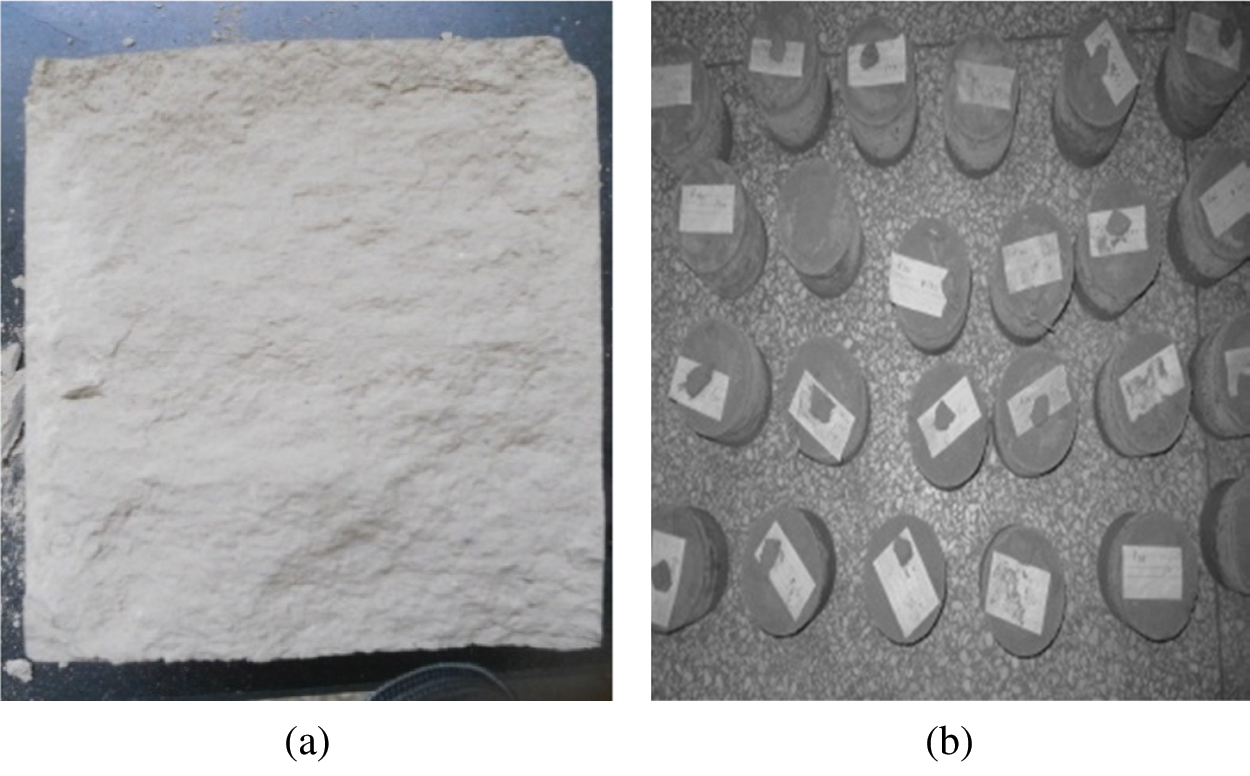
Figure 1: Cylindrical specimen (a) Internal structure, (b) Maintenance of the specimen
Table 2: Physical properties of raw soil materials
Table 3: Number and density of cylinders
2.2 Experimental Instruments and Loading Scheme
A 300t microcomputer servo press is used in this research. For evaluating the compressive strength, the loading method is the standard test method for finding the mechanical properties of concrete. Before the formal experiment, in order to calibrate the compressor, the compressor was pre-stressed. The pre-loading load was 1 kN, which assured that the entire experimental apparatus, i.e., the plate exerting the compressive load, was in close and uniform contact with the specimen before starting the experiment. The experimental process adopts the gradual loading method. The applied load in each stage is 10% of the estimated failure load value, the average loading speed is 0.5 kN/min, and the subsequent stage load is applied after 1 min. After each pressurized specimen is loaded to 85% of the estimated damage load value, it is continuously loaded at the original loading rate until the stress value drops to 85% of the peak stress, then the experiment is ended.
σ represents the test strength, and σmax represents the ultimate strength. The testing procedure and results can be observed. When σ < 0.55 σmax, the increase of stress is approximately proportional, the load and displacement curves are linear elastic, and there are no visible cracks on the specimen’s surface. As the load continued to increase, small cracks at both ends of the specimen began to appear. These tiny cracks quickly propagate into the middle of the specimen, and it is a brittle failure process, so the crack development process is very fast, as shown in Fig. 2a. When σ was gradually increased to (0.55~0.60) σmax, the through cracks began to appear, the edge of the specimen is slumped, as shown in Fig. 2b. The test results are shown in Tab. 4.
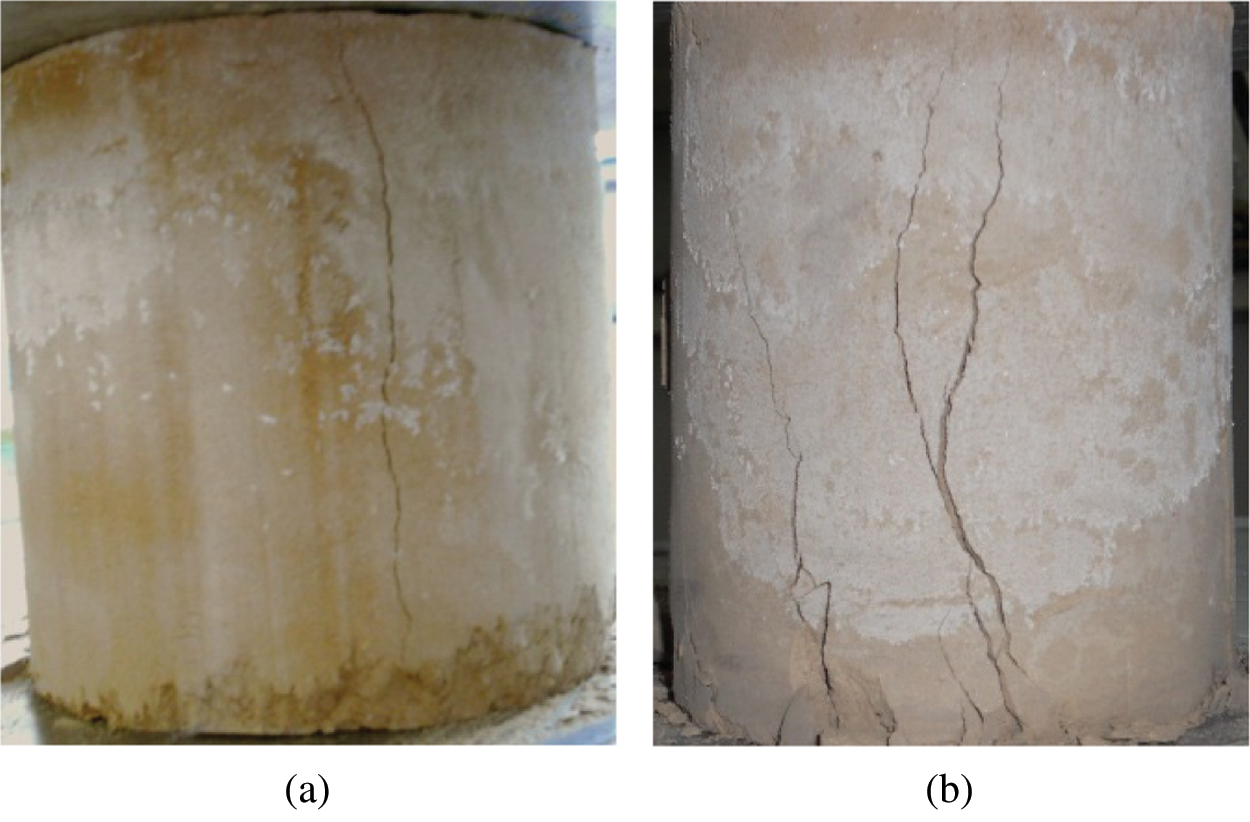
Figure 2: Crack evolution during a compression test (a) Initial crack, (b) Through cracks
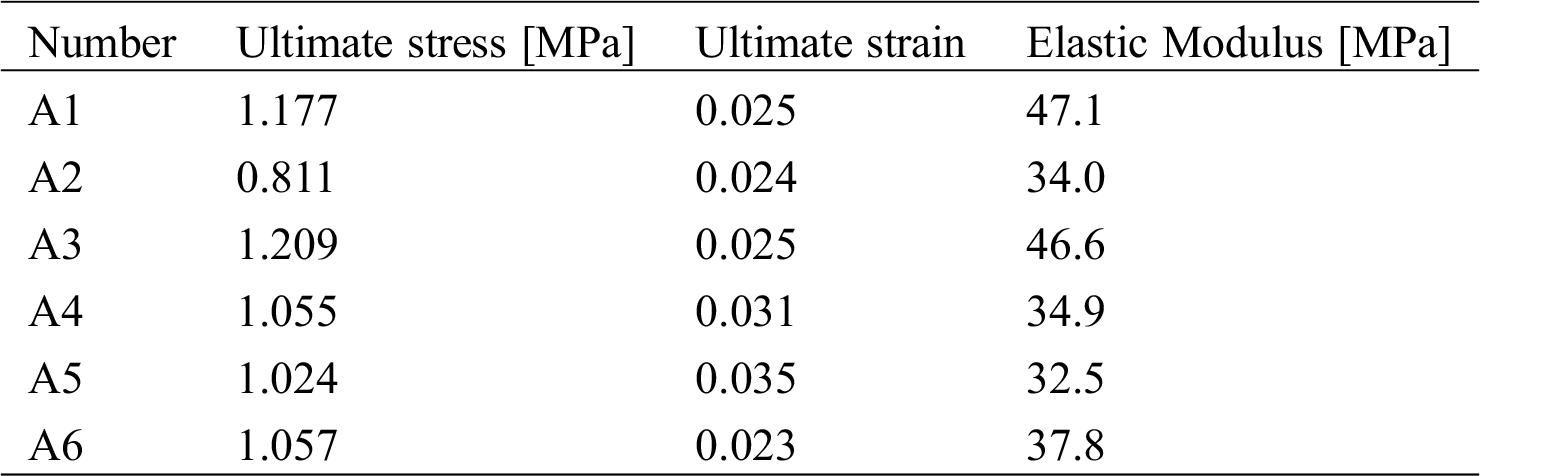
Table 4: Compression test result
The tensile test was conducted using the indirect tensile method, the split pull test was carried out, and the normal stress for the test results was processed by the splitting test formula,
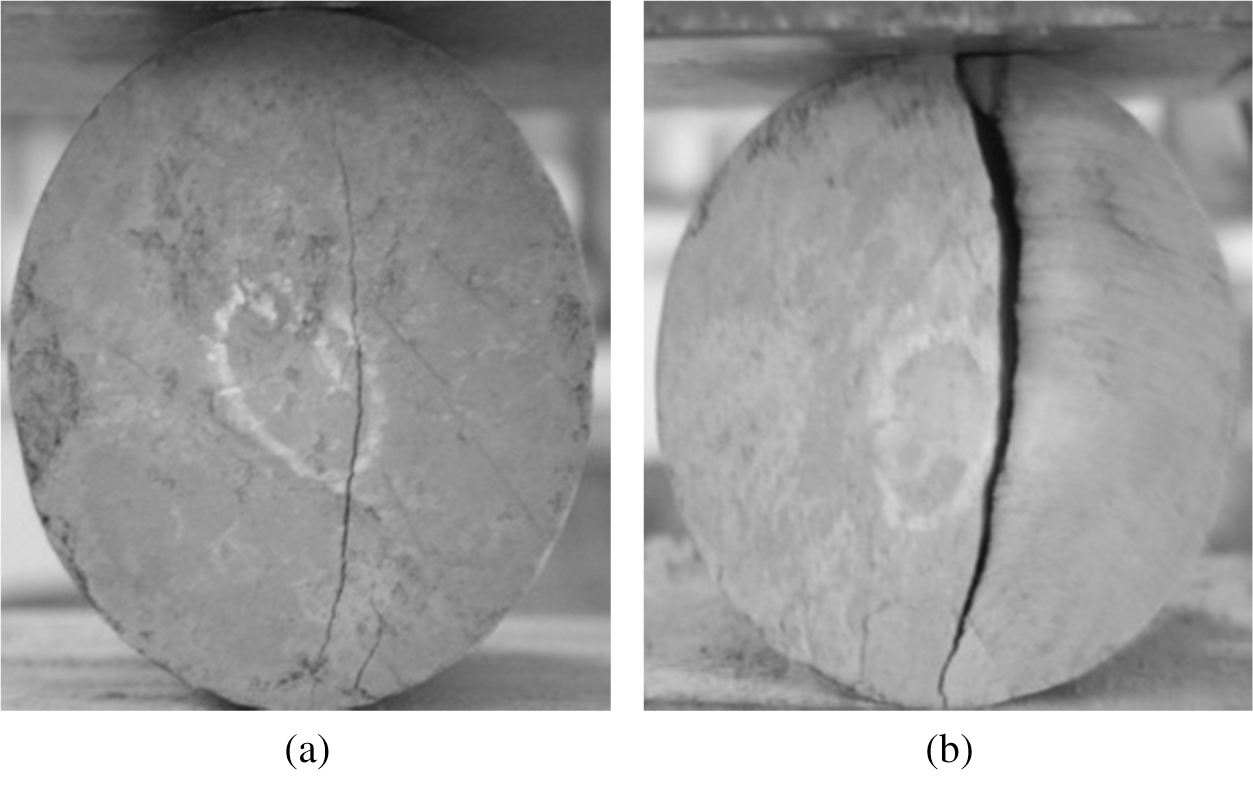
Figure 3: Crack evolution during a tensile test. (a) Initial crack, (b) Through cracks
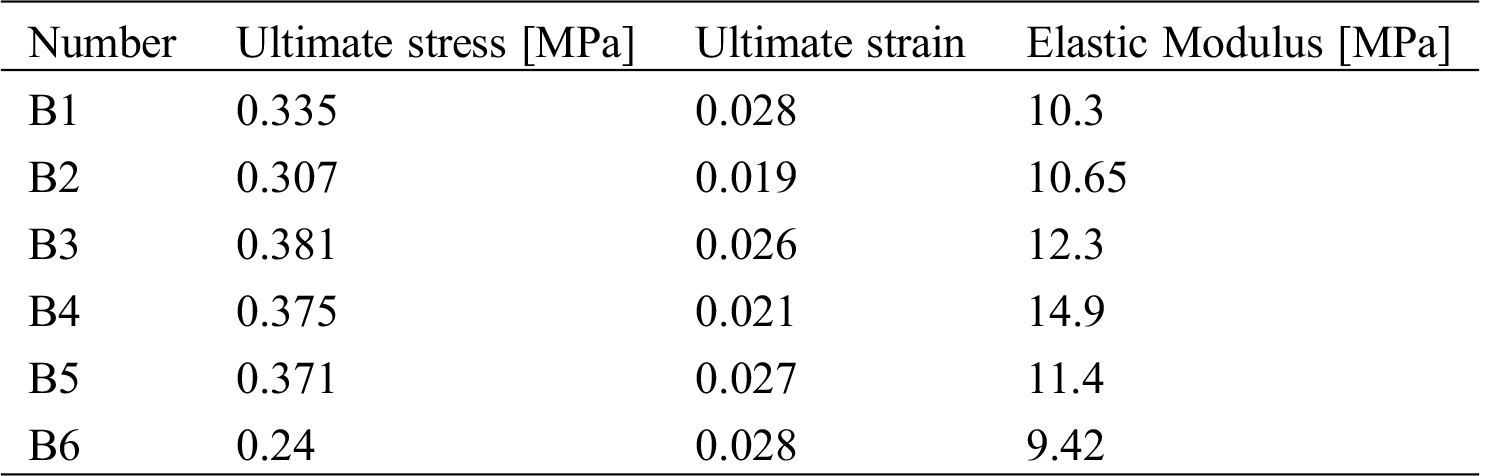
The results of the compressive and tensile tests are shown in Tab. 6. It can be seen that the coefficient of variation of the compressive and tensile strength values is about 0.15. The small coefficient of variation indicates that the inner structure of the specimen is relatively dense by compaction. This effectively resulted in reducing the shrinkage cracks of the clay in the soil material. The result of the experiment is ideal.
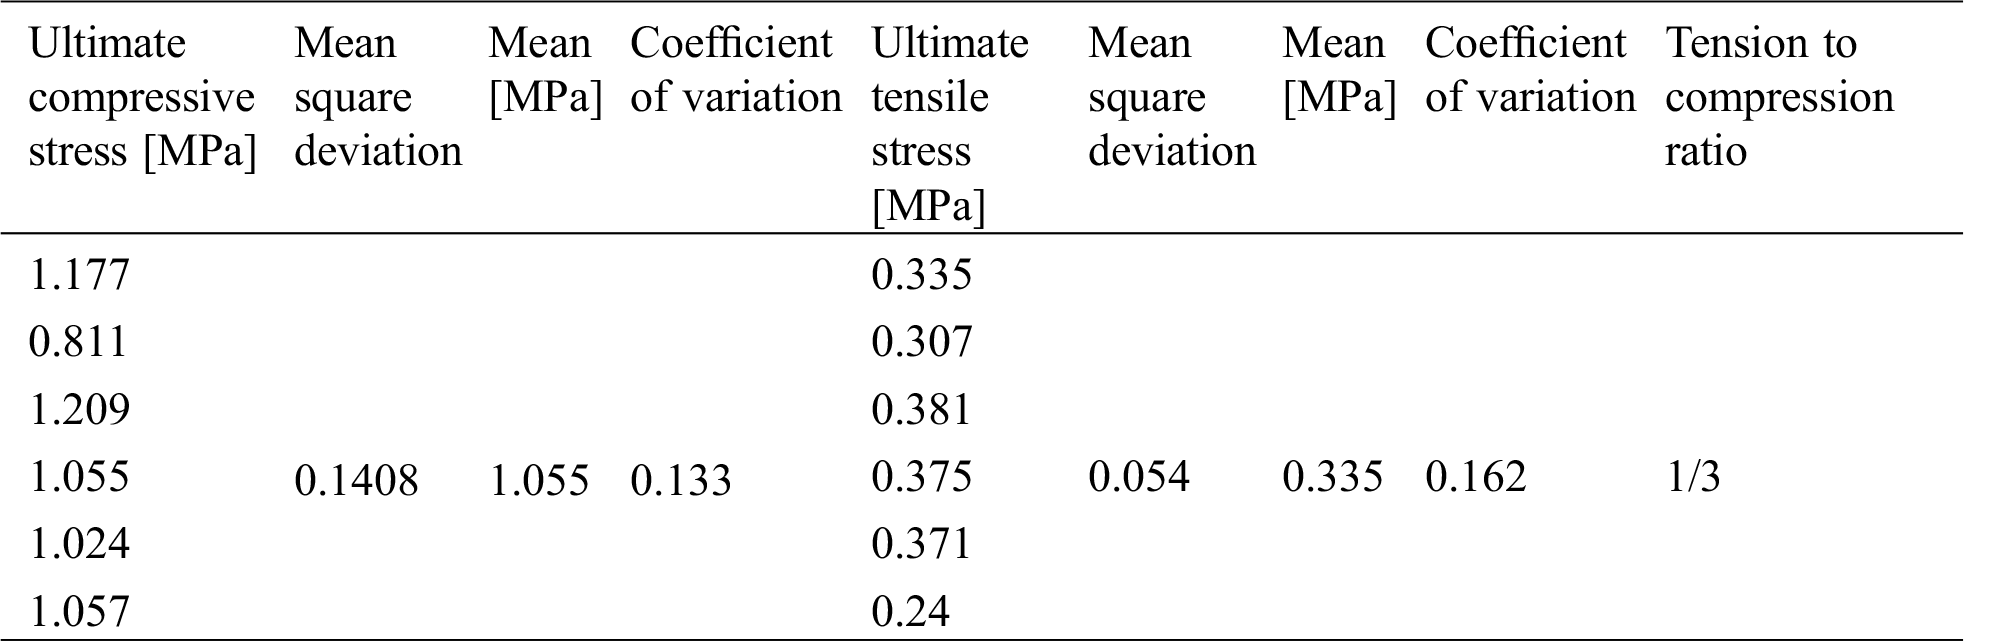
Table 6: The results of compressive and tensile tests
After compaction and curing, the dense cylinder specimen bear uniform force in the experiment, and the experimental results show a low coefficient of variation. We assume that the cylinder adobe specimen is an anisotropic material. Von Mises yield criterion [51–55] is suitable for isotropic materials. In accordance with the distortion energy conditions, if the stress state of the distortion of one point inside the object can reach a certain value, the point will yield:
For the tensile test, the values for
For the case of a pure shear state (
Table 7: Yield stress of cylinders

Depending on the ratio of normal stress to shear stress, three types of damage may lead to the destruction of the wall: shear friction failure, shear compression failure, and oblique compression failure. Since the failure of the single-layer wall under the action of the earthquake is primarily shear failure, the shear stress yield stress 0.193 MPa is utilized as the yield point in the numerical analysis.
3 Quasi-Static Experiment of Raw Soil Wall
3.1 Experimental Instruments and Loading Scheme
Three pieces of raw soil wall are produced. Its numbered are SQT1, SQT2, SQT3. The designed wall size is 3600 mm × 3000 mm × 310 mm (width × height × thickness). However, a 1/3 scale model is used in the actual test, and the scale model of adobe wall size is 1200 mm × 1000 mm × 310 mm (width × height × thickness), as shown in Fig. 4. An MTS test device is used to exert seismic loads on the wall, as shown in Fig. 5.
A concrete beam is placed on the top of the adobe wall during the test. The horizontal load and a vertical load of the simulated seismic force are applied to the top concrete beam. The vertical load is calculated according to the actual upper load on the wall, and the value is 0.06 MPa. The test measurements included horizontal displacement of the top beam, the horizontal displacement of the top and bottom of the wall, horizontal displacement of the bottom beam, and corresponding load data.
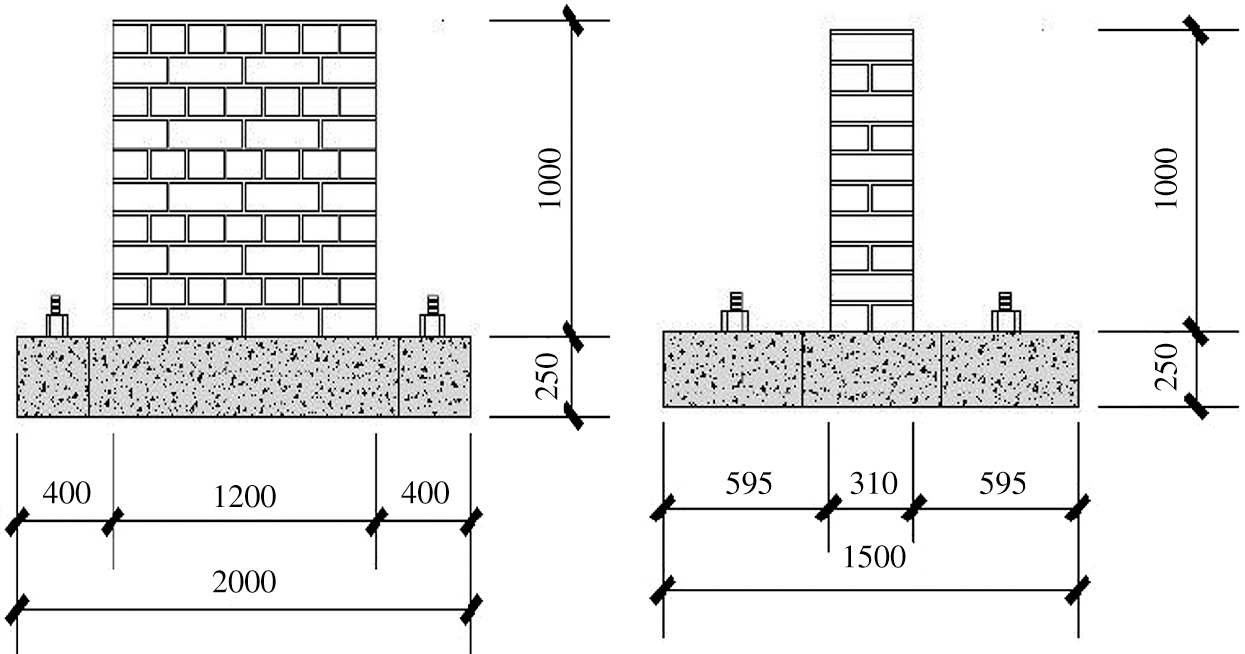
Figure 4: Raw soil wall
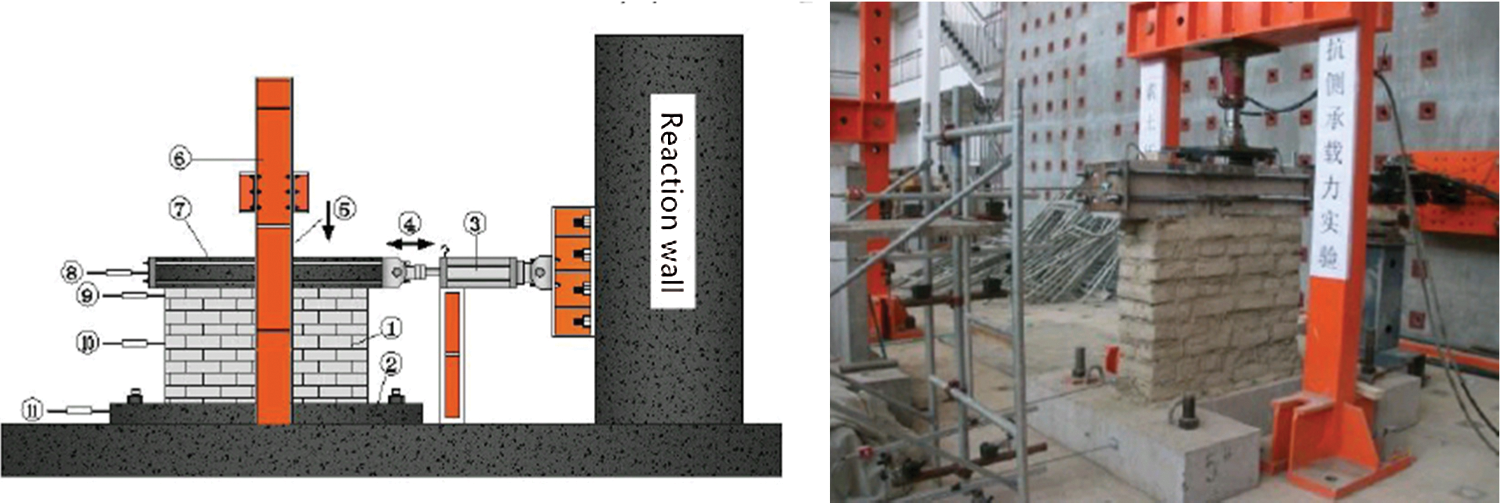
Figure 5: Raw soil wall test device
According to the “Building Seismic Test Method” (JGJ 101-96), the adobe wall is subjected to a cyclic load. The predicted lateral bearing capacity was 37.7 kN, and the predicted axial pressure is 22.6 kN. During the pre-loading phase, 30% of the predicted axial pressure is applied first, and 30% of the predicted shear capacity is applied for 2 min and repeated twice. The loading position has to be strictly centered on avoiding out-of-plane instability. The predicted pressure value of the vertical load and horizontal load is applied for the actual loading phase. The horizontal load is gradually loaded by displacement control in a sinusoidal pattern. The specification stipulated that each stage should not exceed 10% of the standard load. The highest frequency was 0.006 Hz, first push and then pull back. The peaks of the sine waves are 1 mm, 3 mm, 5 mm, 7 mm, 9 mm, and 11 mm, respectively. Each load is cycled twice and stayed for 50 s at the end of each cycle before the first crack occurred.
Ensure that the vertical load is applied and the measuring instrument is working normally. The first level horizontal load is applied, the surface of the adobe wall dose not change significantly. When the second-level horizontal load is applied, the surface of the adobe wall is showed slag destruction partially, and some of the vertical cracks are slightly propagated. Continue increasing the displacement, the number and the width of fine cracks are increased continuously. Most of the cracks are oblique cracks, and a few are vertical cracks. When visible through cracks began to appear, the test was stopped. The failure mode of the crack is shown in Fig. 6. The test results are shown in Tabs. 8 and 9. The hysteresis loop is the load-deformation curve of the structure under cyclic loading. The hysteresis loop reflects the deformation characteristics, stiffness degradation, and energy dissipation of the structure during cyclic loading, and it is the basis for determining the restoring force model and performing nonlinear seismic response analysis. The load-displacement curve of the three walls is shown in Fig. 7.
Table 8: Quasi-static wall test results
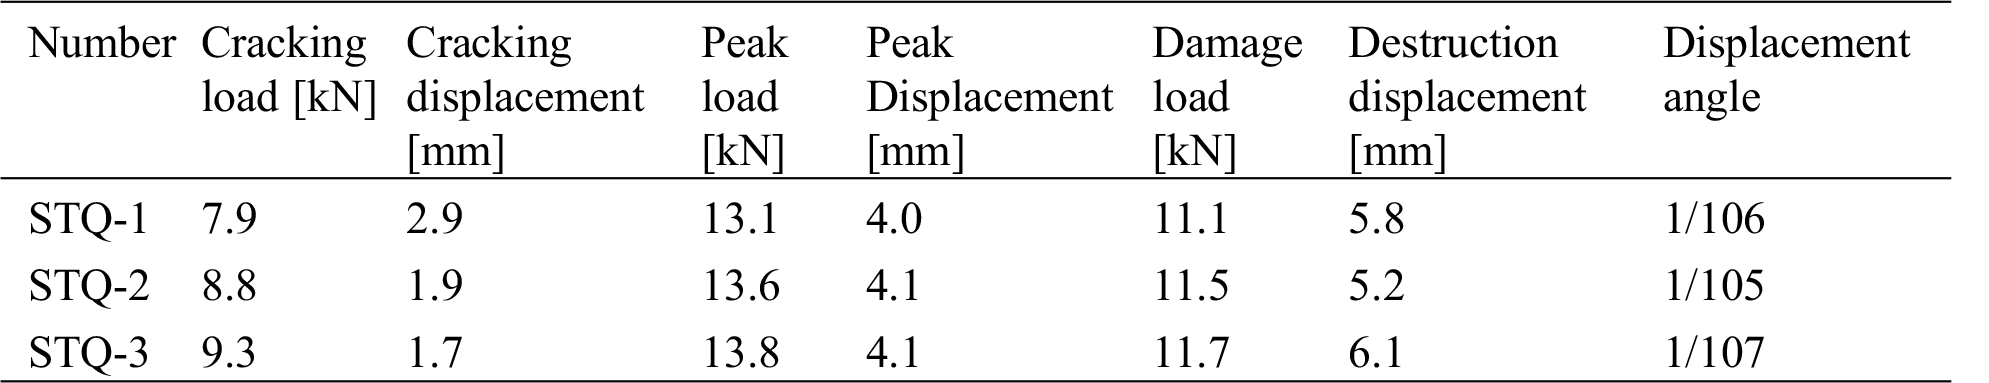
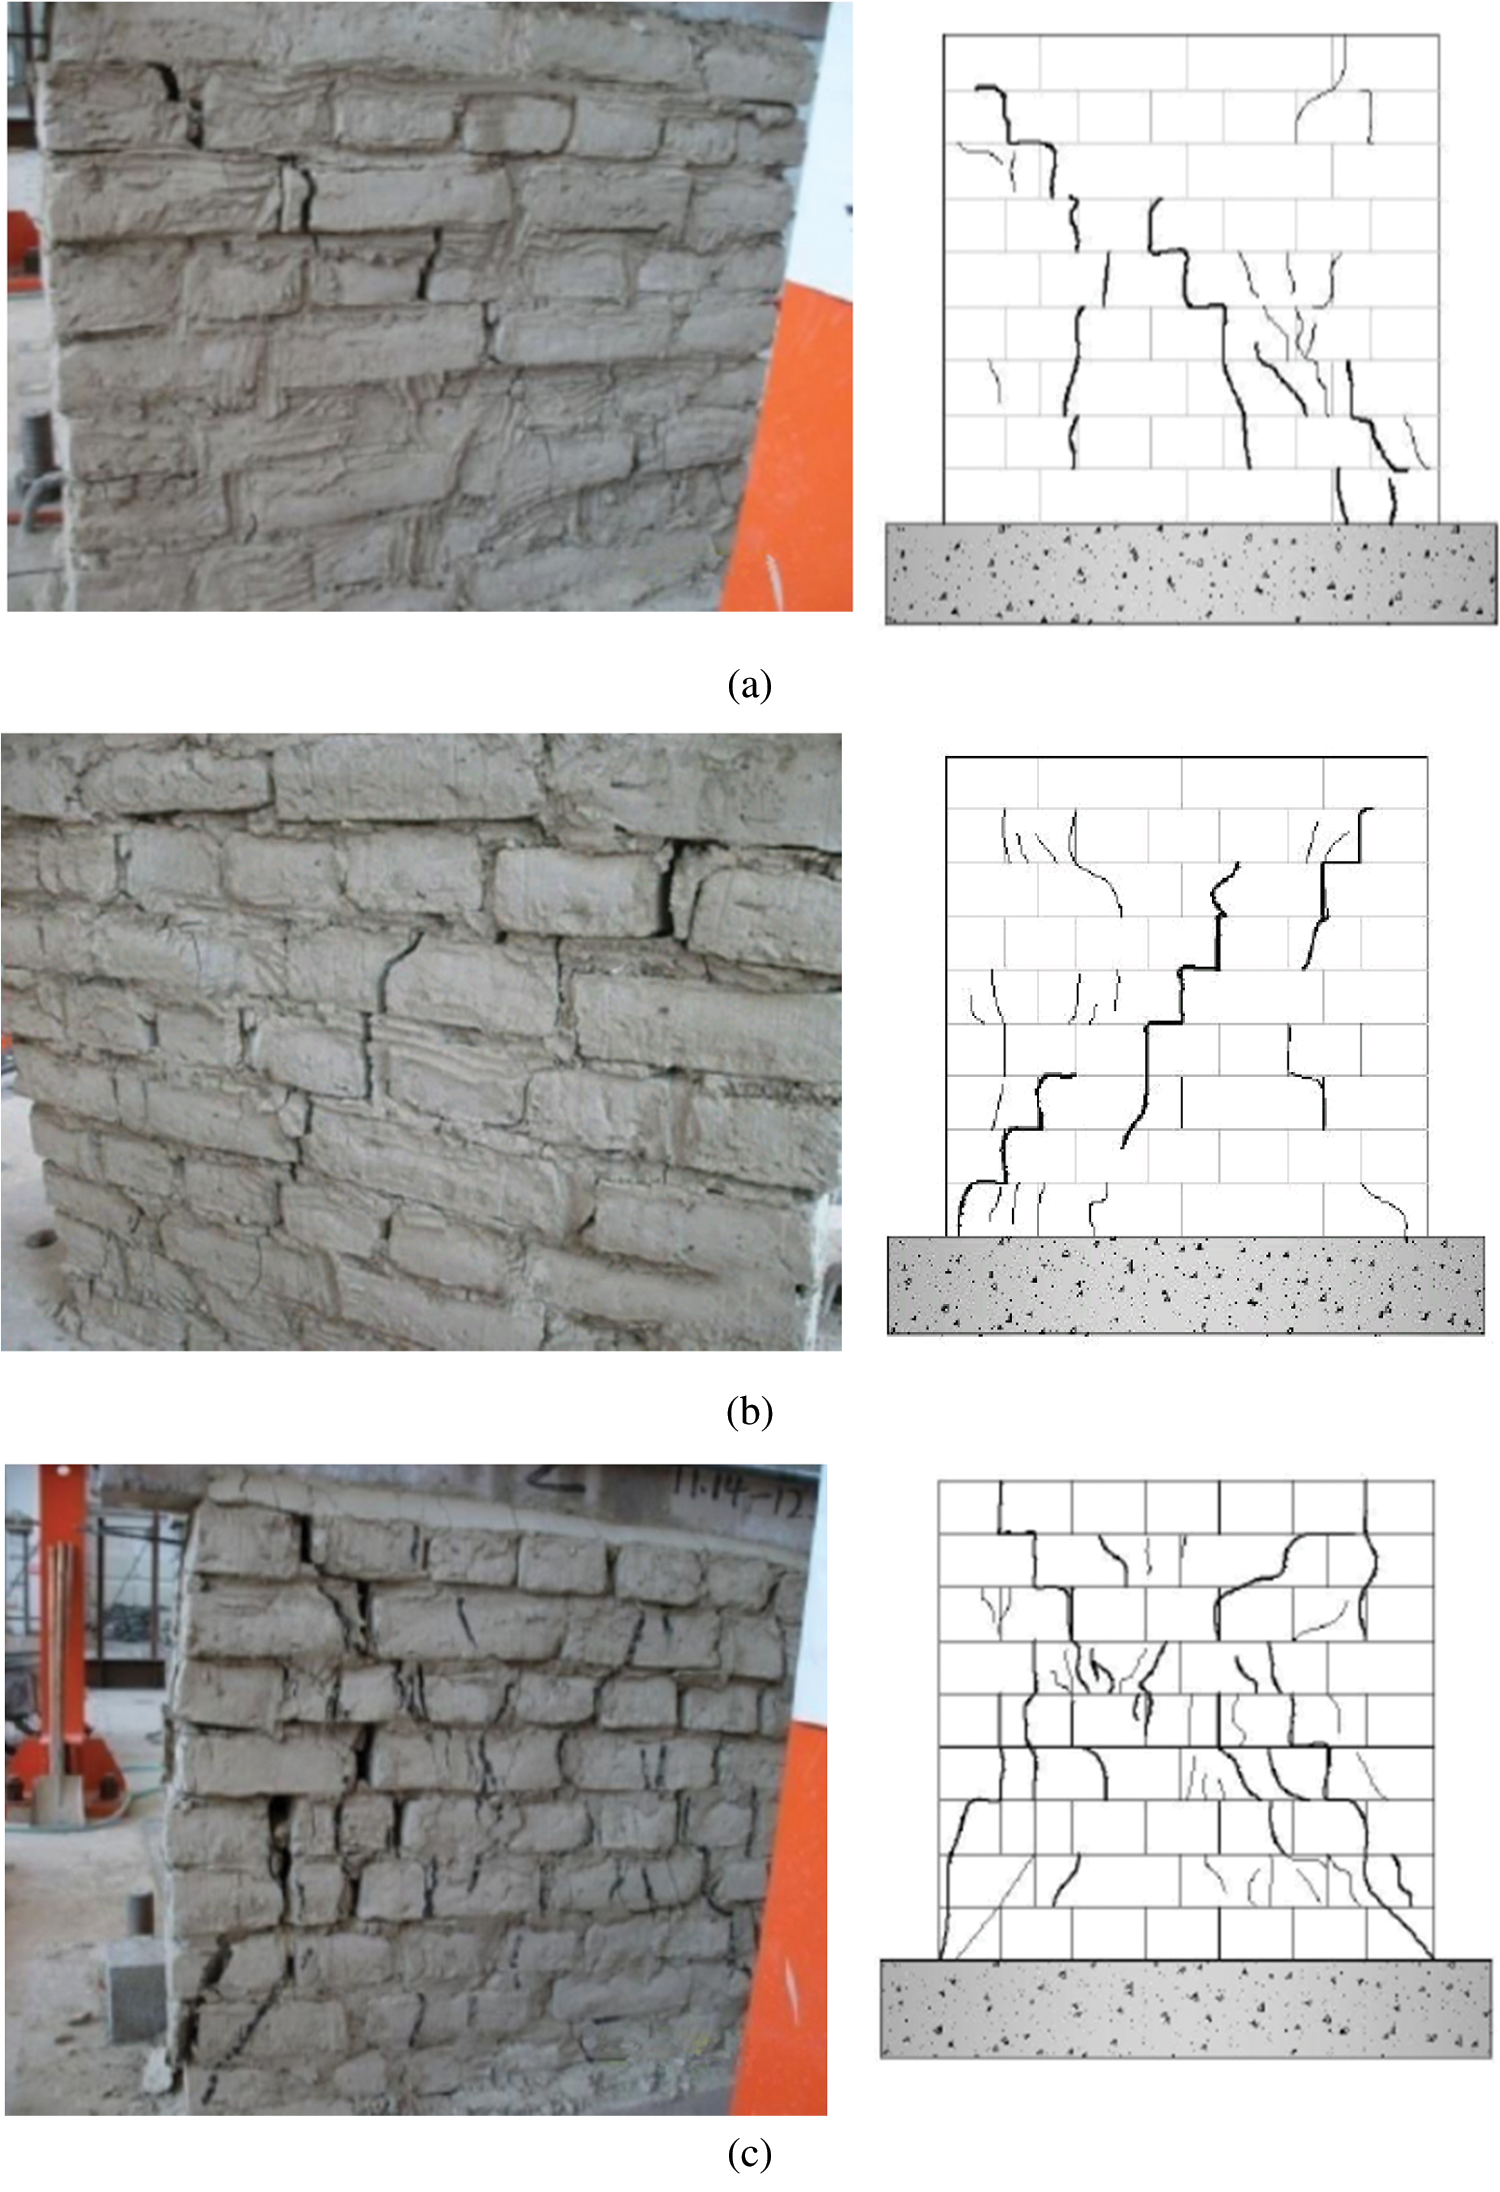
Figure 6: Fracture morphology. (a) STQ1, (b) STQ2, (c) STQ3
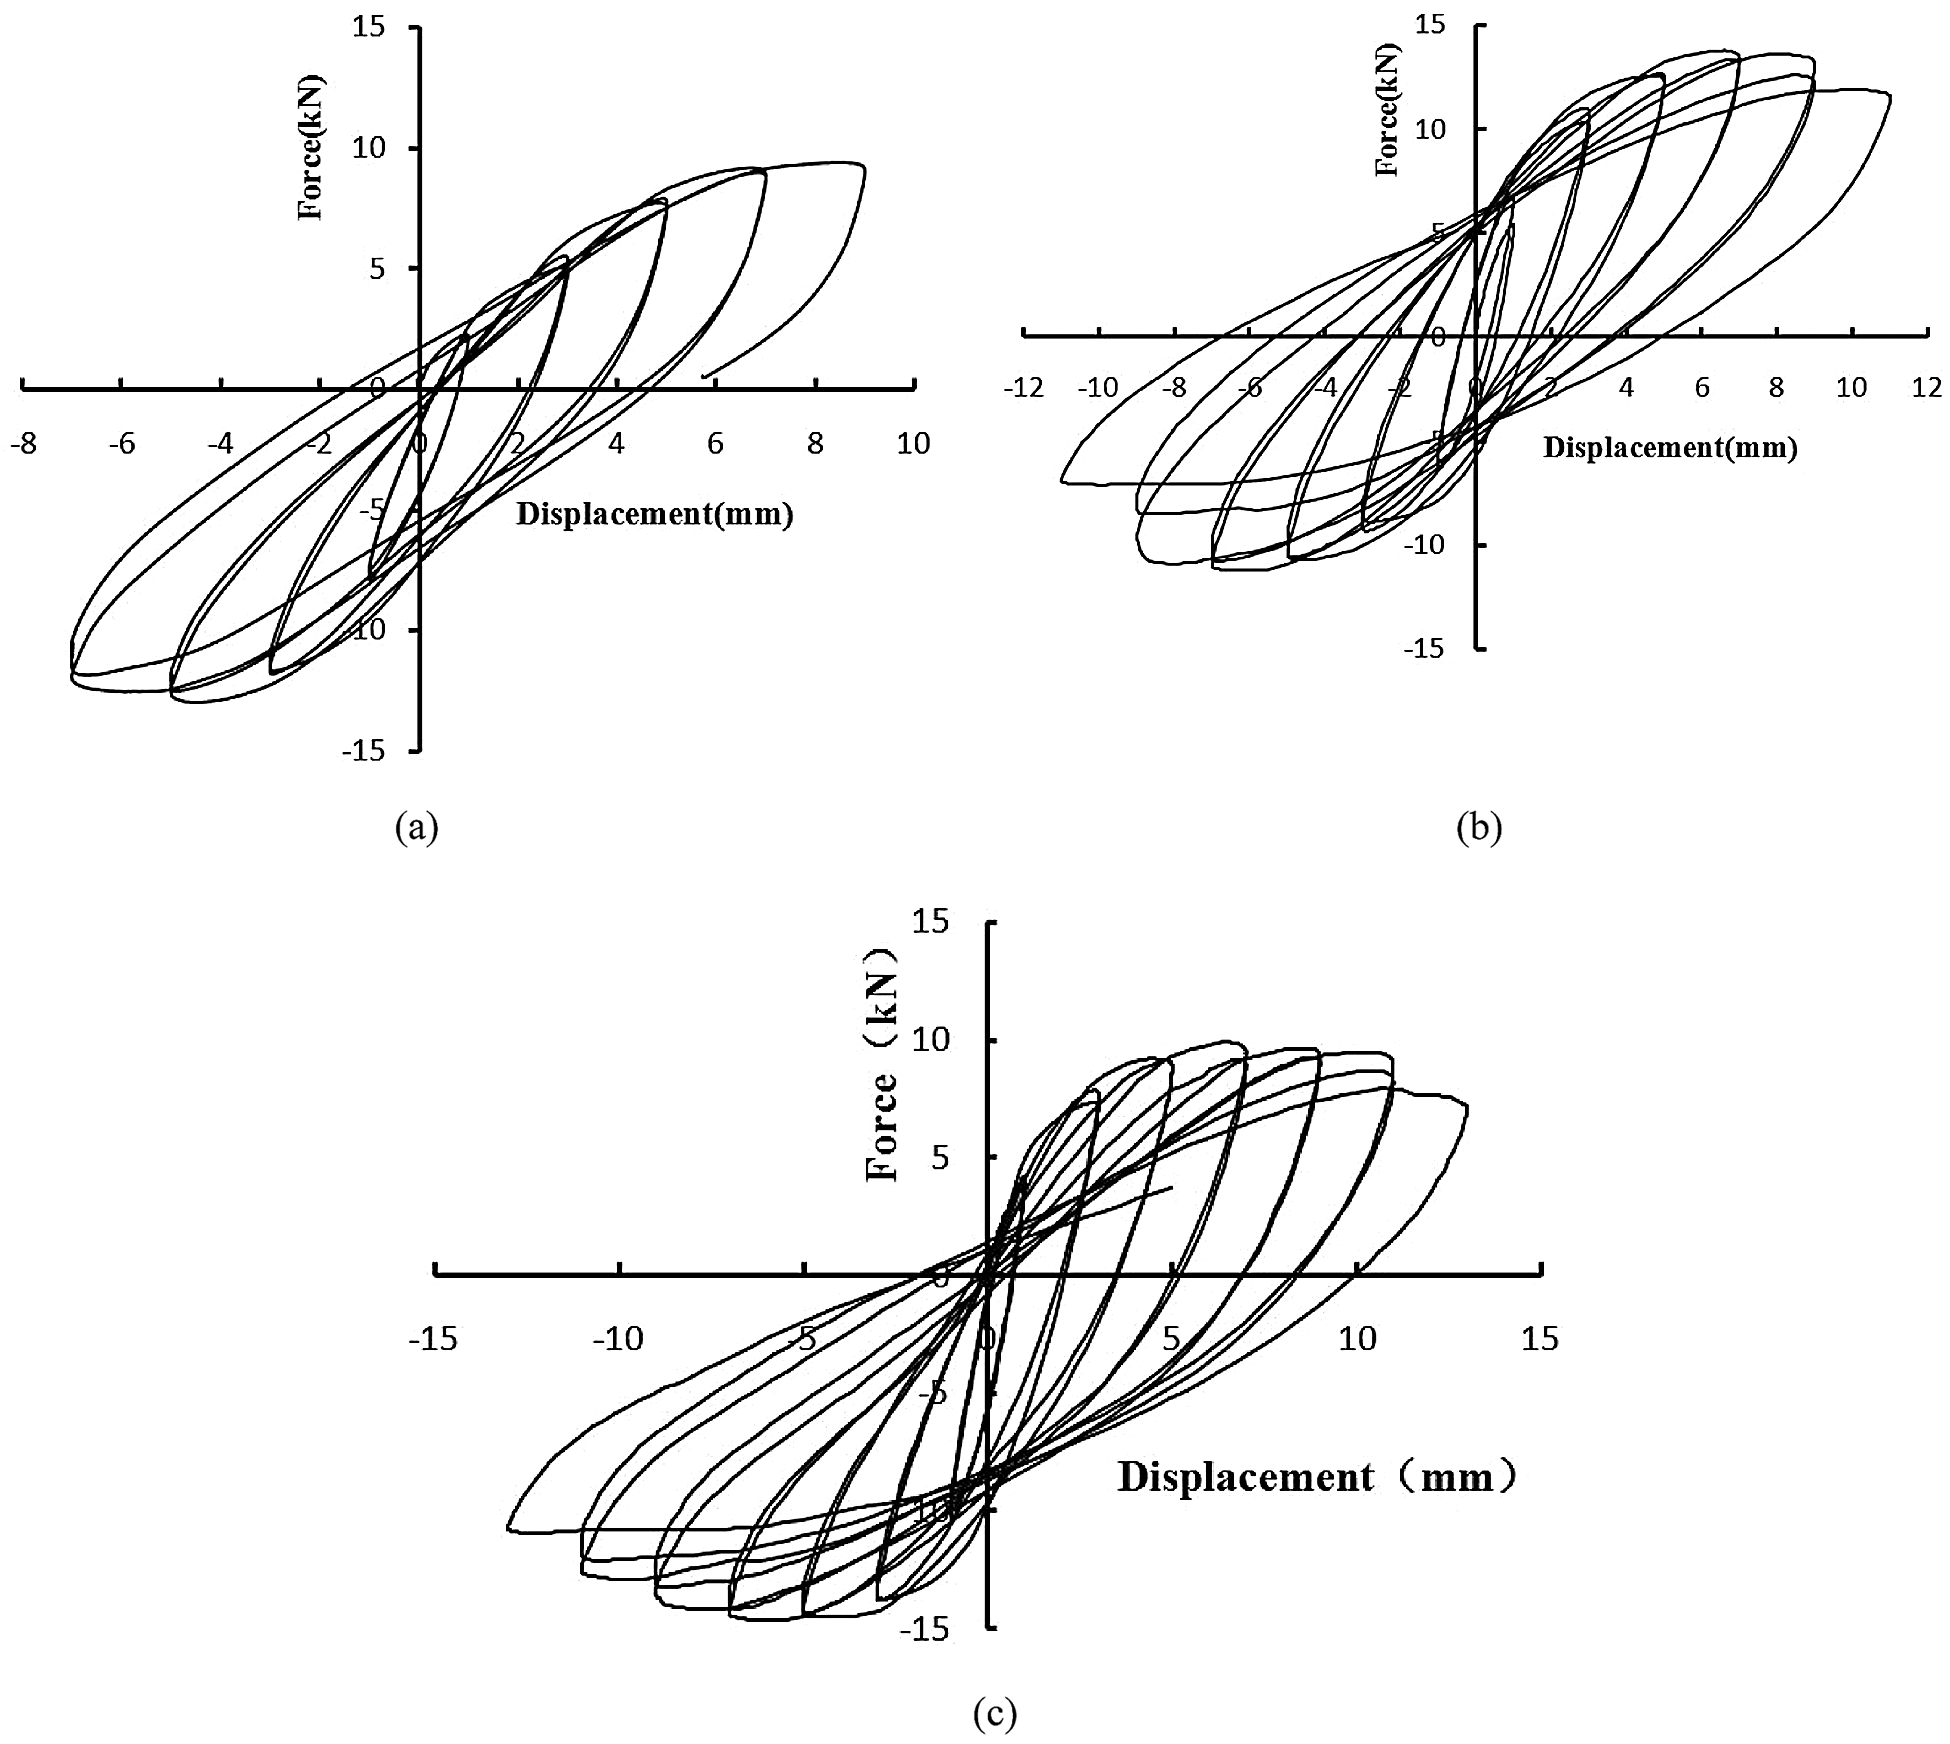
Figure 7: Hysteresis loop of raw soil walls. (a) STQ1, (b) STQ2, (c) STQ3
Table 9: Wall average displacement angle

3.3 Calculation of Shear Capacity of Wall
The failure mechanism of adobe walls is similar to masonry structures. Based on the formula for calculating the bearing capacity of the masonry structure [56–62], the factors affecting the seismic performance of adobe walls are considered comprehensively. Given that for practical reasons, the calculation formula should be practical and straightforward, the calculation formula utilized for the shear capacity of adobe walls can be given by
where
Due to the difficulty in ensuring the vertical mud can not contain any voids during the construction process, the influence coefficient κ is 0.6 in this test. The masonry shear strength design value
A numerical model developed by using the software program ANSYS/LS-DYNA is presented in this section. Similar to the experiments, the loading conditions of the simulation experiment include both static and dynamic loads. Furthermore, the numerical results are compared with the experimental results to verify the accuracy and the reliability of the numerical model [63–76].
LS-DYNA is a nonlinear finite element solver that mainly uses the explicit method. The reason for considering the explicit method is that the implicit method can only simulate the structural behavior before the collapse, but not during the collapse process since it is based on an iterative solution, and the global stiffness needs to be evaluated at every step. When the structure stiffness deteriorates or the force-deformation relationship shows a degradation behavior, the global stiffness matrix becomes a singular matrix, leading to non-convergence. However, the explicit method is based on dynamic equations, and thus, it has better stability. The inverse calculation of the stiffness matrix can be avoided by utilizing this method, which is the most challenging part. Hence, the simulation cost can be effectively reduced. As long as the time step is sufficiently small, the explicit method can simulate the dynamic behavior during the structure’s collapse. Presently, the explicit method is widely used in conducting shock and explosion research. The central difference method is used in the corresponding explicit dynamic solution [77–83].
There are three frequently used models—the integral model, decoupled model, and coupled model—each of which has respective advantages and disadvantages. The integral model, in which the reinforcements are equivalent calculated in the concrete structure, based on certain principles, and the elements are a single material. It is easy to carry out a fast calculation with low accuracy. The decoupled model treats the brick and mortar joint separately and considers the slip between them, which is more similar to the actual situation. Unfortunately, due to its high level of accuracy, the decoupled model requires high computational capacity due to many elements. Thus, it is time-consuming. The coupled model combines the contribution of the reinforcements of the element stiffness matrix with that of the concrete, assuming no slip at all between these two materials. This model is selected since the actual performance of a brick and mortar joint in raw soil building is similar to what is depicted in the integral model.
4.2 Quasi-Static Numerical Test
The element of the numerical model adopted Solid164 in ANSYS/LS_DYNA. The material properties selected are MAT_PLASTIC_KINEMATIC. The main parameters are based on the above soil material test, such as density, modulus of elasticity, Poisson’s ratio, yield stress, tangent modulus, limit strain, etc., as shown in Tab. 10. By simulating the above quasi-static test to verify the correctness of the numerical test, it can be seen that the corner of the adobe wall is destroyed when the time is in the 40th second, as shown in Fig. 8.
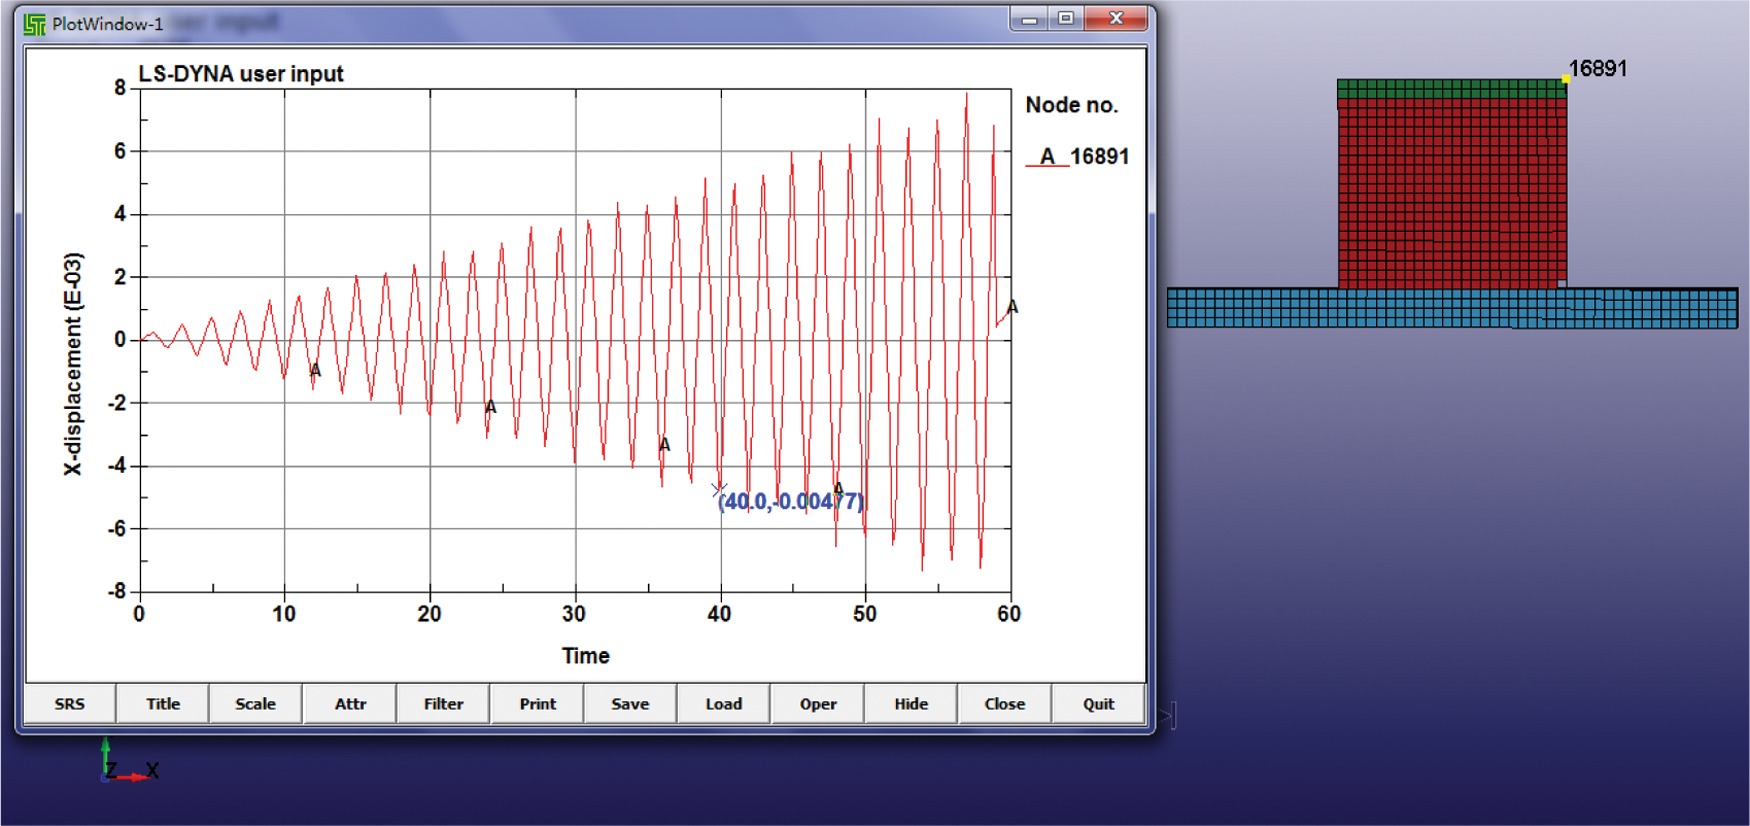
Figure 8: Wall displacement history curve
Table 10: Wall unit related parameters

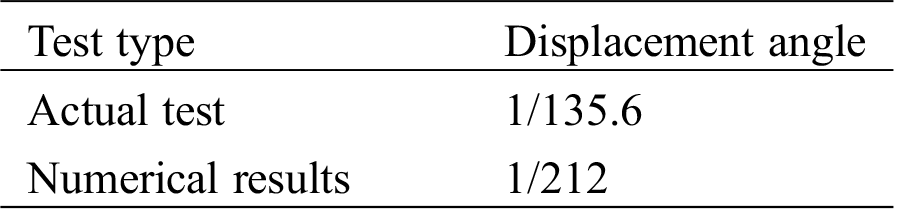
The number 16891 in the right of Fig. 8 is the number of the selected wall top unit. The left of Fig. 8 is the time and displacement curve of 16891 units, where the horizontal coordinate is time, and the vertical coordinate is displacement. The damage displacement of the wall top is 4.71 mm, and the displacement angle is 1/212, which can be calculated.
The value of the displacement angle in the actual test and the numerical results are shown in Tab. 11. By comparison, the numerical simulation value is smaller than the actual experimental value. This is due to the fact that the connection between the wall and the foundation is node-coupled in the numerical simulation, therefore, the numerical simulation results can be considered to be reasonable.
4.4 Numerical Simulation of Wall under Action of Seismic Wave
The collapse of a wall under a seismic wave is a nonlinear system problem due to hysteretic degradation behavior. Assuming that the physical properties remain constant in a short period or in the deformation increment, an incremental equation can be established.
where
The incremental Eq. (4) can be solved in the time domain by utilizing two methods: explicit and implicit.
4.4.2 Selection of Seismic Waves
For the seismic analysis, El Centro is selected. The precautionary seismic intensity of the structure is 8°, equivalent to the design peak acceleration of ground motion (PGA) of 0.32 g. To observe the wall behavior in different levels of earthquake intensity, the ground motions are increased with increments of PGA such that they are representative of the minor (0.1 g), moderate (0.32 g), and major earthquakes (1.15 g), as shown in Tab. 12. The acceleration time history diagram is shown in Fig. 9.
Table 12: Selection of seismic waves
Figure 9: The acceleration time history diagram. (a) X-direction (b) Y-direction
Fig. 10a shows the equivalent stress cloud at t = 2.3 s under minor earthquakes. The top and bottom nodes of the wall are selected. Applying the acceleration time history diagram as shown in Fig. 9, the acceleration ratio of the top and bottom of the same wall is obtained, as shown in Fig. 10b.
Curve A is the acceleration response for the bottom of the wall. Curve B is the top of the acceleration response. It can be seen that there is a significant amplification of the acceleration at the top of the wall relative to the acceleration at the bottom of the wall, especially near the peak of the acceleration. The peak acceleration at the top of the wall is 4.07 m/s2; the peak acceleration at the bottom of the wall is 0.6 m/s2. The acceleration peak ratio of the two is 6.78.
Figure 10: (a) Minor earthquakes t = 2.3 s, (b) Wall acceleration comparison
Fig. 11a shows the equivalent stress cloud at t = 2.3 s under moderate earthquakes. The local damage on the stress concentration area can be visibly seen. The corresponding acceleration time history map is drawn to the base and the top of the adobe wall model is shown in Fig. 11b.
Curve A is the bottom acceleration. Curve B is the top acceleration. It can be seen that the wall top acceleration of the adobe wall is significantly larger relative to the bottom acceleration of the adobe wall, especially at t = 5 s. At this moment, the base of the adobe wall shows a failure as seen from the corresponding elements, as shown in Fig. 11a. The peak acceleration at the top of the adobe wall is 14.7 m/s2, and the peak acceleration at the bottom of the wall is 2.4 m/s2. The acceleration peak ratio of the two is 6.138. The acceleration peak ratio is substantially close to the acceleration peak ratio in minor earthquakes.
Figure 11: (a) Moderate earthquakes t = 2.3 s, (b) Wall acceleration comparison
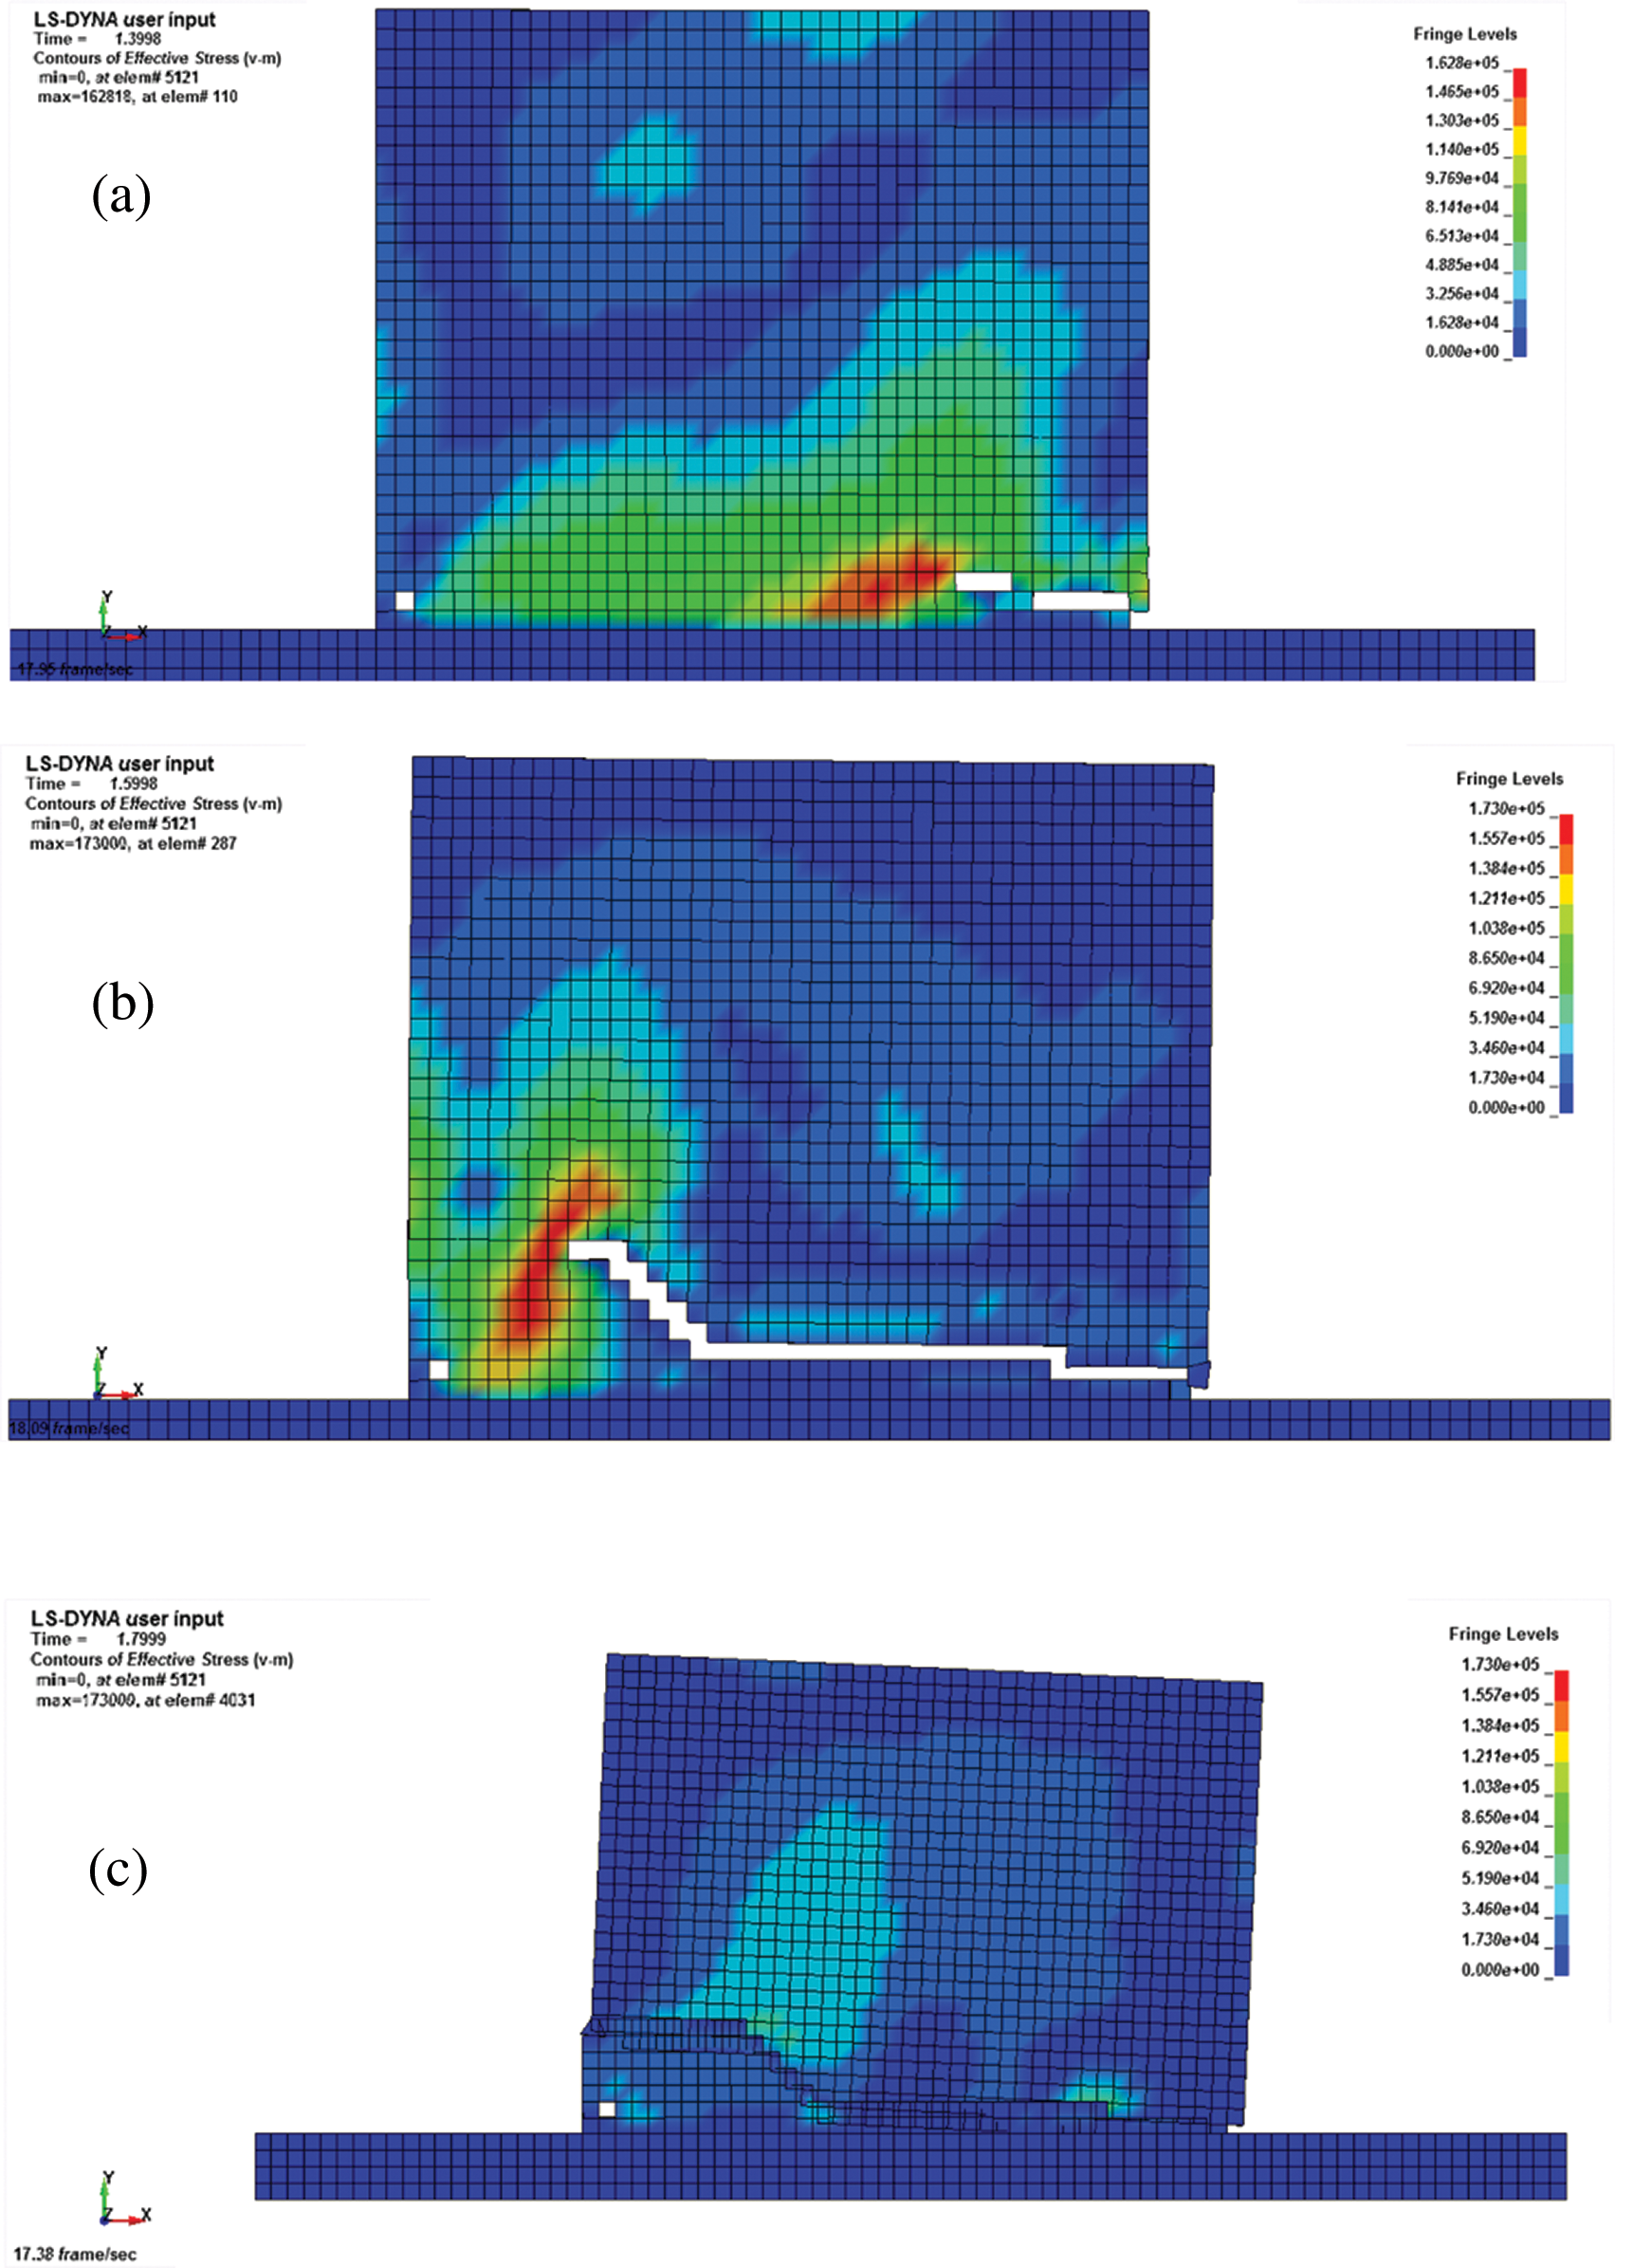
Figure 12: Moderate earthquakes t = 2.3 s. (a) Major earthquakes t = 1.3 s, (b) Major earthquakes t = 1.6 s, (c) Major earthquakes t = 1.8 s
Fig. 12a shows the equivalent stress cloud at t = 1.3 s under major earthquakes. In this case, a crack is visibly developing. Fig. 12b shows the equivalent stress cloud at t = 1.6 s under major earthquakes. In this case, the wall experiences development of cracks at t = 1.8 s, then collapses, as shown in Fig. 12c.
The acceleration response of the adobe wall under major earthquakes is shown in Fig. 13. Considering the top point and the bottom point of the wall, curve A is the acceleration of the top point, and curve B is the acceleration of the bottom point. It can be seen that the top accelerated peaks of the adobe wall and disappears around t = 2 s. The wall is completely destroyed at t = 2 s by comparing Fig. 12, as the wall is collapsing, so the acceleration disappears. The peak acceleration at the top of the wall is 65.9 m/s2, and the peak acceleration is 6.5 m/s2 at the bottom of the wall. The acceleration peak ratio of both is 10.14. Due to the unrecoverable damage at the bottom of the wall, the structural stiffness mutation and elastic restoring force are not enough to support the superstructure, and the superstructure will undergo acceleration mutation under the action of inertial force, which is similar to the whipping effect of the structure under the action of an earthquake.
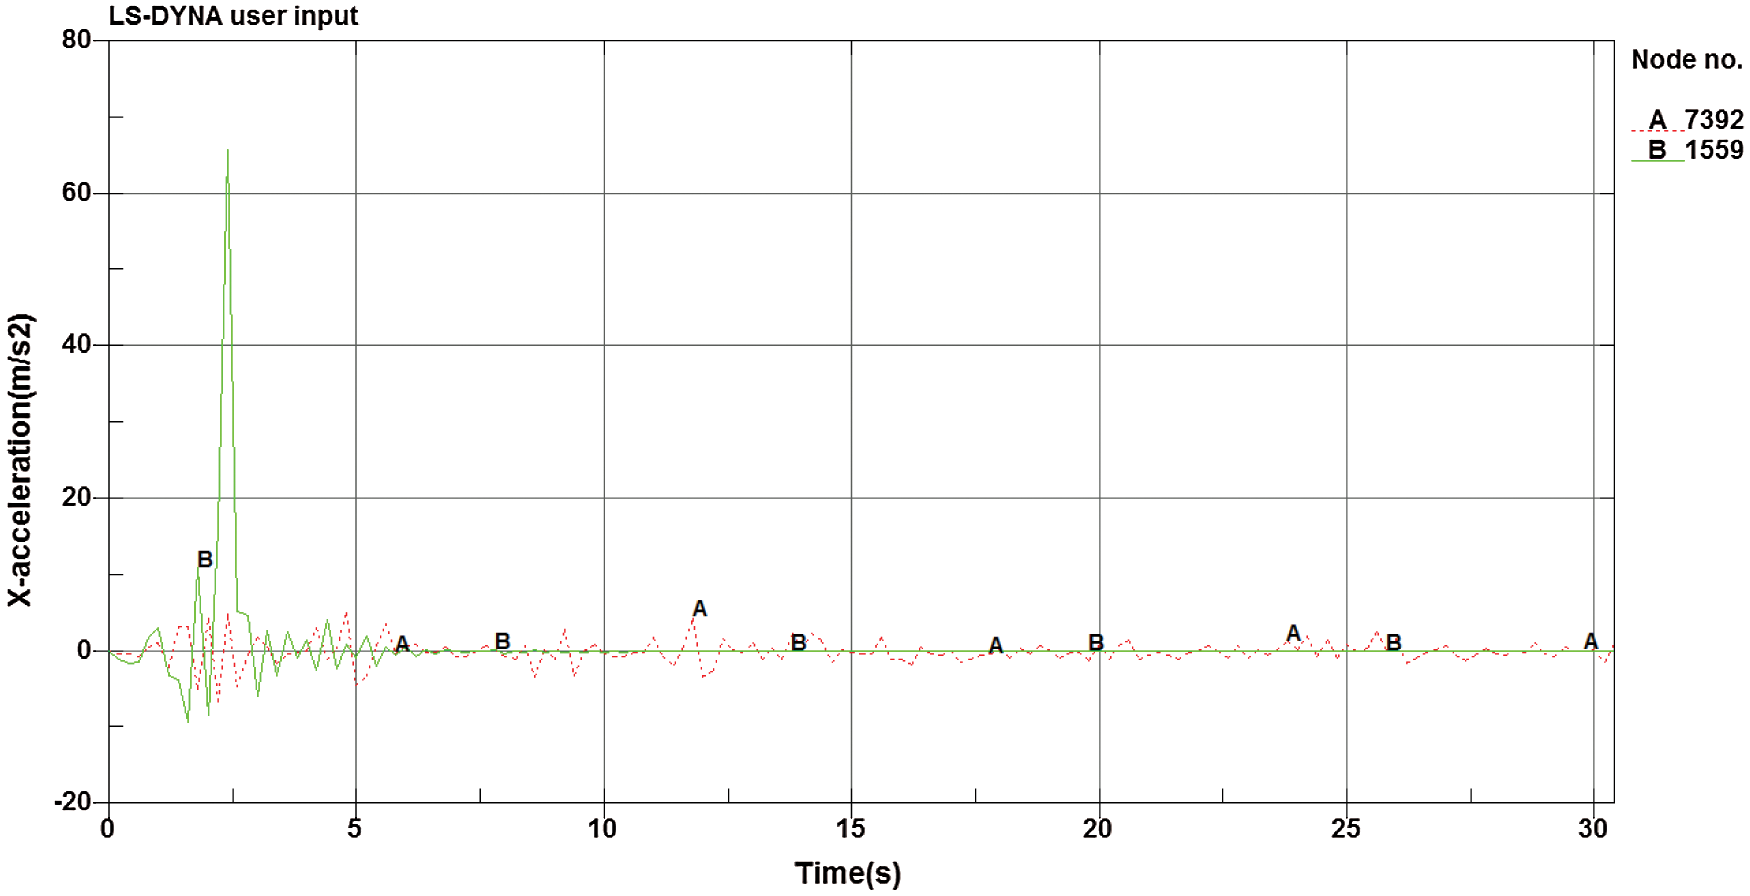
Figure 13: Comparison of acceleration
By selecting suitable test parameters from experimental studies, developing a corresponding finite element model, numerical simulation of adobe walls under the action of the seismic load is performed in order to find out how the seismic performance of earth adobe walls can be improved. The following conclusions can be drawn from this study:
1. It can be seen from the equivalent stress cloud diagrams that the stress concentration areas of the bottom of the wall are prone to shear failure. Thus, it is suggested to increase the strength of the connections of this part. For instance, wooden pillars can be installed to improve the integrity of composite earth walls.
2. From the acceleration response of the wall, under a major earthquake, it is observed that the acceleration value of the wall top is far greater than the acceleration value of the wall bottom. When the plastic damage occurs, the acceleration value of the oscillation is not synchronized. This indicated that the physical integrity of the wall is weak.
3. During the wall collapse process, it was apparent that the initial local damage occurred at t = 1.3 s, and the wall collapse occurred at t = 1.8 s. This means a destruction time of less than 1 s, which is quite fast. This obviously indicates brittle damage characteristics. It is suggested to mix additional materials in the soil mix to enhance its structural ductility. This can be achieved by adding, for instance, hay straws.
Acknowledgement: Involvement and contributions of the second author in this research project, who supervises the doctoral research of the first author, was made possible, in part, due to a release time funding from Donald E. Bently Center for Engineering Innovation, Mechanical Engineering, Cal Poly, San Luis Obispo. Herein this support is acknowledged.
Funding Statement: The authors received no specific funding for this study.
Conflicts of Interest: The authors declare that they have no conflicts of interest to report regarding the present study.
1. Silveira, D., Varum, H., Costa, A. (2012). Mechanical properties of adobe bricks in ancient constructions. Construction and Building Materials, 28, 36–44. [Google Scholar]
2. Wu, F., Wang, H. T., Li, G., Jia, J., Li, H. (2017). Seismic performance of traditional adobe masonry walls subjected to in-plane cyclic loading. Materials and Structures, 50, 69. [Google Scholar]
3. Morel, J. C., Pkla, A., Walker, P. (2007). Compressive strength testing of compressed earth blocks. Construction and Building Materials, 21, 303–309. [Google Scholar]
4. Lynne, E., Cassandra, A. (2005). Alternative construction: Contemporary natural building methods. Hoboken: John Wiley. [Google Scholar]
5. Walker, P. (2004). Strength and erosion characteristics of earth block masonry. Journal of Materials in Civil Engineering, 11(3), 249–256. [Google Scholar]
6. Li, G., Liu, Y., Li, H. N. (2009). Seismic damage investigation and analysis on rural buildings in Wenchuan earthquake. Dalian University of Technology, 49(5), 724–730 (in Chinese). [Google Scholar]
7. Maheri, M. R., Naeim, F., Mehrain, M. (2003). Performance of Adobe residential buildings in the 2003 Bam, Iran. Earthquake Earthquake Spectra, 21(S1), 337–344, 2005. [Google Scholar]
8. Silveira, D., Varum, H., Costa, A., Carvalho, J. (2015). Mechanical properties and behavior of traditional adobe wall panels of the Aveiro district. Journal of Materials in Civil Engineering, 27(9), 04014253. [Google Scholar]
9. Turanli, L., Saritas, A. (2011). Strengthening the structural behavior of adobe walls through the use of plaster reinforcement mesh. Construction and Building Materials, 25(4), 1747–1752. [Google Scholar]
10. Webster, F., Tolles, E. (2000). Earthquake damage to historic and older adobe buildings during the 1994 Northridge California Earthquake. Proceedings of the 12th World Conference on Earthquake Engineering. New Zealand. [Google Scholar]
11. Pinakin, D., Dweipayan, G., Parth, T., Janki, N. T. (2013). Soil property apotheosis to corral the finest compressive strength of unbaked adobe bricks. Construction and Building Materials, 48, 948–953. [Google Scholar]
12. Ocola, L., Huaco, P. (2005). Seismic response of adobe buildings in Peruvian territory: 1974–2001 earthquakes. Proceedings of Sismo Adobe 2005. Lima, Peru, Spanish. [Google Scholar]
13. Akenjiang, T., Qi, G., Chen, H. (2008). Seismic damage and seismic countermeasures of Xinjiang traditional Adobe house. Earthquake Resistant Engineering and Retrofitting, 30, 82–86 (in Chinese). [Google Scholar]
14. Al Aqtash, U., Bandini, P., Cooper, S. L. (2017). Numerical approach to model the effect of moisture in adobe masonry walls subjected to in-plane loading. International Journal of Architectural Heritage,11(6805–815. [Google Scholar]
15. Wu, F., Wang, H. T., Li, G., Jia, J., Li, H. (2017). Seismic performance of traditional adobe masonry walls subjected to in-plane cyclic loading. Journal of Materials and Structures, 50(1), 69. [Google Scholar]
16. Han, J. P., Huang, L. J., Sun, X. Y. (2016). Global collapse resistance capacity investigation of infilled RC frame considering in-plane and out-of-plane interaction of infill walls. Journal of Engineering Mechanics, 33(9146–154. [Google Scholar]
17. Louren, O. P. B., Leite, J. M., Paulo-Pereira, M. F., Campos-Costa, A., Nuno Mendes, P. X. C. (2016). Shaking table testing for masonry infill walls: Unreinforced versus reinforced solutions. Journal of Earthquake Engineering & Structural Dynamics, 45(142241–2260. [Google Scholar]
18. Silveira, D., Varum, H., Costa, A., Pereira, H., Sarchi, L. et al. (2018). Seismic behavior of two Portuguese adobe buildings: Part I—In-plane cyclic testing of a full-scale adobe wall. International Journal of Architectural Heritage, 12(11–14. [Google Scholar]
19. Mendes, N., Lourenço, P. B., Campos-Costa, A. (2014). Shaking table testing of an existing masonry building: Assessment and improvement of the seismic performance. Journal of Earthquake Engineering & Structural Dynamics, 43, 247–266. [Google Scholar]
20. Wu, F., Wang, H. T., Li, G., Jia, J., Li, H. (2017). Seismic performance of traditional adobe masonry walls subjected to in-plane cyclic loading. Materials and Structures, 50(1), 69. [Google Scholar]
21. Zhao, Y., Noori, M., Altabey, W. A. (2017). Damage detection for a beam under transient excitation via three different algorithms. Structural Engineering and Mechanics, 64(6), 803–817. DOI 10.12989/sem.2017.64.6.803. [Google Scholar] [CrossRef]
22. Zhao, Y., Noori, M., Altabey, W. A., Seyed, B. B. (2018). Mode shape based damage identification for a reinforced concrete beam using wavelet coefficient differences and multi-resolution analysis. Structural Control & Health Monitoring, 25(1), e2041. DOI 10.1002/stc.2041. [Google Scholar] [CrossRef]
23. Zhao, Y., Noori, M., Altabey, W. A., Awad, T. (2019). A comparison of three different methods for the identification of hysterically degrading structures using BWBN model. Frontiers in Built Environment, 4(80), 1–19. DOI 10.3389/fbuil.2018.00080. [Google Scholar] [CrossRef]
24. Noori, M., Wang, H., Altabey, W. A., Silik, A. I. H. (2018). A modified wavelet energy rate based damage identification method for steel bridges. Scientia Iranica, Transactions B: Mechanical Engineering, 25(6), 3210–3230. DOI 10.24200/sci.2018.20736. [Google Scholar] [CrossRef]
25. Silik, A., Noori, M., Altabey, W. A., Ghiasi, R., Wu, Z. (2021). Comparative analysis of wavelet transform for time-frequency analysis and transient localization in structural health monitoring. Structural Durability and Health Monitoring, 15(11–22. DOI 10.32604/sdhm.2021.012751. [Google Scholar] [CrossRef]
26. Silik, A., Noori, M., Altabey, W. A., Ghiasi, R. (2021). Selecting optimum level of wavelet multi-resolution analysis for time-varying signals in structural health monitoring applications. Structural Control and Health Monitoring. DOI 10.1002/stc.2762. [Google Scholar] [CrossRef]
27. Silik, A., Noori, M., Altabey, W. A., Ghiasi, R.Wu, Z.et al.(2021). Optimum wavelet selection for nonparametric analysis toward structural health monitoring for processing big data from sensor network: A comparative study. Structural Health Monitoring. DOI 10.1177/14759217211010261. [Google Scholar] [CrossRef]
28. Kumar, R., Ismail, M., Zhao, W. R., Noori, M., Yadav, A. R. et al. (2021). Damage detection of wind turbine system based on signal processing approach: A critical review. Clean Technologies and Environmental Policy, 23(2561–580. DOI 10.1007/s10098-020-02003-w. [Google Scholar] [CrossRef]
29. Zhao, Y., Noori, M., Altabey, W. A., Ramin, G., Wu, Z. et al.(2019). A fatigue damage model for FRP composite laminate systems based on stiffness reduction. Structural Durability and Health Monitoring,13(185–103. DOI 10.32604/sdhm.2019.04695. [Google Scholar] [CrossRef]
30. GB/T 50123-1999 (1999). Standard for soil test method. Beijing: China Planning Press. [Google Scholar]
31. Li, Z., Akenjiang, T., Hasiyet, H. (2013). Experimental tests on axis compressive strength of the cylinder specimen of modified soil materials. Research and Exploration in Laboratory, 11 (in Chinese). [Google Scholar]
32. Quagliarini, E. (2006). Earth construction in the Marche region (ItalyBuilding techniques and materials. Proceedings of the Second International Congress on Construction History, pp. 2559–2572, Cambridge. [Google Scholar]
33. Quagliarini, E., Lenci, S., Iorio, M. (2010). Mechanical properties of adobe walls in a Roman Republican domus at Suasa. Cultural Heritage, 11, 130–137. [Google Scholar]
34. Binici, H., Aksogan, O., Bodur, M. N., Akca, E., Kapur, S. (2007). Thermal isolation and mechanical properties of fibre reinforced mud bricks as wall materials. Construction and Building Materials, 21, 901–906. [Google Scholar]
35. Binici, H., Aksogan, O., Shah, T. (2005). Investigation of fibre reinforced mud brick as a building material. Construction and Building Materials, 19, 313–318. [Google Scholar]
36. Yetgin, S., Çavdar, O., Çavdar, A. (2008). The effects of the fibre contents on the mechanic properties of the adobes. Construction and Building Materials, 22, 222–227. [Google Scholar]
37. Bouhicha, M., Aouissi, F., Kenai, S. (2005). Performance of composite soil reinforced with barley straw. Cement and Concrete Composites, 27, 617–621. [Google Scholar]
38. Morel, J. C., Pkla, A., Walker, P. (2007). Compressive strength testing of compressed earth blocks. Construction and Building Materials, 21, 303–309. [Google Scholar]
39. Chen, X. P., Huang, G. Y., Liang, Z. S. (2003). Study on soft soil properties of the Pearl River Delta. Chinese Journal of Rock Mechanics and Engineering, 22(1), 137–141 (in Chinese). [Google Scholar]
40. Quagliarini, E., Lenci, S., Iorio, M. (2010). Mechanical properties of adobe walls in a Roman Republican domus at Suasa. Cultural Heritage, 11, 130–137. [Google Scholar]
41. Piattoni, Q., Quagliarini, E., Lenci, S. (2011). Experimental analysis and modelling of the mechanical behaviour of earthen bricks. Construction and Building Materials, 25, 2067–2075. [Google Scholar]
42. Altabey, W. A. (2017). Free vibration of basalt fiber reinforced polymer (FRP) laminated variable thickness plates with intermediate elastic support using finite strip transition matrix (FSTM) method. Vibroengineering, 19(4), 2873–2885. DOI 10.21595/jve.2017.18154. [Google Scholar] [CrossRef]
43. Altabey, W. A. (2017). Prediction of natural frequency of basalt fiber reinforced polymer (FRP) laminated variable thickness plates with intermediate elastic support using artificial neural networks (ANNs) method. Vibroengineering, 19(5), 3668–3678. DOI 10.21595/jve.2017.18209. [Google Scholar] [CrossRef]
44. Altabey, W. A. (2018). High performance estimations of natural frequency of basalt FRP laminated plates with intermediate elastic support using response surfaces method. Vibroengineering, 20(2), 1099–1107. DOI 10.21595/jve.2017.18456. [Google Scholar] [CrossRef]
45. Wang, T., Noori, M., Altabey, W. A. (2021). Identification of cracks in an Euler-Bernoulli beam using Bayesian inference and closed-form solution of vibration modes. Proceedings of the Institution of Mechanical Engineers Part L: Journal of Materials: Design and Applications, 235(2), 421–438. DOI 10.1177/1464420720969719. [Google Scholar] [CrossRef]
46. Wang, T., Noori, M., Altabey, W. A., Farrokh, M., Ghiasi, R. et al. (2021). Parameter identification and dynamic response analysis of a modified Prandtl–Ishlinskii asymmetric hysteresis model via least-mean square algorithm and particle swarm optimization. Proceedings of the Institution of Mechanical Engineers Part L: Journal of Materials: Design and Applications (in Press). DOI 10.1177/14644207211006840. [Google Scholar] [CrossRef]
47. Li, Z., Noori, M., Zhao, Y., Wan, C., Feng, D. et al.(2021). A multiobjective optimization algorithm for BWBN model to identify RC columns failing in different modes. Proceedings of the Institution of Mechanical Engineers Part L: Journal of Materials: Design and Applications (in Press). [Google Scholar]
48. Zhao, Y., Noori, M., Altabey, W. A. (2021). Reaching law based sliding mode control for a frame structure under seismic load. Earthquake Engineering and Engineering Vibration (in Press). https://www.springer.com/journal/11803. [Google Scholar]
49. Narjabadifam, P., Hoseinpour, R., Noori, M., Altabey, W. A.et al.(2021). Practical seismic resilience evaluation and crisis management planning through GIS-based vulnerability assessment of buildings. Earthquake Engineering and Engineering Vibration, 20(125–37. DOI 10.1007/s11803-021-2003-1. [Google Scholar] [CrossRef]
50. Ghannadi, P., Kourehli, S. S., Noori, M., Altabey, W. A. (2020). Efficiency of grey wolf optimization algorithm for damage detection of skeletal structures via expanded mode shapes. Advances in Structural Engineering, 23(13), 2850–2865. DOI 10.1177/1369433220921000. [Google Scholar] [CrossRef]
51. Young, G. (2004). Introduction to elasticity and plasticit. Beijing: Tsinghua University Press. [Google Scholar]
52. Yang, W. H. (1980). A generalized von Mises criterion for yield and fracture. Applied Mechanics, 47(2), 297–300. [Google Scholar]
53. Altabey, W. A. (2017). A study on thermo-mechanical behavior of MCD through bulge test analysis. Advances in Computational Design, 2(2), 107–119. DOI 10.12989/acd.2017.2.2.107. [Google Scholar] [CrossRef]
54. Altabey, W. A. (2017). An exact solution for mechanical behavior of BFRP Nano-thin films embedded in NEMS. Advances in Nano Research, 5(4), 337–357. DOI 10.12989/anr.2017.5.4.337. [Google Scholar] [CrossRef]
55. Zhao, Y., Noori, M., Altabey, W. A., Wu, Z. (2018). Fatigue damage identification for composite pipeline systems using electrical capacitance sensors. Smart Materials and Structures, 27(8), 085023. DOI 10.1088/1361-665X/aacc99. [Google Scholar] [CrossRef]
56. Kamili, W. (2012). Experimental study on lateral bearing capacity of composite adobe wall with timber frame, (Master Thesis) (in Chinese). [Google Scholar]
57. Michael, C. G., Nelson, T. K. L., John, L. W., Doherty, K. (2004). Experimental investigation of unreinforced brick masonry walls in flexure. Structural Engineering, 130(3), 423–432. [Google Scholar]
58. Rafi, M. M., Varum, H. (2017). Seismic performance of adobe construction. Sustainable and Resilient Infrastructure, 2(1), 8–21. [Google Scholar]
59. Samali, B., Jinwuth, W., Heathcote, K., Wang, C. (2011). Seismic capacity comparison between square and circular plan adobe construction. Procedia Engineering, 14, 2103–2108. [Google Scholar]
60. Zhao, Y., Noori, M., Altabey, W. A., Ghiasi, R., Zhishen, W. (2018). Deep learning-based damage, load and support identification for a composite pipeline by extracting modal macro strains from dynamic excitations. Applied Sciences, 8(12), 2564. DOI 10.3390/app8122564. [Google Scholar] [CrossRef]
61. Wang, T., Altabey, W. A., Noori, M., Ghiasi, R. (2020). A deep learning based approach for response prediction of beam-like structures. Structural Durability and Health Monitoring, 14(4315–338. DOI 10.32604/sdhm.2020.011083. [Google Scholar] [CrossRef]
62. Altabey, W. A.(2021) Applying deep learning and wavelet transform for predicting the vibration behavior in variable thickness skew composite plates with intermediate elastic support. Vibroengineering (in Press). DOI 10.21595/jve.2020.21480. [Google Scholar] [CrossRef]
63. Zhao, Y., Noori, M., Altabey, W. A., Naiwei, L. (2017). Reliability evaluation of a laminate composite plate under distributed pressure using a hybrid response surface method. International Journal of Reliability, Quality and Safety Engineering, 24(3), 1750013. DOI 10.1142/S0218539317500139. [Google Scholar] [CrossRef]
64. Altabey, W. A. (2017). Delamination evaluation on basalt FRP composite pipe of electrical potential Change. Advances in Aircraft and Spacecraft Science, 4(5), 515–528. DOI 10.12989/aas.2017.4.5.515. [Google Scholar] [CrossRef]
65. Altabey, W. A. (2017). EPC method for delamination assessment of basalt FRP pipe: Electrodes number effect. Structural Monitoring and Maintenance, 4(1), 69–84. DOI 10.12989/smm.2017.4.1.069. [Google Scholar] [CrossRef]
66. Altabey, W. A., Noori, M. (2017). Detection of fatigue crack in basalt FRP laminate composite pipe using electrical potential change method. 12th International Conference on Damage Assessment of Structures, IOP Conference Series: Journal of Physics, 842, 012079. [Google Scholar]
67. Altabey, W. A., Noori, M. (2018). Fatigue life prediction for carbon fibre/epoxy laminate composites under spectrum loading using two different neural network architectures. International Journal of Sustainable Materials and Structural Systems, 3(1), 53–78. DOI 10.1504/IJSMSS.2017.10013394. [Google Scholar] [CrossRef]
68. Altabey, W. A., Noori, M. (2018). Monitoring the water absorption in GFRE pipes via an electrical capacitance sensors. Advances in Aircraft and Spacecraft Science, 5(4), 411–434. DOI 10.12989/aas.2018.5.4.411. [Google Scholar] [CrossRef]
69. Altabey, W. A. (2016). FE and ANN model of ECS to simulate the pipelines suffer from internal corrosion. Structural Monitoring and Maintenance, 3(3), 297–314. DOI 10.12989/smm.2016.3.3.297. [Google Scholar] [CrossRef]
70. Altabey, W. A. (2016). Detecting and predicting the crude oil type inside composite pipes using ECS and ANN. Structural Monitoring and Maintenance, 3(4), 377–393. DOI 10.12989/smm.2016.3.4.377. [Google Scholar] [CrossRef]
71. Altabey, W. A. (2016). The thermal effect on electrical capacitance sensor for two-phase flow monitoring. Structural Monitoring and Maintenance, 3(4), 335–347. DOI 10.12989/smm.2016.3.4.335. [Google Scholar] [CrossRef]
72. Altabey, W. A., Noori, M., Alarjani, A., Zhao, Y. (2020). Tensile creep monitoring of basalt fiber reinforced polymers plates via electrical potential change and artificial neural network. Scientia Iranica, Transactions B: Mechanical Engineering, 27(4), 1995–2008. DOI 10.24200/SCI.2020.52754.2874. [Google Scholar] [CrossRef]
73. Altabey, W. A., Noori, M., Alarjani, A., Zhao, Y. (2020). Nano-delamination monitoring of BFRP nano-pipes of electrical potential change with ANNs. Advances in Nano Research, 9(1), 1–13. DOI 10.12989/anr.2020.9.1.001. [Google Scholar] [CrossRef]
74. Kost, A., Altabey, W. A., Noori, M., Awad, T. (2019). Applying neural networks for tire pressure monitoring systems. Structural Durability and Health Monitoring, 13(3), 247–266. DOI 10.32604/sdhm.2019.07025. [Google Scholar] [CrossRef]
75. Ghiasi, R., Ghasemi, M. R., Noori, M., Altabey, W. A. (2019). A non-parametric approach toward structural health monitoring for processing big data collected from the sensor network.Proceedings of the 12th International Workshop on Structural Health Monitoring, Stanford, California, USA. DOI 10.12783/shm2019/32395.2019. [Google Scholar] [CrossRef]
76. Ghiasi, R., Noori, M., Altabey, W. A., Silik, A., Wang, T., Wu, Z.(2021). Uncertainty handling in structural damage detection via non-probabilistic meta-models and interval mathematics, a data-analytics approach. Applied Sciences, 11(21–17,770. DOI 10.3390/app11020770. [Google Scholar] [CrossRef]
77. Lu, Z., Chen, X., Lu, X., Yang, Z. (2016). Shaking table test and numerical simulation of an RC frame-core tube structure for earthquake-induced collapse. Earthquake Engineering & Structural Dynamics, 45(9), 1537–1556. [Google Scholar]
78. Hallquist, J. O. (2007). LS-DYNA keyword user’s manual (Version 971). Livermore, California: Livermore Software Technology Corporation. [Google Scholar]
79. Galambos, T. V. (2000). Recent research and design developments in steel and composite steel-concrete structures in USA. Constructional Steel Research, 55(1–3), 289–303. [Google Scholar]
80. Kwasniewski, L. (2010). Nonlinear dynamic simulations of progressive collapse for a multistory building. Engineering Structures, 32, 1223–1235. [Google Scholar]
81. Yang, L. J., Liu, D. W., Guo, Z. L., Li, J., Dai, H. (2014). Engineering mechanics in whipping effect of high-rise building. Applied Mechanics and Materials, 540, 173–176. [Google Scholar]
82. Fei, S., Lou, M. L. (2012). Influence of high modes of super high-rise building on its seismic responses. Engineering Mechanics 29, 23–28. [Google Scholar]
83. Lu, X., Zhou, B., Zhao, B., Lu, W. (2015). Shaking table test and numerical analysis of a high-rise building with steel reinforce concrete column and reinforce concrete core tube. Structural Design of Tall and Special Buildings, 24(18), 1019–1037. [Google Scholar]
 | This work is licensed under a Creative Commons Attribution 4.0 International License, which permits unrestricted use, distribution, and reproduction in any medium, provided the original work is properly cited. |