| Structural Durability & Health Monitoring |
DOI: 10.32604/sdhm.2021.014815
ARTICLE
Detection of Cracks in Aerospace Turbine Disks Using an Ultrasonic Phased Array C-scan Device
1College of Automation Engineering, Nanjing University of Aeronautics and Astronautics, Nanjing, 210000, China
2Key Laboratory of Non-Destructive ‘Testing and Monitoring’ Technology for High-Speed Transport Facilities of the Ministry of Industry and Information Technology, Nanjing University of Aeronautics and Astronautics, Nanjing, 210000, China
3Key Laboratory of Nondestructive Testing of Ministry of Education Nanchang Hang Kong University, Nanchang, 341000, China
*Corresponding Author: Qian Xu. Email: xuqian_ndt@nuaa.edu.cn
Received: 01 November 2020; Accepted: 21 December 2020
Abstract: Crack detection in an aerospace turbine disk is essential for aircraft- quality detection. With the unique circular stepped structure and superalloy material properties of aerospace turbine disk, it is difficult for the traditional ultrasonic testing method to perform efficient and accurate testing. In this study, ultrasound phased array detection technology was applied to the non-destructive testing of aviation turbine disks: (i) A phased array ultrasonic c-scan device for detecting aerospace turbine disk cracks (PAUDA) was developed which consists of phased array ultrasonic, transducers, a computer, a displacement encoder, and a rotating scanner; (ii) The influence of the detection parameters include frequency, wave-type, and elements number of the ultrasonic phased array probe on the detection results on the near-surface and the far surface of the aerospace turbine disk is analyzed; (iii) Specimens with flat-bottom-hole (FBH) defects were scanned by the developed PAUDA and the results were analyzed and compared with the conventional single probe ultrasonic water immersion testing. The experiment shows that by using the ultrasonic phased array c-scan to scan the turbine disk the accuracy of the detection can be significantly improved which is of greater accuracy and higher efficiency than traditional immersion testing.
Keywords: Aerospace turbine disk; phased array ultrasonic; C-scan device; parameter optimization; flaw detection
Superalloy not only has excellent creep resistance, corrosion, and oxidation resistance but also have an extraordinary combination of toughness, high-temperature strength, creep resistance, excellent thermal fatigue, and resistance to degradation in an oxidizing or corrosive environment, which are widely used in the aerospace turbine disk [1]. The aerospace turbine disk is the core component of the aero engine. Superalloy material properties and fluctuations in manufacturing parameters may lead to various defects such as segregation, inclusions, holes, and cracks [2,3]. Moreover, the fatigue crack defects are often generated because of force complex and harsh conditions, and fatigue crack defects are often generated during service [4]. It may also cause serious consequences if there has a small defect in the aerospace turbine disk [5]. Thus, it is necessary to test the aerospace turbine disk which is minted and in service by nondestructive [6]. For the non-destructive testing technology of turbine disks, the relatively mature ultrasonic testing technologies at home and abroad include the early manual contact pulse-echo method and ultrasonic immersion method [7–10]. The navigation mark HB/Z34-1998 stipulates that the aero-space disk should be used for ultrasonic immersed testing [11]. Affected by the stability of mechanical scanning and the factors of subjective and objective traditional ultrasonic methods have poor detection accuracy and low detection efficiency which can only ensure that defects larger than a certain size are not missed. Meanwhile, the detection time needs more than ten hours and efficiency is low. Moreover, the focus depth of the transducer can’t be changed and the flexibility is poor [12].
Phased array ultrasonic testing (PAUT) has been used in recent years for various non-destructive (NDT) applications in areas including aerospace, railway, oil and gas, nuclear power, and other fields [13,14]. Phased array ultrasound c-scan imaging detection technology generally uses one-dimensional linear array probes for linear scanning. The one-time scanning width and scanning depth have greater advantages, and its detection efficiency is much higher than conventional single-channel ultrasonic testing equipment solves the problem that high resolution and large detection range cannot be achieved at the same time, and has higher application. According to different application objects [15], there are many kinds of ultrasonic c-scan detection devices, such as planar scan device, revolving device, great non-planar scan device, revolving feed scan device for bars and tubes, and portable scan device. Domestic and foreign institutions and research scholars have also developed a series of scanning devices for testing.
Howards et al. [16] used the phased array ultrasonic device to detect aviation casting titanium alloy materials, which increased the detection efficiency by 10 times and optimized the performance of castings. Kim et al. [17] designed a phased array ultrasonic device for detecting rail cracks (PAUSR) and use the device to carry out scanning inspection of cracks and welding defects. Zhou et al. [18] developed a phased array ultrasonic immersion c-scan system and successfully apply it to the detection of different material samples. Wang et al. [19] designed a phased array ultrasonic scanning mechanical trolley device with encoder and wedges to detect friction stir welds in sheets. The Beijing Institute of Aeronautical Materials designed a three-axis device for water immersion detection that was suitable for cylinders, cones, and circular table sides with certain diameters [20]. Mahaut et al. [21] develop an array ultrasonic automatic detection system for components such as thick-walled pipes that were difficult to penetrate by conventional detection methods, which improved the detection signal-to-noise ratio and resolution. There is a lack of an ultrasonic phased array scanning device for the aerospace turbine disk. Besides, the existing equipment is not only complex in structure but also bulky, which is not convenient for disassembly and maintenance. It is limited to use under complex working conditions.
In this study, ultrasound phased array detection technology is applied to the non-destructive testing of aviation turbine disks. First of all, the PAUDA integrated with PA ultrasonic transducer, PA board, coupling, displacement, encoder rotating, scanner, and computer are designed for accurate safe, and high-efficiency aerospace turbine disk inspection. Its performance test is conducted by Non-destructive characterization and verification of ultrasonic phased array equipment. Meanwhile, the influence of the detection parameters such as the frequency, wave-type, and elements number of the ultrasonic phased array probe on the detection results on the near-surface and the far surface of the aerospace turbine disk is analyzed. The detection parameter setting rules for near-surface and far surface defects in turbine disk are given, which provides a basis for scanning configuration for actual c-scan imaging detection of aviation turbine disks. To explore the ability and the accuracy of detection when a phased array detects an aerospace turbine disk, traditional immersion testing and phased array ultrasonic c-scan testing are performed. The result proved that for the disc forging the scanning efficiency and detection ability of the device developed in this paper are much higher than that of the conventional ultrasonic water immersion c-scan testing.
Phased array ultrasonic detection technology is developed based on radar technology, and its transducer working principle is based on the Huygens-Fresnel principle. Each wafer in the ultrasonic phased array is called a unit. When each unit is excited by the pulse signal of the same frequency, the sound pressure amplitude of the ultrasonic wave emitted by each unit in the array at certain points in the space is superimposed in phase due to the sound waves. While being enhanced, the sound pressure at other points is weakened due to the anti-phase cancellation of sound waves, thus forming a stable phased array ultrasonic sound field in space. When each unit in the phased array ultrasonic transducer is controlled by a certain rule and timing electronic system, the ultrasonic waves emitted by each unit in the array will be superimposed into a new wavefront. the ultrasonic phased array transducer is receiving the pulse return when the signal is waved, the receiving unit is controlled according to certain rules and timing to synthesize the signal and obtain the display image [22]. Therefore, by controlling the excitation time of each wafer, the sound beam can be deflected and focused.
The c-scan shows the acoustic image of the cross-sectional echo of the sample perpendicular to the propagation direction of the sound beam, that is, the acoustic image of the cross-section of the tested workpiece at a certain distance from the surface where the probe is located. The probe moves with the scanning mechanism along the surface of the workpiece according to certain rules, and an acoustic image with a certain depth from the surface of the workpiece can be obtained [23,24]. Because the focal length of the probe is fixed, a conventional c-scan need to constantly replace the probe to change the focal length to increase the intensity of the transmitted signal. Phased array ultrasound c-scan can improve the detection capability by adjusting the focus depth of the transducer and changing the aperture size. The cross-sectional imaging of the workpiece area within a certain range can be performed without moving the transducer along the direction of the stepping axis, and the detection resolution of the stepping axis is equal to the distance between the array elements, which can quickly obtain high-resolution c-scan images. The schematic comparison of the c-scan detection path as shown in Fig. 1.
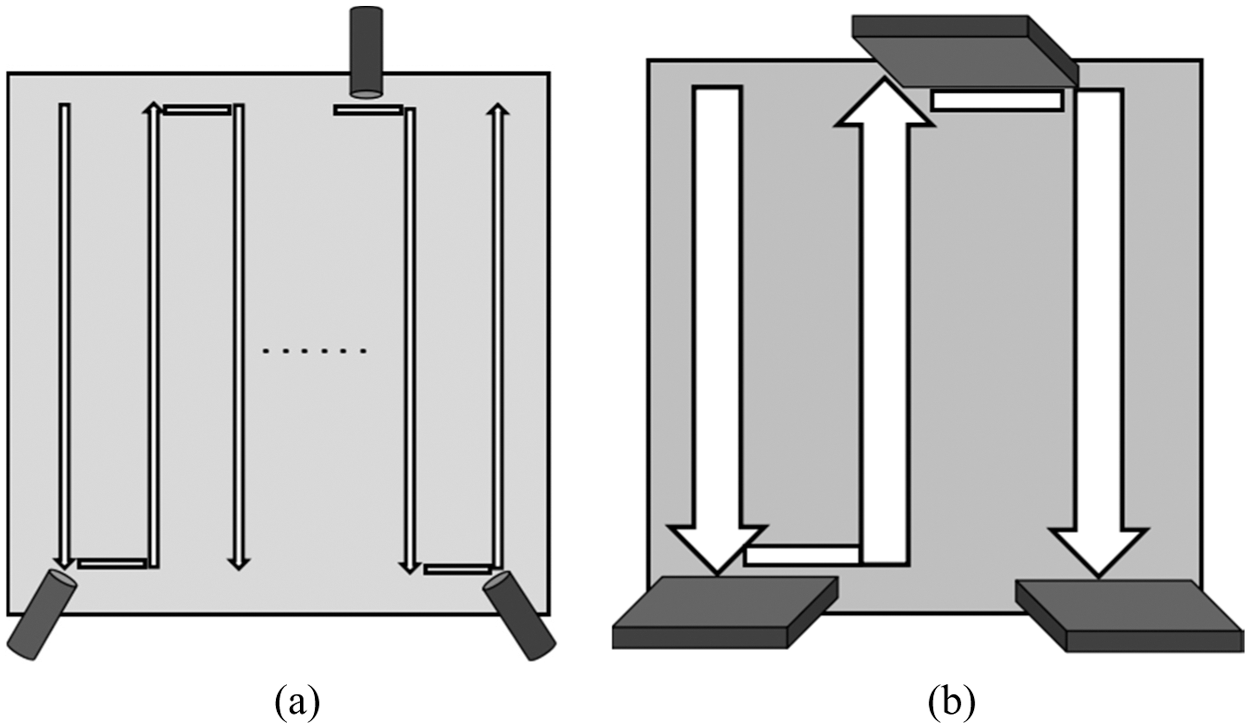
Figure 1: Comparison of conventional c-scan and phased array c-scan. (a) Scan path of conventional ultrasound probe; (b) Phased array ultrasound probe scanning path
The experiment was based on phased array ultrasonic electronic linear scanning and imaging algorithms combined with a self-built mechanical scanning device to carry out research c-scan imaging detection on aerospace turbine disk. The motion control system is composited of the computer, phased array detection instrument, phased array probe, placement encoder, and scanner, as shown in Fig. 2. The upper computer was used to communicate with the instrument and test data collection. Phased array detectors had the function of calculating the focus law and displaying the scanned image in real-time. The phased array probe was connected to the instrument to excite and receive ultrasonic waves. The displacement signal output terminal of the displacement encoder was connected with the displacement signal input terminal of the ultrasonic phased array which can collect the position information of the scanned part. The scanner included the rotation axis connected with a displacement encoder three-degree-of-freedom telescopic truss connected with the rotation axis and probe clamp connected with the truss through a slider. The lifting and telescoping trusses were connected to the rotation axis to realize 360 degrees scanning and inspection of the stepped surface of the turbine disc at different heights. The probe can be accurately positioned to the scanning surface by fine adjustment of the slider. Meanwhile, the probe holder mounted was fitted with a spring loading actuator that can ensure sufficient coupling force.
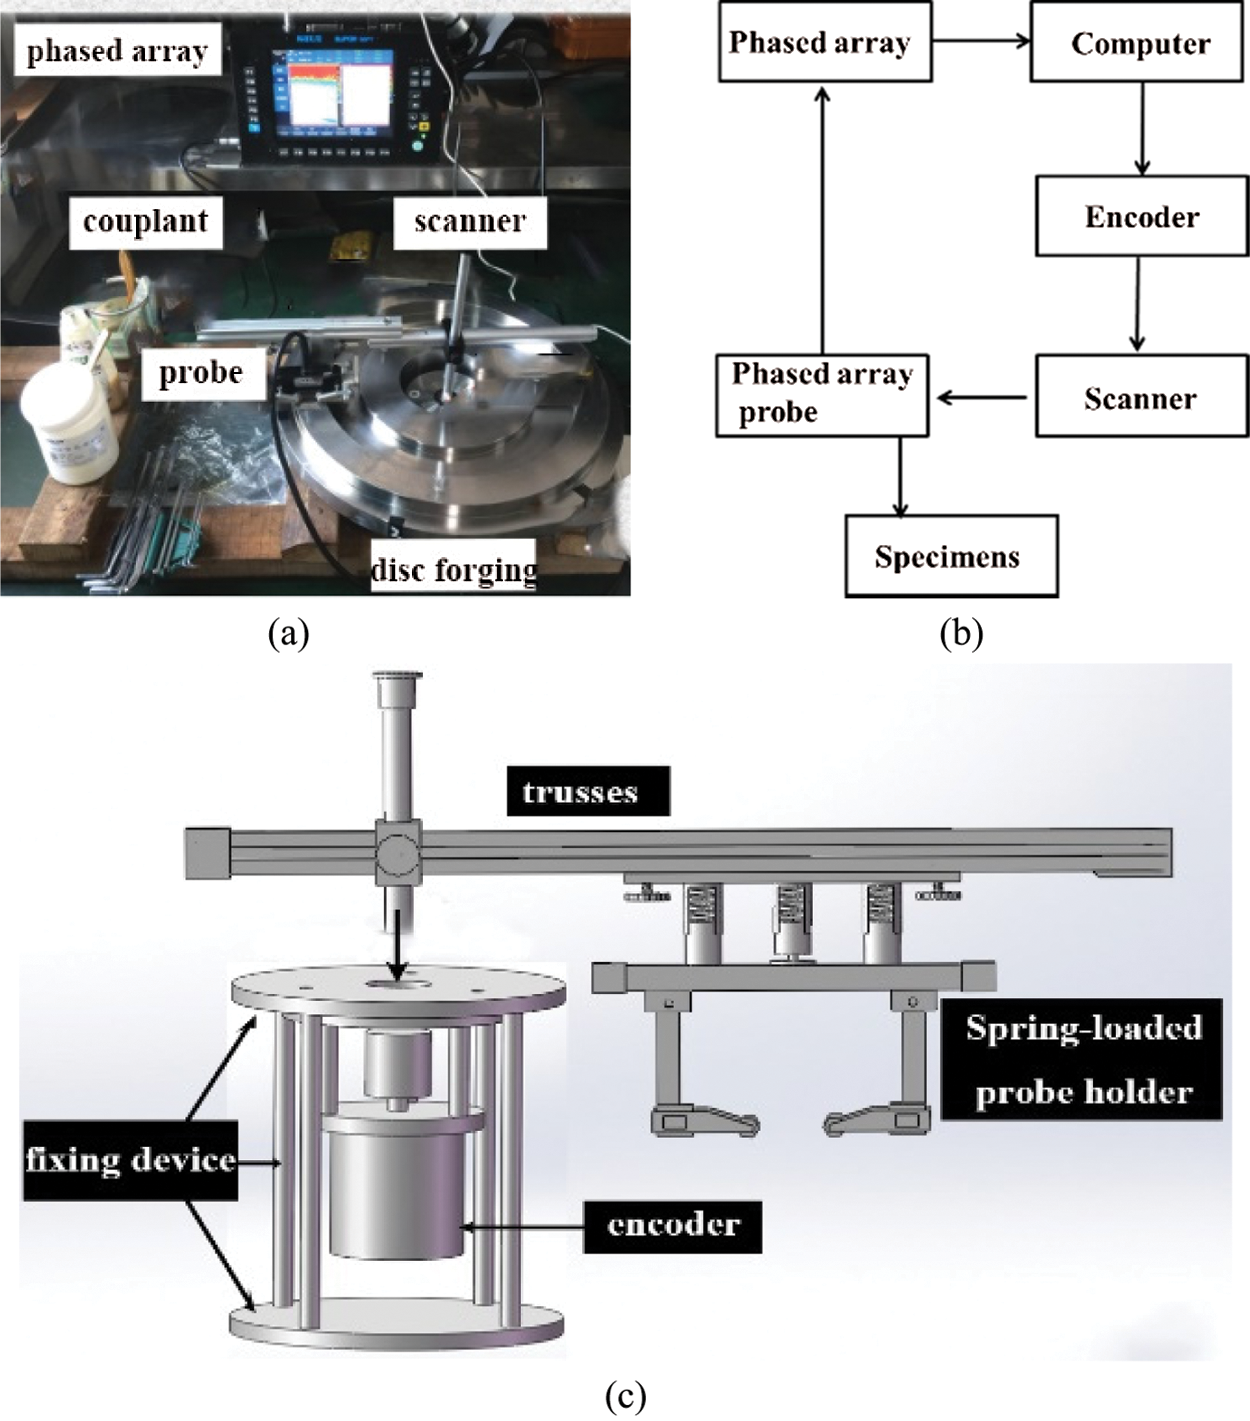
Figure 2: The overall diagram of PAUDA. (a) Main components of ultrasonic phased array testing system; (b) The systematic diagram; (c) Structure of rotary scanner
The tested specimen was an aerospace turbine disk. For the convenience of description, the upper and lower sides of the aerospace turbine disk were marked as the A defect side, the B testing side. Fig. 3 shows artificial defective specimens with FBH defects, Fig. 3a shows the FBH defects side, Fig. 3b shows the detection side. There were 6 FBH defects on the A-side and the B-side, the B-side has E1, E2, E3, E4 four-step detection side from the outside to the center of the aerospace turbine disk. 0.8 mm, 1.2 mm diameter FBH defects at 50 mm depth were processed in E2-side. 0.8 mm, 1.2 mm diameter FBH defects at 2.5 mm depth were processed in E3-side. 0.8 mm, 1.2 mm diameter FBH defects at 2.5 mm depth were processed in E3-side, due to the complex structure of the disc forging, in addition to the FBH defects reflection wave, the probe can also receive the bottom echoes from the disc forging F1, F2, F3, F4, F5 side and K1, K2, K3, K4 block corner reflection. The sectional view of the disc forging, as shown in Fig. 4.
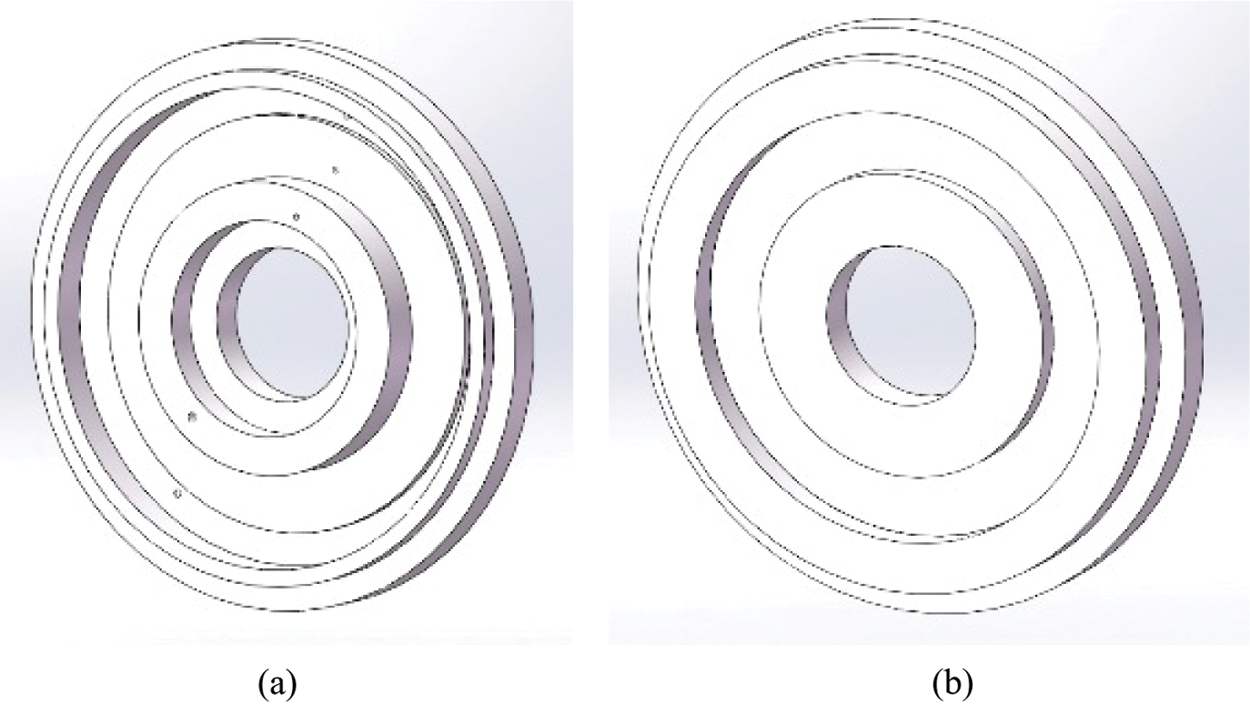
Figure 3: Artificial defective specimens with FBH defects. (a) A-defect side; (b) B-detection side
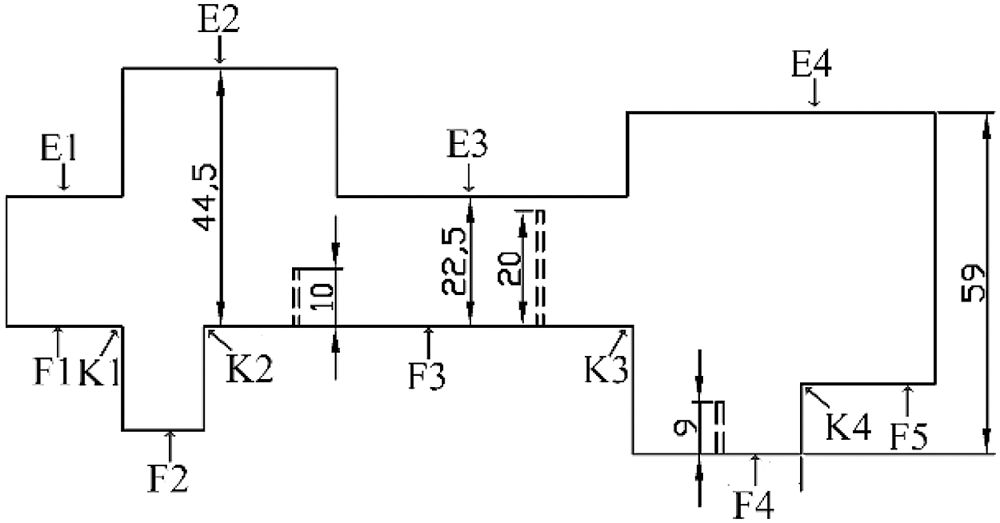
Figure 4: Half-section size drawing of turbine disk with flat-bottom hole defect (unit: mm)
The high-temperature turbine impeller is one of the hot end parts of an aero engine. Its grains are relatively large, and the turbine disk itself is thick and complex. Therefore, choosing the best ultrasonic phased array inspection process parameters to improve defect detection sensitivity and imaging resolution is a key step. To compare the imaging quality of defects under different inspection parameters and give the optimal parameter settings for turbine disc phased array ultrasonic inspection, the probes are placed on the three defective inspection surfaces of surface B, E2, E3, and E4, respectively. Move the probe in the circumferential direction of the turbine disc to observe the scanned image of the phased array FBH defects sector. Since the number and position of the excitation array elements will affect the detection signal, to enable the main sound beam to gather at the FBH defects to obtain higher energy, when an obvious defect echo signal is found during detection, move the probe back and forth to find the highest defect echo place, save the image recording inspection data. Analyze the influence of test parameter settings on 1.2 mm diameter FBH defects detection with a depth of 50 mm on the far-surface and a depth of 2.5 mm on the near-surface. By comparing and analyzing the image quality of ultrasonic phased array detection different parameters, the optimal parameter settings for scanning detection in the near-surface area and the far surface area are determined.
The image quality evaluation standards mainly include system gain, signal-to-noise ratio, and near-surface image resolution. The gain of the system is the gain required when the reflected echo of the defect on the image reaches a certain amplitude. The image-to-noise ratio is the ratio of the highest amplitude of the defect to the highest amplitude of the noise. The image resolution is the decibel difference between the peak and valley of the characteristic signal. During the test, change a single parameter to obtain near-surface and far-surface detection images and extract A-wave signals under the same scanning line. Analyzing and comparing image gain, signal-to-noise ratio, and image resolution. Finally, give the optimal combination of near and far surfaces of the turbine disk.
Fig. 5 shows the test results when the sound beams of different frequency probes are focused at 2.5 mm. The test results of 5 MHz and 7.5 MHz are shown in Figs. 5a and 5b where the image gains are 40.4 dB and 39.9 dB, respectively. The A wave signal of Figs. 5c and 5d shown that the image signal-to-noise ratio is 11.42, 7.4 and the image resolution is 2.5 dB, 8.5 dB. As seen in Fig. 5, when the center frequency is 7.5 MHz, the detection sensitivity and image signal-to-noise ratio are better than 5 MHz, which is more suitable for the detection of near-surface areas.
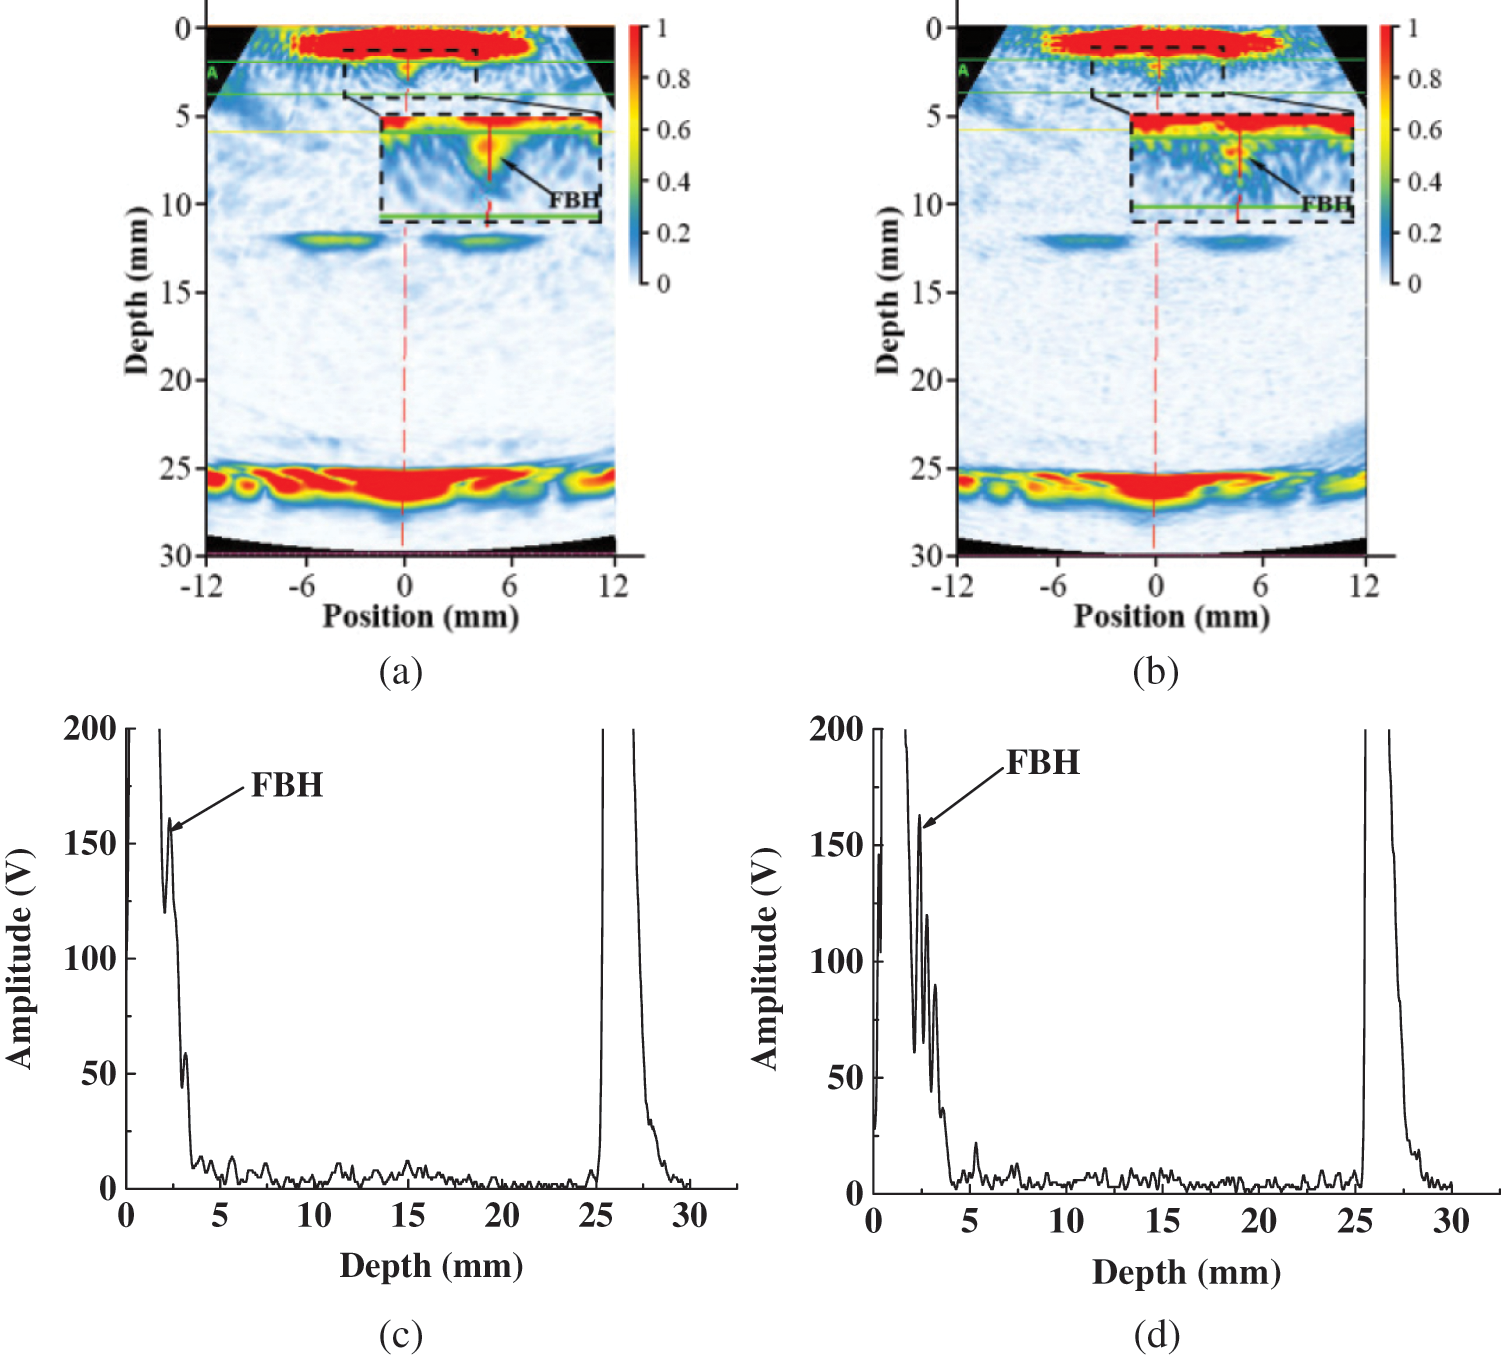
Figure 5: Effect of different frequency on the test results of the near-surface. (a) Detection map of 5 MHz; (b) Detection map of 7.5 MHz; (c) A wave signal of 5 MHz; (d) A wave signal of 7.5 MHz
Fig. 6 shows the test results when the sound beams of different frequency probes are focused at 50 mm. The test results of 2.25 MHz and 5 MHZ are shown in Figs. 6a and 6b where the image gains are 21 dB and 30 dB, respectively. The A wave signal of Figs. 6c and 6d shown that the image signal-to-noise ratio is 3.14 and 1.82, respectively. As seen in Fig. 6, on the same amplitude, the 2.5 MHz probe requires again lower than 5 MHz and the 2.5 MHz probe has a higher signal-to-noise ratio. However, the defect has less distortion at the 5 MHz frequency. In actual inspection, we can choose a 2.5 MHz probe to obtain higher detection sensitivity, but when we want to obtain higher defect imaging quality, 5 MHz frequency is more suitable.
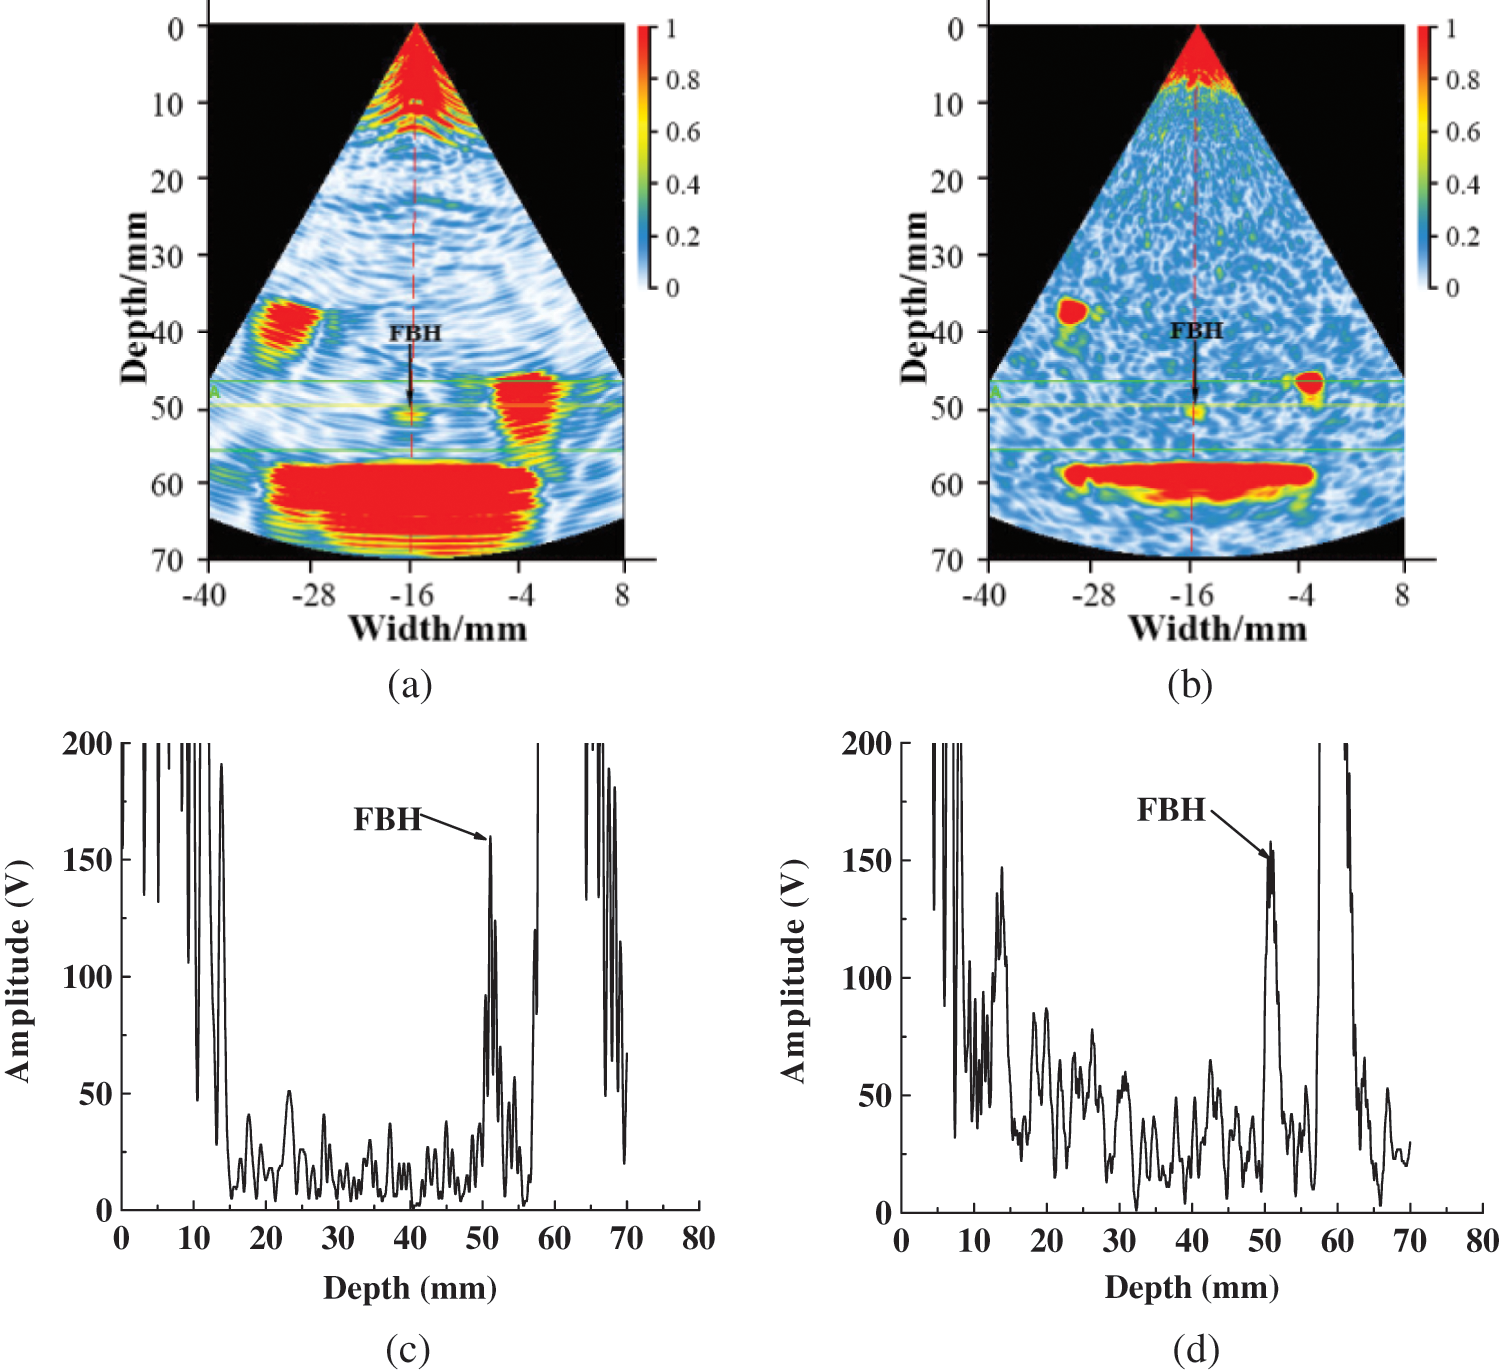
Figure 6: Effect of different frequency on the test results of the far surface. (a) Detection map of 2.25 MHz; (b) Detection map of 5 MHz; (c) A wave signal of 2.25 MHz; (d) A wave signal of 5 MHz
Fig. 7 shows the test result of the sound beams focused at 2.5 mm when the probe is excited with different wave-type. The test results of L-wave and T-wave are shown in Figs. 7a and 7b where the image gains are 40.2 dB and 39.9 dB, respectively. The A-wave signal of Figs. 7c and 7d shown that the image signal-to-noise ratio is 1.71, 1.77 and the image resolution is 14.2 dB, 8.5 dB. As seen in Fig. 7, both L-wave and T-waves can effectively detect FBH defects. Although the image resolution of L-wave detection is high, its signal-to-noise ratio is low and the depth measurement of defects is not accurate. Due to the high energy of the T-wave and the concentration of the sound beam, it is suitable for near-surface detection wave-type.
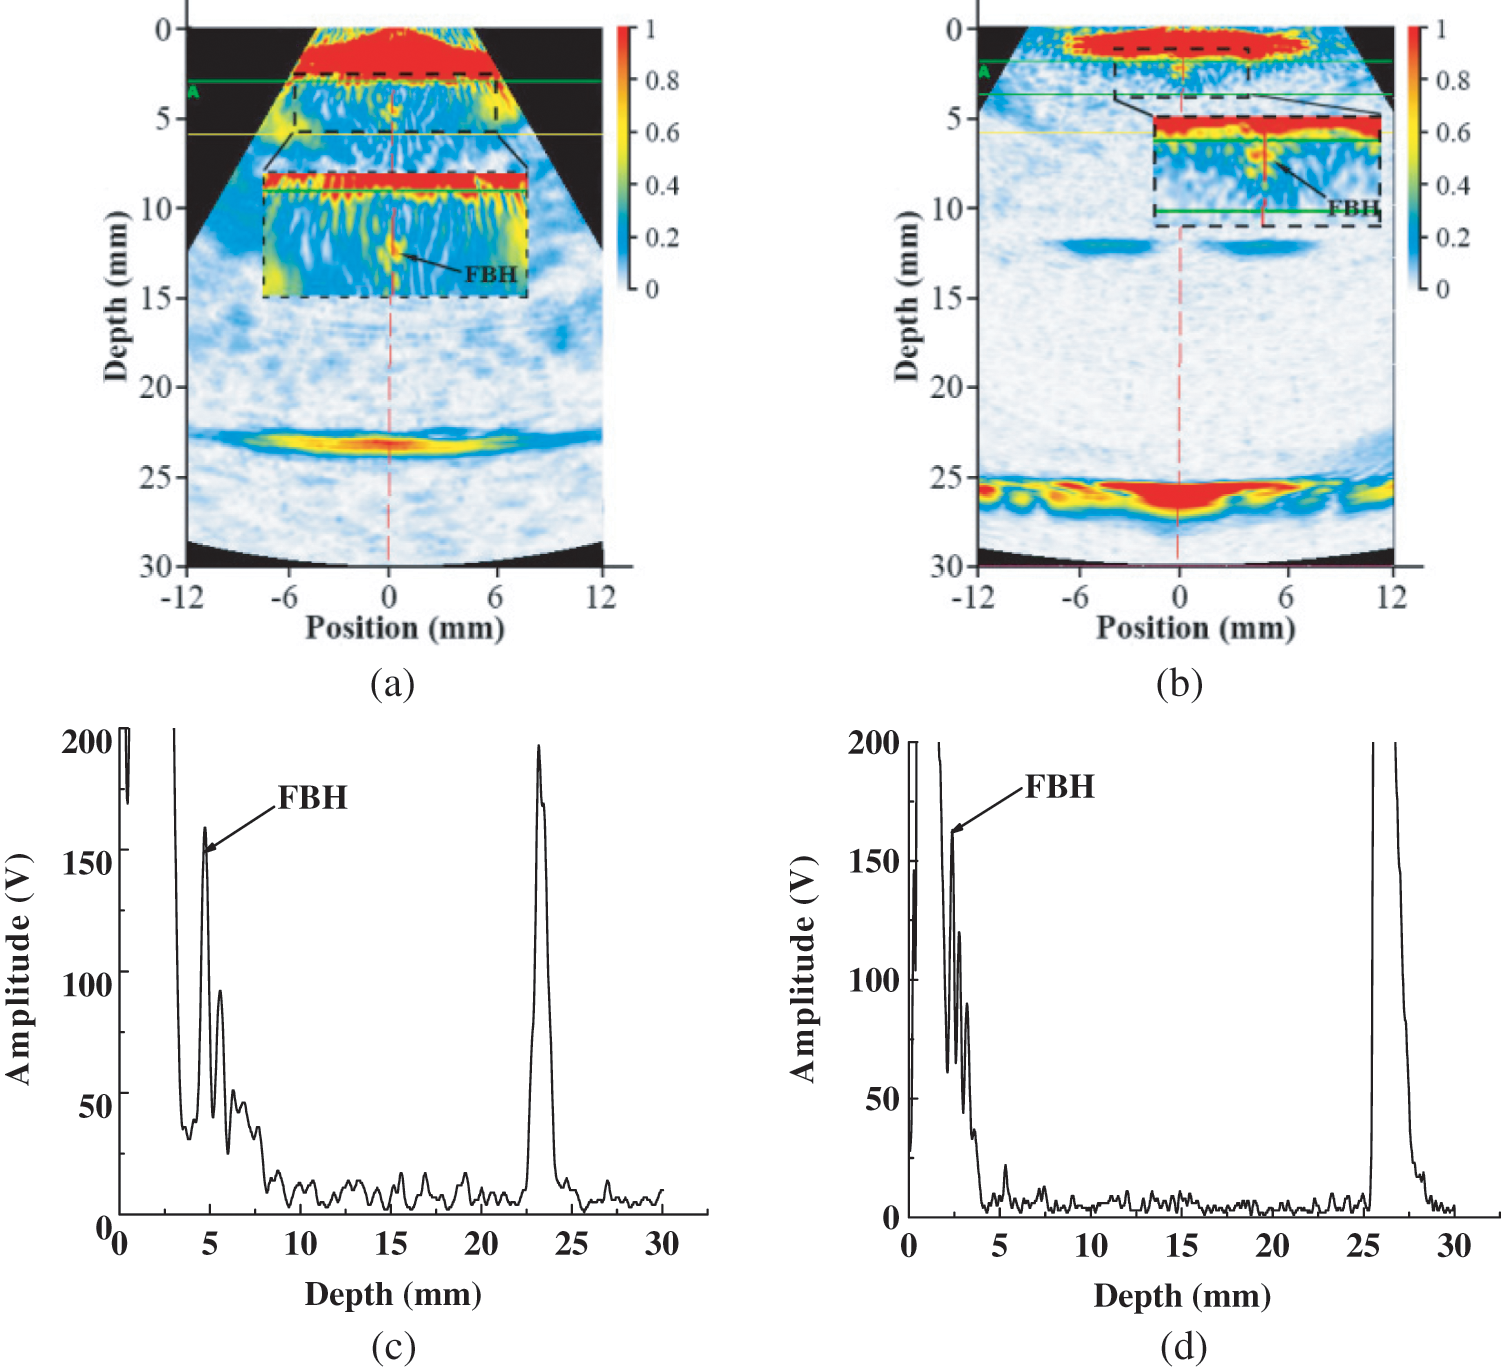
Figure 7: Effect of different wave-type on the test results of the near-surface. (a) Detection map of L-wave; (b) Detection map of T-wave; (c) A wave signal of L-wave; (d) A wave signal of T-wave
Fig. 8 shows the test result of the sound beams focused at 50 mm when the probe is excited with different wave-type. The test results of L-wave and T-wave are shown in Figs. 8a and 8b where the image gains are 30 dB and 37.8 dB, respectively. The results in Fig. 8 shows that L-wave can effectively detect FBH defects, while T-wave is difficult to detect. Due to the high attenuation of the beam energy of the T-wave at the far surface, the L-wave with less energy attenuation is more suitable for detection on the far surfaces.
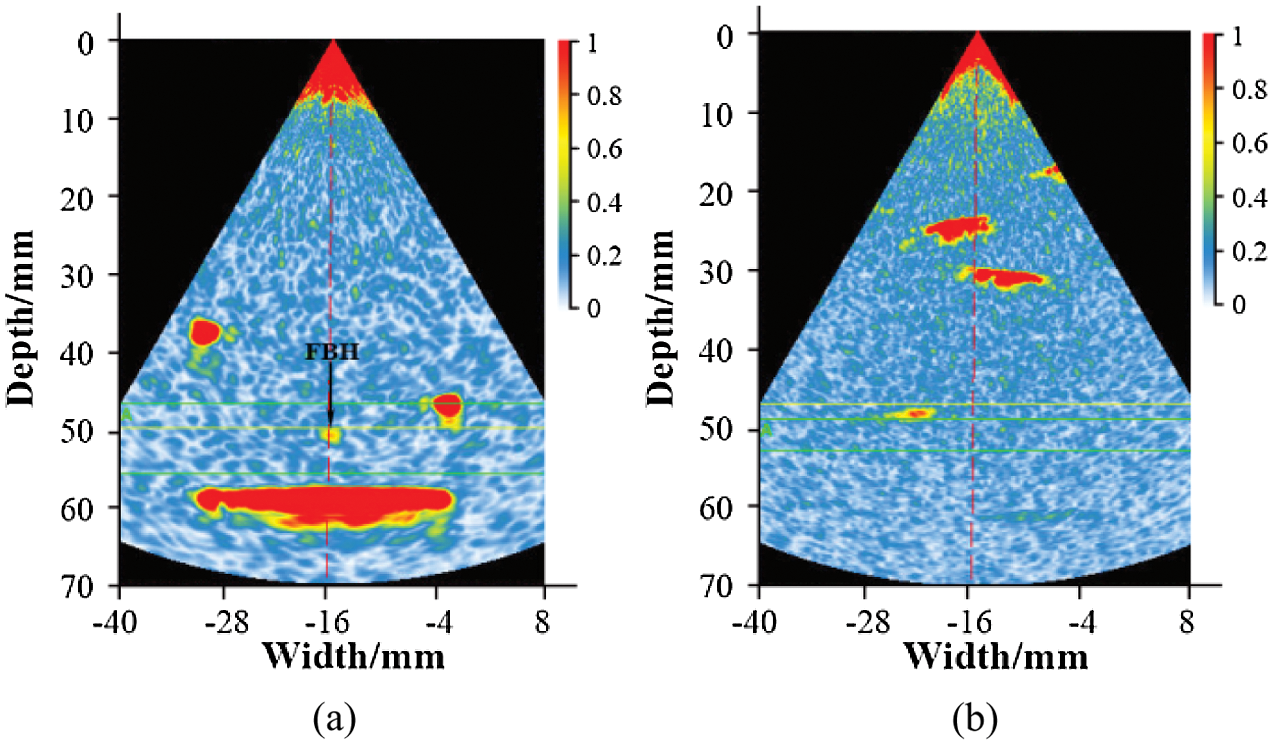
Figure 8: Effect of different wave-type on the test results of the far surface. (a) Detection map of L-wave; (b) Detection map of T-wave
Fig. 9 shows the test results of focusing the sound beam at 2.5 mm with a different number of elements. The test results of 16 elements and 32 elements are shown in Figs. 9a and 9b where the image gains are 46 dB and 39.9 dB, respectively. The A wave signal of Figs. 9c and 9d shown that the image signal-to-noise ratio is 3.88, 7.36 and the image resolution is 10 dB, 8.5 dB. The results in Fig. 9 shows that the gain of 32 elements is less than that of 16 elements at the same amplitude and the signal noise of 32 elements is higher than that of 16 elements, but the image resolution of 32 elements is lower than that of 16 elements. So 16 elements are is more suitable for near-surface detection.
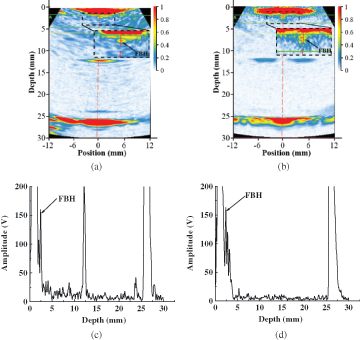
Figure 9: Effect of different number of elements on the test results of the near-surface. (a) Detection map of 16 elements; (b) Detection map of 32 elements; (c) A wave signal of 16 elements; (d) A wave signal of 32 elements
Fig. 10 shows the test results of focusing the sound beam at 50 mm with a different number of elements. The test results of 16 elements and 32 elements are shown in Figs. 10a and 10b where the image gains are 38.8 dB and 30 dB, respectively. The results in Fig. 10 shows that 16 elements are difficult to detect defects. Due to the material attenuation of the sample is large, the noise is large, and the defect aperture of FBH defect is small, the reflection echo is weak, and the 32 array element with high energy is more suitable for detection. Due to the superalloy turbine disk has coarse grains and FBH defects reflect weak echo, the 32 elements with high beam energy is more suitable for detection.
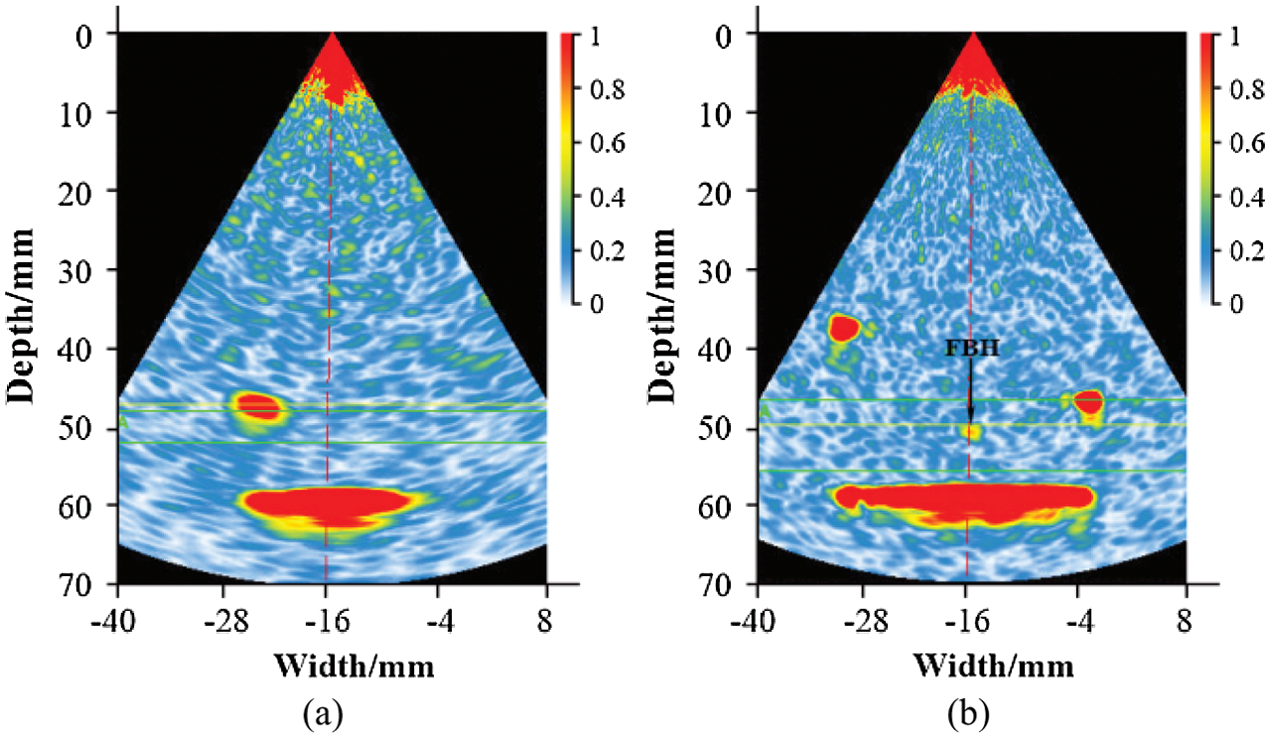
Figure 10: Effect of different number of elements on the test results of the far-surface. (a) Detection map of 16 elements; (b) Detection map of 32 elements
Parameter optimization experiments show that frequency, wave type, and element number will affect the detection results of the near-surface and far surface area. Configuring a 7.5 MHz probe, set up 16 elements, and exciting T-waves are beneficial for near-surface area detection. Configuring a 5 MHz probe or 2.25 MHz probe, set up 32 elements, and exciting L-waves are beneficial for far-surface area detection. Detection parameters of different areas for the aerospace disc are listed in Tab. 1.
Table 1: Detection parameters of different areas for the aerospace disc

In the experiment encoder fixing device was placed in the hollow disk hub of the disc forging and the probe was fixed on the probe holder mounted. Because the c-scan shows the echo sound image of the cross-section of the sample perpendicular to the sound beam propagation direction the array elements should be arranged along the radial direction of the turbine disc when the probe is scanned along the circumference of the disc forging the testing. The probe was respectively pushed down on the three detecting sections of disc forging B side E2, E3 and E4 by adjusting manually telescopic and lifting rotary trusses. According to different diameters testing-side, the encoder needs to be calibrated before each testing. Slowly push the truss to drive the phased array probe to make a uniform circular motion along the surface of the disc forging, meanwhile, rotary encoder records the rotation angle to collect the position information of the detection probe, so that the ultrasonic phased array equipment can complete the real-time scanning and imaging work.
First, the disc forging specimen was tested using a conventional single probe ultrasonic water immersion C-scan testing. The testing results were shown in Fig. 11. Fig. 11a shows that 1.2 mm, 0.8 mm diameter FBH defects at 2.5 mm depth can be scanned by immersion testing, and the image had a good near-surface resolution. Fig. 11b shows that 1.2 mm diameter FBH defects at 34 mm depth can be scanned by immersion testing. With the low-quality images 0.8 mm diameter FBH defects at 34 mm depth were not detected.
Figure 11: Immersion c-scan results in different depth regions. (a) Immersion c-scan result of FBH defects at 2.5 mm depth; (b) Immersion c-scan result of FBH defects at 34 mm depth
To verify the performance of the fabricated scanner for aerospace turbine disk and the ability of phased array detection artificial defective specimens with FBH defects were scanned by the developed PAUDA. The results are shown in Fig. 12. Figs. 12a and 12b show the phased array c-scan result of 0.8 mm, 1.2 mm diameter FBH defects at 2.5 mm depth. The detection image of the 2.5 mm depth hole has a higher resolution and less distortion which has the same detection capability as the conventional immersion testing in Fig. 11a. Figs. 12c and 12d show phased array c-scan result of 0.8 mm, 1.2 mm diameter FBH defects at 34 mm depth. It not only can detect 1.2 mm diameter FBH defects at 34 mm depth but also detect 0.8 mm diameter FBH defects at 34 mm. In the contrast, the detection image has the worst imaging effect by the traditional immersion testing in Fig. 11b. In addition, 0.8 mm, 1.2 mm diameter FBH defects at 50 mm depth were scanned by the developed PAUDA as shown in Figs. 12e and 12f. The feature of phased array ultrasonic c-scan images is listed in Tab. 2.
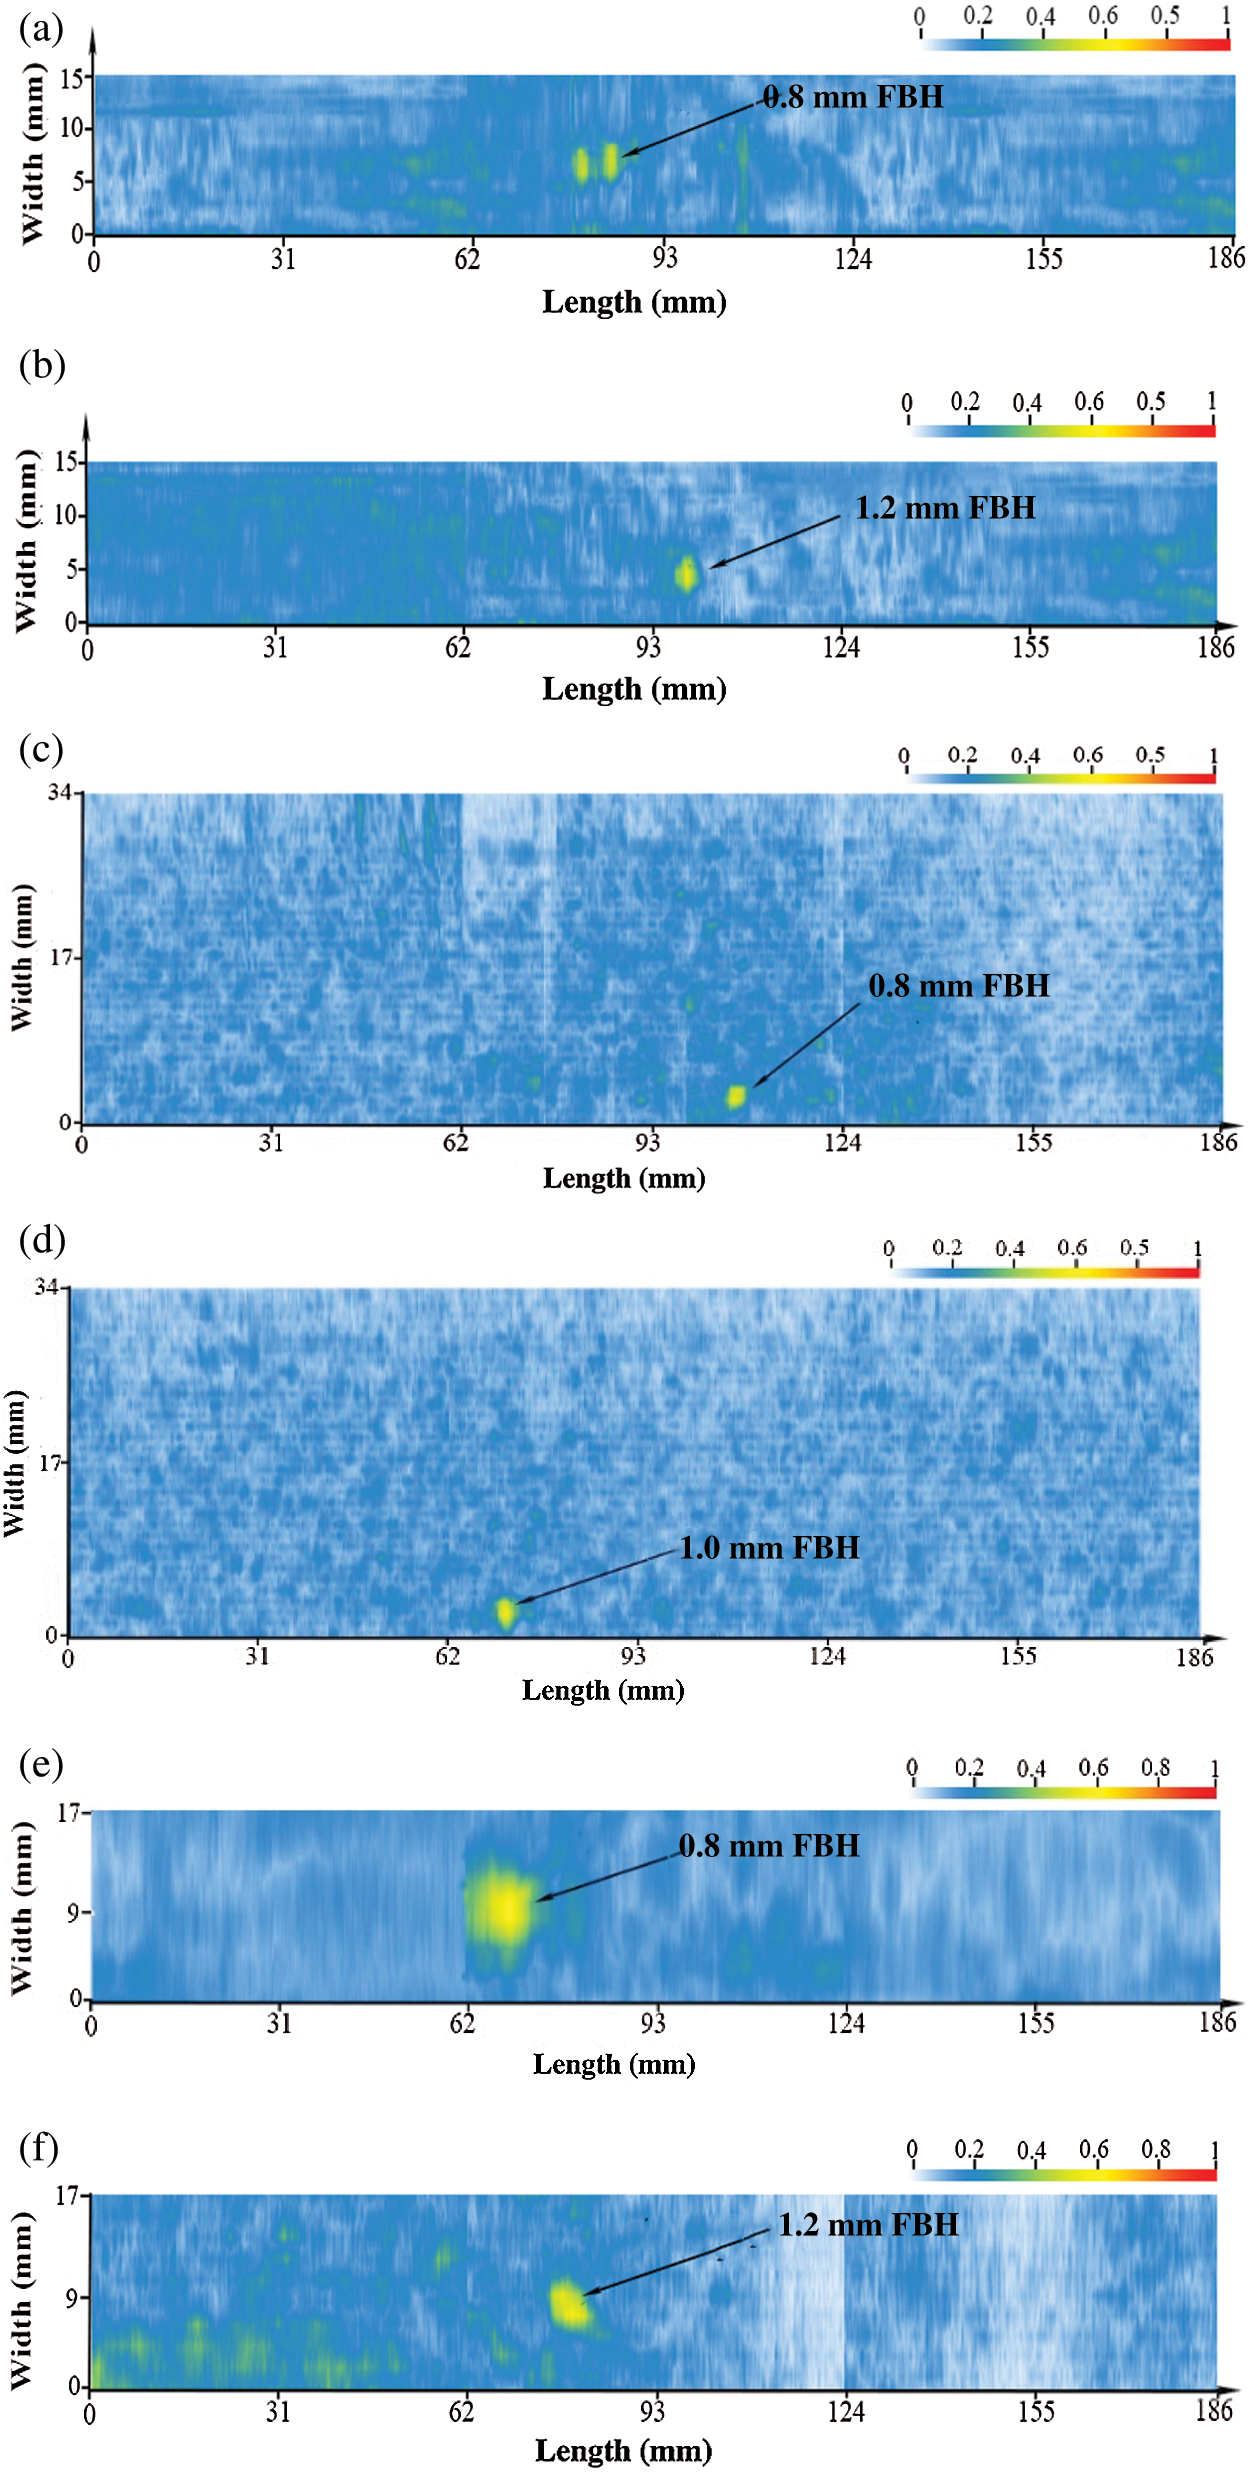
Figure 12: Ultrasonic phased array c-scan result in different depth region. (a) 2.5 mm depth and 0.8 mm diameter FBH; (b) 2.5 mm depth and 1.2 mm diameter FBH; (c) 34 mm depth and 0.8 mm diameter FBH; (d) 34 mm depth and 1.2 mm diameter FBH; (e) 50 mm depth and 0.8 mm diameter FBH; (f) 50 mm depth and 1.2 mm diameter FBH
Table 2: The feature of phased array ultrasonic C-scan images

(1) The phased array ultrasonic inspection capability is superior to conventional ultrasonic, and it can perform accurate and efficient non-destructive inspection of various defects in the complex structure of the superalloy aerospace turbine disk.
(2) Optimization of ultrasonic phased array detection parameters of aerospace turbine disk different depth areas can effectively improve detection accuracy and improve imaging quality. In the actual detection of the near-surface area of the aviation turbine disc, using a high-frequency probe, set a small element number, and excite the T-wave can obtain higher image resolution and high image quality, which is convenient for subsequent qualitative and quantitative research. Using a medium and low-frequency probe, set more array elements, and exciting L-waves are beneficial to the detection of the far surface area of the aviation turbine disk.
(3) The developed phased array ultrasonic C-scan device for detecting aerospace turbine disk cracks has greatly improved the detection efficiency and the detection ability compared to the conventional ultrasonic water immersion C-scan device. Moreover, it has the advantages of convenient operation, high precision, and low cost.
Funding Statement: This work was funded by the National Natural Science Foundation of China [Grant Nos. 11664027, 11374134], The National Natural Science Foundation of Jiangxi Province [Grant No. 20161BAB216101], Key Laboratory of Non-Destructive Testing and Monitoring Technology for High-Speed Transport Facilities of the Ministry of Industry and Information Technology, Nanjing University of Aeronautics and Astronautics, The Key Laboratory of Nondestructive Testing of Ministry of Education Nanchang Hang Kong University, Nanchang, China.
Conflicts of Interest: The authors declare that they have no conflicts of interest to report regarding the present study.
1. Petronic, S., Drecun-Nesic, S., Milosavljevic, A., Sedmak, A., Popovic, M. et al. (2009). Microstructure changes of nickel-base Superalloys induced by interaction with femtosecond laser beam. Acta Physica Polonica-Series A General Physics, 116(4), 550–552. DOI 10.12693/APhysPolA.116.550. [Google Scholar] [CrossRef]
2. Liu, H. S., Yan, B. H., Huang, F. Y., Qiu, K. H. (2005). A study on the characterization of high nickel alloy micro-holes using micro-EDM and their applications. Journal of Materials Processing Technology, 169(3), 418–426. DOI 10.1016/j.jmatprotec.2005.04.084. [Google Scholar] [CrossRef]
3. Halevi, B., Lin, S., Roy, A., Zhang, H., Jeroro, E. et al. (2013). High CO2 selectivity of ZnO powder catalysts for methanol steam reforming. Journal of Physical Chemistry C, 117(13), 6493–6503. DOI 10.1021/jp308976u. [Google Scholar] [CrossRef]
4. Feist, W. D., Mook, G., Taylor, S., Söderberg, H., Mikic, A. et al. (2004). Non-destructive evaluation of manufacturing anomalies in aero-engine rotor disks. 16th World Conference on Non-Destructive Testing, Montreal, 30(3.9), 1–8. [Google Scholar]
5. Zhou, X. M. (2006). Genetic characteristic and damage mechanical behavior of non-metallic inclusions in P/M superalloy. Beijing: AVICI Beijing Institute of Aeronautical Materials. [Google Scholar]
6. Wang, W. G., Gu, Y. X., Qing, H. (2006). Investigation of disk LCF life prediction and its experimental verification. Journal of Aerospace Power, 21, 862–866. [Google Scholar]
7. Chen, Q., Guo, H., Zhang, C., Liu, X. (2014). Structural optimization of uniaxial symmetry non-circular bolt clearance hole on turbine disk. Chinese Journal of Aeronautics, 27(5), 1142–1148. DOI 10.1016/j.cja.2014.03.026. [Google Scholar] [CrossRef]
8. Hu, B., Yu, R. Q., Xu, W. J. (2015). Micro-magnetic NDT for surface crack defectin a GH4169 turbine discsimulated by artificialgroove. Acta Aeronautica et Astronautica Sinica, 36, 3450–3456. [Google Scholar]
9. Zhao, X. J. (2020). Study on the blind area of ultrasonic water immersion test for Aerospace disks used in Aeroengines. Heavy Casting and Forging, 5, 34–37. DOI 10.14147/j.cnki.51-1396/tg.2020.05.014. [Google Scholar] [CrossRef]
10. Ren, Y., Zhang, C. C., Gao, J. Y. (2016). Actual service life computation method for turbine discs containing defects. Science Technology and Engineering, 16(12), 149–156. [Google Scholar]
11. Beijing Institute of Aeronautical Materials. (1998). HB/Z34-1998 Ultrasonic inspection of deformed high-temperature alloy discs and discs, pp. 1–2. Beijing: Aviation Industry Press. [Google Scholar]
12. Kryukov, I. I., Leont’ev, S. A., Platonov, V. S., Rybnikov, A. I. (2008). Testing of discs of turbine rotors of gas compressors with the dye penetrant nondestructive testing technique. Russian Journal of Nondestructive Testing, 44(8), 542–547. DOI 10.1134/S1061830908080044. [Google Scholar] [CrossRef]
13. Lu, C., Deng, D., Li, L., Li, L. X. (2012). Ultrasonic phased array inspection for gas pressure welds joint of high speed railway. Przeglad Elektrotechniczny, 88, 173–176. [Google Scholar]
14. Namboodiri, G. N., Balasubramaniam, K., Balasubramanian, T., Jothinathan, G. (2011). Studies on feasibility of ultrasonic phased array in rail inspection, Proceedings of the National Seminar & Exhibition on Non-Destructive Evaluation, pp. 245–248. NDE 2011, Indian Society for Non-Destructive Testing. [Google Scholar]
15. Yao, Z., Fu, R., Ding, X. (2017). A kind of delamination defect used in aviation composite materials phased array wheel probe C-scan detection device. Non-Destructive Testing, 41(1), 30–37. DOI 10.13689/j.cnki.cn21-1230/th.2017.01.009 [Google Scholar] [CrossRef]
16. Howard, P., Klaassen, R., Kurkcu, N., Barshinger, J., Chalek, C. et al. (2007). Phased array ultrasonic inspection of titanium forgings. AIP Conference Proceedings, vol. 894, no. 1, pp. 854–861. American Institute of Physics. [Google Scholar]
17. Kim, G., Seo, M. K., Kim, Y. I., Kwon, S., Kim, K. B. (2020). Development of phased array ultrasonic system for detecting rail cracks. Sensors and Actuators A: Physical, 311, 112086. DOI 10.1016/j.sna.2020.112086. [Google Scholar] [CrossRef]
18. Zhou, Z. G., Li, W. T., Li, Y., Gao, Y. F. (2017). Development of ultrasonic phased array immersion C-scan automatic detection system. Journal of Mechanical Engineering, 53(12), 28. DOI 10.3901/JME.2017.12.028. [Google Scholar] [CrossRef]
19. Wang, C. X., Gang, T., Yu, P., Feng, W., Wang, L. (2015). Ultrasonic method for rapid detection of the aluminum friction stir welding defects. Journal of Mechanical Engineering, 51(2), 7–13. DOI 10.3901/JME.2015.02.007. [Google Scholar] [CrossRef]
20. Yang, Q. (2012). The development of four-channel immersion ultrasonic C-scan testing system. Non-Destructive Testing, 34(7), 67–69. [Google Scholar]
21. Mahaut, S., Godefroit, J. L., Roy, O., Cattiaux, G. (2004). Application of phased array techniques to coarse grain components inspection. Ultrasonics, 42(1–9), 791–796. DOI 10.1016/j.ultras.2004.01.068. [Google Scholar] [CrossRef]
22. Chen, S. L., Jin, S. J., Wang, X. P. (2005). Implementation of phase-controlled transmission and reception with high resolution for ultrasonic phased array system. Test & Measurement, 17, 128–130. [Google Scholar]
23. Lovberg, J. A., Martin, C., Kolinko, V. (2007). Video-rate passive millimeter-wave imaging using phased arrays. 2007 IEEE/MTT-S International Microwave Symposium, pp. 1689–1692. [Google Scholar]
24. Shan, B. H., Duan, Z. D., Ou, J. P. (2006). Study of ultrasonic phased array inspection imaging technology for NDT. China Welding, 15(3), 1–5. [Google Scholar]
 | This work is licensed under a Creative Commons Attribution 4.0 International License, which permits unrestricted use, distribution, and reproduction in any medium, provided the original work is properly cited. |