| Structural Durability & Health Monitoring |
DOI: 10.32604/sdhm.2021.011922
ARTICLE
Data Fusion about Serviceability Reliability Prediction for the Long-Span Bridge Girder Based on MBDLM and Gaussian Copula Technique
School of Civil Engineering and Mechanics, Lanzhou University, Lanzhou, 730000, China
*Corresponding Authors: Xueping Fan. Email: fxp_2004@163.com; Yuefei Liu. Email: yfliu@lzu.edu.cn
Received: 05 June 2020; Accepted: 14 August 2020
Abstract: This article presented a new data fusion approach for reasonably predicting dynamic serviceability reliability of the long-span bridge girder. Firstly, multivariate Bayesian dynamic linear model (MBDLM) considering dynamic correlation among the multiple variables is provided to predict dynamic extreme deflections; secondly, with the proposed MBDLM, the dynamic correlation coefficients between any two performance functions can be predicted; finally, based on MBDLM and Gaussian copula technique, a new data fusion method is given to predict the serviceability reliability of the long-span bridge girder, and the monitoring extreme deflection data from an actual bridge is provided to illustrated the feasibility and application of the proposed method.
Keywords: Dynamic extreme deflection data; serviceability reliability prediction; structural health monitoring; multivariate Bayesian dynamic linear models; Gaussian copula technique
Structural Health Monitoring (SHM) is a promising technology to improve the serviceability of civil infrastructures and achieve the sustainable management. For the long-span bridges, the monitoring extreme deflection data provided by SHM systems is an important parameter for structural serviceability analysis and can be used for evaluating and predicting structural dynamic serviceability reliability.
In recent years, SHM has become the escalating urgent need for the modern bridge engineering and grew into a hot topic on both investments and researches around the world. With the innovation of sensing data acquisition, SHM systems are comprehensively deployed and used for obtaining the extreme deflection data of the long-span bridge bridges in different sampling frequency. How to make reasonable use of these data for predicting the dynamic serviceability reliability of the long-span bridge girder, has been still at the initial research stage, but it has become one of the main scientific problems in the SHM field [1–3]. Due to the same dynamic random loads, the dynamic monitoring data at the different control monitoring points of the long-span bridge girder, shows the randomness, correlation and so forth. The performance functions corresponding to the failure modes can be expressed with the dynamic monitoring data, further, the dynamic correlations among the failure modes at the multiple control monitoring points can be reflected. Therefore, with the random and correlative monitoring data, the correlation models among the performance functions of the failure modes at the different control monitoring points, can be built, further, the dynamic reliability of the long-span bridge girder can be reasonably predicted [4].
Long-span bridge serviceability reliability prediction can be made with reliability analysis methods (e.g., first order second moment reliability method [1–10], BDGCM [11], first order reliability method [5,8], etc.) based on the allowable deflection information and the predicted extreme deflection information obtained with Bayesian dynamic linear models (BDLM) [12–17]. In this paper, the long-span bridge girder is adopted as the research object. The serviceability reliability for the single monitoring point of bridge girder is defined as the component reliability, and the serviceability reliability of bridge girder with or without considering the correlation of the performance functions for deformation failure modes at different monitoring points is termed the system reliability.
For the long-span bridges, dynamic correlation occurs among the performance functions corresponding to the deformation failure modes at different control monitoring points for the long-span bridge girder [11,18–21]. Therefore, time-variant correlation plays an important role in dynamic serviceability reliability analysis of bridge girder. In the field of bridge engineering, some studies about dynamic reliability prediction considering time-variant correlation among failure modes at different monitoring points have been conducted with copula functions, for example: Fan et al. [22] proposed the Bayesian dynamic gaussian copula model (BDGCM) for characterizing dynamic correlation between failure modes at two monitored points and predicting time-dependent reliability of the bridge girder considering time-variant correlation between two failure modes, where, the correlation coefficients among the failure modes are approximately computed and the built BDLM does not consider the correlation between two variables; Liu et al. [21] proposed Gaussian copula-Bayesian dynamic linear model-based time-dependent reliability prediction method for Yitong River Bridge considering dynamic correlation between two failure modes, where, the correlation coefficients among the failure modes are also approximately solved and the built BDLM also does not take account of the correlation between two variables. The above studies show the correlation coefficients affecting the Gaussian copula function accuracy, have not been accurately computed. Therefore, building the accurate correlation model among multiple failure modes, and further dynamically predicting bridge girder reliability should be further studied, and become the topic of the present research.
In view of the above existing problems, this article takes the long-span bridge girder as the research object, firstly, MBDLM is built and adopted to predict the dynamic extreme deflections. Secondly, with the predicted covariance matrix of the MBDLM, the correlation coefficients among the predicted deflections can be accurately obtained, further, the correlation coefficients among the multiple performance functions can be accurately predicted. Finally, based on the MBDLM and the Gaussian copula technique, the new data fusion approach is proposed to predict the dynamic serviceability reliability of the long-span bridge girder, and an actual bridge is provided to illustrated the feasibility of the proposed approach. The flowcharts of this paper are shown in Fig. 1.
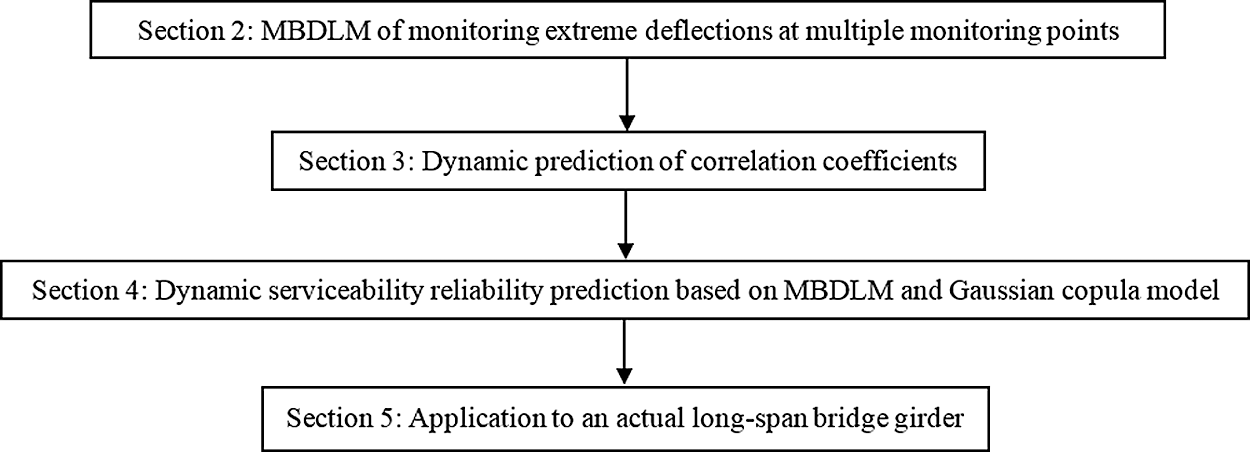
Figure 1: The flowcharts of this paper
2 MBDLM of Monitoring Extreme Deflections at Multiple Monitoring Points
MBDLM is a predicting approach based on a philosophy of information updating [23,24]. It includes a multivariate state equation, a multivariate observation equation and the initial multivariate state information. The multivariate state equation and the multivariate observation equation are both linear. The modeling processes of MBDLM are shown in Fig. 2.
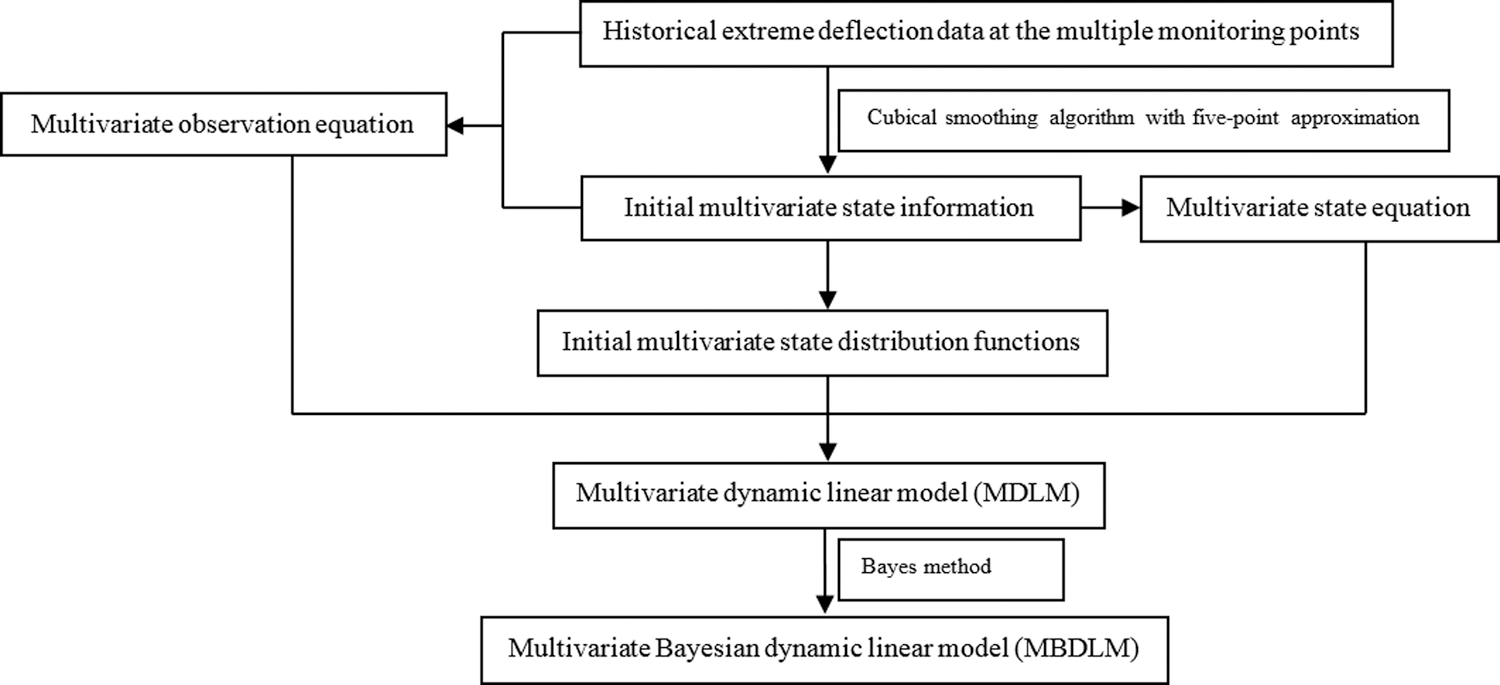
Figure 2: Modelling processes of MBDLM
(1) The monitoring variables
(2) The state variables, monitoring variables and the corresponding errors all approximately follow normal distribution.
(3) Different state variables are dependent between each other.
(4) Monitoring errors and state errors are internally and mutually dependent.
2.2 MDLM about Monitoring Extreme Deflections at Multiple Monitoring Points of the Long-Span Bridge Girder
In this paper, the extreme deflection data is the maximum of the monitoring deflection data in each hour. Based on the historical monitoring extreme deflection data, MDLM (Multiple dynamic linear model) is built as follows [23–25].
Multivariate observation equation:
where,
Multivariate state equation:
where,
Initial multivariate state information:
where,
2.3 Bayesian Probabilistic Recursion of MDLM: MBDLM
Bayesian probabilistic recursion processes of MDLM can be obtained with Bayes method. The detailed steps are shown as follows [23–25].
(1) The state posteriori distribution at time t
For the column initial state mean
(2) The state priori distribution at time t +1
where,
(3) One-step prediction distribution at time t +1
where,
(4) The state posteriori distribution at time t +1
where,
2.4 Determination of the Main Probability Parameters about MBDLM
For MBDLM, the main probability parameters include Vt+1, Wt+1, mt and Ct; the interval period of model updating is one hour; Vt+1 can be approximately estimated with variance matrix about the differences between the state data and the monitoring extreme data at the different monitoring points, where the state data can be obtained through resampling the monitoring extreme data with cubical smoothing algorithm with five-point approximation [3,9]; according to the research [3,23,24], Wt+1 can be solved with Eq. (8).
where,
mt is the mean value vector composed of mean value about the data for each state variable at and before time t, there is a state variable at each monitoring point; Ct is the variance matrix of all the state variables at and before time t. The state data can be estimated with cubical smoothing algorithm with five-point approximation [3,9].
3 Dynamic Prediction of Correlation Coefficients
In Eq. (6),
The deformation failure mode at the monitoring point is: If the monitoring deflection is more than the allowable deflection, then the monitoring point failed. The predicted performance functions of deformation failure modes at the multiple monitoring points are
where,
Further, the dynamic prediction of correlation coefficients
where,
4 Dynamic Serviceability Reliability Prediction Based of Long-Span Bridge Girder on MBDLM and Gaussian Copula Model
The long-span bridge girder exists r deformation failure modes at r monitoring points, and the corresponding performance functions are shown in Eq. (9). The long-span bridge girder with r deformation failure modes is considered as a r-dimensional series system.
When the ith deformation failure mode occurred, with first order second moment (FOSM) method [1,3,5–10], the predicted reliability index and failure probability can be respectively obtained with Eqs. (11) and (12).
where,
where,
When the r deformation failure modes are dependent between each other and meantime occurred, the predicted failure probability of the long-span bridge girder is
where,
When the r deformation failure modes are independent between each other and meantime occurred, the predicted failure probability of long-span bridge girder is
Further, based on Eq. (13), the predicted failure probability of the r-dimensional series system containing r correlated deformation failure modes can be computed with
Based on Eq. (14), the predicted failure probability of the r-dimensional series system containing r uncorrelated failure modes can be obtained with
Finally, the predicted serviceability reliability indices
where,
With Eqs. (11)–(17), predicted failure probability and reliability indices of r-dimensional series system with or without considering the dynamic correlations among multiple deformation failure modes can be solved.
5 Application to an Existing Long-Span Bridge Girder
The Zhaoqing West River Bridge over West River was built in 2003 in Guangdong City, China. It is a typical continuous rigid frame bridge, the girders of which are all reinforced concrete box-girders. The main spans include five spans
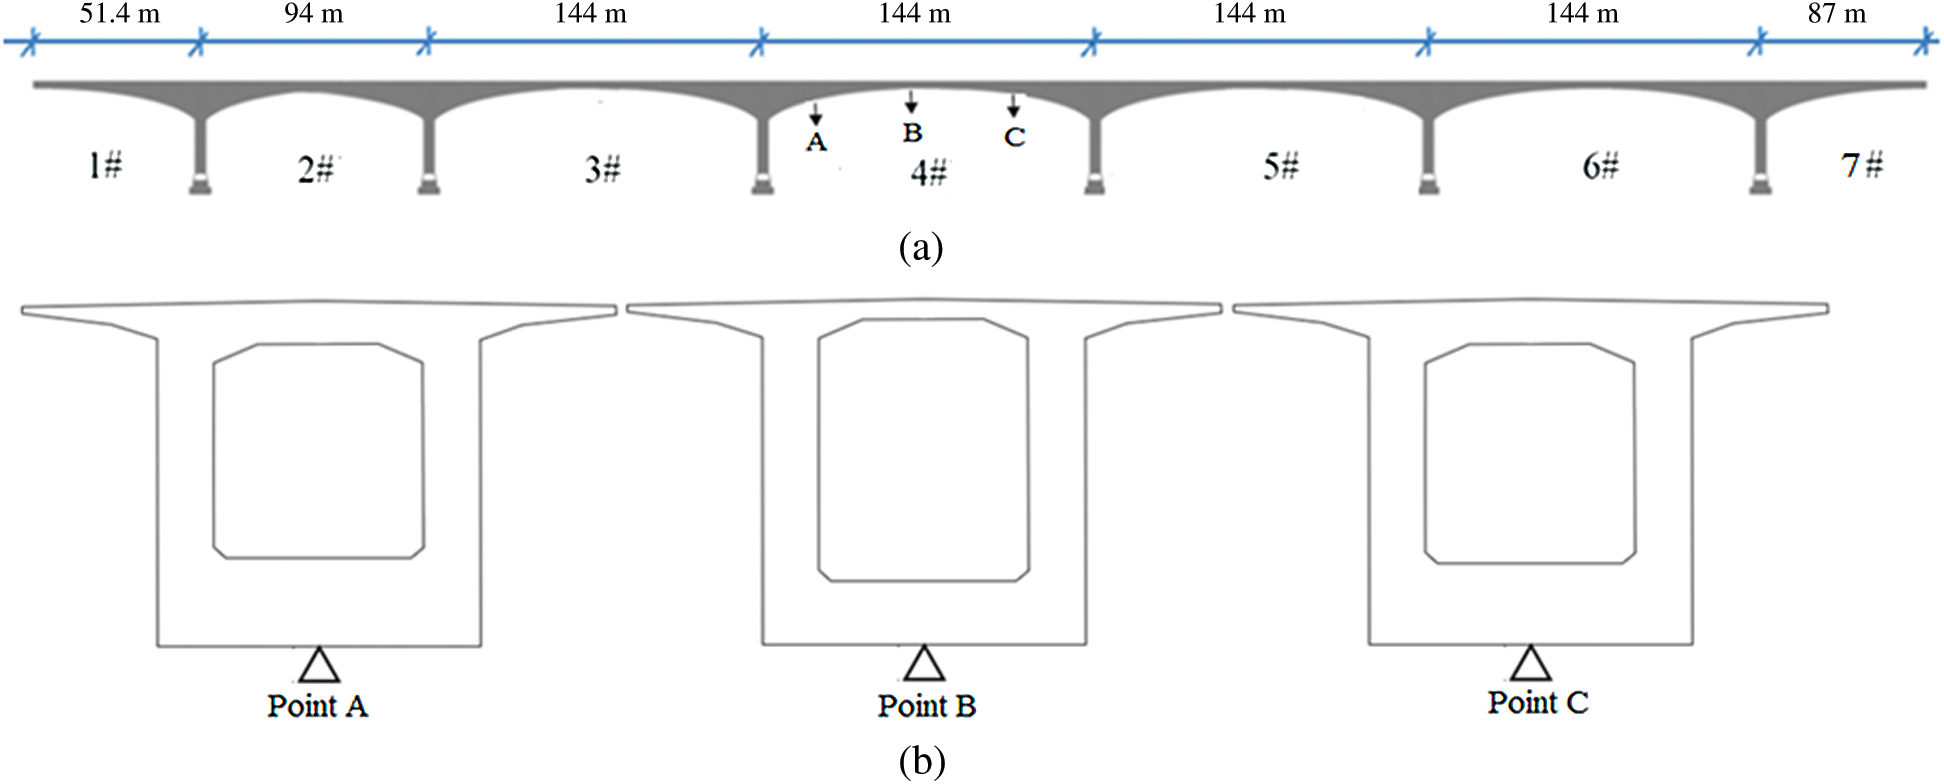
Figure 3: The positions of the monitoring girder (4#) and the monitoring points (A, B and C)
5.1 Extreme Deflections of the Three Monitoring Points (A, B and C)
The extreme deflection at each point is defined as the maximum of the monitoring deflections at each point in each hour. The extreme deflections at the three monitoring points (A, B and C) for the 4# box-girder are monitored for 200 h, which ensure that the probability statistic characteristics of the monitoring extreme deflections at each monitoring point can be extracted correctly. The monitoring extreme deflections and the smoothly-processed state data at Points A, B and C are shown in Fig. 4, where the state data is obtained through resampling the monitoring extreme data with cubical smoothing algorithm with five-point approximation [3,9].
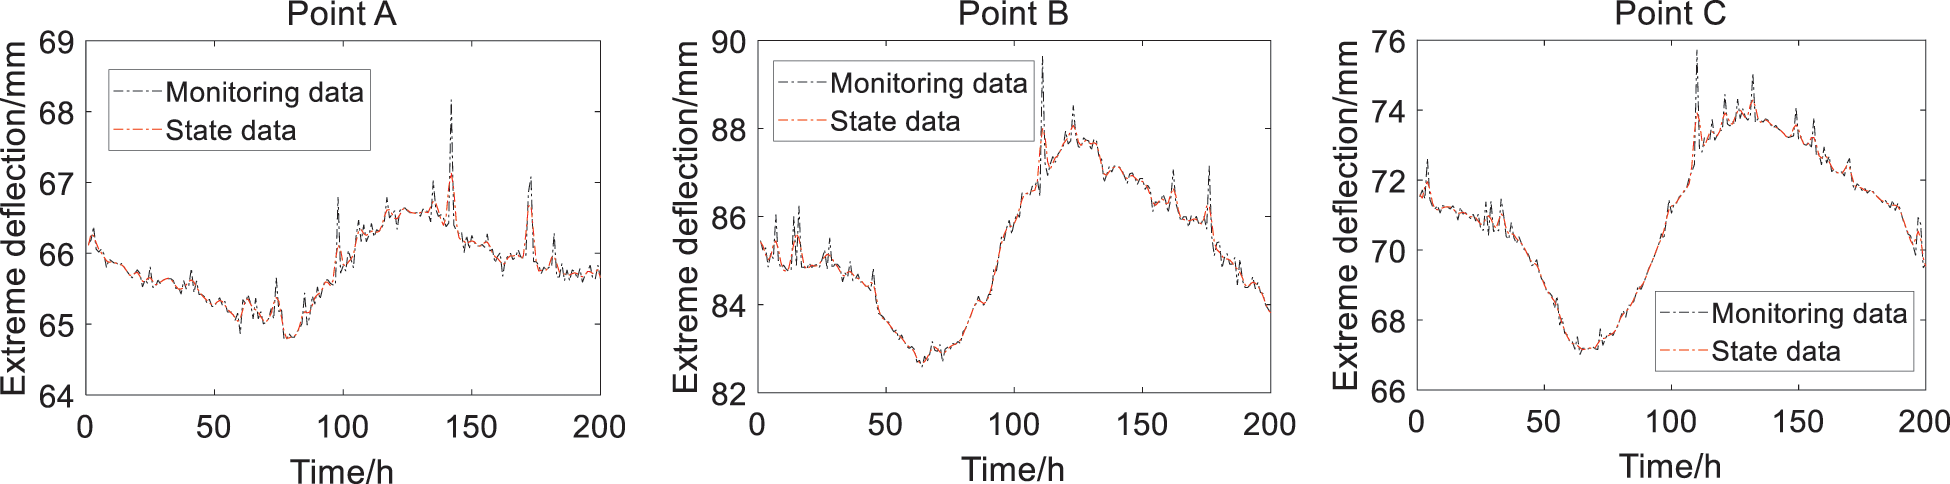
Figure 4: Monitoring extreme deflections and the state data at the three monitoring points
5.2 MBDLM Based on the Monitoring Extreme Deflection Data
In Fig. 4, the state data can be approximately considered as the initial state information of the built MBDLM. With the initial multivariate state information and the monitoring extreme deflection data, the parameters (Vt+1, Wt+1, mt and Ct) can be estimated with Section 2.3. Through Kolmogorov-Smirnov (K-S) test [1,3,9,25], the state data, observational errors and state errors can be all approximately simulated by normal distributions. Therefore, based on Eqs. (1)–(3), the built MDLM are as follows.
Multivariate observation equation:
where,
Multivariate state equation:
where,
Initial multivariate state information:
where,
Based on the monitoring extreme deflection data & Eqs. (18)–(20) and Section 2.2, the predicted extreme deflection information of Points A, B and C can be obtained and shown in Figs. 5a–5c, which show that the predicted extreme deflection data and the predicted extreme deflection ranges both fit the changing rules of monitoring extreme deflection data. Prediction precision of the MBDLM is shown in Fig. 5d, which shows that prediction precision of the MBDLM is better and better with updating of the monitoring extreme deflection data.
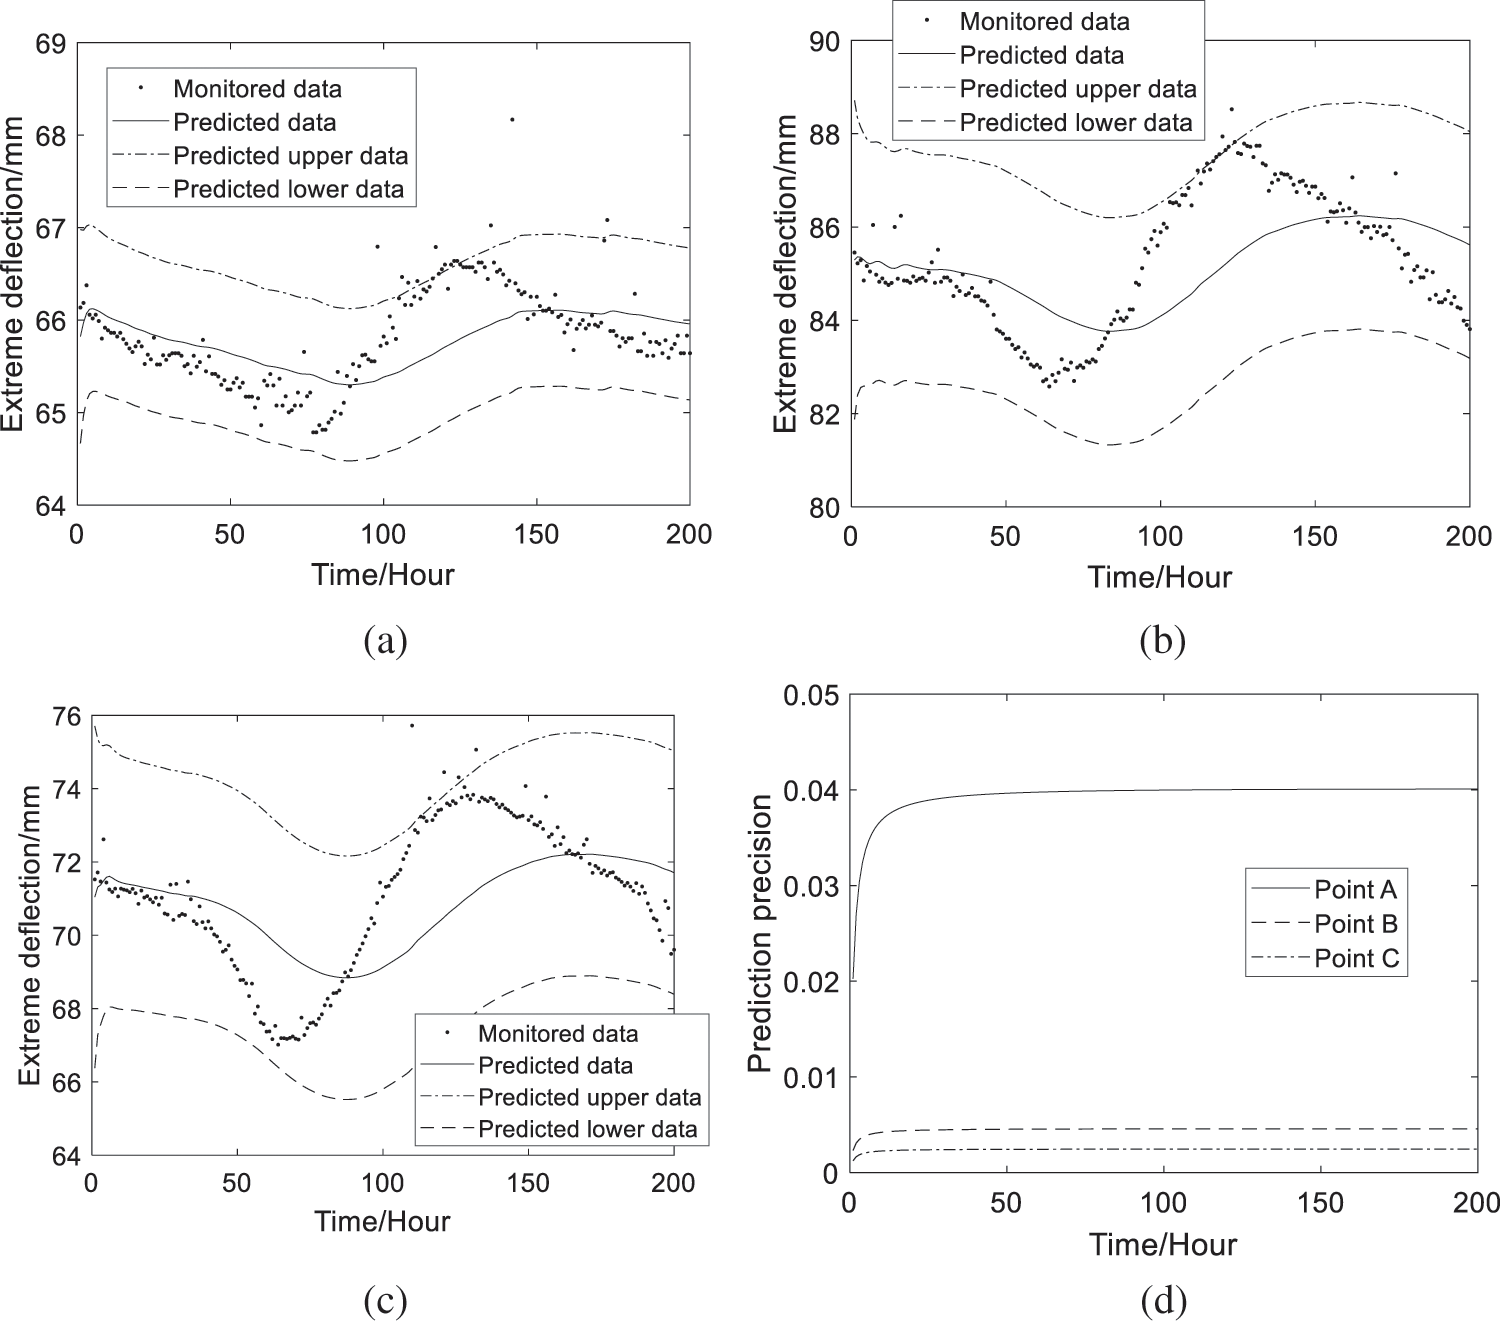
Figure 5: Predicted extreme deflections and prediction precision (a) The predicted data at Point A (b) The predicted data at Point B (c) The predicted data at Point C (d) Prediction precision at the three points
5.3 Dynamic Prediction of Failure Probability and Reliability Indices for the Long-Span Bridge Girder Based on MBDLM and Gaussian Copula Model
The predicted performance functions of the deformation failure modes at the monitoring points A, B and C are, respectively,
where,
The deformation failure modes at the monitoring points A, B and C are serial. Based on Eq. (15), the dynamic serviceability failure probability of the 4# girder considering the dynamic correlations of deformation failure modes can be obtained with
where,
Further, based on Eq. (17), the dynamic reliability index of the 4# girder considering the dynamic correlations of deformation failure modes can be computed with
The predicted correlation coefficients between performance functions corresponding to two deformation failure modes can be computed with Eq. (10) and shown in Fig. 6. which show that the correlation coefficients between the failure modes at Points A and B, or Points A and C, or Points A and C are all time-dependent.
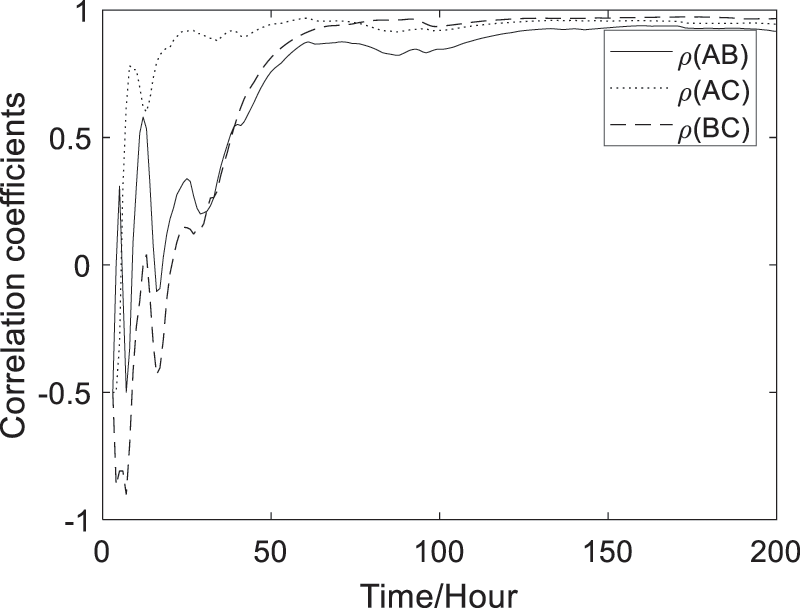
Figure 6: Predicted correlation coefficients between performance functions corresponding to two deformation failure modes
Based on Eqs. (11), (12) and (21), the predicted time-variant failure probability and reliability indices at the three monitoring points can be computed and shown in Figs. 7–9. The predicted results can approximately and reasonably show the changing trends and ranges of monitored reliability indices, where the confidence interval the authors choose is 95%. And the predicted reliability indices and failure probability are time-variant with updating of the monitoring extreme deflection data.
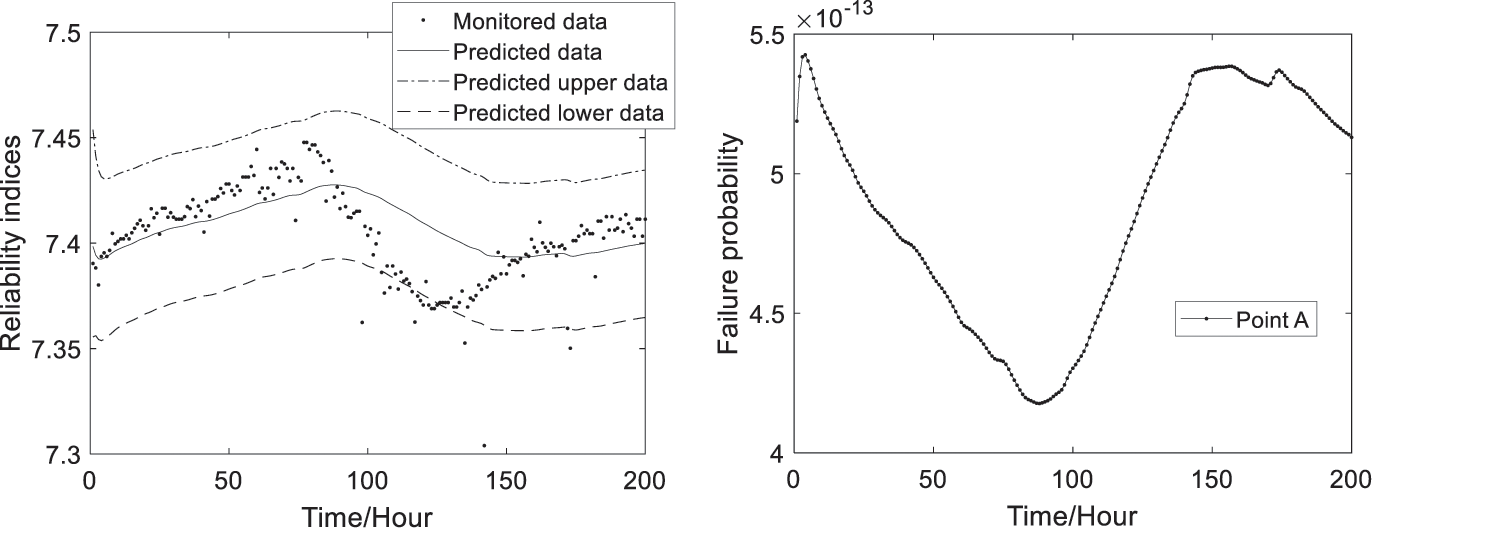
Figure 7: The predicted reliability indices and failure probability at Point A
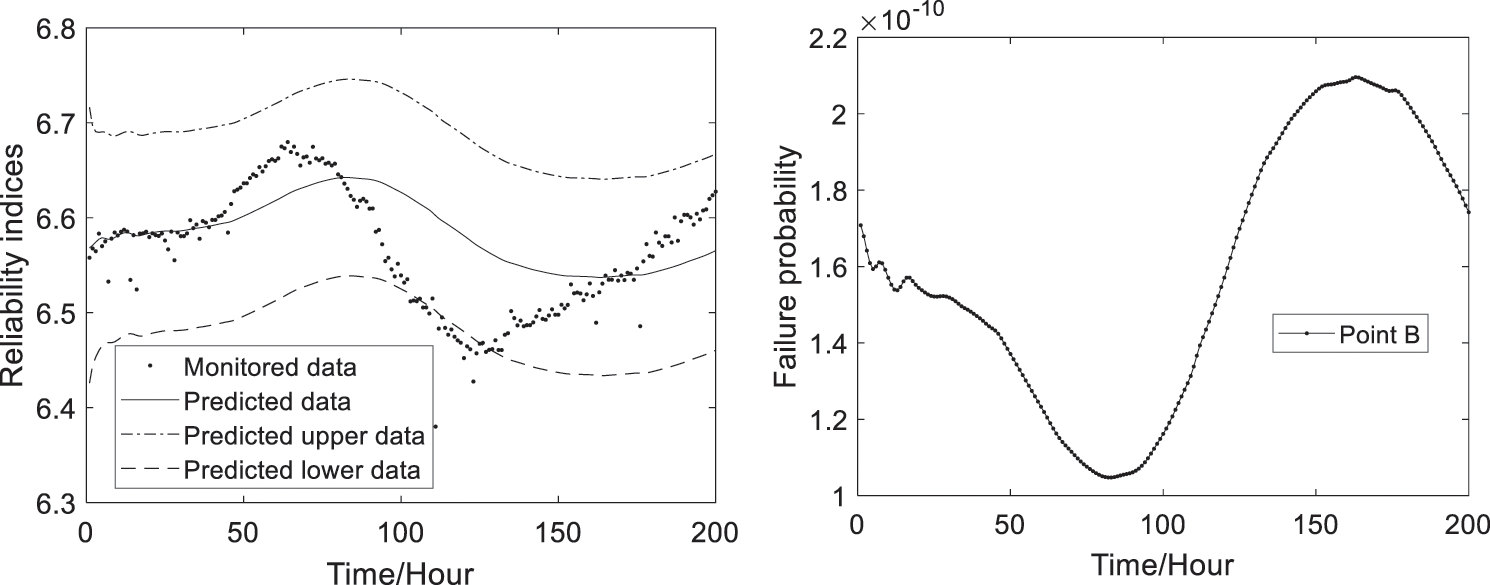
Figure 8: The predicted reliability indices and failure probability at Point B
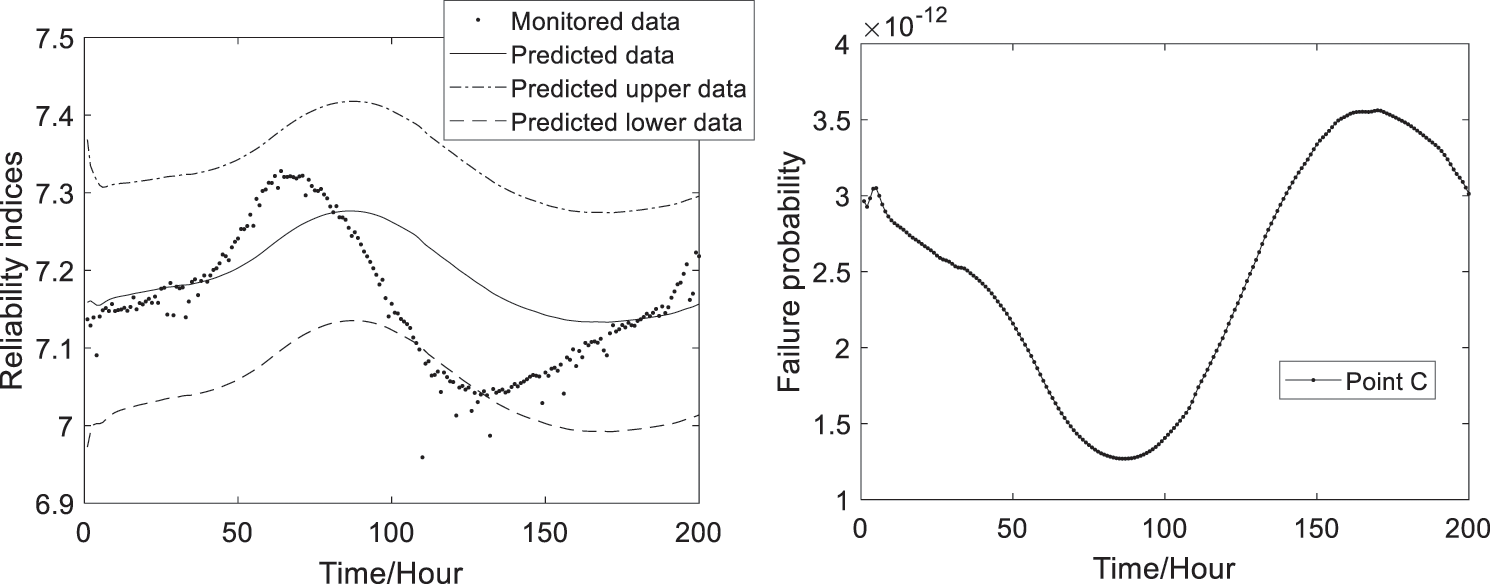
Figure 9: The predicted reliability indices and failure probability at Point C
With the Eqs. (13)–(17) and (22), (23), the predicted failure probability and reliability indices of the 4# box-girder with and without considering the dynamic correlations of deformation failure modes can be obtained and shown in Figs. 10 and 11. Fig. 10 shows that the predicted dynamic failure probability considering correlation coefficients are smaller than the ones without considering correlation coefficients. Fig. 11 shows that the predicted dynamic reliability indices considering correlation coefficients are higher than the ones without considering correlation coefficients. Therefore, the failure probability and reliability indices of the series structural systems are conservative without considering correlation coefficients.
From Fig. 11, as can be seen that the predicted reliability indices of the 4# girder system are bigger than the target reliability index value (ranging from 2 to 6) of bridge systems which is given in reference [26], so the 4# girder is safe.
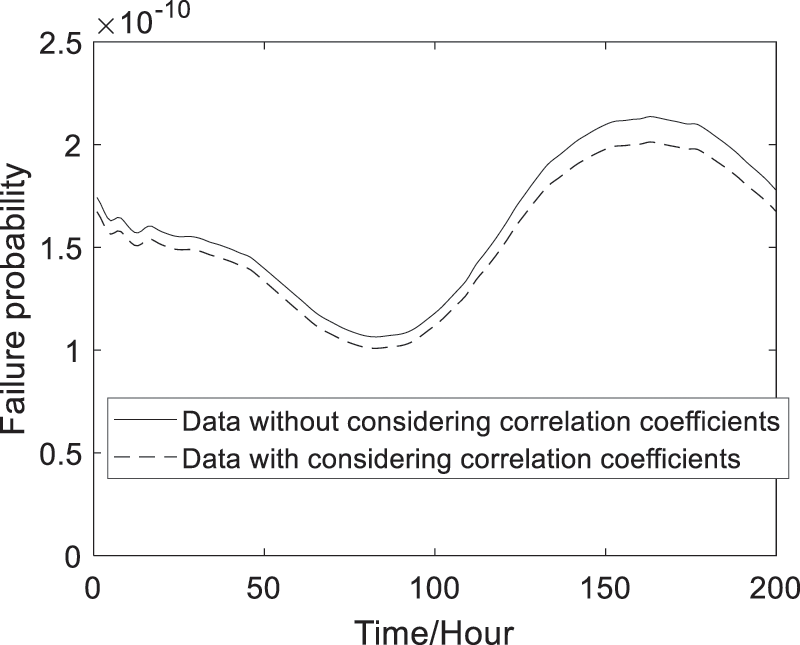
Figure 10: Predicted failure probability of the reinforced concrete box girder
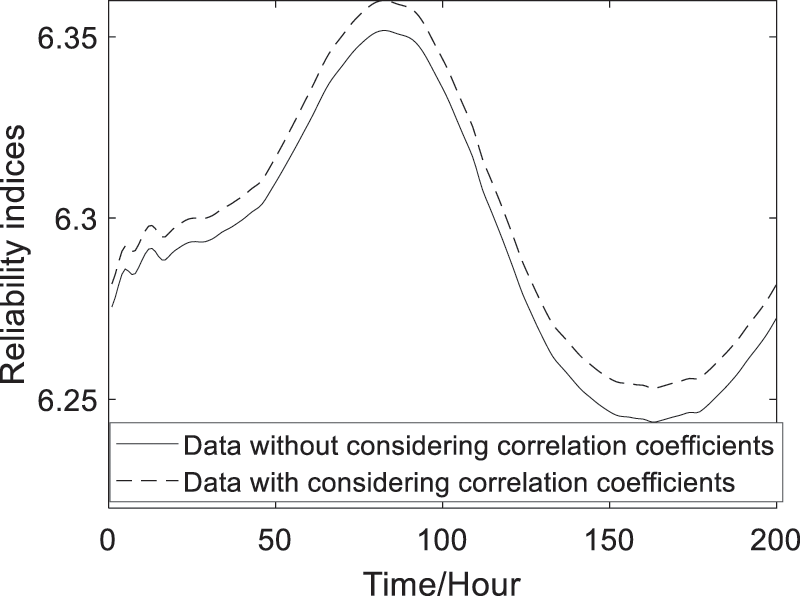
Figure 11: Predicted reliability indices of the reinforced concrete box girder
This paper presented a new data fusion approach for the dynamic serviceability reliability prediction of the long-span bridge girder through combining MBDLM and Gaussian copula model based on monitoring extreme deflection data. The proposed method considered the dynamic correlation coefficients among the multiple deformation failure modes.
Through the illustration of the actual long-span bridge girder, the results show that there exists dynamic correlation among multiple failure modes (Fig. 6), and the time-variant reliability indices considering dynamic correlation coefficients are bigger than the ones without considering dynamic correlation coefficients (Figs. 10 and 11). Therefore, as can be concluded that it is essential and important to consider the dynamic correlation between failure modes for obtaining the more accurate and reasonable dynamic reliability of structural system.
Acknowledgement: The authors would like to thank the Editor and the anonymous reviewers for their constructive comments and valuable suggestions to improve the quality of the article.
Author Contributions: Xueping Fan designed and supervised the research; Yuefei Liu wrote the manuscript with input from all coauthors; Guanghong Yang given the serviceability reliability prediction method; Zhipeng Shang built the MBDLM; Xiaoxiong Zhao analyzed the data and prepared the figures. All authors reviewed and commented on the manuscript.
Funding Statement: The authors disclosed receipt of the following financial support for the research, authorship, and/or publication of this article: This work was supported by Natural Science Foundation of Gansu Province of China (20JR10RA625, 20JR10RA623), National Key Research and Development Project of China (Project No. 2019YFC1511005), Fundamental Research Funds for the Central Universities (Grant No. lzujbky-2020-55) and National Natural Science Foundation of China (Grant No. 51608243).
Conflicts of Interest: The authors declared no potential conflicts of interest with respect to the research, authorship, and/or publication of this article.
1. Frangopol, D. M., Strauss, A., Kim, S. (2008). Use of monitoring extreme data for the performance prediction of structures: General approach. Engineering Structures, 30(12), 3644–3653. DOI 10.1016/j.engstruct.2008.06.010. [Google Scholar] [CrossRef]
2. Strauss, A., Frangopol, D. M., Kim, S. (2008). Use of monitoring extreme data for the performance prediction of structures: Bayesian updating. Engineering Structures, 30(12), 3654–3666. DOI 10.1016/j.engstruct.2008.06.009. [Google Scholar] [CrossRef]
3. Fan, X. P. (2014). Reliability updating and Bayesian prediction of bridges based on proof loads and monitoring data (Ph.D. Thesis). Harbin Institute of Technology, Harbin, China. [Google Scholar]
4. Liu, Y. F., Fan, X. P. (2020). Dynamic reliability prediction for the steel box girder based on multivariate Bayesian dynamic Gaussian copula model and SHM extreme stress data. Structural Control and Health Monitoring, 27(6), 15. DOI 10.1002/stc.2531. [Google Scholar] [CrossRef]
5. Ang, A. H. S., Tang, W. H. (1975). Probability concepts in engineering planning and design, vol. I. NewYork: John Wiley & Sons. [Google Scholar]
6. Dissanayake, P. B. R., Karunananda, P. A. K. (2008). Reliability index for structural health monitoring of aging bridges. Structural Health Monitoring–An International Journal, 7(2), 175–183. DOI 10.1177/1475921708090555. [Google Scholar] [CrossRef]
7. Fan, X. P., Liu, Y. F. (2018). New dynamic prediction approach for the reliability indices of bridge members based on SHM data. Journal of Bridge Engineering, 23(12), 06018004. DOI 10.1061/(ASCE)BE.1943-5592.0001321. [Google Scholar] [CrossRef]
8. Melchers, R. E. (1987). Structural reliability, analysis and prediction. Chichester: Ellis Horwood. [Google Scholar]
9. Fan, X. P., Liu, Y. F. (2019). Use of monitored daily extreme stress data for performance prediction of steel bridges: Dynamic linear models and Gaussian mixed particle filter. Mechanical Systems and Signal Processing, 121(1), 841–855. DOI 10.1016/j.ymssp.2018.11.047. [Google Scholar] [CrossRef]
10. Catbas, F. N., Susoy, M., Frangopol, D. M. (2008). Structural health monitoring and reliability estimation: Long span truss bridge application with environmental monitoring data. Engineering Structures, 30(9), 2347–2359. DOI 10.1016/j.engstruct.2008.01.013. [Google Scholar] [CrossRef]
11. Liu, Y. F. (2015). System reliability analysis of bridge structures considering correlation of failure modes and proof modes (Ph.D. Thesis). Harbin Institute of Technology, Harbin, China. [Google Scholar]
12. Fan, X. P. (2017). Bridge extreme stress prediction based on Bayesian dynamic linear models and non-uniform sampling. Structural Health Monitoring-An International Journal, 16(3), 253–261. DOI 10.1177/1475921716688166. [Google Scholar] [CrossRef]
13. Goulet, J. A. (2017). Bayesian dynamic linear models for structural health monitoring. Structural Control and Health Monitoring, 24(12), 145. DOI 10.1002/stc.2035. [Google Scholar] [CrossRef]
14. Wang, H., Zhang, Y. M., Mao, J. X., Wan, H. P., Tao, T. Y. et al. (2019). Modeling and forecasting of temperature-induced strain of a long-span bridge using an improved Bayesian dynamic linear model. Engineering Structures, 192, 220–232. DOI 10.1016/j.engstruct.2019.05.006. [Google Scholar] [CrossRef]
15. Wang, J., Liu, X. L. (2010). Evaluation and Bayesian dynamic prediction of deterioration of structural performance, structure and infrastructure engineering: Maintenance. Management Life-Cycle Design and Performance, 6(6), 663–674. [Google Scholar]
16. Liu, Y. F., Fan, X. P. (2020). Bayesian prediction of bridge extreme stresses based on DLTM and monitoring coupled data. Structural Health Monitoring–An International Journal, 19(2), 454–462. DOI 10.1177/1475921719853171. [Google Scholar] [CrossRef]
17. Liu, Y. F., Lu, D. G., Fan, X. P. (2014). Reliability updating and prediction of bridge structures based on proof loads and monitored data. Construction and Building Materials, 66(6), 795–804. DOI 10.1016/j.conbuildmat.2014.06.025. [Google Scholar] [CrossRef]
18. Liu, Y. F., Fan, X. P., Lu, D. G. (2014). Time-dependent uncertainty analysis of structures based on copula functions. Second International Conference on Vulnerability and Risk Analysis and Management (ICVRAM) and the Sixth International Symposium on Uncertainty, Modeling, and Analysis (ISUMApp. 1875–1887. [Google Scholar]
19. Liu, Y. F., Lu, D. G. (2013). Reliability analysis of two-dimensional series portal-framed bridge system based on mixed copula functions. Key Engineering Materials, 574, 95–105. DOI 10.4028/www.scientific.net/KEM.574.95. [Google Scholar] [CrossRef]
20. Liu, Y. F., Fan, X. P. (2016). Time-independent reliability analysis of bridge system based on mixed copula models. Mathematical Problems in Engineering, 2016(3), 1–13. DOI 10.1155/2016/2720614. [Google Scholar] [CrossRef]
21. Liu, Y. F., Fan, X. P. (2016). Gaussian Copula-Bayesian dynamic linear model-based time-dependent reliability prediction of bridge structures considering nonlinear correlation between failure modes. Advances in Mechanical Engineering, 8(11), 1–15. [Google Scholar]
22. Fan, X. P., Liu, Y. F. (2018). Time-variant reliability prediction of bridge system based on BDGCM and SHM data. Structural Control and Health Monitoring, 25(7), e2185. DOI 10.1002/stc.2185. [Google Scholar] [CrossRef]
23. West, M., Harrison, J. (1997). Bayesian forecasting and dynamic models, Second Edition. New York: Springer Series. [Google Scholar]
24. Petris, G., Petrone, S., Campagnoli, P. (2009). Dynamic linear models with R. New York: Springer Series. [Google Scholar]
25. Liu, Y. F., Fan, X. P. (2019). A data assimilation method about Bayesian Fourier dynamic linear prediction of periodic extreme stresses for steel bridges. Mechanical Systems and Signal Processing, 128(2), 82–92. DOI 10.1016/j.ymssp.2019.04.001. [Google Scholar] [CrossRef]
26. Yang, J., Dewolf, J. T. (2002). Reliability assessment of highway truss sign supports. Journal of Structural Engineering, 128(11), 1429–1438. DOI 10.1061/(ASCE)0733-9445(2002)128:11(1429). [Google Scholar] [CrossRef]
 | This work is licensed under a Creative Commons Attribution 4.0 International License, which permits unrestricted use, distribution, and reproduction in any medium, provided the original work is properly cited. |