
 Submit a Paper
 Propose a Special lssue
 Open Access
ARTICLE

Comparative Karyotyping Reveals the Origin of Chinese Kale (Brassica oleracea var. alboglabra)
1 College of Horticulture, Sichuan Agricultural University, Chengdu, 611130, China
2 Faculty of Agricultural Sciences, University of Chile, Santa Rosa 11315, Santiago, 8820808, Metropolitan Region, Chile
3 College of Biology and Agriculture, Zunyi Normal University, Zunyi, 563006, China
* Corresponding Authors: Fen Zhang. Email: ; Bo Sun. Email:
(This article belongs to the Special Issue: Plant Genetic Diversity and Evolution)
Phyton-International Journal of Experimental Botany 2025, 94(2), 521-538. https://doi.org/10.32604/phyton.2025.061099
Received 17 November 2024; Accepted 27 January 2025; Issue published 06 March 2025
 View Full Text
 Download PDF
Abstract
This study conducted karyotype analysis on 56 Chinese kale varieties from Guangdong and Fujian provinces using conventional chromosome analysis methods. The varieties were categorized into four groups based on their origin and flower color: white-flower Chinese kale originating from Guangdong (GW), yellow-flower Chinese kale originating from Guangdong (GY), white-flower Chinese kale originating from Fujian (FW), and yellow-flower Chinese kale originating from Fujian (FY). Karyotype differences among the four groups of Chinese kale were analyzed, and the evolutionary relationship between yellow-flower and white-flower Chinese kale from the two regions was inferred based on karyotype parameters. The results indicated that all Chinese kale varieties were diploid with 2n = 2x = 18, including a pair of satellites. The chromosome types included median-centromere (m) and sub-median-centromere (sm), and the karyotypes were 1A and 2A, a sper karyotype asymmetry index. The karyotype 1A of Chinese kale was identified for the first time. Partial least squares discriminant analysis (PLS-DA) identified nine karyotypic indicators that differentiated the four groups, and these differences were further visualized using heatmaps and box plots. Based on the evolution trends in the four groups and PLS-DA analysis, it was speculated that white-flower Chinese kale originated from Guangdong, yellow-flower Chinese kale originated from Fujian, and GY and FW were derived from the cross of GW and FY. This study provides a reference for understanding the genetic relationships between Chinese kale in Guangdong and Fujian, and offers a cytological basis for the evolution, hybridization, and phylogenetic relationships of Chinese kale.Keywords
Supplementary Material
Supplementary Material FileChinese kale (Brassica oleracea var. alboglabra), historically known as Gai Lan or Lan Cai, is a cruciferous brassica vegetable primarily consumed for its tender leaves and bolting stems. It is rich in glucosinolates, carotenoids, and ascorbic acid, and is considered to be beneficial to health [1–3].
Yellow-flower and white-flower Chinese kale, as two distinct types, exhibit variations in biological characteristics and nutritional properties [4]. For instance, white-flower Chinese kale had higher chlorophyll content but lower vitamin C content in its bolting stems compared to yellow-flower Chinese kale [5]. Additionally, white-flower Chinese kale possessed fewer branches and a sweeter, more tender quality, rendering it more popular among consumers [6]. In China, white-flower Chinese kale is widely cultivated and distributed, whereas yellow-flower Chinese kale is primarily grown in limited quantities, with most production concentrated in Fujian Province. Over the years, the cultivation of Chinese kale has expanded from southern to northern China, establishing it as an important Brassica oleracea vegetable for export [7,8].
Vegetables of Brassica oleracea, such as cauliflower (Brassica oleracea var. botrytis) and ornamental kale (Brassica oleracea var. acephala), are generally believed to have originated from the Mediterranean coast. However, the origin of Chinese kale remains a subject of debate, with two prevailing theories: one posits a Mediterranean coastal origin, while the other suggests a southern China origin. Zhang [9] conducted a comprehensive investigation of diverse graphic and textual materials, concluding that Chinese kale was introduced into China as early as the 5th and 6th centuries AD during the Southern and Northern Dynasties, it underwent mutation and long-term artificial selection in Guangdong, thereby supporting the theory of its southern China origin. Wang et al. [10] studied genetic diversity in 38 Brassica olearacea vegetable samples, including eight varieties of Chinese kale, and found that Chinese kale evolved from other Brassica olearacea vegetables via distinct routes, further supporting the southern China origin theory. While the southern China origin theory has gained consensus [11,12], research on the intraspecific origin of Chinese kale remains insufficient. To address this gap, this study collected 56 varieties of Chinese kale from Guangdong and Fujian and conducted karyotype analysis to provide a cytological basis for understanding the origin of Chinese kale.
Karyotype refers to the chromosome set’s phenotype during mid-mitosis, summarizing chromosome number, size, and morphological features. Karyotype analysis is critical for cytogenetic classification and species kinship studies, particularly in plant research [13–16]. As stable carriers of genetic information, chromosomes are consistent in morphology, structure, and number, and they can be stained effectively by basic dyes. Karyotype analysis can be performed using non-banding or banding techniques [17]; this study utilized a non-banding technique. Mousavizadeh et al. [18] employed non-banding technology to analyze the karyotype and chromosome diversity of Iranian wild asparagus, providing insights into Asparagus evolution, while Wang et al. [19] investigated karyotypic differences among Chinese cherry (Cerasus pseudocerasus Lindl.) and four related Cerasus species to inform cross-breeding, phylogenetic relationships, and evolutionary dynamics.
In this study, 56 varieties of Chinese kale from Guangdong and Fujian were categorized into four groups: white-flower Chinese kale originating from Guangdong (GW), yellow-flower Chinese kale originating from Guangdong (GY), white-flower Chinese kale originating from Fujian (FW), and yellow-flower Chinese kale originating from Fujian (FY). Karyotype analysis was performed to elucidate karyotype variations and analyze evolutionary trends, aiming to provide cytological evidence for interspecific affinity and evolutionary origins of Chinese kale.
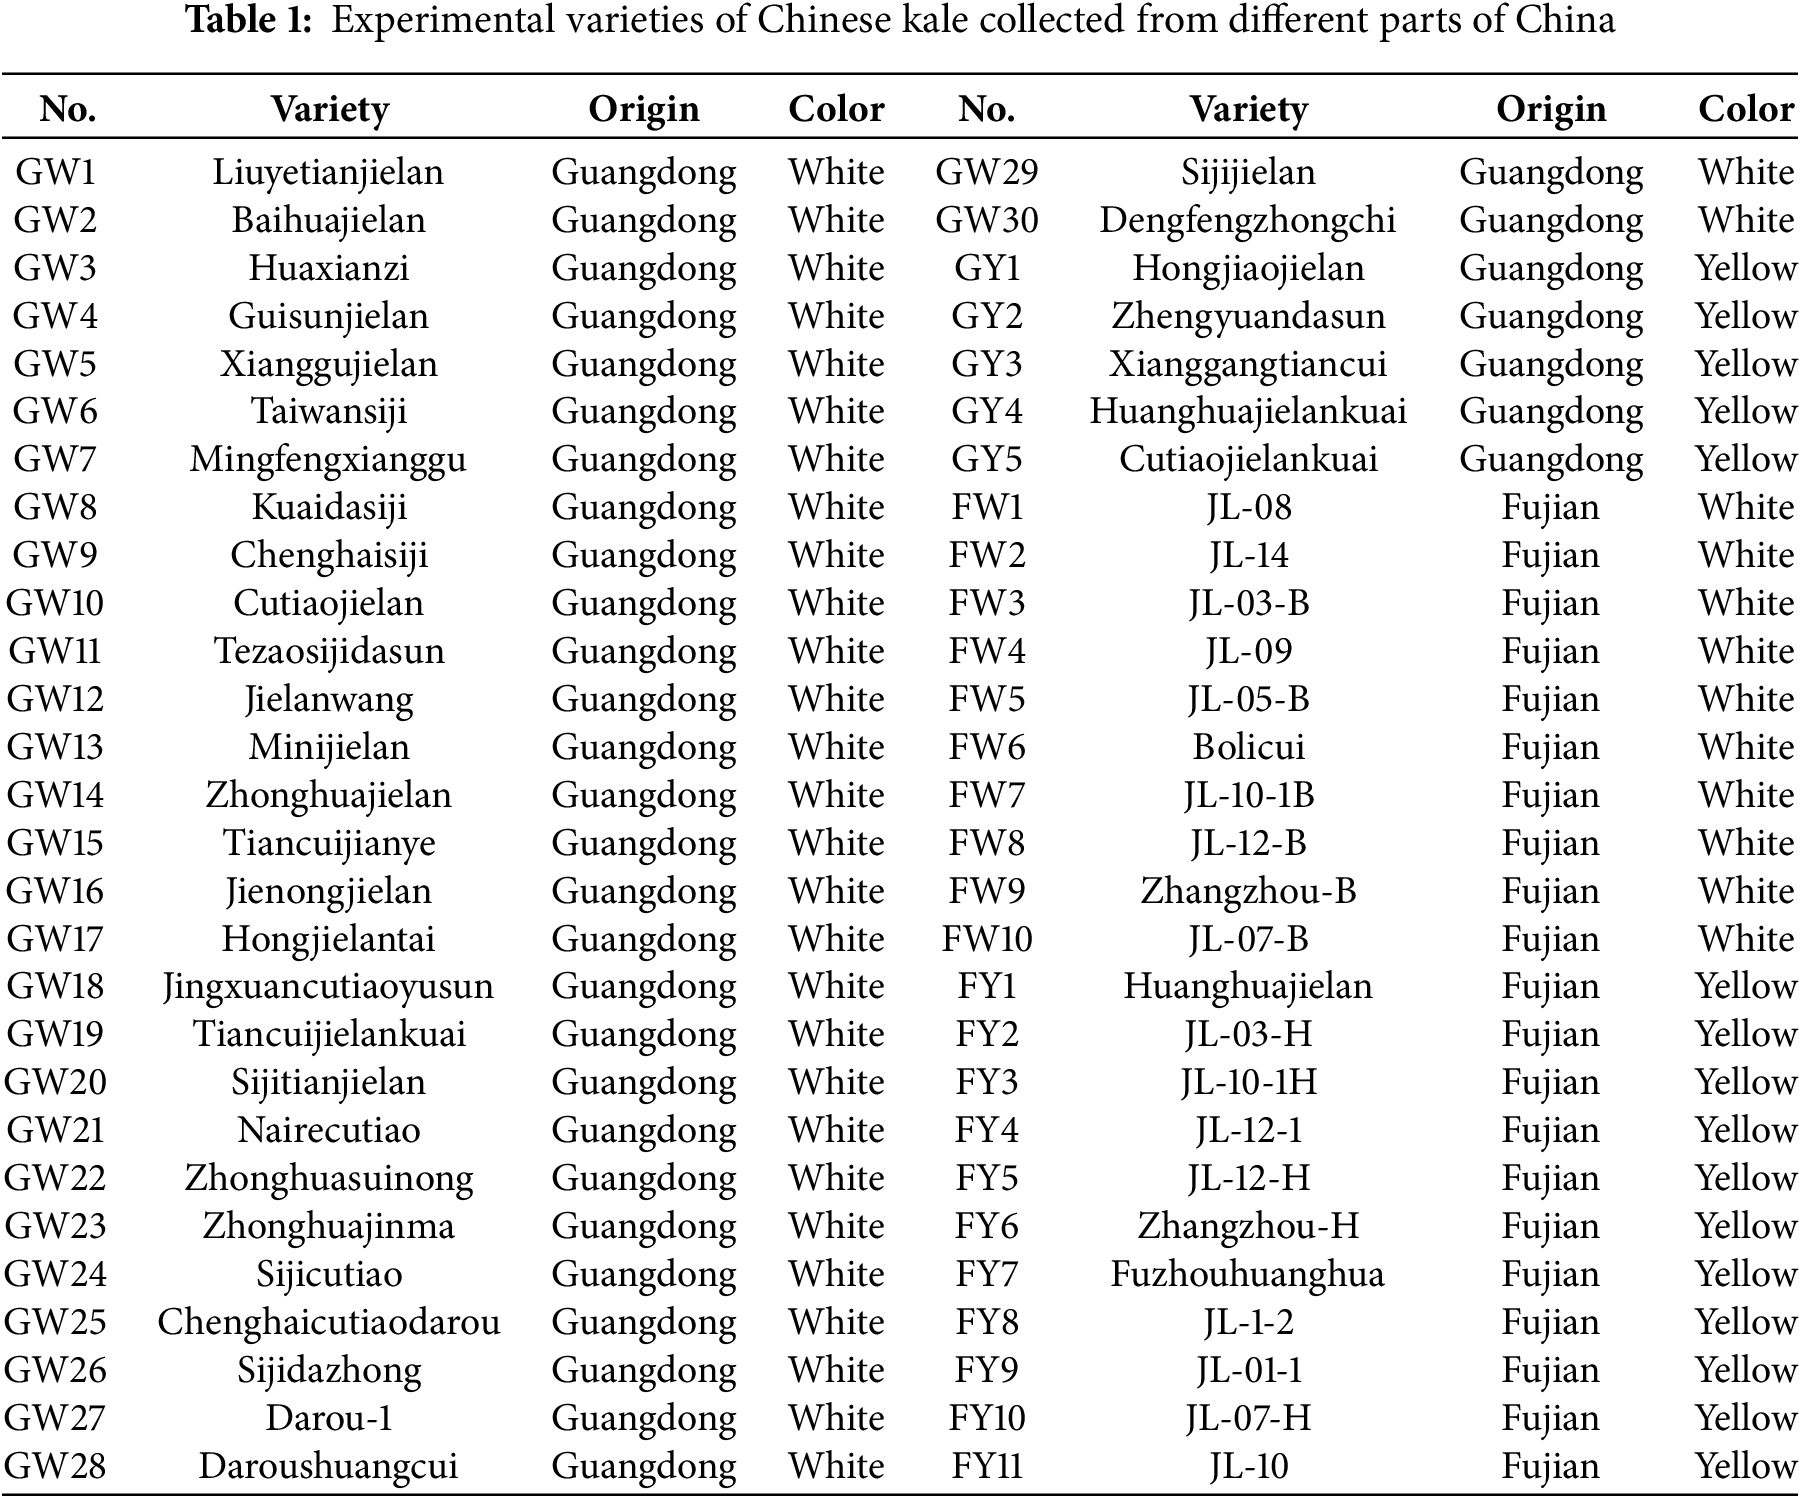
This experiment utilized 56 varieties of Chinese kale from Guangdong and Fujian (which were preserved and propagated by our research team), abbreviated as GW (30 samples), GY (5 samples), FW (10 samples), and FY (11 samples) according to their flower color and origin. Each sample was as-signed a specific number, as detailed in Table 1.
Selected full-grained seeds were soaked for 2 h at room temperature, placed in petri dishes lined with moist filter paper, and cultured in the dark at 25°C for 3 days. When the root tips reached a length of 10–15 mm, they were harvested at 9 am [20].
Root tips were harvested and pretreated in 2 mmol·L−1 8-hydroxyquinoline solution for 5 h at 4°C. The pretreated root tip materials were fixed in Carnoy solution (volume ratio of absolute ethanol to acetic acid was 3:1) at 4°C for 24 h, washed with 95%, 85%, and 75% ethanol gradient, and finally kept in 75% ethanol solution. The root tip was dissociated with 1 mol·L−1 HCl at 60°C for 8 min, then washed with distilled water for 3 times, stained with Carbol-fuchsin solution for 5–10 min in dark, and squashed for viewing under 100 times oil lens and 10 times eyepiece of OlympusCX21 microscope.
Thirty well-spread, morphologically clear metaphase cells were selected for chromosome counting and karyotype analysis, following the criteria of Li et al. [21]. Chromosome measurements and classifications were done based on the standards of Levan et al. [22]. The karyotype asymmetry coefficient was calculated using the method of Arano [23], and karyotype classification was performed according to the regulations of Stebbins [24].
Experimental data were processed using Excel 2019. Partial least squares discriminant analysis (PLS-DA) was conducted using SIMCA-P 14.1. Heatmaps were generated using MeV 4.9.0, and box plots were created using Origin 2021. Correlation analysis was performed with Excel 2019, and the results were visualized using Cytoscape 3.9.1 [25].
In this study, metaphase chromosomes of 56 varieties of Chinese kale, categorized as GW, GY, FW, and FY, were observed (Fig. 1). Karyograms (Fig. 2) and karyotype diagrams (Fig. 3) were generated, and statistical analyses of these figures yielded the karyotype parameters (Table S1) and karyotypes (Table 2). The detailed analysis is as follows.
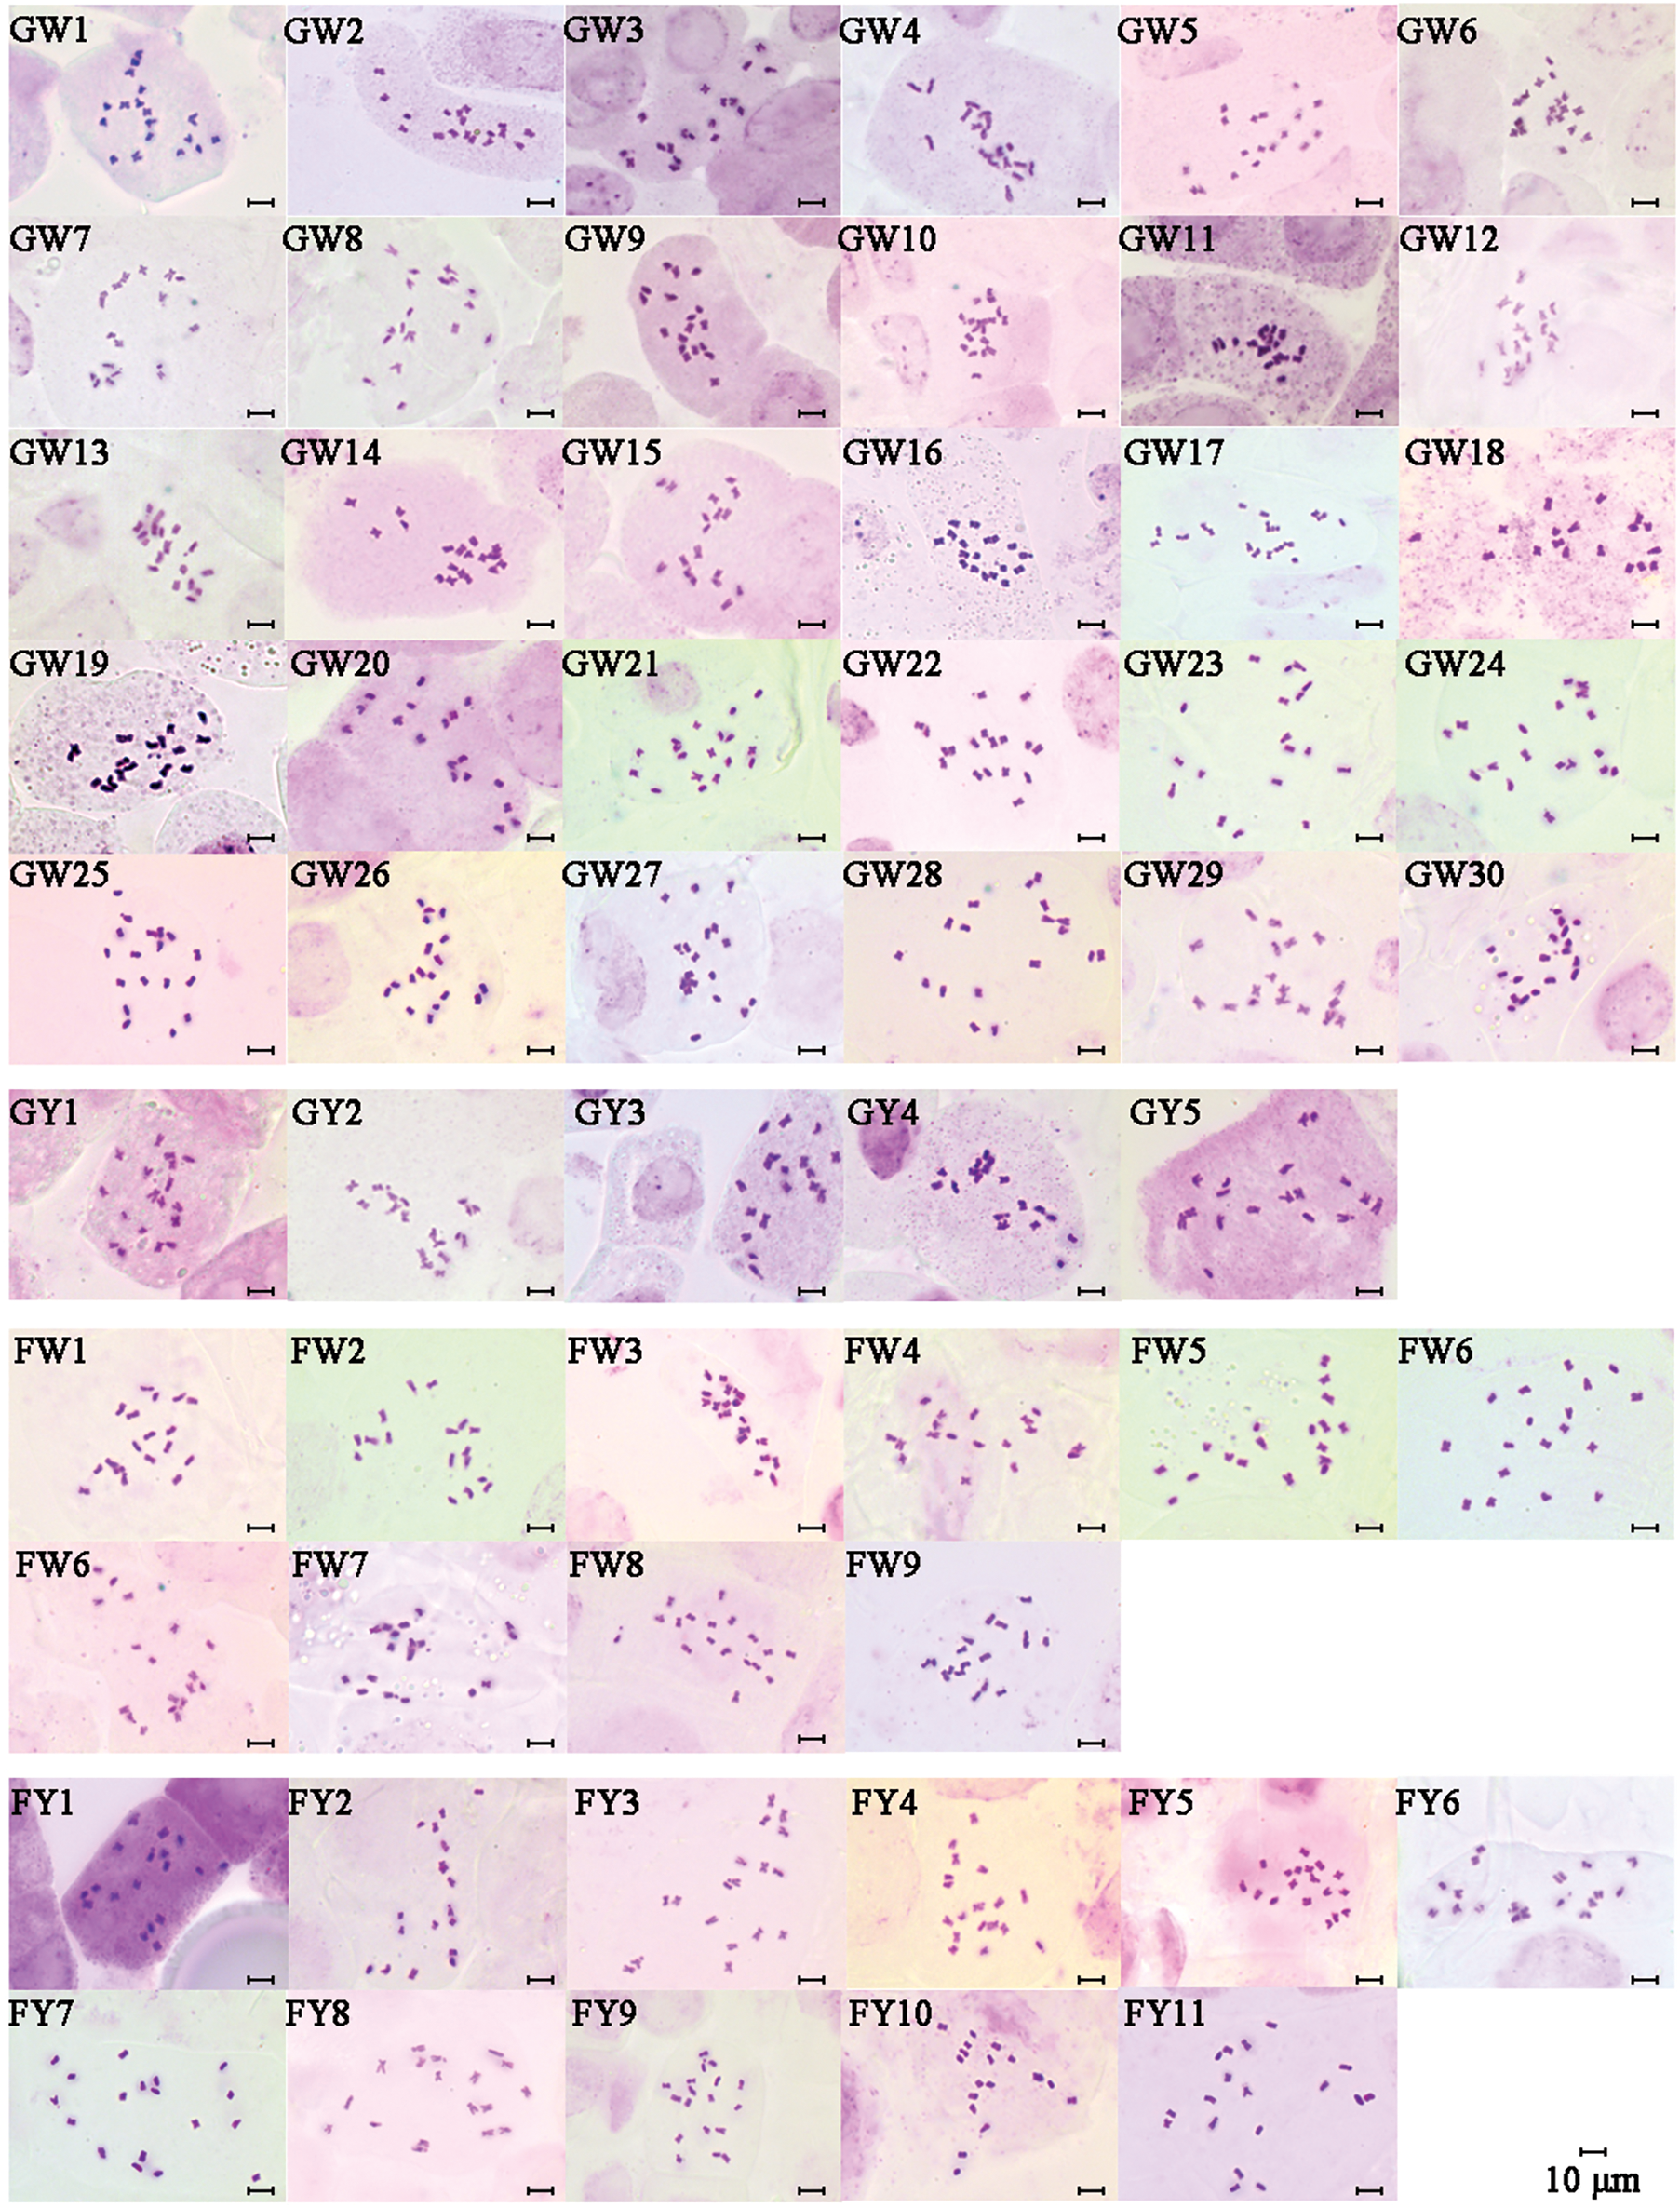
Figure 1: Metaphase chromosomes of different varieties of Chinese kale
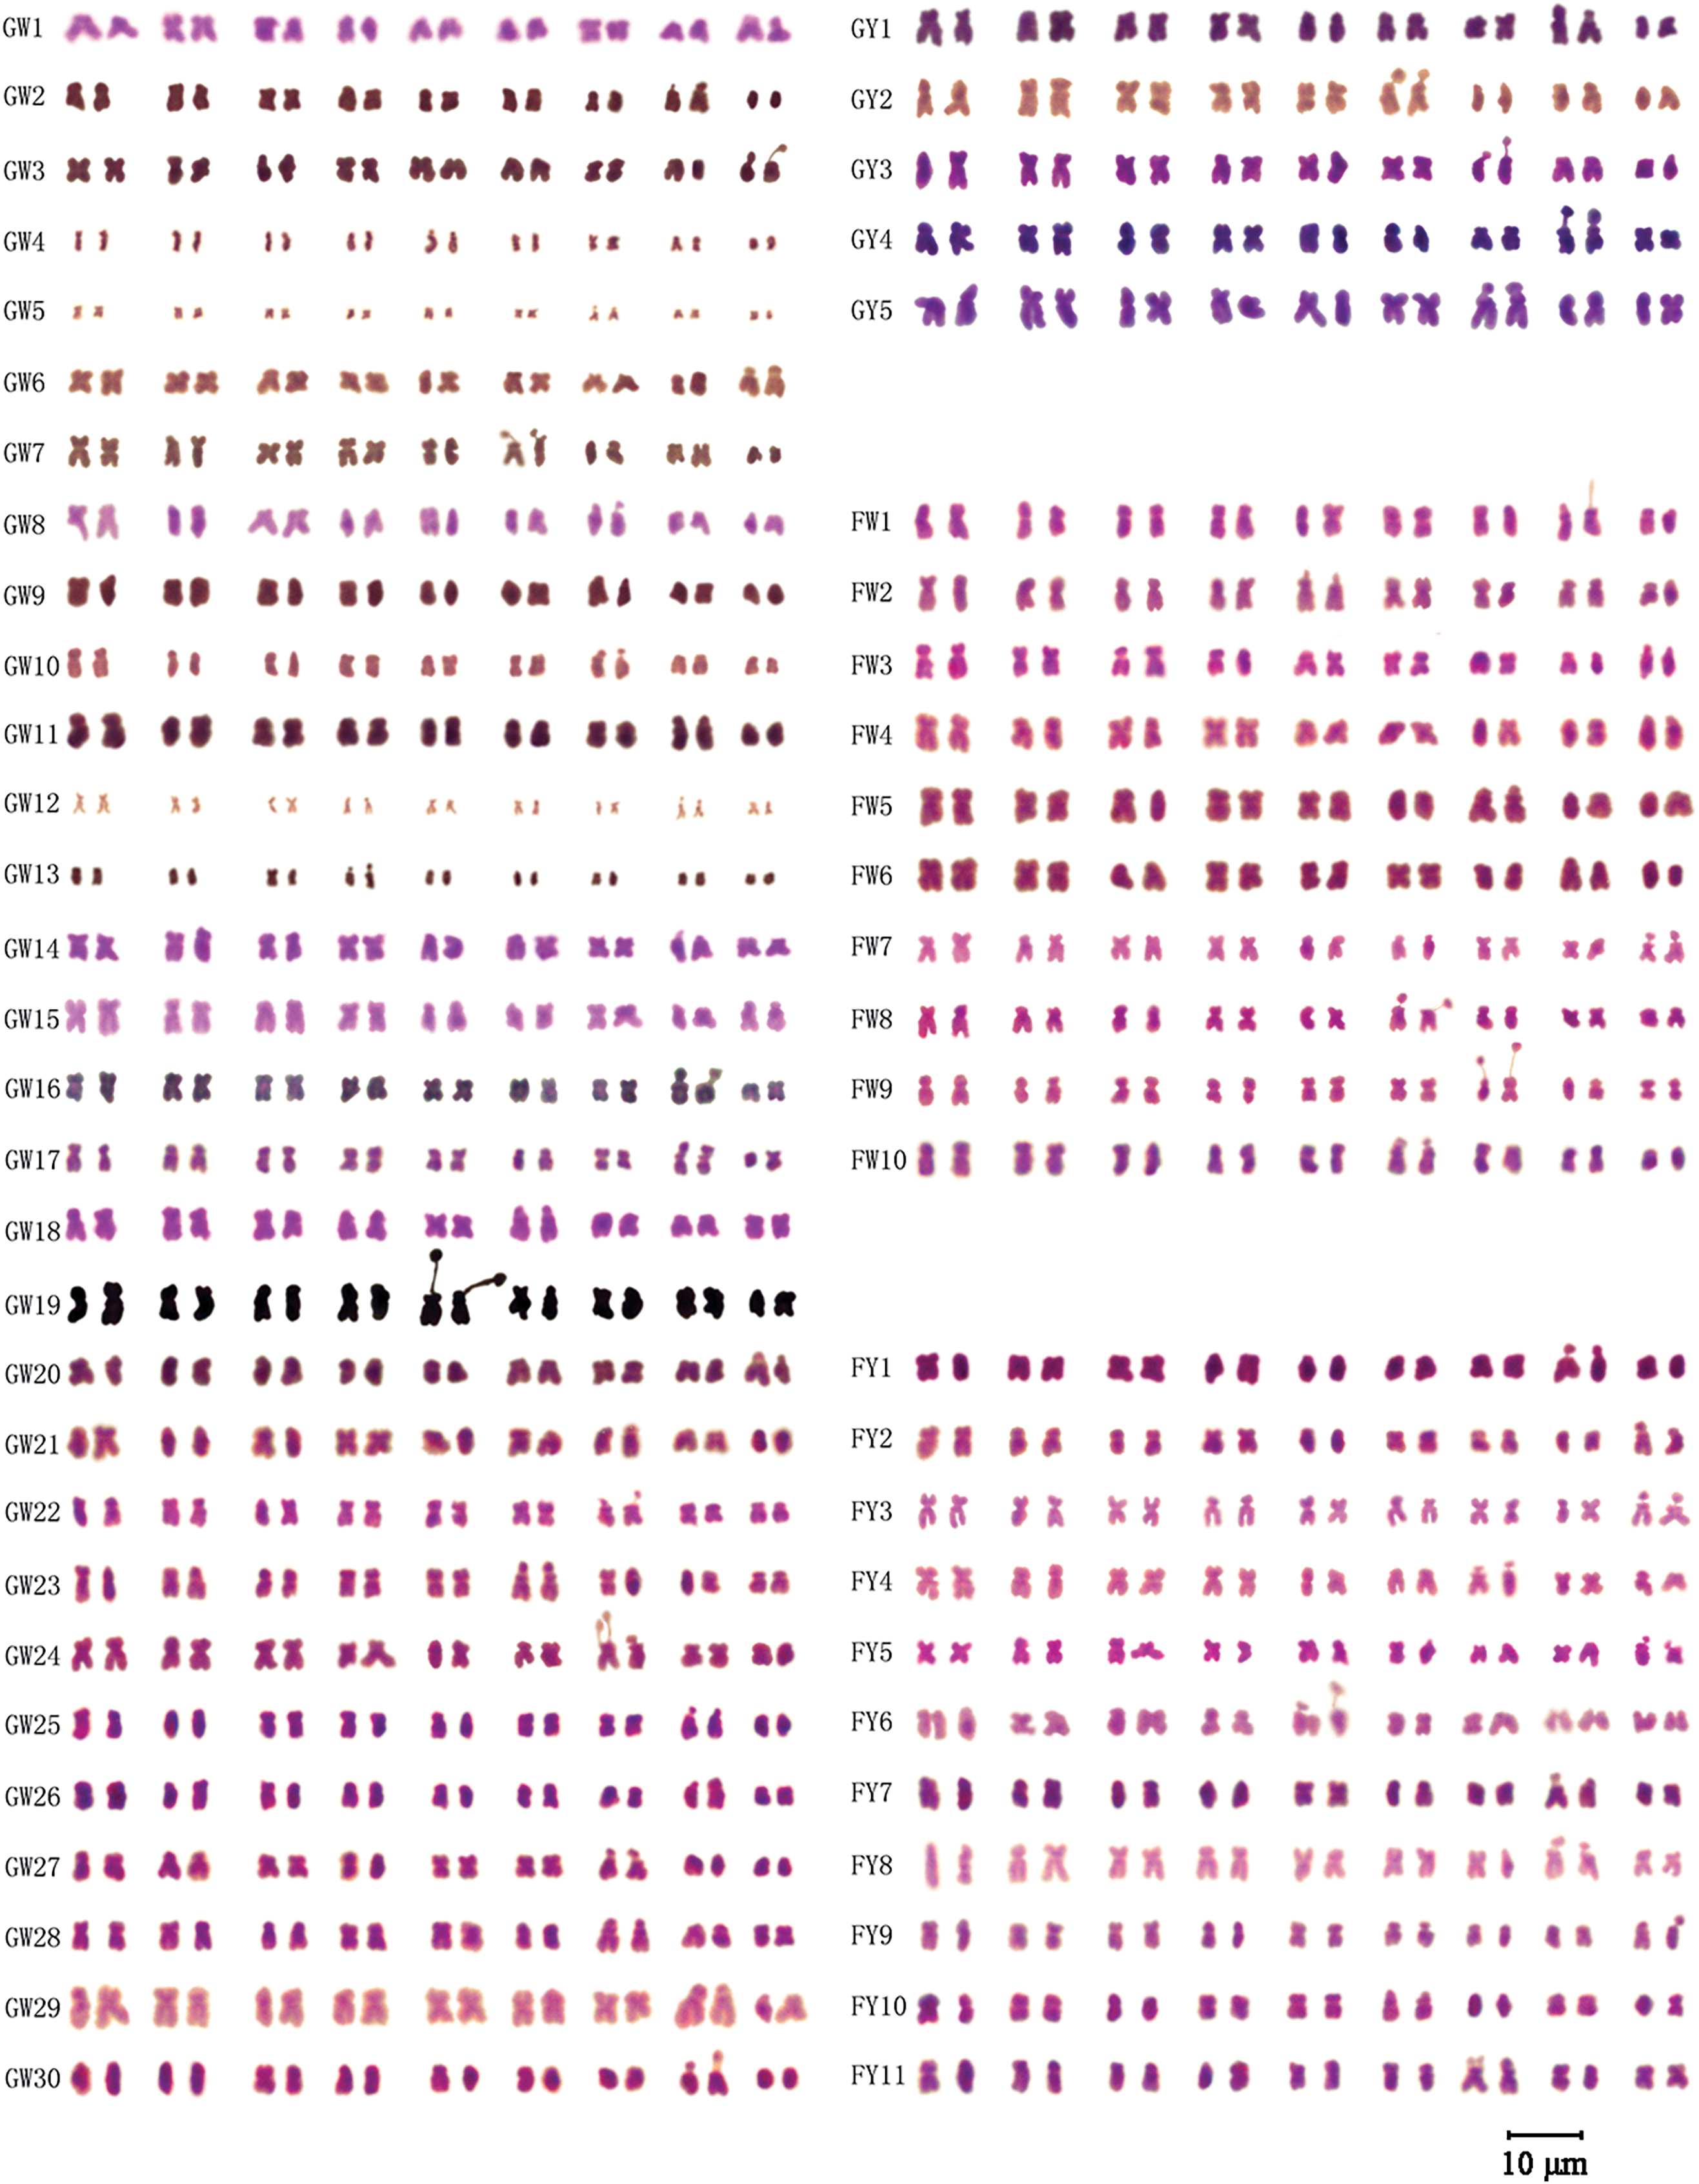
Figure 2: Karyograms of different varieties of Chinese kale
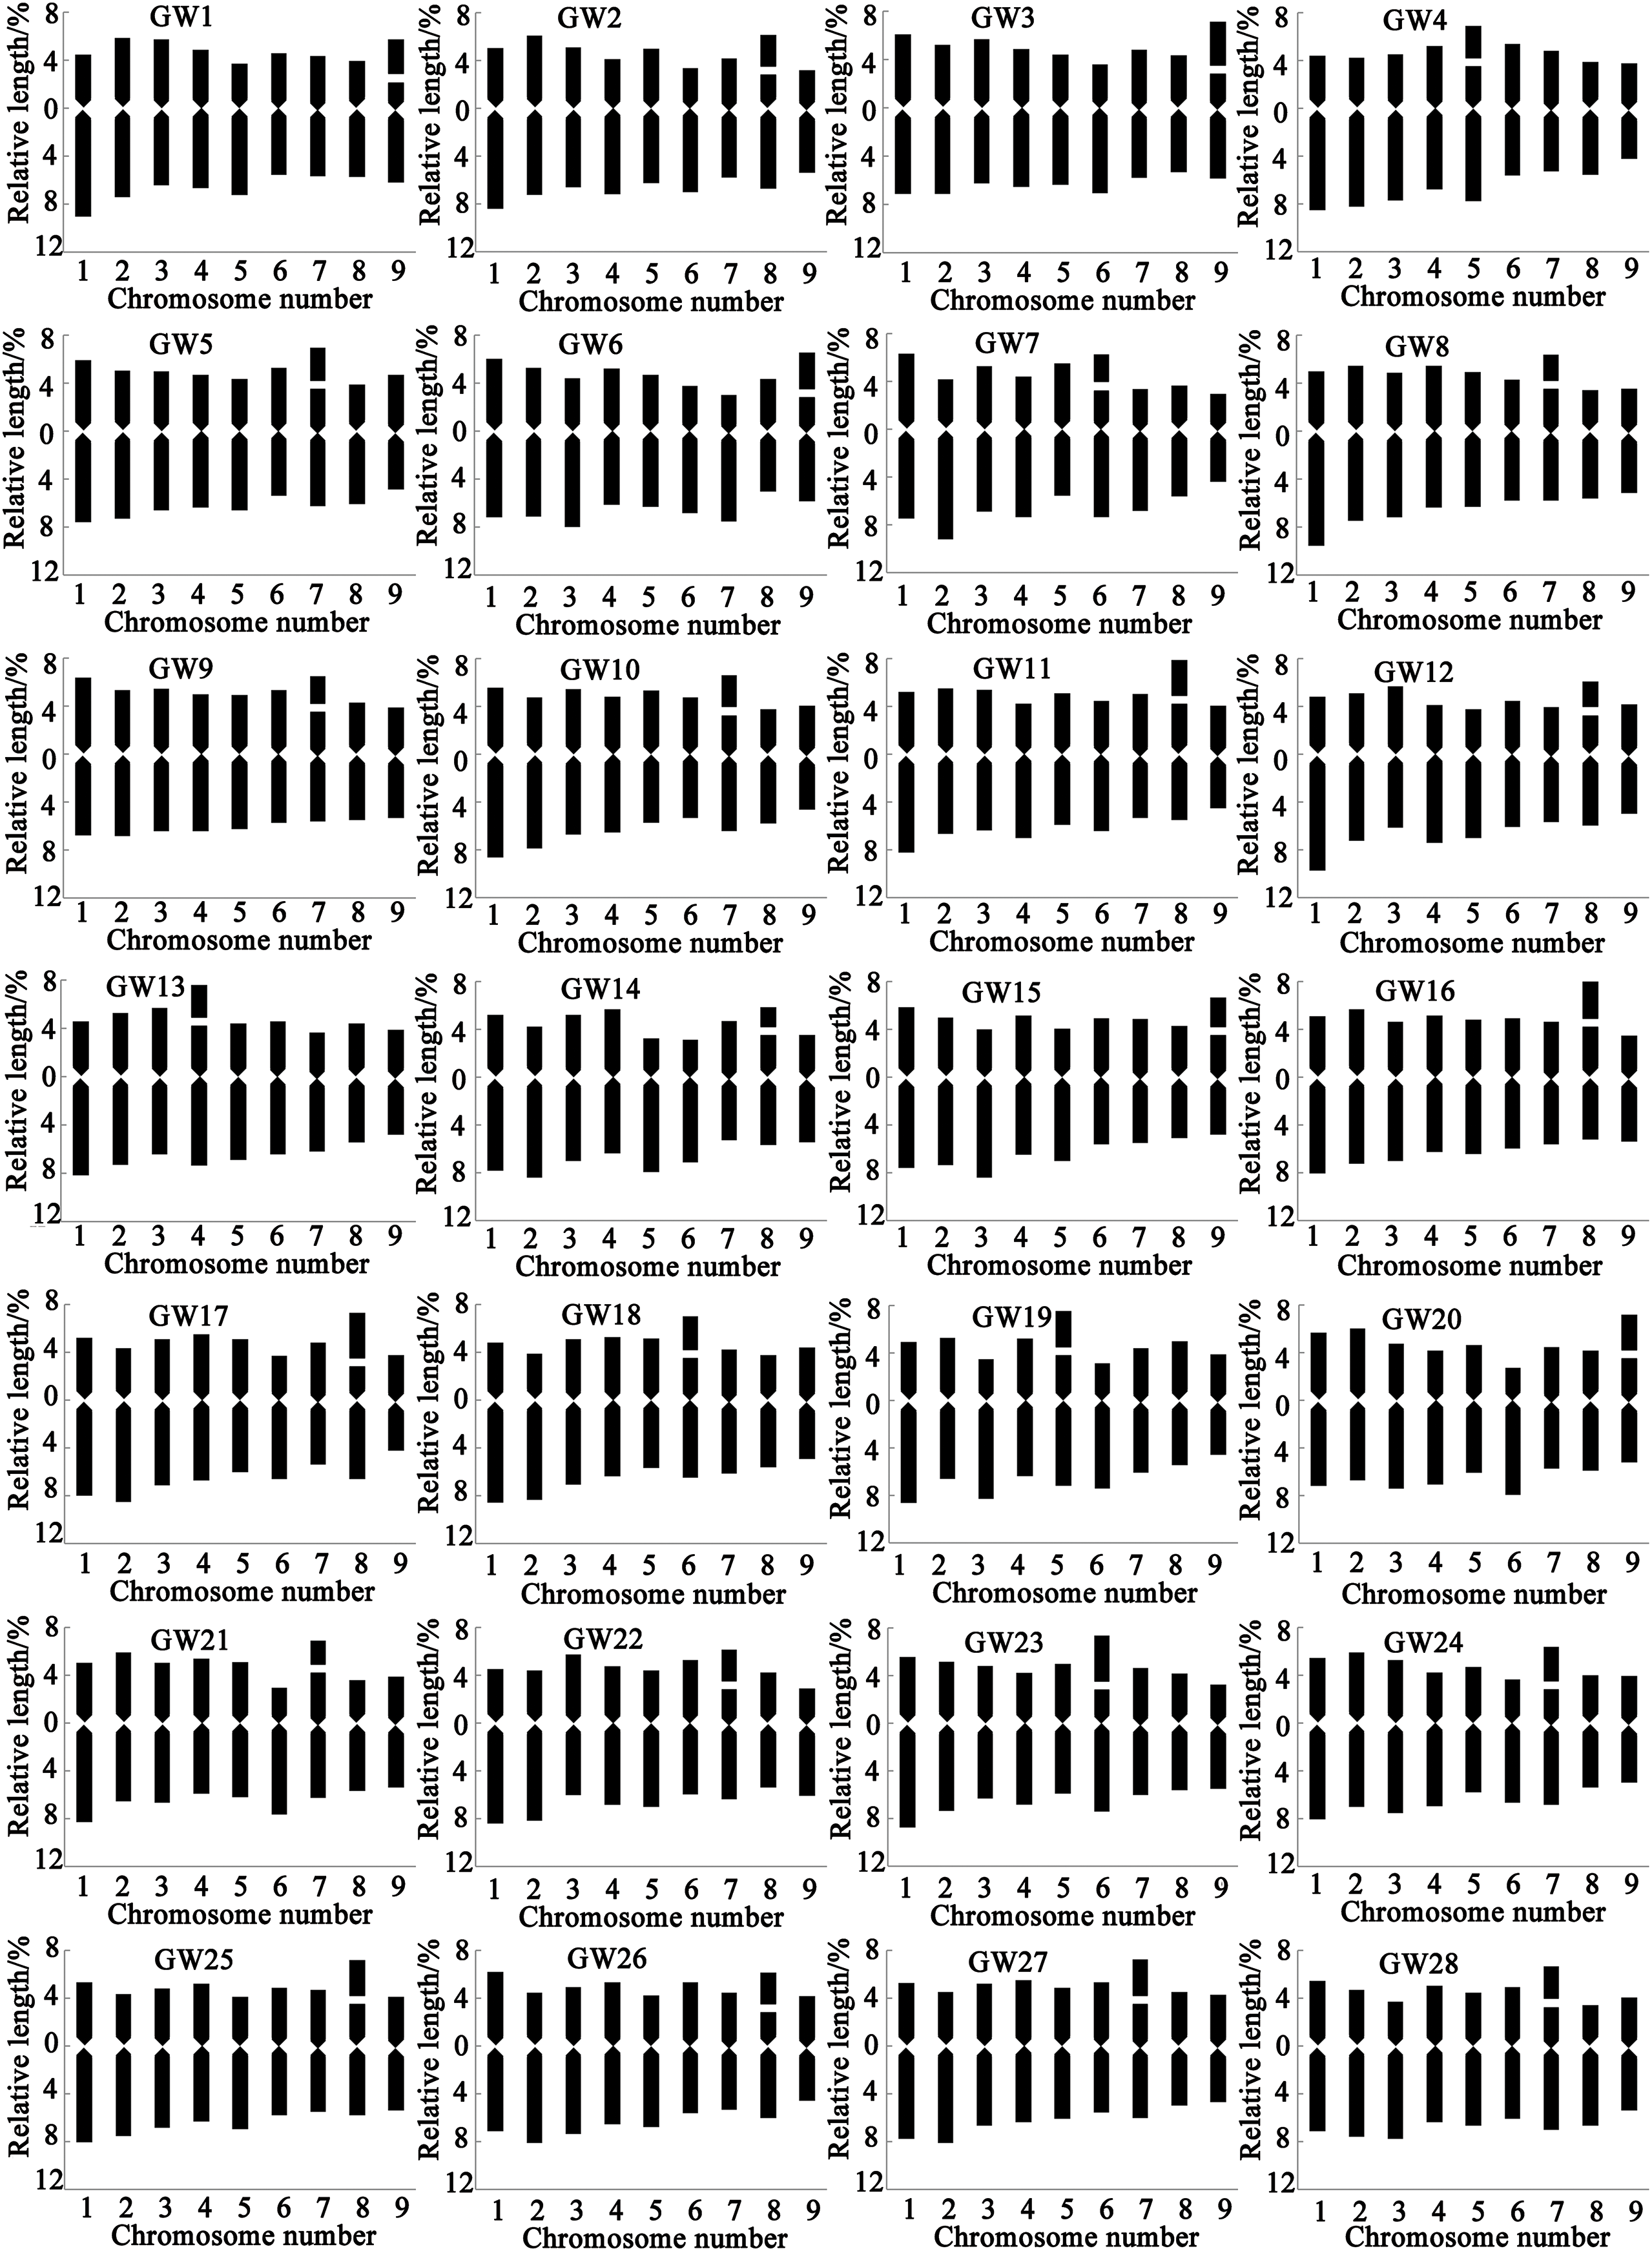
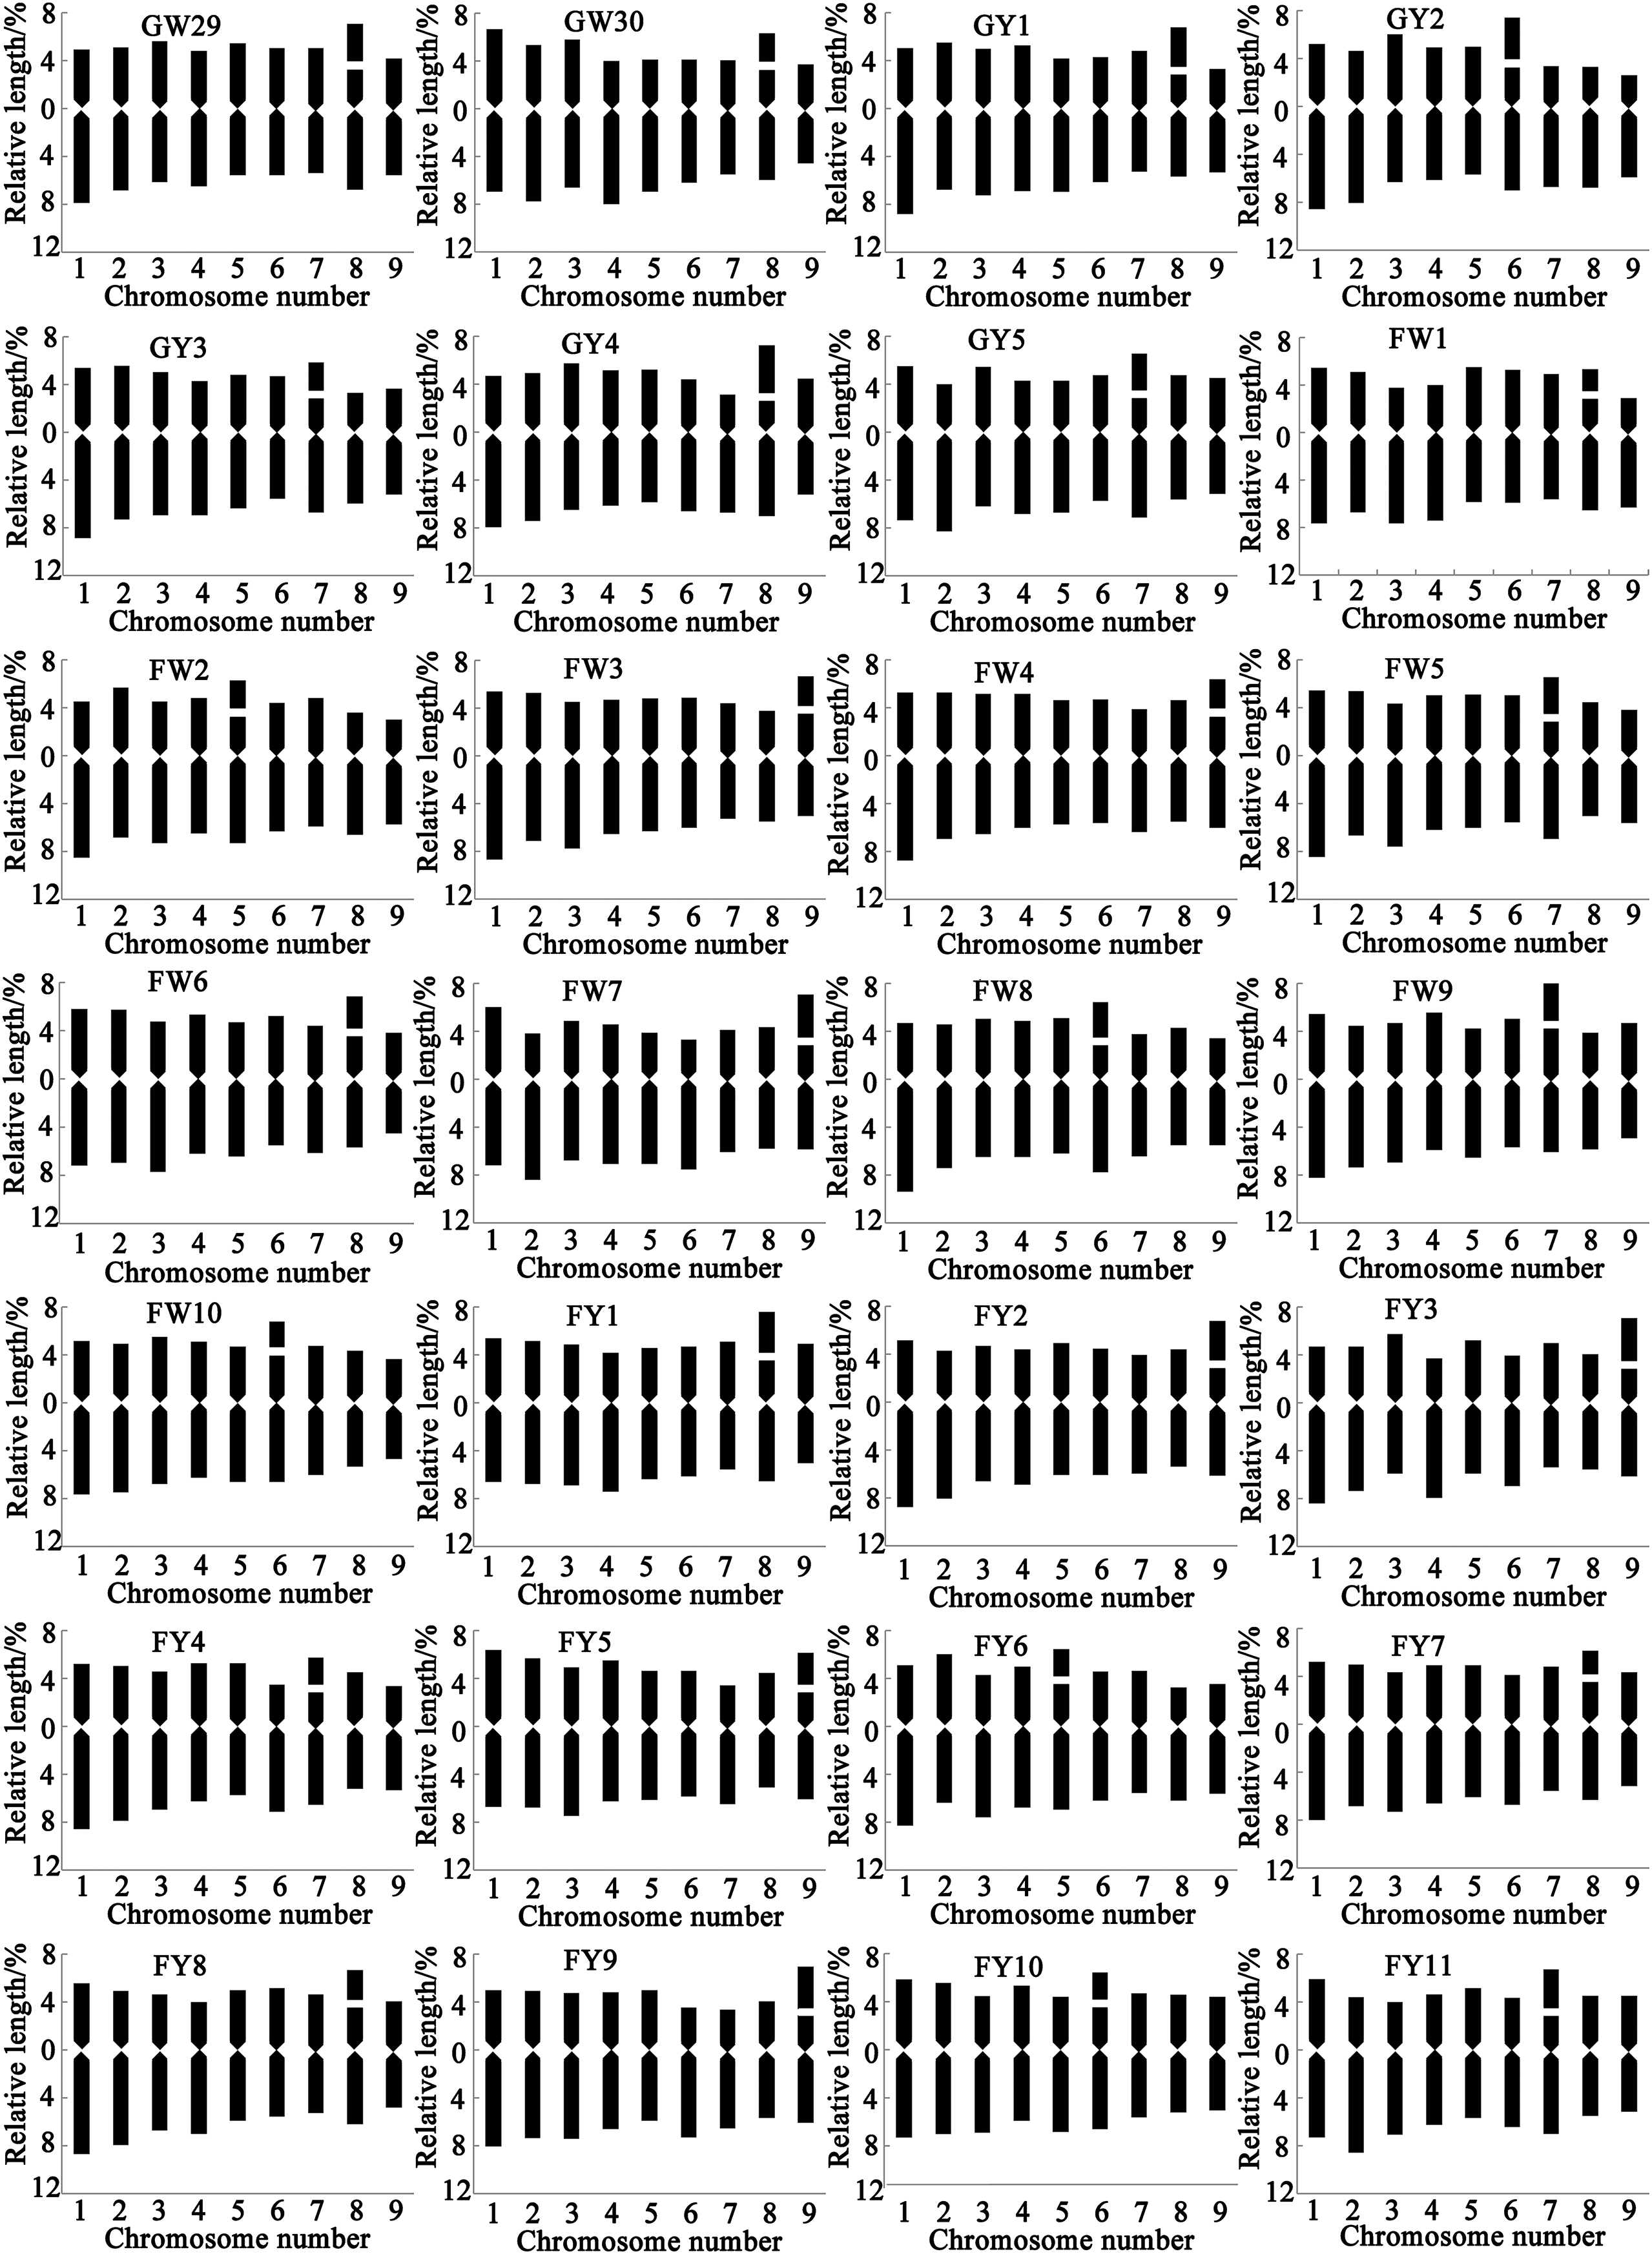
Figure 3: Chromosome ideograms of different varieties of Chinese kale. In the Y axis, the upper part of 0 represents the short arm, and the lower part represents the long arm
3.1 Chromosome Number and Characteristics
All 56 varieties of Chinese kale were diploid with 2n = 2x = 18, and no cells with abnormal chromosome numbers were detected (Fig. 2). Each variety possessed a pair of satellite chromosomes, with variations in length and location among different varieties. The satellites were predominantly located on chromosomes 7, 8, and 9, present in approximately 78.57% of all Chinese kale varieties (Fig. 3). Chromosome 8 had the highest frequency of satellites, observed in 17 varieties. Additionally, the satellite-bearing chromosomes were primarily of the sm type, representing 64.29% of all varieties, including 56.67% of GW, 100% of GY, 50% of FW, and 81.82% of FY.
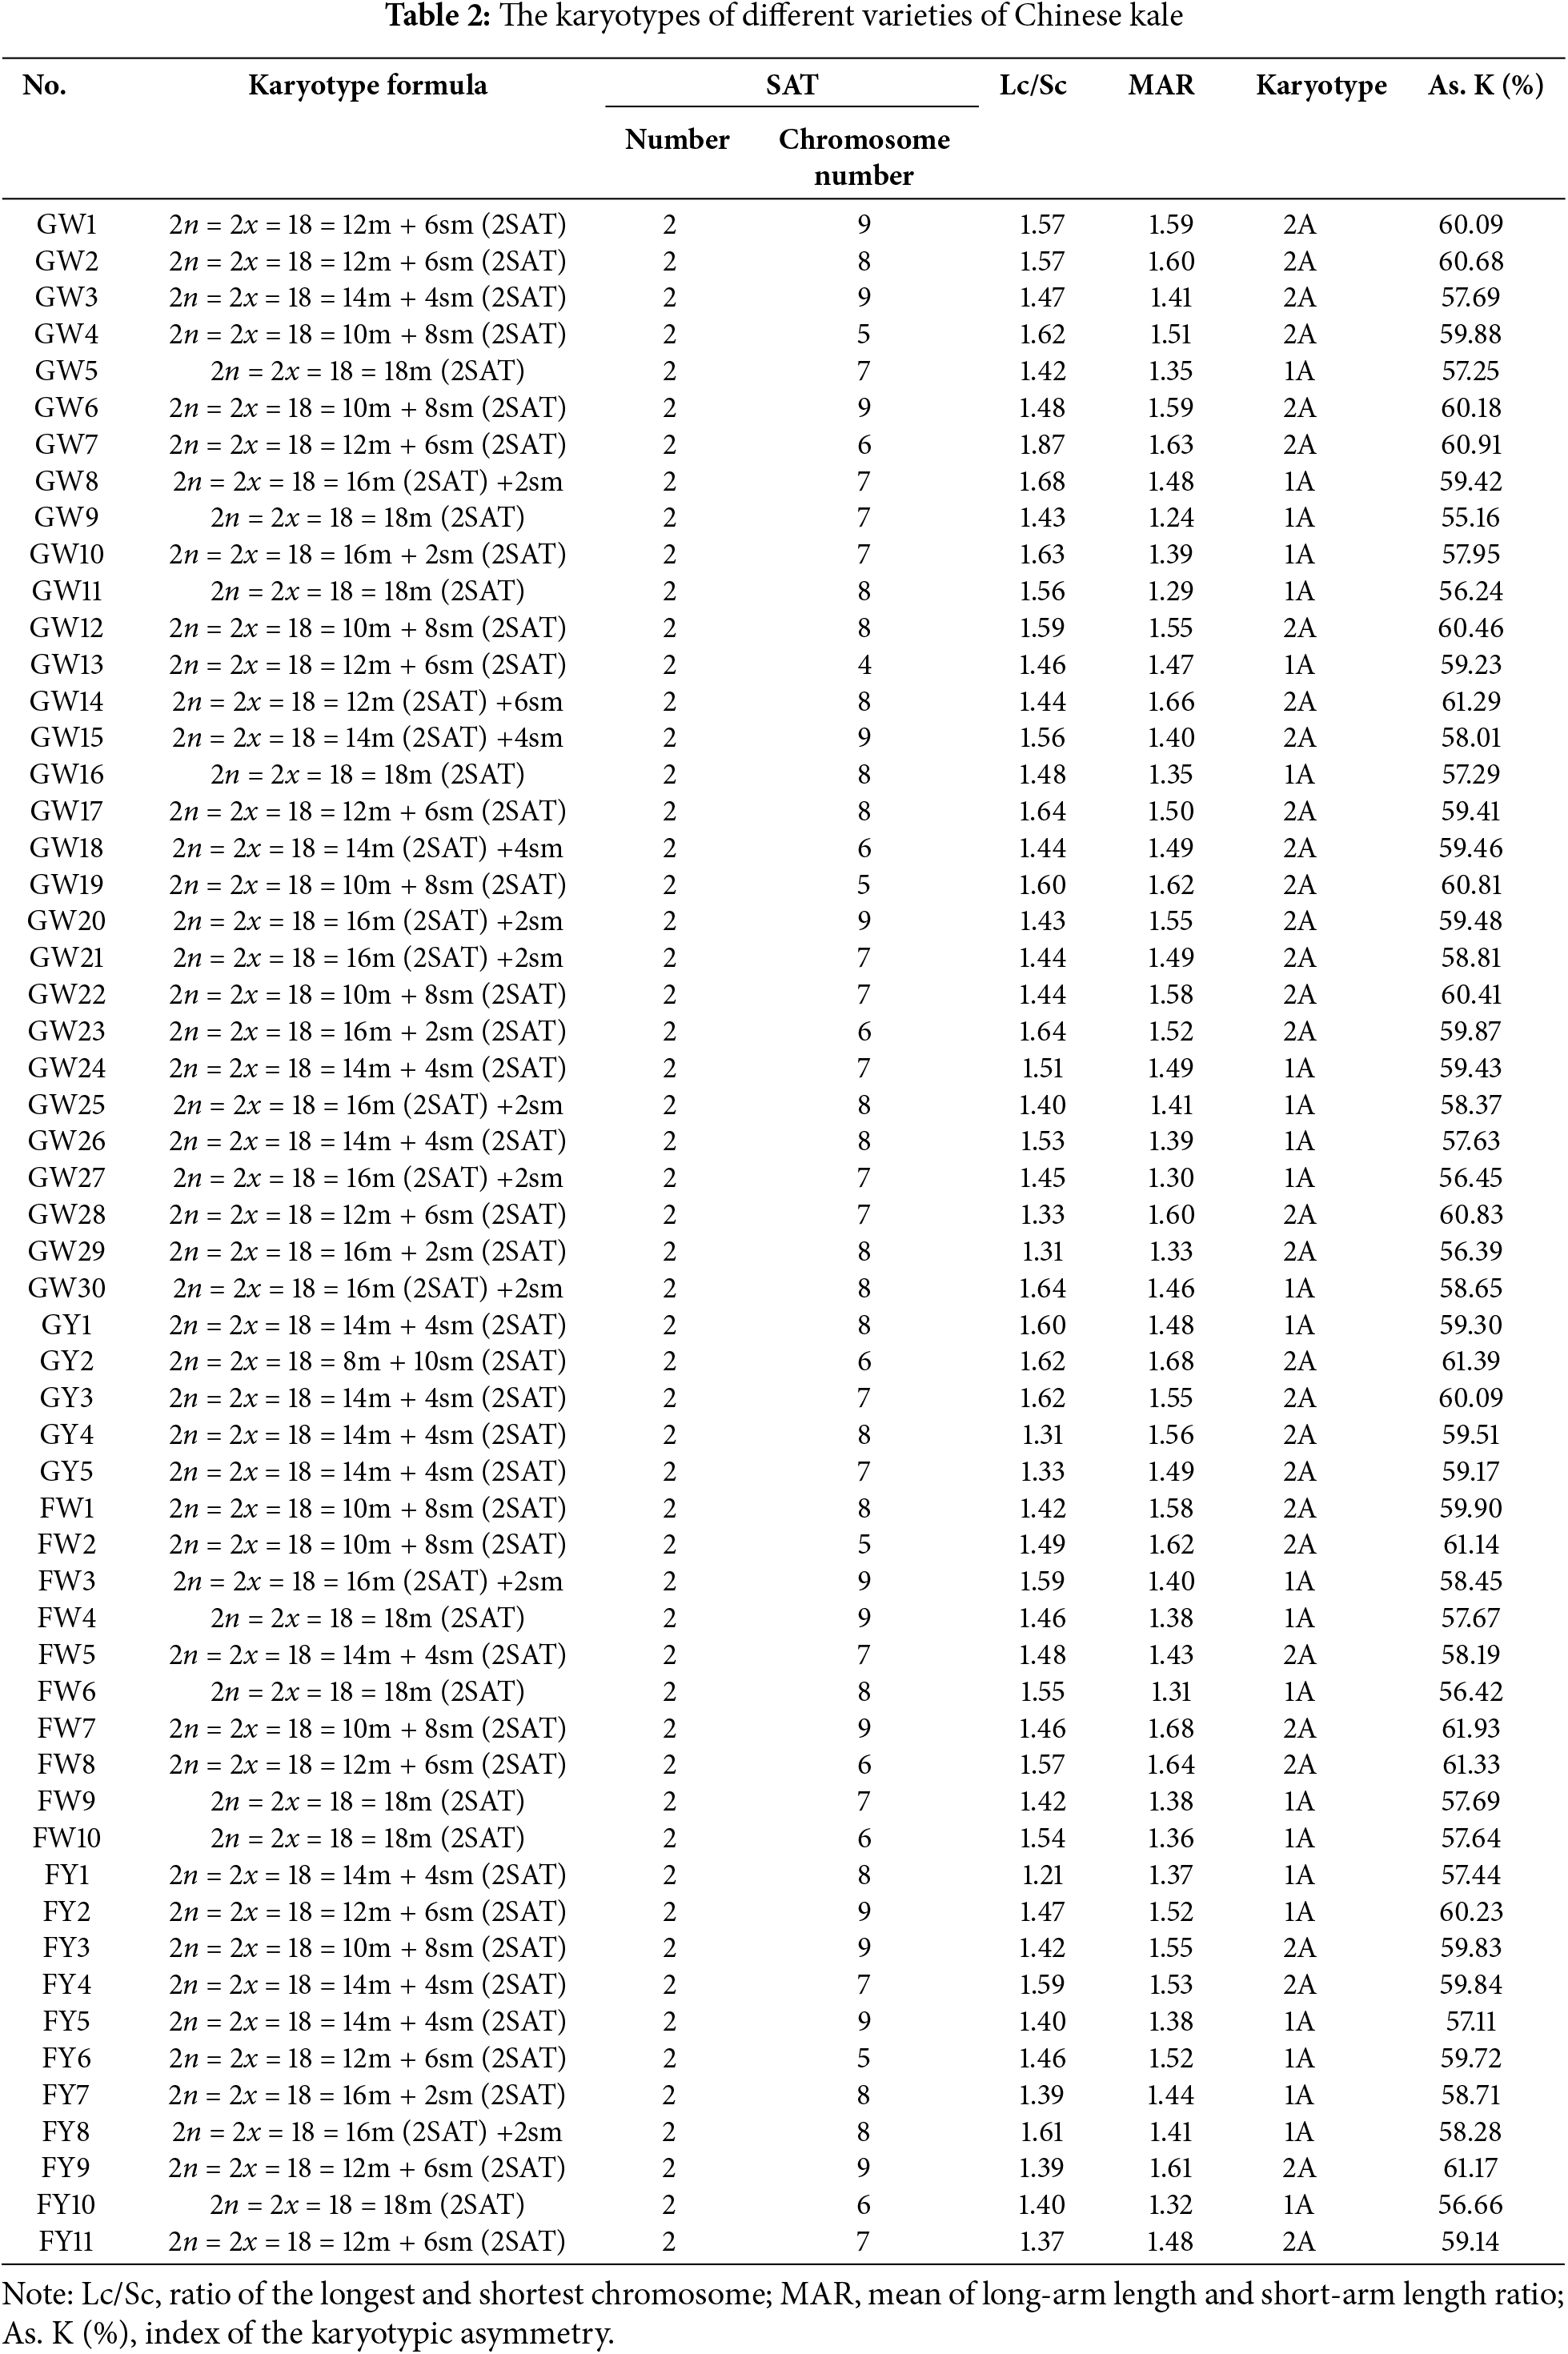
As shown in Table 2, most Chinese kale varieties consisted of both median-centromere (m) and submedian-centromere (sm) chromosomes, while a few varieties contained only median-centromere (m) chromosomes. The specific karyotype formulas varied among different varieties of Chinese kale.
When analyzed together with Tables 2 and S1, the relative lengths of chromosomes ranged from 7.39% to 14.58% in GW, 8.54% to 14.33% in GY, 8.35% to 14.09 in FW, and 8.69% to 14.29% in FY. The centromere indices for GW, GY, FW, and FY ranged from 25.67–49.64, 27.61–48.7, 27.13–48.93, and 31.86–49.35, respectively. The ranges of relative chromosome lengths and centromere index of GW represented all the groups’ ranges in this experiment. However, the range of ratios of the longest and shortest chromosomes for GW was observed at 1.31–1.87, encompassing those of GY (1.31–1.62) and FW (1.42–1.59), but not fully encompassing that of FY (1.21–1.61).
Among 56 samples, the highest mean arm ratio was 1.68, and the lowest was 1.24. In GW, the arm ratio varied from 1.01 to 2.90, with 8.89% of chromosomes having an arm ratio greater than 2 and a mean arm ratio of 1.47 for the entire group. In GY, the arm ratio ranged from 1.05 to 2.62, with 17.78% of chromosomes having an arm ratio greater than 2 and a mean arm ratio of 1.55 for the group. In FW, the arm ratio ranged from 1.04 to 2.69, with 10.00% of chromosomes having an arm ratio greater than 2 and a mean arm ratio of 1.48. In FY, the arm ratio varied from 1.03 to 2.14, with 45.45% of chromosomes having an arm ratio greater than 2 and a mean arm ratio of 1.47. Interestingly, although GW had the largest range in arm ratios among the four groups, it had the smallest proportion of chromosomes with an arm ratio greater than 2. In contrast, FY, which had the smallest range in arm ratios, had the largest proportion greater than 2. The karyotype asymmetry index was similar across the four groups, ranging from 55.16% to 61.29% for GW, 59.17% to 61.39% for GY, 56.42% to 61.93% for FW, and 56.66% to 61.17% for FY. Chinese kale exhibited two karyotype types: 1A, accounting for 44.64%, and 2A, accounting for 55.36% (Table 2).
3.3 Principal Component Analysis
To analyze the relationships among the four groups of Chinese kale based on karyotypic parameters, partial least squares discriminant analysis (PLS-DA) was conducted. As shown in Fig. 4, PLS-DA1 explained 12.8% of all parameter information, effectively differentiating between Chinese kale from Guangdong (GW and GY) and Fujian (FW and FY). PLS-DA2 explained 12.5% of all parameter information, distinguishing GY from FW. Overall, there was overlap among the groups, making complete clustering challenging. However, some regional differences were observed, providing a basis for further differential analysis.
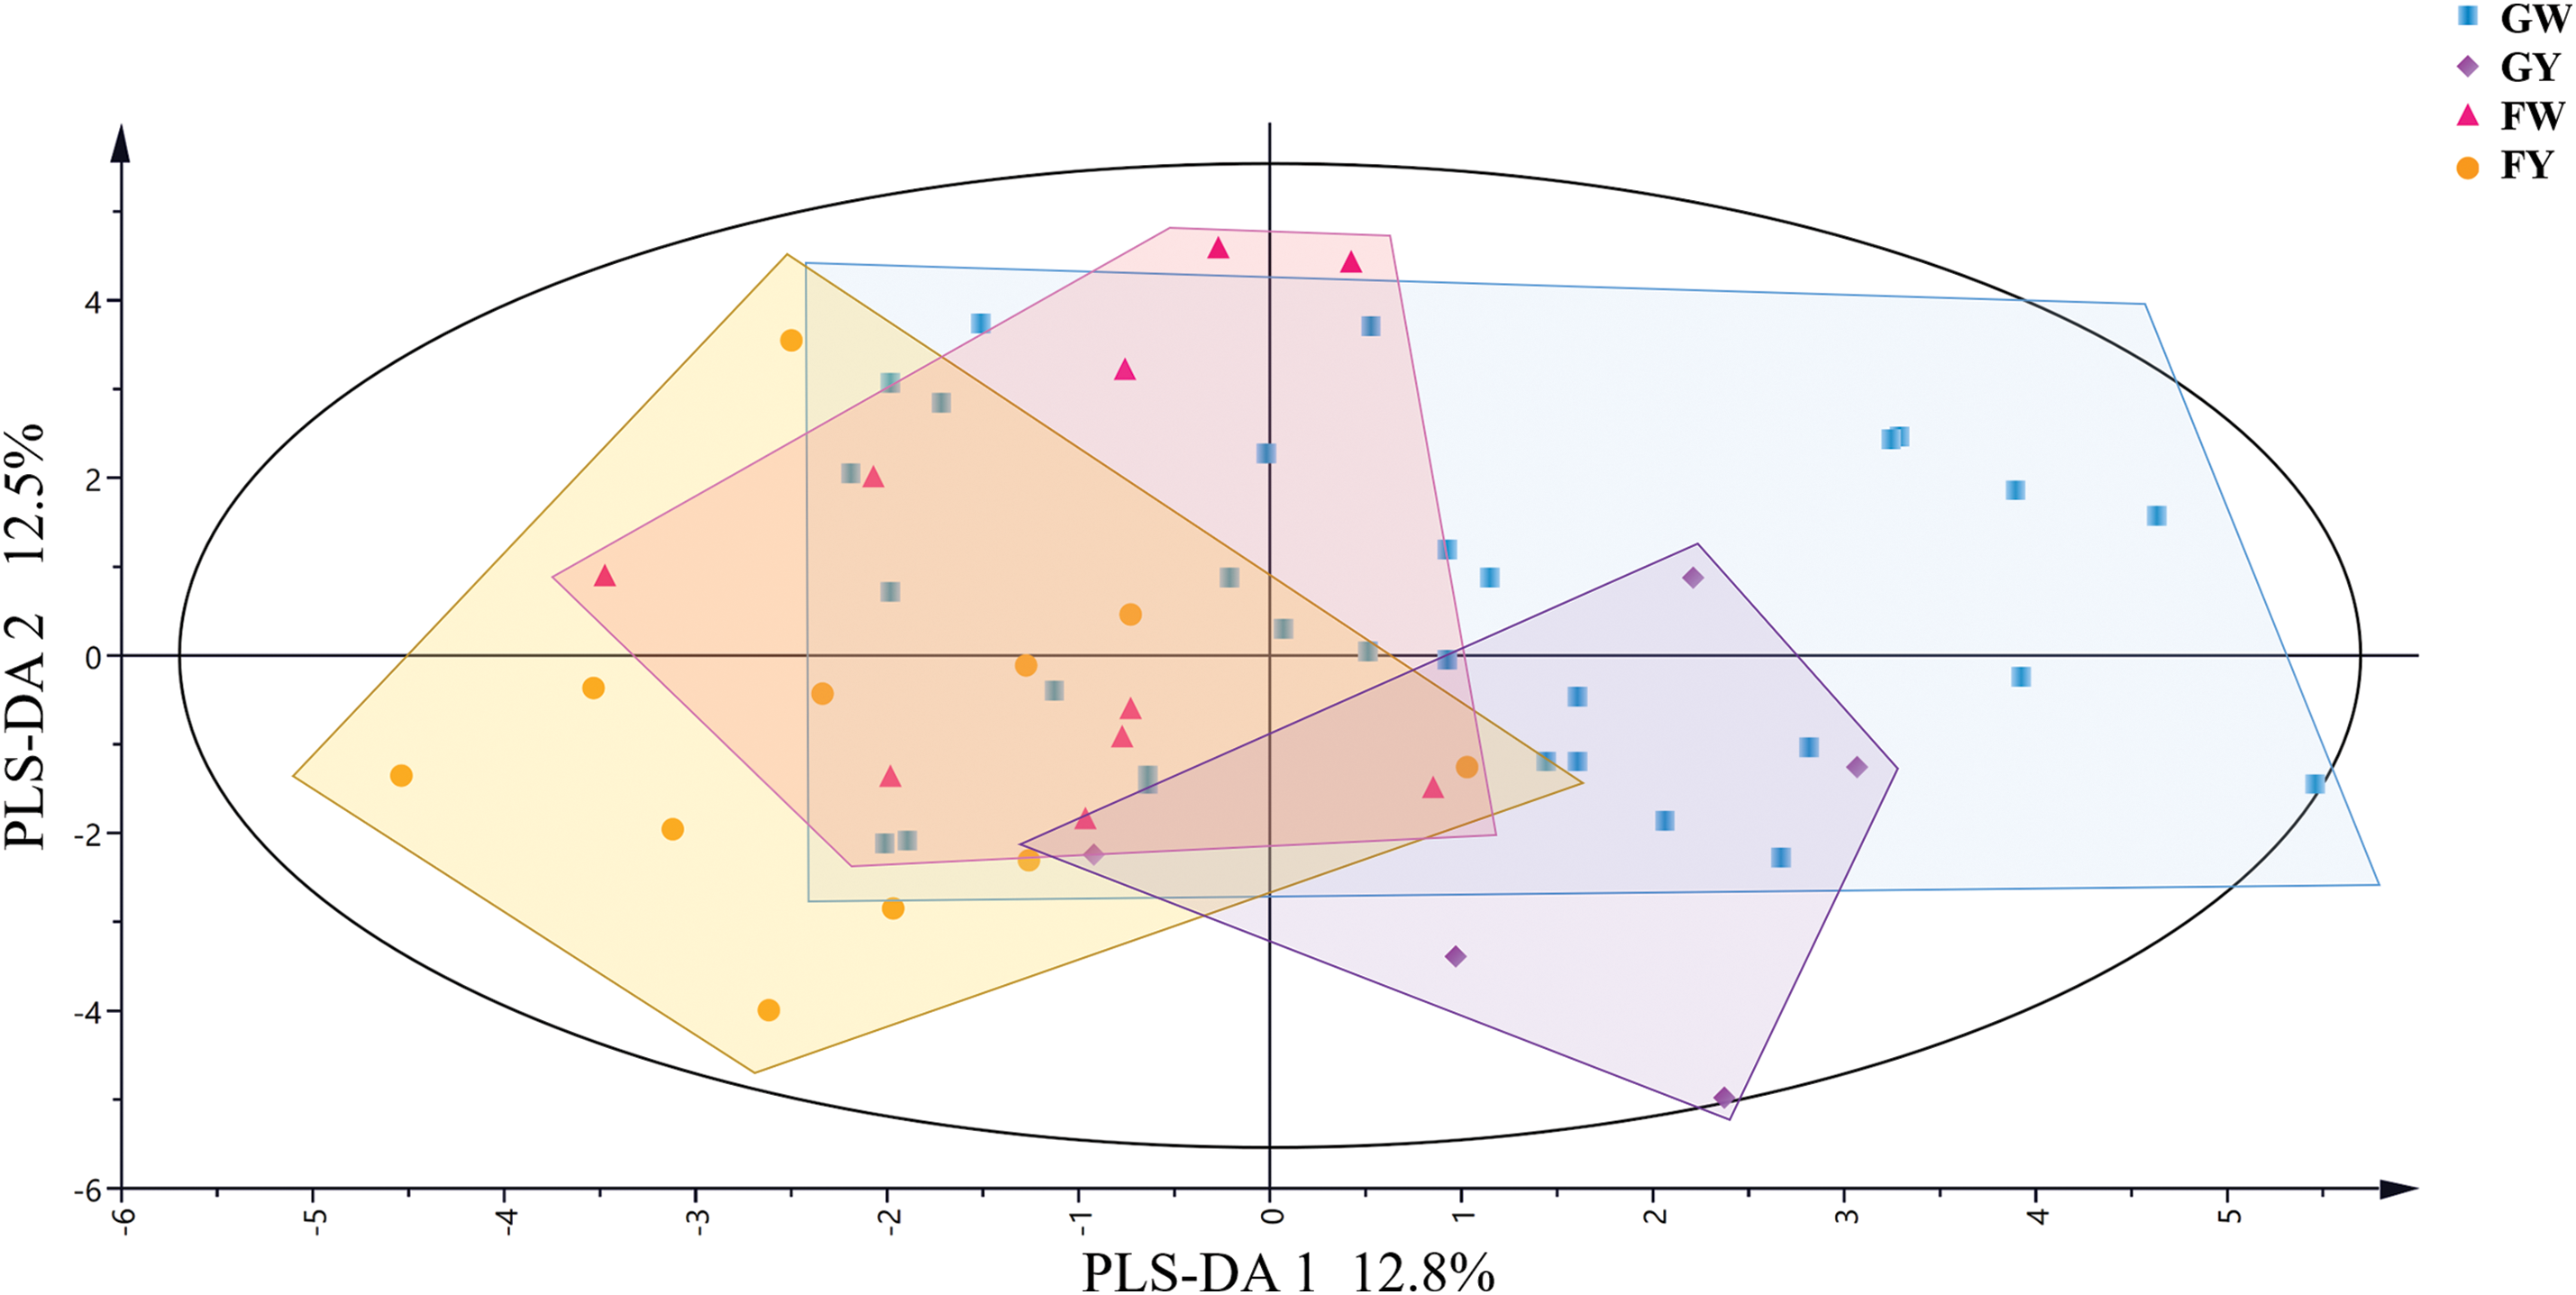
Figure 4: PLS-DA analysis of karyotypes parameters of different varieties of Chinese kale
3.4 Karyotype Differences among Four Groups of Chinese Kale
To comprehensively study the karyotype differences among the four groups of Chinese kale, nine differential indicators were selected from VIP values greater than 1, based on PLS-DA. Heatmaps and box plots were generated to visually observe group differences (Fig. 5). As shown in Fig. 5A, the karyotype indicators were generally clustered into two major groups. One group included the relative length of chromosome 9, the relative length of the short arm of chromosome 7, and the minimum centromere index, while the other six indicators clustered into the second group.
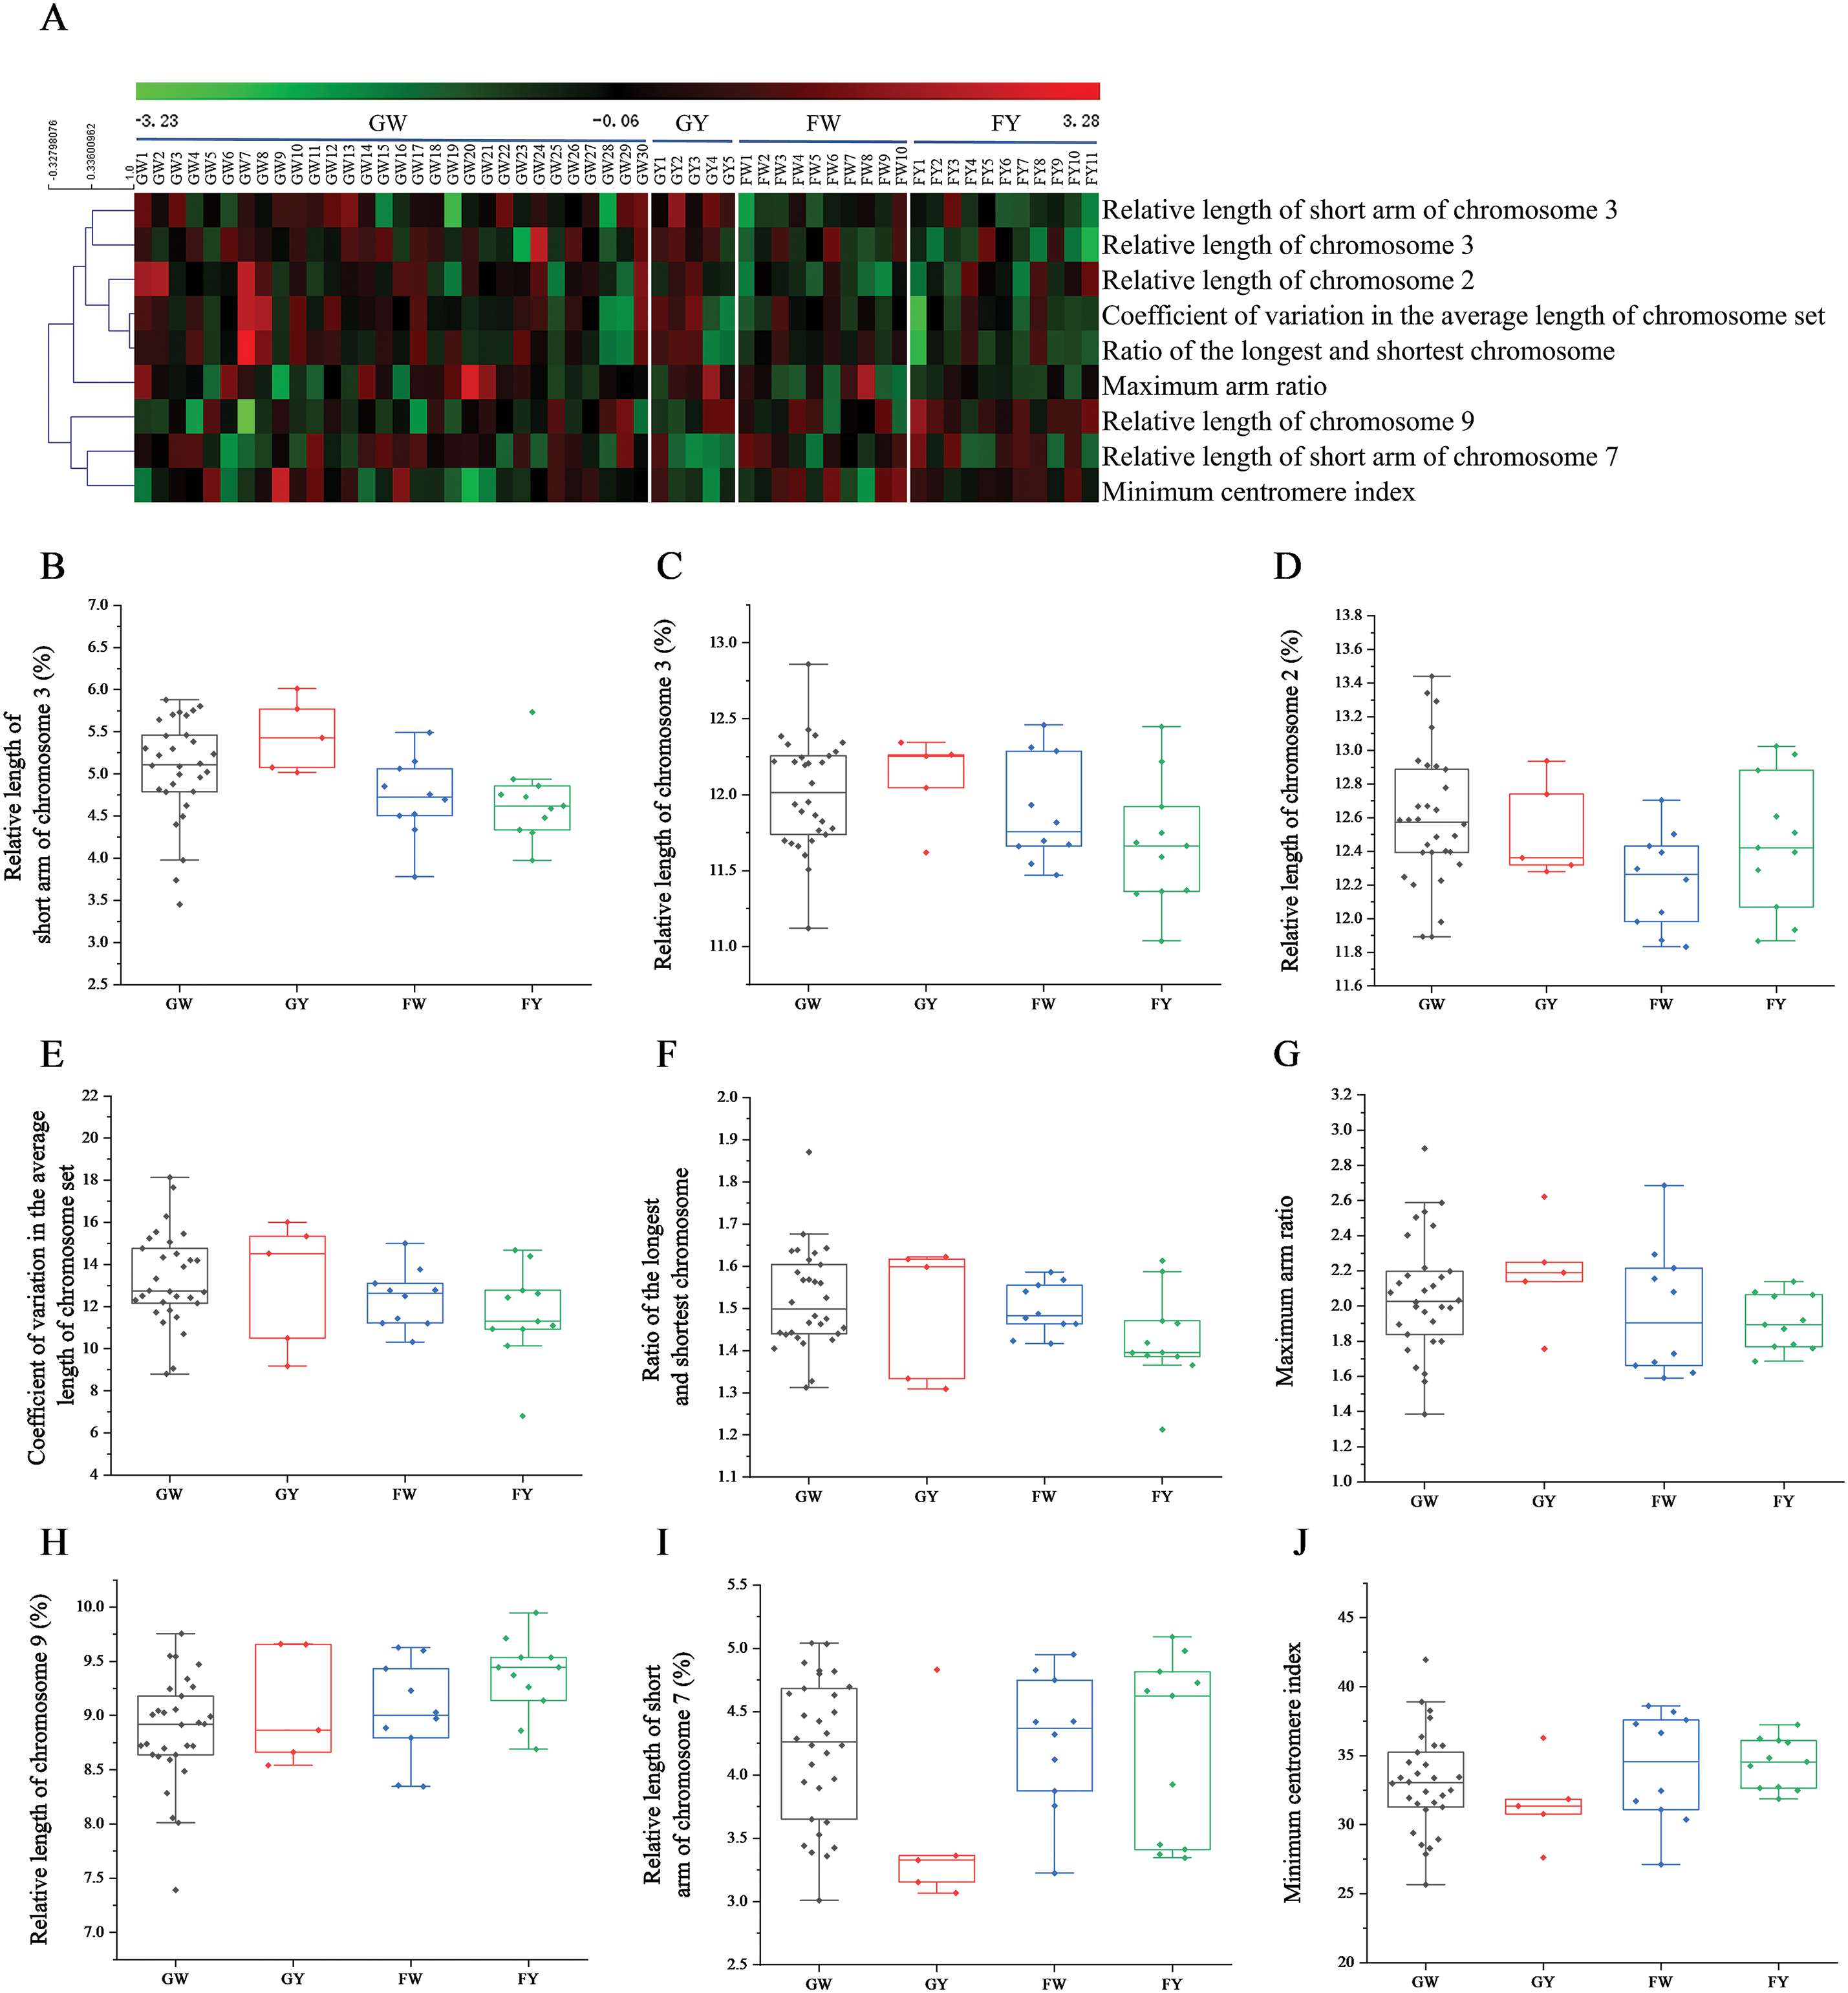
Figure 5: Heatmaps and box-plots of karyotypes parameters of different varieties of Chinese kale. (A) Heatmaps of 9 indexes of different Chinese kale varieties. (B) Relative length of the short arm of chromosome 3. (C) Relative length of chromosome 3. (D) Relative length of chromosome 2. (E) Coefficient of variation in the average length of chromosome set. (F) Ratio of the longest and shortest chromosome. (G) Maximum arm ratio. (H) Relative length of chromosome 9. (I) Relative length of the short arm of chromosome 7. (J) Minimum centromere index
From the nine box-plots in Fig. 5, although the ranges of GW indicators were broad, their median values were centered among all groups. The GY group showed higher median values than the other groups for the relative length of the short arm of chromosome 3, the relative length of chromosome 3, and the maximum arm ratio (Fig. 5B,C,G), but had significantly lower values for the relative length of the short arm of chromosome 7 and the minimum centromere index (Fig. 5I,J). The FW group had the lowest median value for the relative length of chromosome 2 among all groups, while the FY group had a significantly higher median value for the relative length of chromosome 9 compared to the other groups (Fig. 5D,H).
To investigate the correlations among kale karyotype parameters, 41 relationships were identified (Fig. 6). The relative length of the long arm and the relative length of the short arm of chromosome 2 to 8 were negatively correlated. The chromosome type was positively correlated with the number of that chromosome type within the set. There was a strong negative correlation between the minimum centromere index and the maximum arm ratio, as well as between the maximum centromere index and the minimum arm ratio. Although karyotype classification is typically associated with chromosome length ratio, correlations were found between chromosome karyotype and maximum arm ratio, minimum centromere index, karyotype asymmetry, and the proportion of arm ratios greater than 2, but not with chromosome length ratio (Fig. 6).
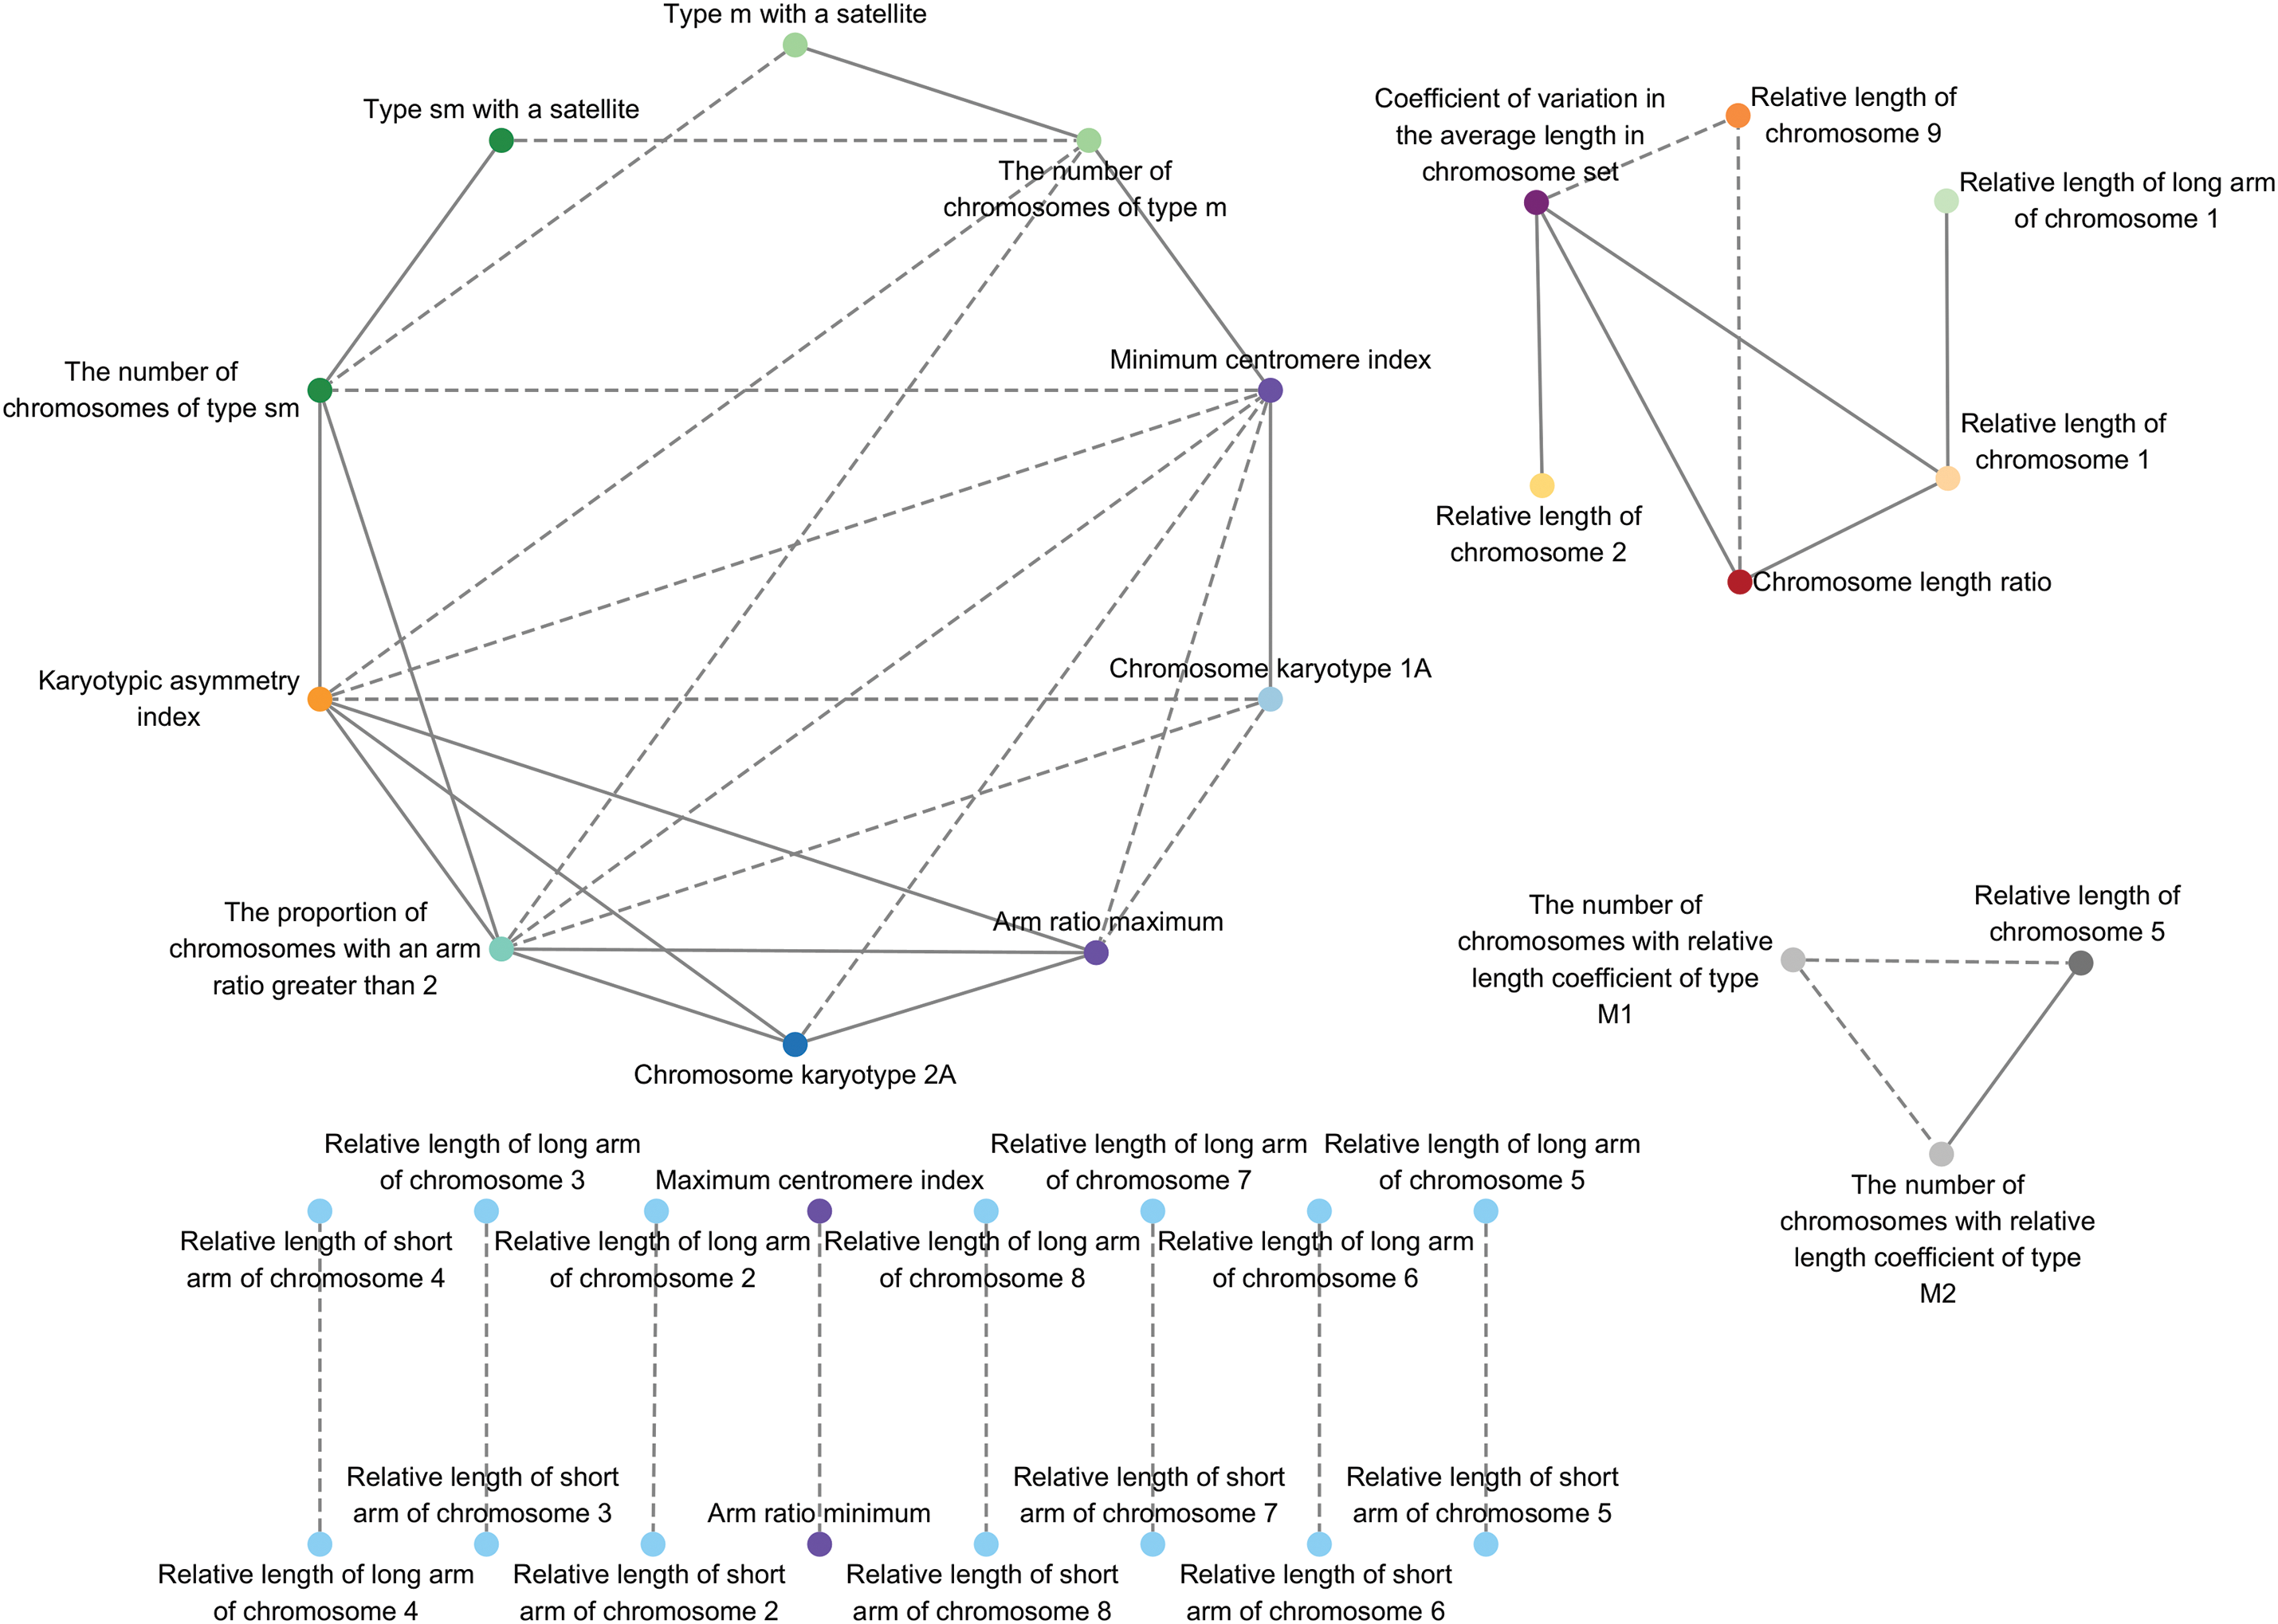
Figure 6: Correlation between karyotypes parameters of different varieties of Chinese kale. The solid lines represent a positive correlation. The dashed lines represent a negative correlation. All correlations in the figure reflect Pearson correlation coefficient values above the threshold (|ρ| > 0.65)
3.6 Evolutionary Trend Analysis
To assess the evolutionary degree of Chinese kale, karyotypic evolutionary trends were analyzed using the average arm ratio and karyotypic asymmetry index as references. As observed in Fig. 7, the overall evolutionary level of GY was the highest, while the remaining three groups of Chinese kale varieties were evenly distributed across the plot. GW, the group with the most varieties, included the oldest Chinese kale, with GW9 notably distinct from the other varieties. Overall, GY was the most evolved among the four groups of Chinese kale.
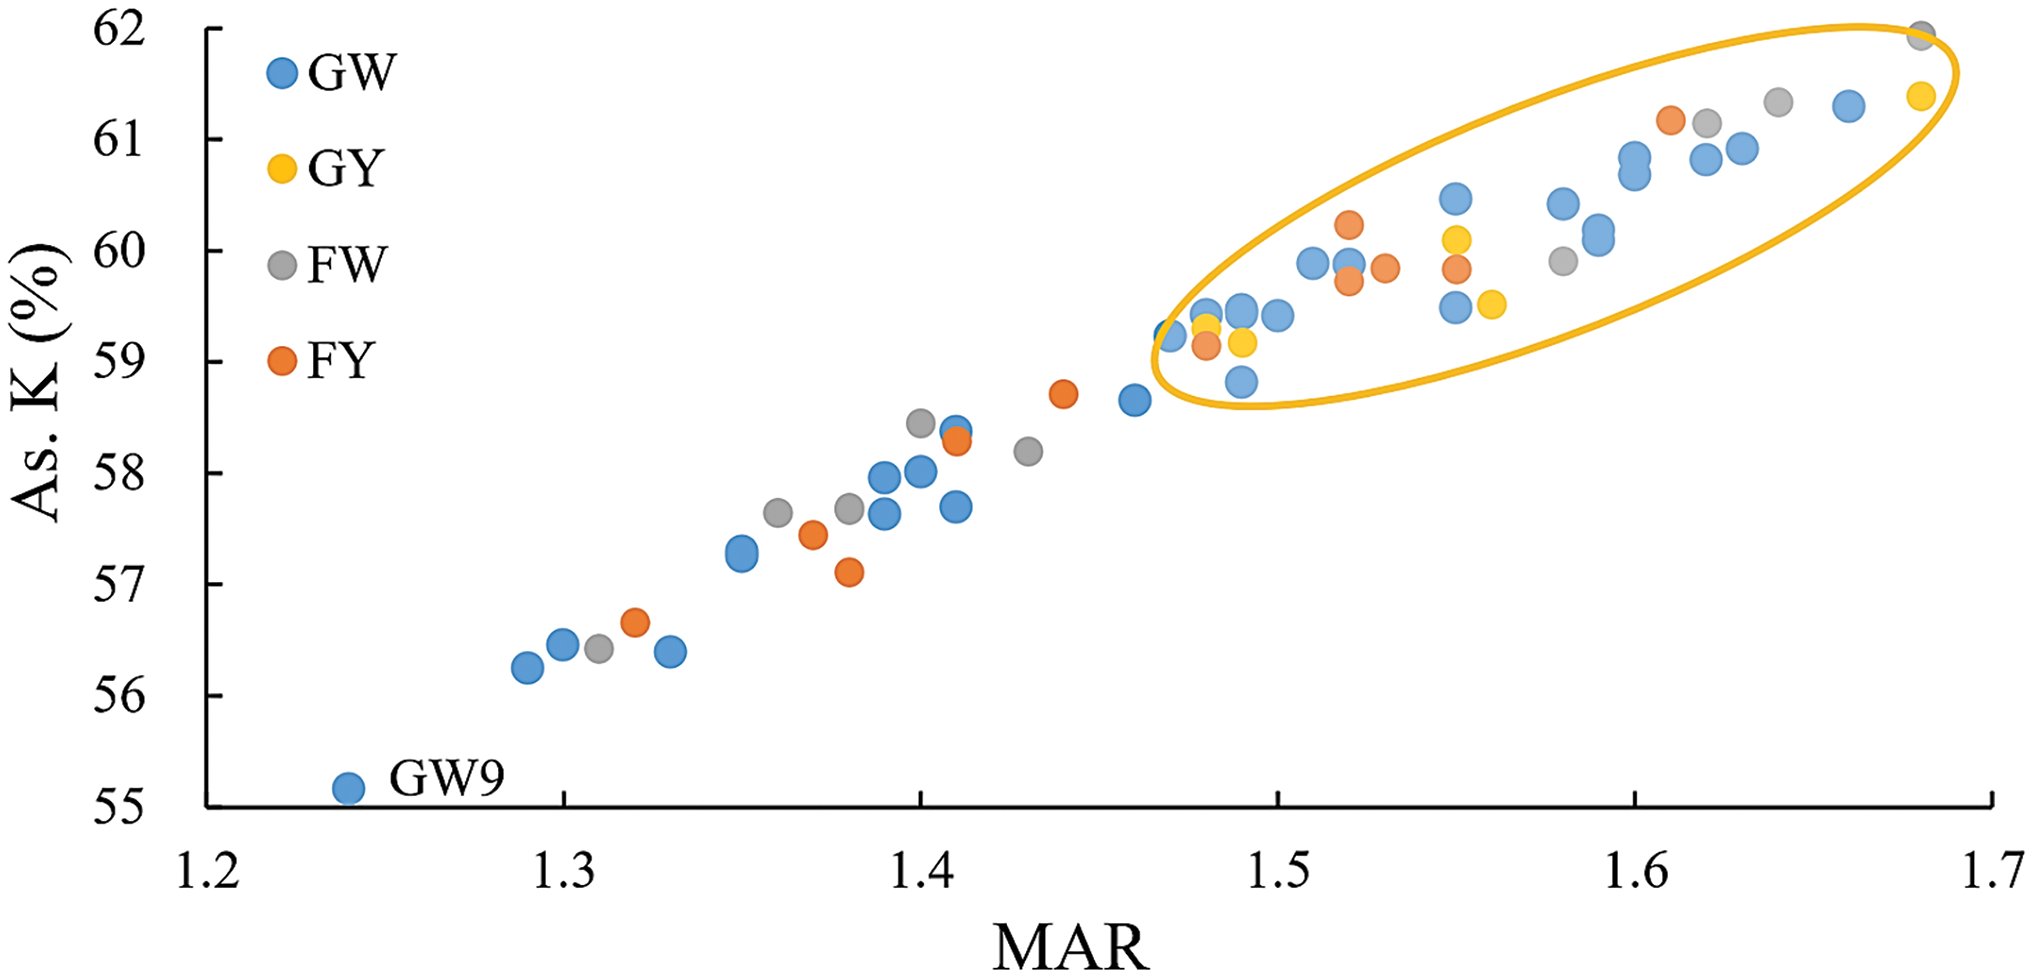
Figure 7: Karyotypic evolutionary trend map of different varieties of Chinese kale
4.1 Differences in Karyotypes between This Study and Previous Studies
In this study, the number of chromosomes for all Chinese kale was 2n = 2x = 18, each with two satellites, consistent with previous research [26–31]. However, the distribution of these satellites differed. Earlier studies typically localized most satellites on chromosome 7 [27,29,31]. In the study by Song et al. [26], satellites were found to be located on chromosomes 6 and 7, while Yuan et al. [30] reported their presence on chromosome 9. In contrast, our study, which examined multiple varieties, found satellites on chromosomes 4 to 9. Xia et al. [28] reported that the chromosome types of satellites were all sm, whereas this study revealed the presence of satellites on the m chromosome type in 35.71% of all varieties. Previous studies classified all karyotypes as “2A”. However, we observed that many Chinese kale varieties had a “1A” karyotype, providing a reference for future studies on the karyotype of Chinese kale.
4.2 Karyotype Differences among Four Groups of Chinese Kale
The karyotype formulas of the four groups was primarily composed of multiple m chromosomes and a few sm chromosomes, with some groups having only m chromosomes. In GY, the predominant karyotype formula was 2n = 2x = 18 = 14m + 4sm (2SAT), with no exclusively m chromosomes. In both GY and FY, most chromosomes with satellites were of the sm type. This phenomenon was less pronounced in GW and FW, where only about half of the chromosomes with satellites were sm type. Further investigation is needed to determine if there is a relationship between satellite chromosome type and flower color in Chinese kale.
The average arm ratio of each group of Chinese kale was approximately 1.5, indicating genetic stability. The proportion of chromosomes greater than 2 differed among groups, with FY exhibiting a significantly higher proportion at 45.45% compared to the other three groups. Additionally, the relative length of chromosome 9 in FY was generally the highest among four groups, possibly contributing to its low chromosome length ratio (Fig. 5F,H). GY exhibited higher relative length of the short arm of chromosome 3 and maximum arm ratio compared to other groups (Fig. 5B,G), but significantly lower relative length of the short arm of chromosome 7 and the minimum centromere index (Fig. 5I,J). FW had the lowest relative length of chromosome 2 among the four groups (Fig. 5D). These variations constitute key karyotypic differences among the different Chinese kale groups.
According to studies by Li et al. [32] and Zhang et al. [33], yellow flower color dominance over white flower color in Chinese kale followed single-gene inheritance as a qualitative trait. Li et al. [32] identified genes related to flower color inheritance on the long arm of chromosome 3. Although differences in short arm length and total length for chromosome 3 were observed among groups (Fig. 5), the long arm length of this chromosome did not differ significantly. Therefore, it can be concluded that flower color gene in Chinese kale was genetically stable and rarely mutate.
4.3 Evolution Analysis of Four Groups of Chinese Kale
The asymmetry index is widely recognized as a key indicator for assessing the evolutionary level of plants. In this study, the asymmetry index of the 56 varieties of Chinese kale was low, ranging from 55.16% to 61.93%, indicating that Chinese kale is an ancient plant.
In Fig. 6, there was no correlation between the karyotypes of Chinese kale and the chromosome length ratio, as the chromosome length ratios of all kale varieties were less than 2, consistent with previous studies [26–31]. It can be concluded that the karyotype of Chinese kale is determined by the proportion of arm ratios greater than 2. The stability of the chromosome length ratio in Chinese kale indicated the stability of its chromosomal inheritance.
As observed in Fig. 7, the scatter points representing the four groups of Chinese kale were evenly distributed on the karyotypic evolutionary trend map, with GY appearing to be the most evolved, likely due to subsequent hybridization. GW, however, included several primitive varieties, with GW9 identified as particularly primitive and distinct from the group. Geographically, genetic exchanges between Guangdong and Fujian have likely contributed to frequent genetic exchanges among Chinese kale varieties grown in these regions [34]. In practice, most varieties grown in Guangdong are white-flower Chinese kale, while those in Fujian are yellow-flower Chinese kale [35]. Combined with Fig. 4, GW and FY were located on the left and right sides of the distribution, respectively, while GY and FW were positioned between them. Therefore, it was hypothesized that white-flower Chinese kale originated in Guangdong, yellow-flower Chinese kale originated in Fujian, and GY and FW were hybrids of GW and FY. However, relevant molecular evidence is still lacking, and further research on the evolution of Chinese kale is needed.
In this study, 56 varieties of Chinese kale were karyotyped and categorized into four groups based on their origin and flower color. Karyotype differences among the four groups were analyzed, and the evolutionary history of Chinese kale was speculated. All varieties were diploid with 2n = 2x = 18. In addition to karyotype 2A, type 1A was also identified. This research provides a reference for studying the genetic relationship between Guangdong and Fujian Chinese kale and offers a cytological basis for understanding the evolution, hybridization, and phylogenetic relationships of Chinese kale.
Acknowledgement: None.
Funding Statement: This research was funded by National Natural Science Foundation of China (32372732, 32372683, 32460750, 32072586, 31500247), Sichuan Science and Technology Program (2023ZYD0090, 24NSFSC0404, 2025ZNSFSC1112), Sichuan Innovation Team of National Modern Agricultural Industry Technology System (SCCXTD-2024-05), and, Key Laboratory of Storage of Agricultural Products, Ministry of Agriculture and Rural Aairs (kt202410), and Chengdu Science and Technology Program (2024-YF05-02375-SN).
Author Contributions: The authors confirm contribution to the paper as follows: study conception and design: Bo Sun, Fen Zhang; data collection: Xuena Yu, Kehao Liang, Victor Hugo Escalona; analysis and interpretation of results: Yi Tang, Zhi Huang, Huanxiu Li, Zhifeng Chen; draft manuscript preparation: Sha Luo, Shuang Wu, Junyan Song. All authors reviewed the results and approved the final version of the manuscript.
Availability of Data and Materials: The authors confirm that the data supporting the findings of this study are available within the article.
Ethics Approval: Not applicable.
Conflicts of Interest: The authors declare no conflicts of interest to report regarding the present study.
Supplementary Materials: The supplementary material is available online at https://doi.org/10.32604/phyton.2025.061099.
Abbreviations
| S | The relative length of short arm |
| L | The relative length of long arm |
| L+S | The relative length of chromosome |
| m | Median-centromere chromosome |
| sm | Submedian-centromere chromosome |
| SAT | Satellite |
| Lc/Sc | Ratio of the longest and shortest chromosome |
| MAR | Mean of long-arm length and short-arm length ratio |
| As. K | Index of the karyotypic asymmetry |
References
1. Bansal S, Lakra N, Mishra S, Ahlawat YK. Unraveling the potential of glucosinolates for nutritional enhancement and stress tolerance in Brassica crops. Veg Res. 2024;4:e015. doi:10.48130/vegres-0024-0016. [Google Scholar] [CrossRef]
2. Younis M, Akram NA, Latef AAHA, Ashraf M. Appraisal of improvement in physiological and metabolic processes by exogenously applied natural and synthetic ascorbic acid in okra (Abelmoschus esculentus L.) fruit subjected to water deficit stress. Phyton-Int J Exp Bot. 2023;92(10):2761–84. doi:10.32604/phyton.2023.028801. [Google Scholar] [CrossRef]
3. Zhang CL, Liang QN, Wang YL, Liang S, Huang Z, Li HX, et al. BoaBZR1.1 mediates brassinosteroid-induced carotenoid biosynthesis in Chinese kale. Hort Res. 2024;6(11):uhae104. doi:10.1093/hr/uhae104. [Google Scholar] [PubMed] [CrossRef]
4. Liu HT, Guan PC. Taxonomic relation between yellow-flower Chinese kale and white-flower Chinese kale. J S China Agric Univ. 1997;18(2):13–6. [Google Scholar]
5. Sun B, Fang L, Liu N, Yan HZ, Zhang YJ, Shi QQ, et al. Studies on main nutritional components of Chinese kale among different organs. Acta Hortic Sin. 2011;38(3):541–8. [Google Scholar]
6. Zhang DC. Chinese kale. Chin Veg. 2016;4(11):26. [Google Scholar]
7. Zheng H, Zhang CL, Wang YT, Zhou WT, Chen J, Yan XY, et al. Overexpression of the glucosyltransferase gene BoaUGT74B1 enhances the accumulation of indole glucosinolates in Chinese kale. Sci Hortic. 2021;228:110302. doi:10.1016/j.scienta.2021.110302. [Google Scholar] [CrossRef]
8. Zhou AL, Zhang YT, Li L, Di HM, Bian JL, Ma J, et al. Effects of combined treatment of light quality and melatonin on health-promoting compounds in Chinese kale sprouts. LWT. 2024;199:116137. doi:10.1016/j.lwt.2024.116137. [Google Scholar] [CrossRef]
9. Zhang ZP. Studies on the origin of Brassica alboglabra Bailey. Chin Veg. 2009;14:62–5. [Google Scholar]
10. Wang DM, Chen C, Wang QB, Zhuang M, Liu YM, Yang LM. A molecular evidence supporting Chinese kale origined in China. Chin Veg. 2011;16:15–9. [Google Scholar]
11. Miao HY, Xia CC, Yu SH, Wang JS, Zhao YT, Wang QM. Enhancing health-promoting isothiocyanates in Chinese kale sprouts via manipulating BoESP. Hort Res. 2023;10(4):unhad029. doi:10.1093/hr/uhad029. [Google Scholar] [PubMed] [CrossRef]
12. Zheng H, Wang YT, Li XX, Huang WL, Miao HY, Li HX, et al. A novel putative 2-oxoglutarate-dependent dioxygenase gene (BoaAOP-like) regulates aliphatic glucosinolate biosynthesis in Chinese kale. Sci Hortic. 2022;297(7):110921. doi:10.1016/j.scienta.2022.110921. [Google Scholar] [CrossRef]
13. He ZJ, Lei YT, Gong W, Ye M, Luo XM. Karyotype and phylogenetic relationship analysis of five varieties and cultivars of Zanthoxylum armatum based on oligo-FISH. Genes. 2023;14(7):1459. doi:10.3390/genes14071459. [Google Scholar] [PubMed] [CrossRef]
14. Liu GX, Lan Y, Qu LW, Zhao YL, Xin HY, Xi ML. Analyzing the genetic relationships in Tulipa based on karyotypes and 5S rDNA sequences. Sci Hortic. 2022;302(12):111178. doi:10.1016/j.scienta.2022.111178. [Google Scholar] [CrossRef]
15. Wang Y, Li XO, Feng Y, Wang J, Zhang J, Liu ZS, et al. Autotetraploid origin of Chinese cherry revealed by chromosomal karyotype and in Situ hybridization of seedling progenies. Plants. 2023;12(17):3116. doi:10.3390/plants12173116. [Google Scholar] [PubMed] [CrossRef]
16. Zhong Y, Du MJ, Ji RZ, Cheng FY. Cytological origination of the first found allotriploid tree peony, Paeonia × lemoinei ‘Oukan’ (AABreveled by molecular karyotype comparation. Sci Hortic. 2024;324(2):112563. doi:10.1016/j.scienta.2023.112563. [Google Scholar] [CrossRef]
17. Chen RY, An ZP, Song WQ, Li XL, Su JY, Zheng JY. A study of the high-resolution G-baning technique of plant chromosomes. J Integr Plant Biol. 1987;29(4):341–6. [Google Scholar]
18. Mousavizadeh SJ, Hassandokht MR, Kashi A. Karyotype analysis in diploid and polyploid species of Iranian wild asparagus. Acta Hortic. 2021;1315(14):149–52. doi:10.17660/actahortic.2021.1315.22. [Google Scholar] [CrossRef]
19. Wang Y, Du HM, Zhang J, Wang Y, Du HM, Zhang J, et al. Ploidy level of Chinese cherry (Cerasus pseudocerasus Lindl.) and comparative study on karyotypes with four Cerasus species. Sci Hortic. 2018;232(6):46–51. doi:10.1016/j.scienta.2017.12.065. [Google Scholar] [CrossRef]
20. Xia X, Gu JH, Liu D, Wu YM, Tian YX, Chen Q, et al. Optimization of chromosome preparation and karyotype analysis of yellow-flower Chinese kale. J Zhejiang A&F Univ. 2016;42(5):527–34. [Google Scholar]
21. Li MX, Chen RY. A suggestion on the standardization of karyotype analysis in plants. J Wuhan Bot Res. 1985;3(4):297–302. [Google Scholar]
22. Levan A, Fregga K, Sandlberg AA. Nomenclature for centromeric position on chromosomes. Hereditas. 1964;52(2):201–20. doi:10.1111/j.1601-5223.1964.tb01953.x. [Google Scholar] [CrossRef]
23. Arano H. The karyotypes and the speciations in subfamily Carduoideae (Compositae) of Japan. J Jap Bot. 1965;19(3):31–67. [Google Scholar]
24. Stebbins GL. Chromosomal evolution in higher plants. England: Edward Arnold Ltd.; 1971. p. 87–9. [Google Scholar]
25. Su B, Di HM, Zhang JQ, Xia PX, Huang WL, Jian Y. Effect of light on sensory quality, health-promoting phytochemicals and antioxidant capacity in post-harvest baby mustard. Food Chem. 2021;339(6):128057. doi:10.1016/j.foodchem.2020.128057. [Google Scholar] [PubMed] [CrossRef]
26. Song JJ, Zhuang DH, Shao SM. Karyotype analysis of some species of Brassica vegetables grown in Chaozhou-Shantou area. J Shantou Univ. 2001;16(1):61–7. [Google Scholar]
27. Wang XH, Luo P. Studies on the karyotypes and C-Banding banding patterns of Chinese kale (Brassica alboglabra) and cabbage (B. oleracea var. capitata). J Integr Plant Biol. 1987;29(2):149–55. [Google Scholar]
28. Xia X, Tian YX, Wang ZQ, Liu YX, Zhang F, Sun B. Study on the classification of Chinese kale based on karyotype analysis. Mol Plant Breed. 2019;17(7):2291–6. [Google Scholar]
29. Xiao L, Xiao YP, Luo P. Chromosome study on two species of Brassica. Acta Bot Boreal-Occid Sin. 1995;15(2):142–8. [Google Scholar]
30. Yuan WH, Wang XE, Liu JM, Zhang CH, Shen SX. Karyotype analysis and comparison of Brassica vegetables. J Hebei Agric Univ. 2008;31(2):27–30. [Google Scholar]
31. Zhang SN, Zhang HM, Zheng JS, Kong YE, Wang JJ. Karyotype analysis and comparison of cole crops. Chin Veg. 2011;2:30–5. [Google Scholar]
32. Li GH, Wang TT, Xu XM, Zhang Y, Li TY, Chen HC. Study on the genetic pattern and gene localization of kale flower color. Acta Hort Sin. 2017;44(S1):2556. [Google Scholar]
33. Zhang DS, Xin XY, Zhang FL, Yu YJ, Zhao XY, Yu SC, et al. Studies on color and wax heredity in Chinese kale and selective breeding of ‘Jingzi No. 2’. Chin Veg. 2021;5:53–7. [Google Scholar]
34. Zhou Y, Li Y, Sun B, Shi Y, Wang QM, Wang BL. Taxonomic relationship between Chinese kale and other varieties in Brassica oleracea L. Acta Hort Sin. 2010;37(7):1161–8. [Google Scholar]
35. He CK. On the taxonomy of kale. In: Zhang SL, Chen KS, editors. Advances in horticulture. China: Agriculture Press; 1994. p. 155–9. [Google Scholar]
Cite This Article
 Copyright © 2025 The Author(s). Published by Tech Science Press.
This work is licensed under a Creative Commons Attribution 4.0 International License , which permits unrestricted use, distribution, and reproduction in any medium, provided the original work is properly cited.
 Downloads
 Citation Tools