
 Submit a Paper
 Propose a Special lssue
 Open Access
ARTICLE

Coupling Multi-Source Satellite Remote Sensing and Meteorological Data to Discriminate Yellow Rust and Fusarium Head Blight in Winter Wheat
1 School of Automation, Hangzhou Dianzi University, Hangzhou, 310018, China
2 Key Laboratory of Digital Earth Science, Aerospace Information Research Institute, Chinese Academy of Sciences, Beijing, 100094, China
3 Key Laboratory of Earth Observation of Hainan Province, Hainan Research Institute, Aerospace Information Research Institute, Chinese Academy of Sciences, Sanya, 572029, China
* Corresponding Author: Huiqin Ma. Email:
Phyton-International Journal of Experimental Botany 2025, 94(2), 421-440. https://doi.org/10.32604/phyton.2025.060152
Received 25 October 2024; Accepted 16 January 2025; Issue published 06 March 2025
 View Full Text
 Download PDF
Abstract
Yellow rust (Puccinia striiformis f. sp. Tritici, YR) and fusarium head blight (Fusarium graminearum, FHB) are the two main diseases affecting wheat in the main grain-producing areas of East China, which is common for the two diseases to appear simultaneously in some main production areas. It is necessary to discriminate wheat YR and FHB at the regional scale to accurately locate the disease in space, conduct detailed disease severity monitoring, and scientific control. Four images on different dates were acquired from Sentinel-2, Landsat-8, and Gaofen-1 during the critical period of winter wheat, and 22 remote sensing features that characterize the wheat growth status were then calculated. Meanwhile, 6 meteorological parameters that reflect the wheat phenological information were also obtained by combining the site meteorological data and spatial interpolation technology. Then, the principal components (PCs) of comprehensive remote sensing and meteorological features were extracted with principal component analysis (PCA). The PCs-based discrimination models were established to map YR and FHB damage using the random forest (RF) and backpropagation neural network (BPNN). The models’ performance was verified based on the disease field truth data (57 plots during the filling period) and 5-fold cross-validation. The results revealed that the PCs obtained after PCA dimensionality reduction outperformed the initial features (IFs) from remote sensing and meteorology in discriminating between the two diseases. Compared to the IFs, the average area under the curve for both micro-average and macro-average ROC curves increased by 0.07 in the PCs-based RF models and increased by 0.16 and 0.13, respectively, in the PCs-based BPNN models. Notably, the PCs-based BPNN discrimination model emerged as the most effective, achieving an overall accuracy of 83.9%. Our proposed discrimination model for wheat YR and FHB, coupled with multi-source remote sensing images and meteorological data, overcomes the limitations of a single-sensor and single-phase remote sensing information in multiple stress discrimination in cloudy and rainy areas. It performs well in revealing the damage spatial distribution of the two diseases at a regional scale, providing a basis for detailed disease severity monitoring, and scientific prevention and control.Keywords
Wheat is considered to be one of the primary food crops in China, thus, ensuring wheat production safety is of great significance to ensure national food security. Moreover, pests and diseases are crucial factors limiting the high yield and satisfactory quality of wheat [1]. Yellow rust (YR), caused by Puccinia striiformis f. sp. tritici (Pst), is a destructive winter wheat disease. In recent years, its presence has declined as a result of climate change, wheat planting replacement, and variety adjustment in China. It has been substantially present only in individual years (such as 2017) [1,2]. Furthermore, Fusarium head blight (FHB) is another major winter wheat disease, caused by Fusarium graminearum. Recently, its presence has demonstrated a trend of westward movement and northward expansion, while the actual yield loss caused by FHB is the largest among wheat diseases [1,3]. On the 15th of September 2020, the Chinese Ministry of Agriculture and Rural Affairs listed YR and FHB wheat as “class-I crop diseases and pests” [4]. In the main wheat-producing areas of East China, these two diseases often coincide, threatening food production and safety [5]. Effective identification of wheat YR and FHB at a regional scale can accurately locate the diseases in space, provide a basis for refined monitoring of their severity and scientific control, and help improve pesticide efficiency to reduce pesticide costs and use.
In instances of large-scale crop pest and disease monitoring and discrimination, multispectral satellite remote sensing imaging plays an important role [6]. In a specific disease scenario with expert prior knowledge, the use of single-date imagery to extract remote sensing features that can effectively characterize the host growth status after disease infection has been proven to be a reliable means of regional crop disease monitoring [7,8]. However, for complex farmland scenes where multiple pests and diseases coexist, if we only focus on one critical period, different stresses may cause similar symptoms in the host crop during the same period, resulting in spectral response confusion that makes it difficult for the single-date images to play a role. If the full growth period of the host crop was focused, it can be found that the infection, occurrence, and spread of different diseases over time are often unique. Based on this, some scholars have successfully carried out regional crop disease monitoring and multi-stress discrimination using multi-temporal imagery acquired from the same satellite sensor [9,10]. Although these studies have demonstrated the potential of multi-source and multi-temporal satellite images in regional crop multi-stress identification, certain application obstacles remain in cloudy and rainy areas. For grain-producing regions such as East China and South China, cloudy and rainy weather is frequent during the crop growing season [11], and it isn’t easy to obtain high-quality time series images relying on single-source satellites. Therefore, it is important to couple multi-source satellites, leveraging each satellite sensor’s advantages regarding their varying transit dates and transit cycles. This can form time interleaving and complementarity to a certain extent to obtain high-quality multi-temporal satellite images without cloud interference in rainy areas and provide data support for the construction of regional crop disease discrimination models.
It is well known that in addition to the differences in the host growth status caused by disease infection, meteorological conditions are also the key factors affecting the occurrence and development of diseases. For instance, the temperature is the most important factor affecting the occurrence and prevalence of wheat YR, while precipitation and relative humidity during the wheat flowering period are highly positively correlated with the amount of FHB pathogen [12,13]. For instance, Ruan et al. found that the prediction accuracy of the regional wheat YR prediction model, which integrates time-series remote sensing and meteorological information, can reach 88.7%, representing a 17.6% improvement over the model based on a single-date remote sensing feature [14]. Xiao et al. input remote sensing and meteorological information into the disease epidemic dynamics model SERI and achieved a high-precision prediction of the progress of the wheat FHB epidemic (with an R2 of 0.804) [15]. These studies revealed that coupling remote sensing with meteorological information can effectively improve the performance of crop disease monitoring and reporting models.
In conclusion, coupling multi-source and multi-temporal remote sensing information with meteorological data may demonstrate an effective strategy for the crop’s various stress discrimination in cloudy and rainy regions. The present article focuses on the feasibility evaluation of multi-source information concerning the discrimination of YR and FHB wheat on the regional level. The objectives are as follows: (1) determine the principal components (PCs) for YR and FHB wheat discrimination using PCA method based on initial features (IFs) calculated from multi-source satellite remote sensing imagery and meteorological data; (2) evaluate the performance of coupled used of multi-source satellite remote sensing and meteorological data in YR and FHB wheat discrimination; and lastly (3) map wheat damage at the regional level with regards to the PC-based discrimination models.
The primary aim of this study is to explore the feasibility of multi-source satellite imagery for YR and FHB wheat discrimination in clouded and rainy regions. Fig. 1 provides an overview of the main methodological framework. Firstly, to resolve the issue of insufficient imagery by a single sensor due to the weather in the study area, four images of different sensors with different dates were acquired. Furthermore, three types of common remotely sensed features were extracted, including crop growth characteristics, habitat parameters, and red-edge indices. Secondly, six meteorological parameters closely connected to crop diseases were calculated and palatalized. To reduce the redundancy between these initial features (IFs) and retain valid information, the principal components (PCs) were calculated concerning the IFs, using the principal component analysis (PCA) method. In addition, the determined PCs were used in the establishment of a discrimination model, through the commonly used random forest (RF) and back propagation neural network (BPNN) methods. For both comparison and evaluation, the IFs were used as well. Finally, the YR and FHB damages were mapped out by using the discrimination models.
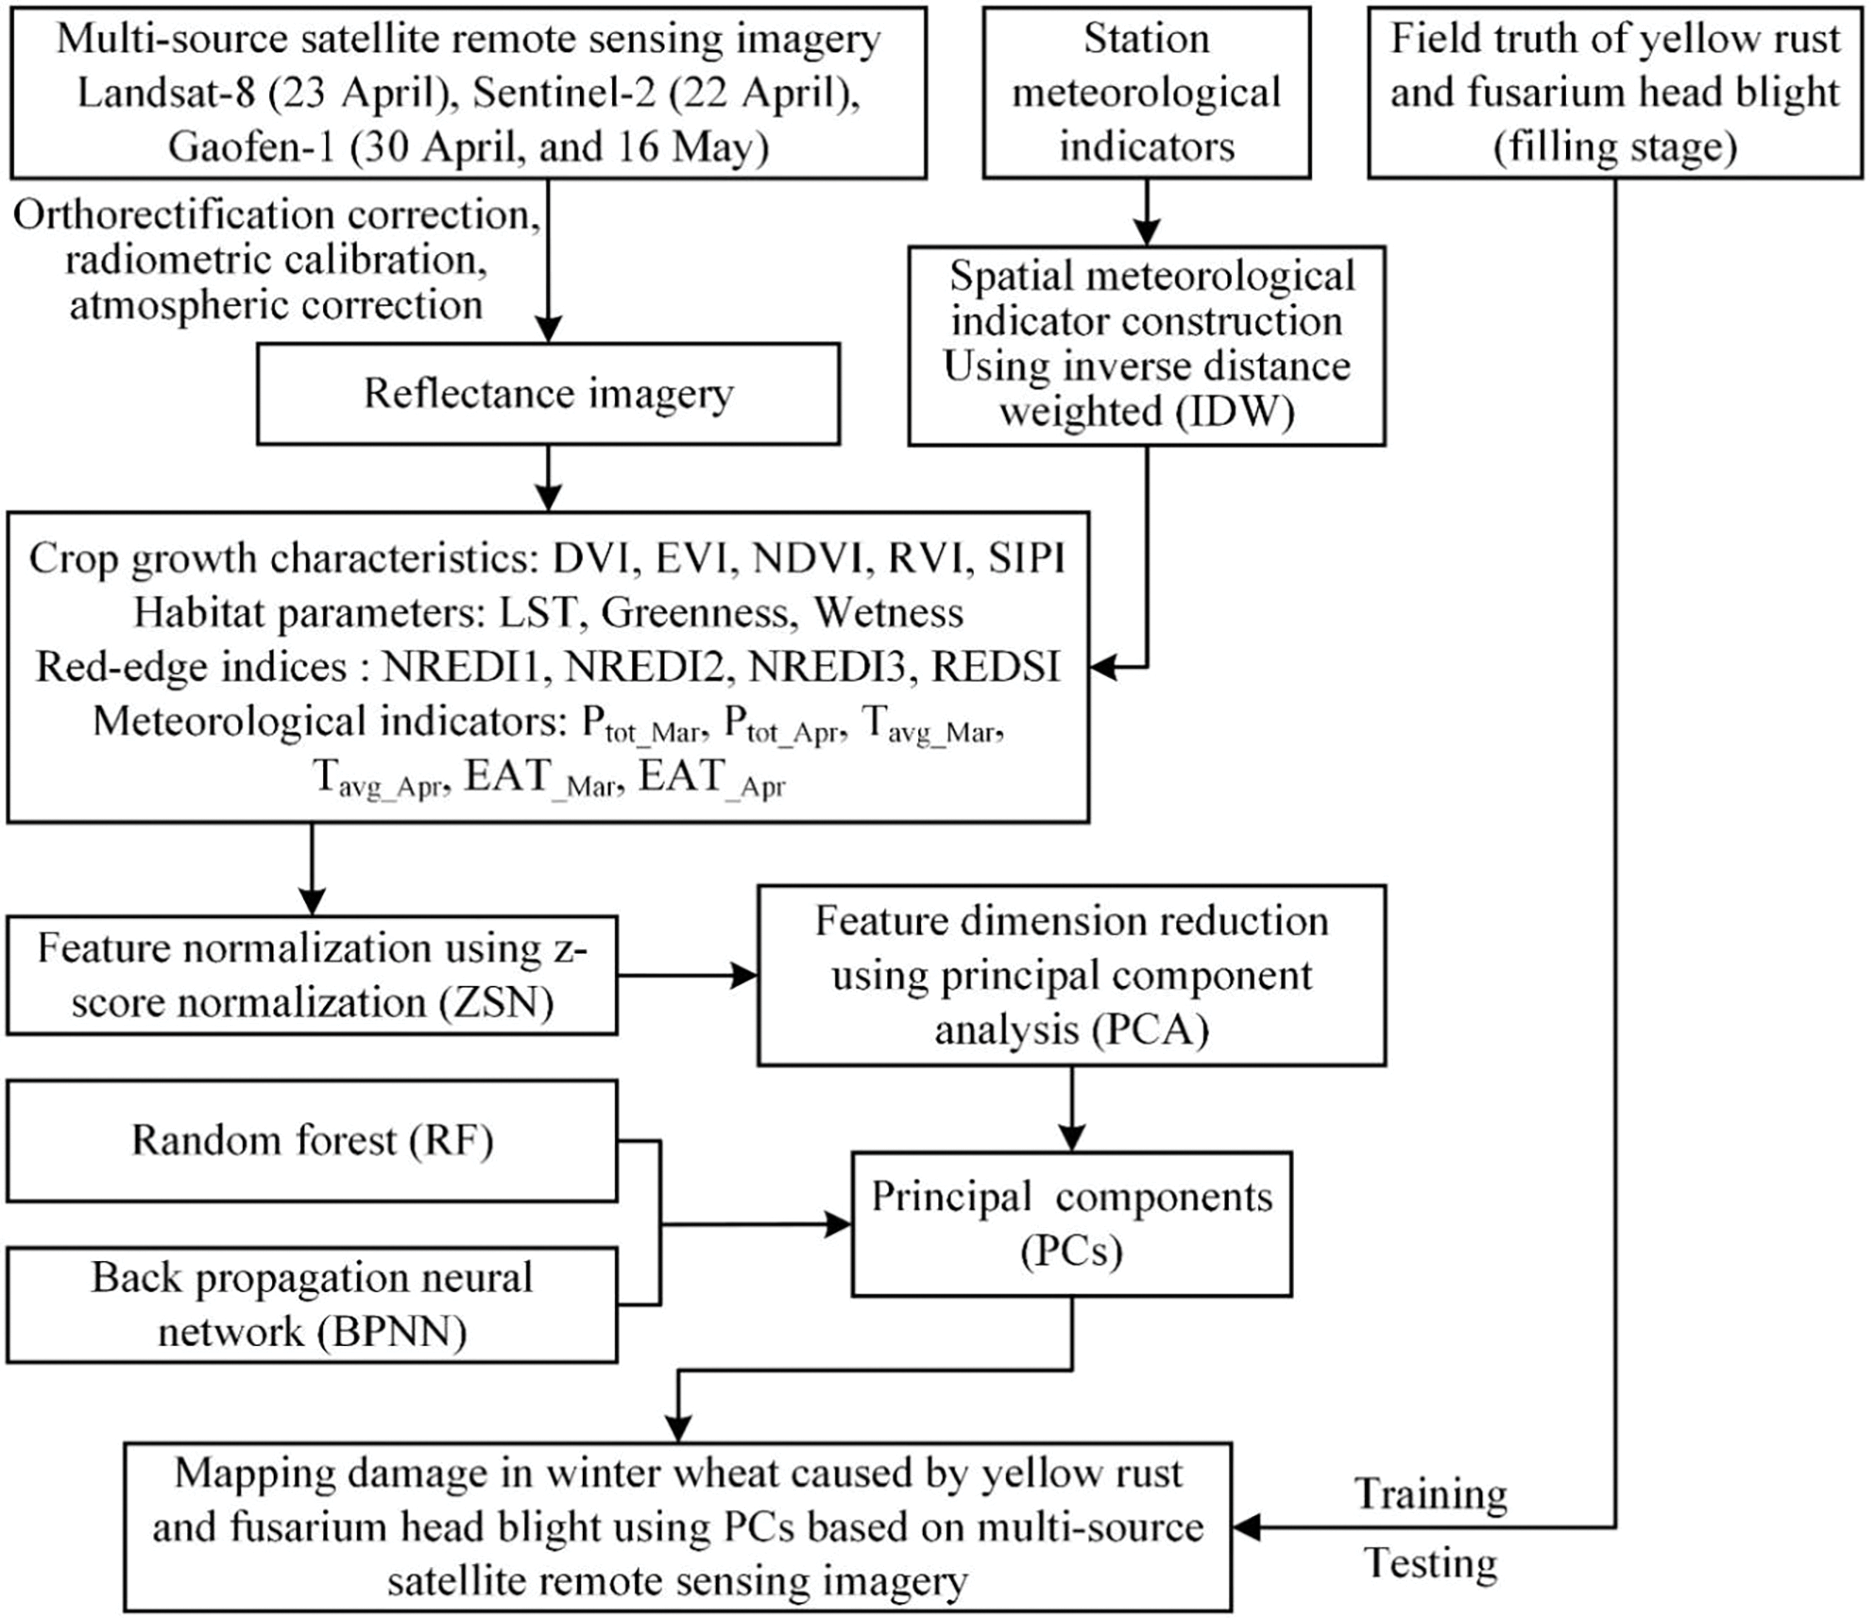
Figure 1: Methodological framework of YR and FHB wheat discrimination model
2.1 Study Site and Data Collection
The study site was located in Anhui Province (Fig. 2). The annual average temperature, precipitation, and relative humidity in this area were 15°C, 1000 mm, and 77%, respectively. The presence of low temperatures and high humidity in the wheat fields provides favorable conditions for the occurrence of both YR and FHB. Therefore, wheat in this area is naturally infected with YR and FHB almost every year. During the period of wheat growth, farmers carry out their routine field water and fertilizer management practices.
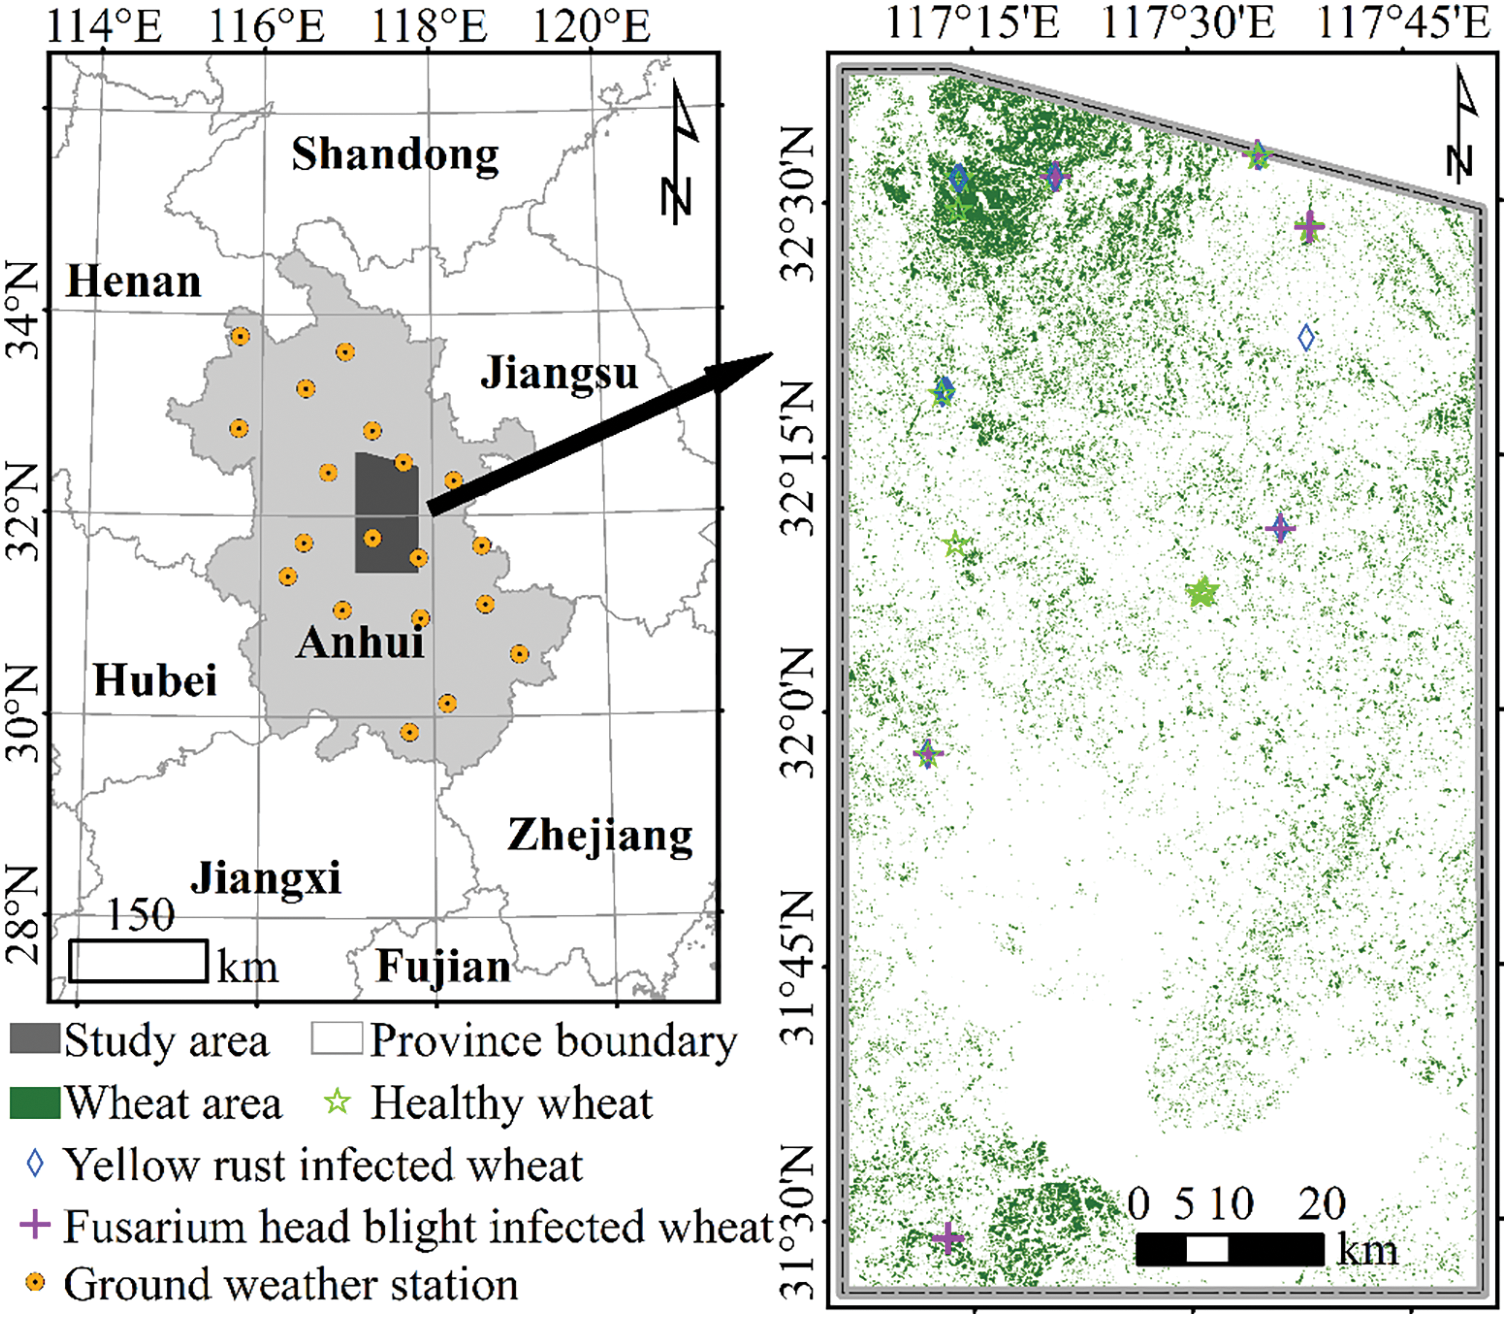
Figure 2: Geographical location of the study area, ground weather stations, spatial distribution of wheat areas and sample points
The field investigation experiment on YR and FHB wheat was conducted in early May 2017 (the wheat grain-filling stage). To match the spatial resolution of Sentinel-2 satellite imagery, the disease infection status of the wheat canopy was surveyed at a 10-m × 10-m plot using a cater-cornered five-point survey. For each plot, the disease type (healthy, YR- and FHB-infected), center longitude, and latitude were recorded. Furthermore, on the plots where YR and FHB wheat occurred simultaneously, the more serious prevails through a visual discrimination method. The disease information from 56 plots was collected, including 24 healthy plots, 18 YR-infected plots, and 14 FHB-infected plots.
On the one hand, similar spectral responses for the same period may be caused by different diseases. On the other hand, the evolution of different diseases over time may vary, leading to confusion when using single-time phase imagery to discriminate between different diseases. Thus, it is necessary to use multi-temporal imagery for disease discrimination [13]. However, due to the frequency of clouded and rainy weather during the wheat growth period in the study area, it was difficult to acquire multi-temporal high-quality imagery under clear and cloudless weather. Furthermore, since different sensors have varying transit times and cycles, the coupling of multi-source and multi-temporal satellite remote sensing image data can both compensate for the lack of information provided by a single data source and aid in capturing the information of specific disease development and change during different periods. Therefore, one Sentinel-2 image on 22 April 2017, one Landsat-8 image on 23 April, and two GF-1 images on 30 April and 16 May were acquired for YR and FHB wheat discrimination. Several preprocessing was first performed for the three types of imagery. These preprocessing include: an atmospheric correction for Sentinel-2 imagery, a radiometric calibration and an atmospheric correction for Landsat-8 imagery, and a geometric correction, a radiometric calibration, and an atmospheric correction for Gaofen-1 imagery. Afterward, the spatial resolutions of all four images were resampled up to 10 m for subsequent analyses.
In addition to crop growth information and habitat conditions, weather conditions such as temperature and precipitation are also closely correlated to crop disease occurrence and development. Thus, the daily meteorological data (including daily average temperature, and daily precipitation) of nineteen weather ground stations from March to April 2017 were used. An inverse distance weight (IDW) interpolation method [14] was employed for spatial interpolation of daily meteorological data to obtain spatially continuous meteorological data with a 10 m spatial resolution.
2.2 Features Extraction and Dimension Reduction for Disease Discrimination
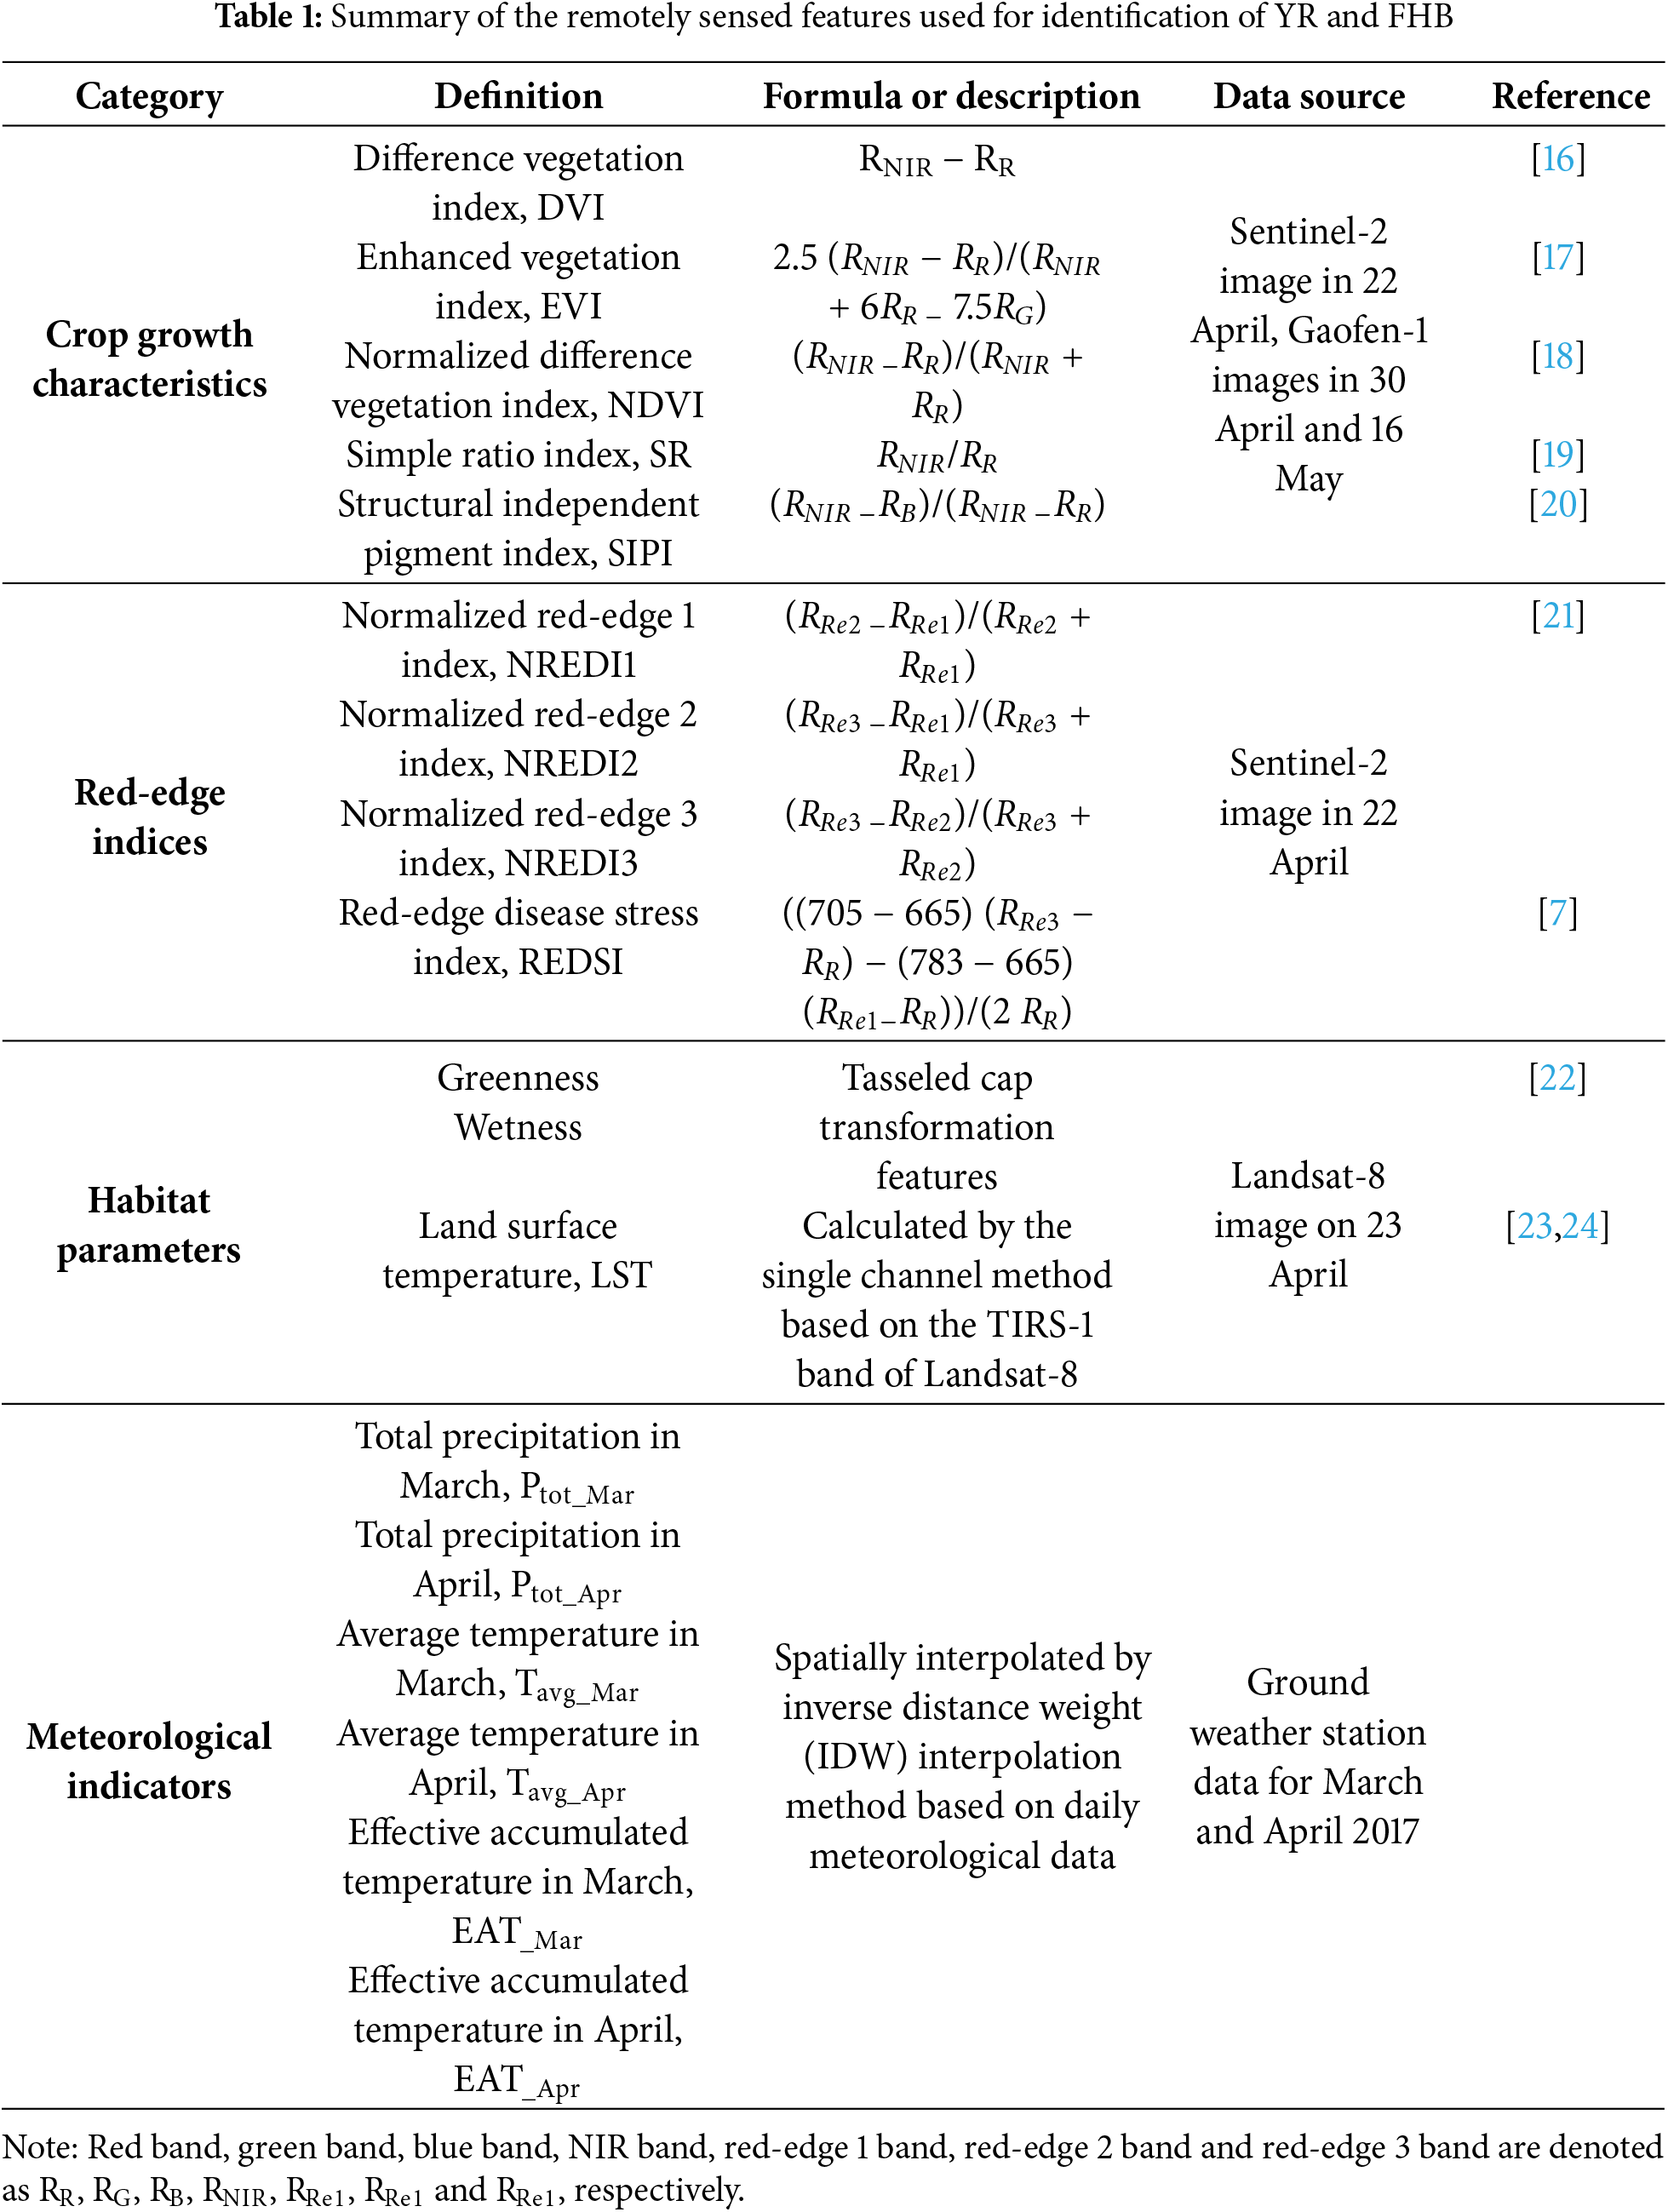
Several remotely sensed features, such as the normalized difference vegetation index (NDVI), difference vegetation index (DVI), simple ratio index (SR), and enhanced vegetation index (EVI), related to crop growth conditions may be employed in wheat FHB monitoring. Furthermore, several red-edge features such as the normalized red-edge indices, and red-edge disease stress index (REDSI) are closely related to YR wheat. In addition, crop habitat and weather conditions are also closely related to disease progression. Thus, five indices related to crop growth, four red-edge indices, three habitat parameters based on multi-source remotely sensed features, and six meteorological indicators based on daily meteorological data were extracted and calculated for discrimination of YR and FHB wheat. Finally, a total of 28 initial features (IFs) from the different dates were extracted. Table 1 summarizes the definition, formula, and data source of each feature.
The possible redundancy between different IFs may negatively affect crop disease discrimination modeling. Therefore, feature dimension reduction is necessary before modeling wheat YR and FHB discrimination. In the present article, as a commonly used dimension reduction tool, the principal component analysis (PCA) algorithm was adopted for IF dimension reduction [25]. The main idea of PCA is to use linear transformation to project the samples in the high-dimensional space to the low-dimensional one while retaining as much of the original information as possible. Multiple feature indicators were simplified into a few comprehensive indicators through PCA. The latter, retains as much information as possible from original indicators, while the components obtained using PCA are independent. The main steps of IF dimension reduction using PCA are as follows:
i. Standardize IFs using the z-score normalization (ZSN) algorithm.
ii. Calculate the correlations between the IFs.
iii. Kaiser-Meyer-Olkin (KMO) measure and Bartlett’s test are adopted to validate the sample adequacy of the principal component analysis (PCA) method dimensionality reduction for IFs. KMO retains values from 0 to 1. The standard KMO metrics are as follows: unacceptable (0 to 0.5), inadequate (0.5 to 0.6), mediocre (0.6 to 0.7), average (0.7 to 0.8), satisfactory (0.8 to 0.9), and excellent (0.9 to 1.0). Additionally, the significant (p-value < 0.05) Bartlett’s test of sphericity should be suitable for PCA.
iv. After the IF dimension reduction, the principal components (PCs) for YR and FHB discrimination are determined. The Kaiser criterion (eigenvalue λ greater than 1) is used for determining the valid component number.
All PCA analyses in this study were implemented in IBM SPSS Statistics 22.0 software.
2.3 YR and FHB Discrimination Model Construction
Two commonly used classification methods, random forest (RF) and back propagation neural network (BPNN), were employed to examine the performance of coupled multi-source information in discriminating YR and FHB wheat.
RF is a powerful machine learning classifier, widely used in agriculture research concerning remote sensing technology [26,27]. The RF method is a collection of untrimmed classification or regression trees created using lead samples of training data and random feature selection in tree induction [28]. The predictions of the RF method are made through aggregated (majority vote or average) prediction sets. Its non-parametric nature, high classification accuracy, and variable importance determination are the primary advantages of RF, while the classifier itself may be considered a black box classifier due to the unknown classification rules [29]. It is reported that the tree number in the forest (ntree), the variable number randomly selected to grow a tree (mtry), and the minimum terminal node number per tree (nodesize) are the three key parameters of RF modeling [30,31]. In general, the code execution time increases linearly with the increase of ntree. The default setting of 1 for nodesize is appropriate owing to the little effect of its change from 1 to 5. The default setting of 1 for mtry is a common choice [32].
BPNN is a multi-layer mapping network, which minimizes reverse errors while transmitting information forward [33]. The BPNN method can realize any complex nonlinear mapping function proved by mathematical theory, and approximate any nonlinear function with satisfactory accuracy [34,35]. As a result of a series of advantages including flexible nonlinear modeling ability, solid adaptability, strong learning ability, and parallel computing ability [33], BPNN is commonly used for crop pest and disease monitoring and classification [36,37]. In previous studies, the BPNN method has been used to discriminate between powdery mildew and aphid of winter wheat. The results have demonstrated the feasibility of the BPNN method in discriminating crop pests and diseases [10]. The three-layer BPNN with only one hidden layer is optimal, while the number of hidden neurons recommended for use is 75% of the total number of input neurons [38,39]. Furthermore, BPNN network training chooses the traingdx algorithm which with the advantages of adjusting the learning rate and incidental momentum automatically, avoiding local minima, and accelerating convergence speed greatly [40].
The IFs and determined PCs were respectively used as the input of RF and BPNN to construct disease discrimination models. A total of four discrimination models (including the IFs-based RF model, PCs-based RF model, IFs-based BPNN model, and PCs-based BPNN model) were constructed. First, k-fold cross-validation [41] (in this study, k = 5) was used for training and validation of the models. For each validation fold, its receiver operator characteristic (ROC) curve and area under the curve (AUC) were used to describe the generalization ability of each model. The modeling method with the optimal ROC and AUC was then chosen for training the final discrimination model through all plot disease specimens. Four precision evaluation parameters, specifically the overall accuracy (OA), user accuracy (UA), producer accuracy (PA), and kappa coefficient were chosen to evaluate the effectiveness of the discrimination model. In which, OA is the ratio of the sum of correctly classified samples of each category (that is, the sum of principal diagonals) to the total number of samples, UA indicates the proportion of the discriminative model resulting in pixels that correctly represent the ground truth, PA indicates the proportion of the ground truth being correctly classified.
3.1 Principal Components (PCs) for YR and FHB Wheat
Fig. 3 illustrates the correlations between different IFs. Many IFs exhibited clear information redundancy. This result demonstrated that IF dimension reduction is necessary before constructing discrimination models. Meanwhile, the results of the KMO measure (with a value of 0.720) and Bartlett’s test (p-value < 0.001) in Table 2 illustrated that the PCA method is suitable for IF dimension reduction. Due to the aforementioned, the PCA method was employed. Fig. 4 illustrates that four PCs were determined for YR and FHB wheat discrimination under the Kaiser criterion and that 86.1% of the information for IFs could be explained by the four PCs.
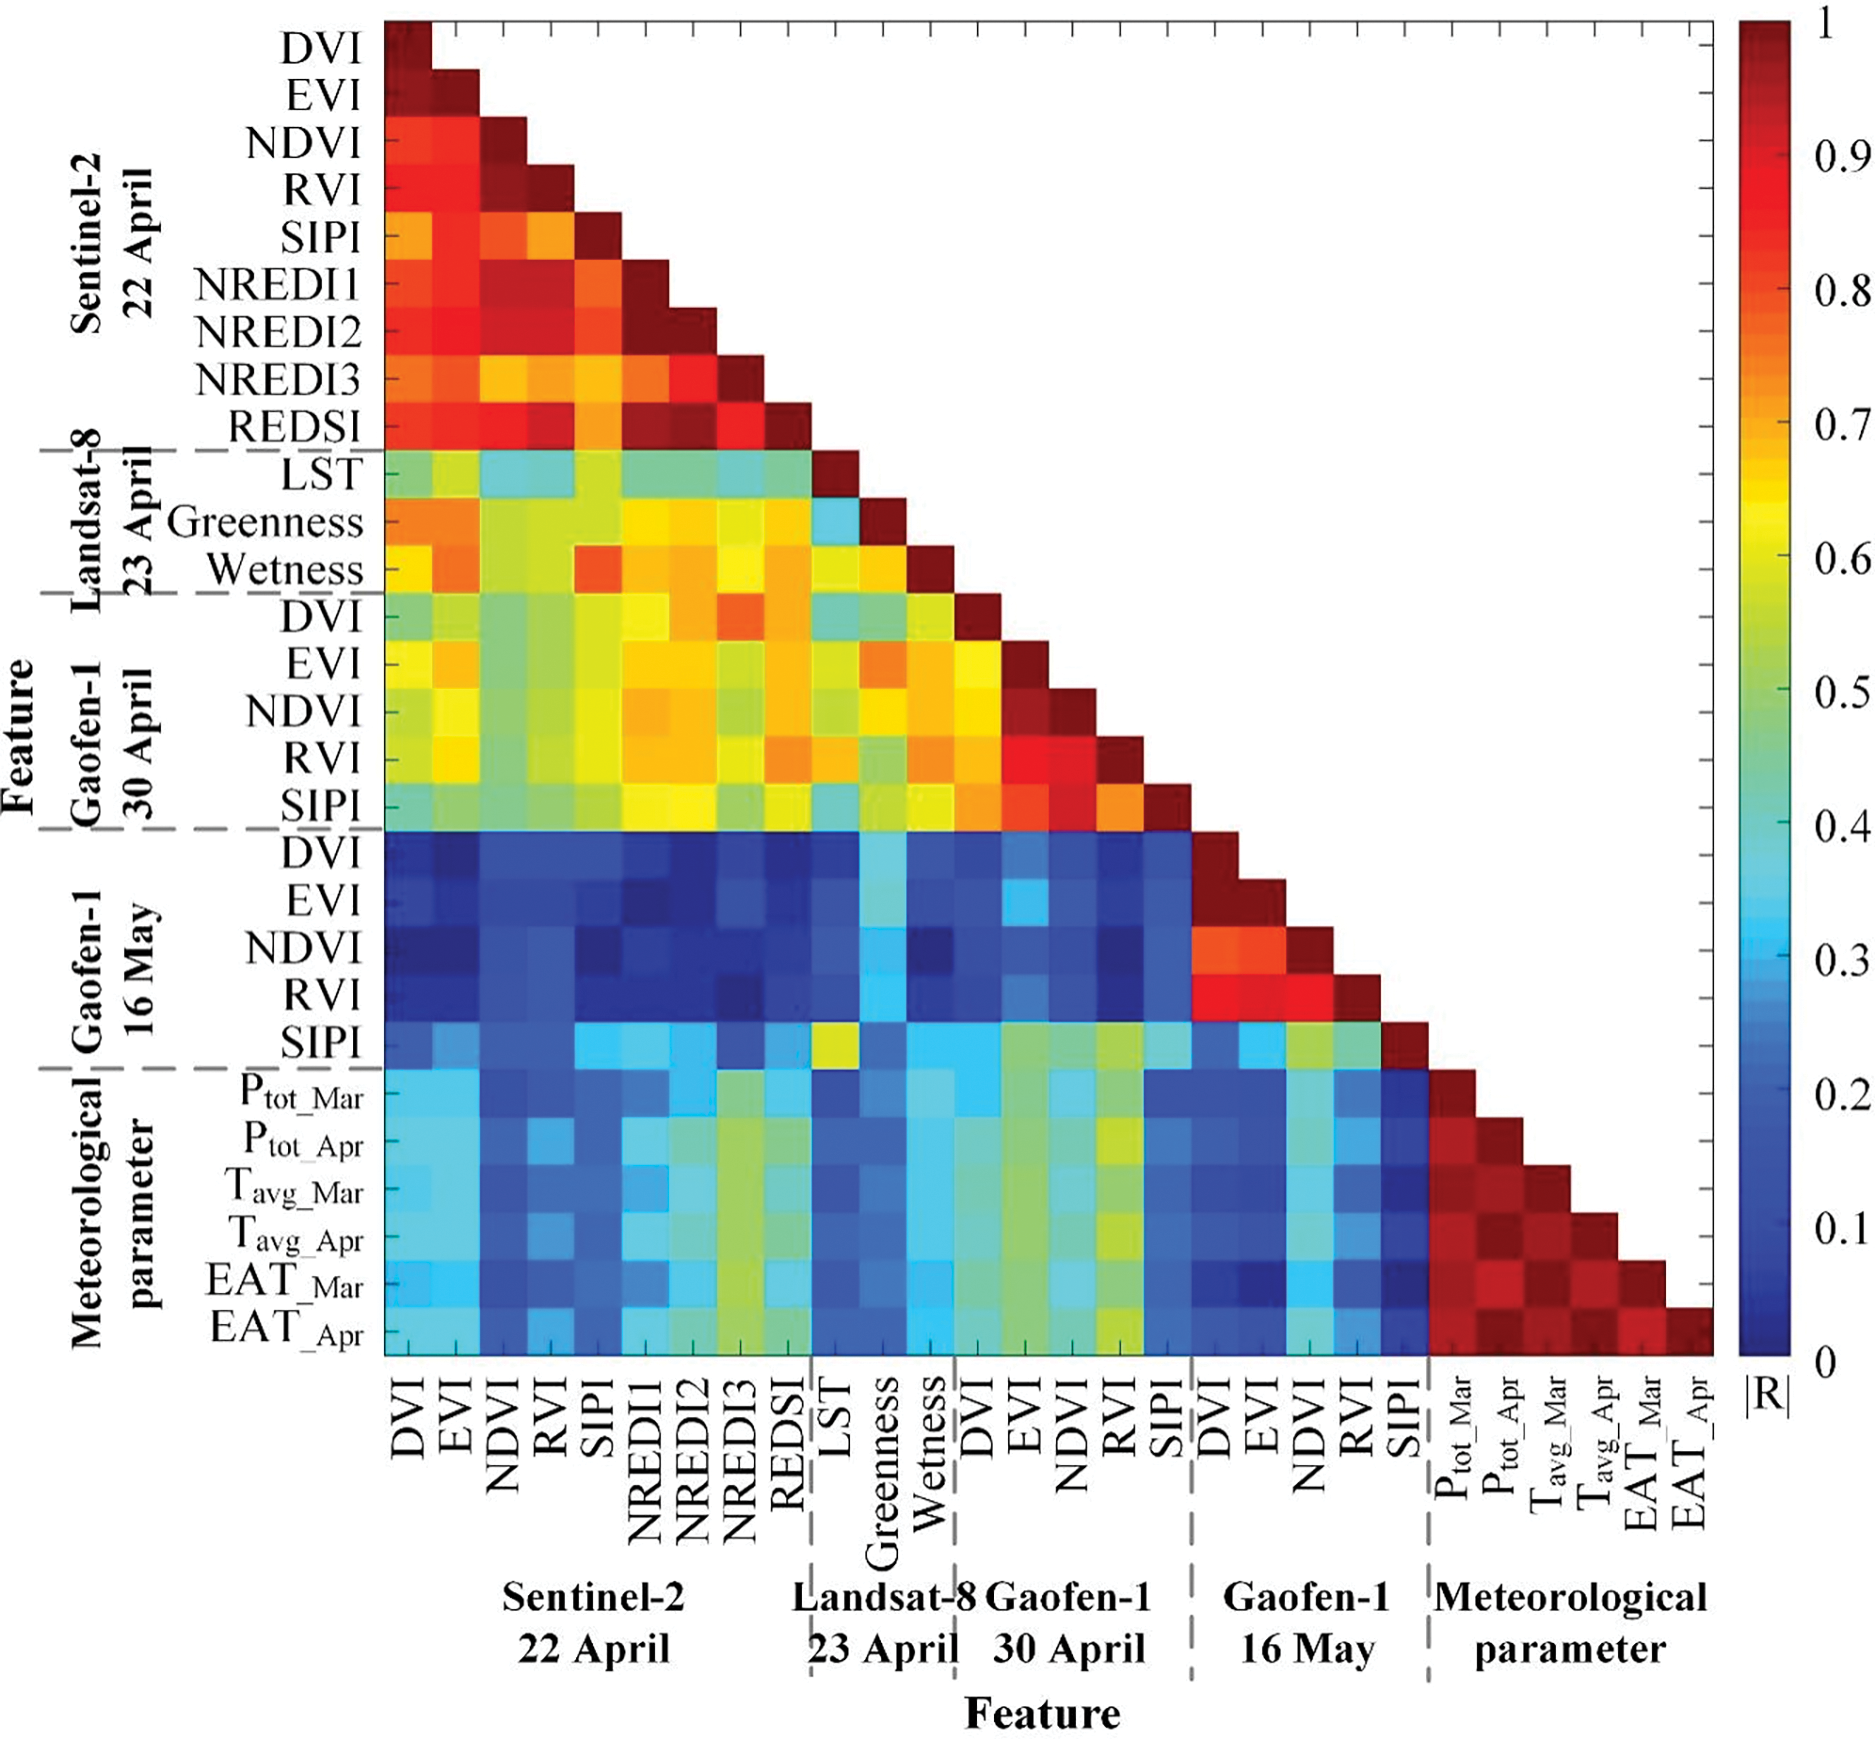
Figure 3: |R| among different IFs
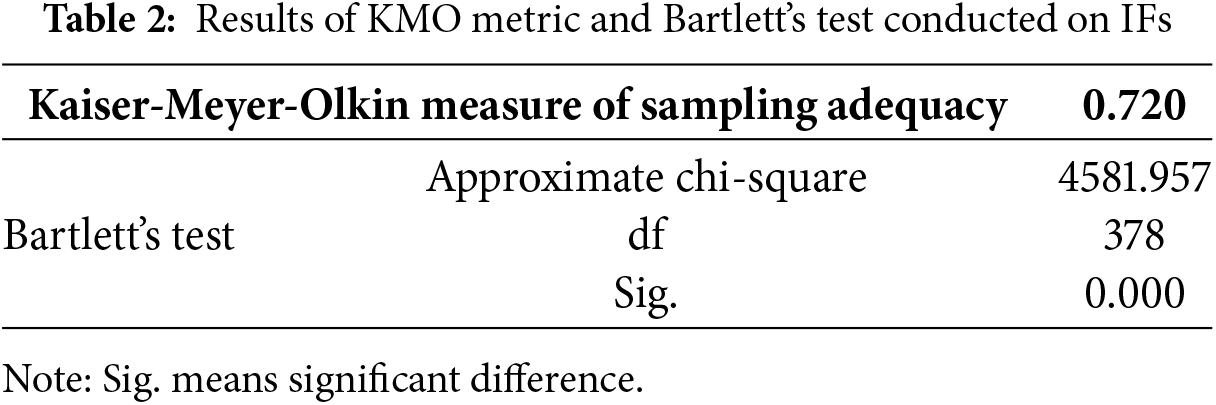
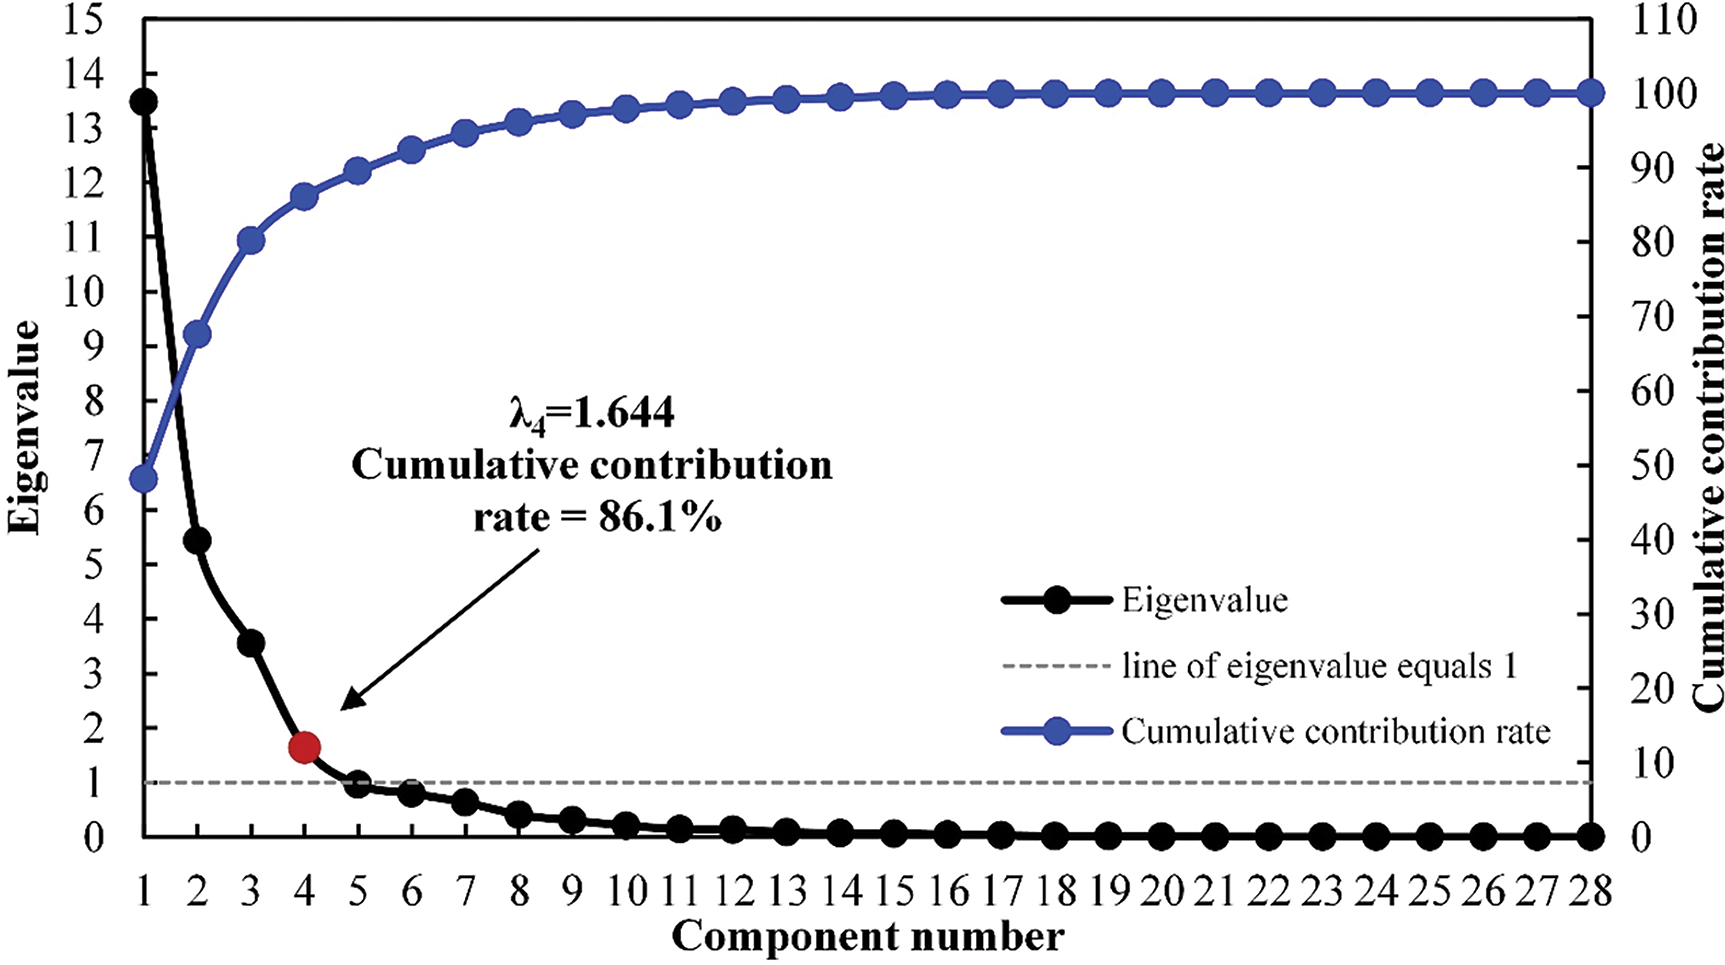
Figure 4: The eigenvalue and cumulative contribution rate of PCs
In addition to the aforementioned, the response differences of PCs to healthy, YR-, and FHB-infected wheat are provided in Fig. 5, plotted using the PC means corresponding to the field truth samples of the three disease categories. All four PCs display distinct responses across the three wheat infection states. Firstly, for PC1, the difference between the YR-infected category and the other two categories was evident, but almost no difference between the PC’s means of the healthy and FHB-infected categories. Similarly, for PC2, the difference between the FHB-infected category and the other two categories was evident, but almost no difference between the PC’s means of the healthy and YR-infected categories. Furthermore, for PC4, there were clear differences among the three categories. Nevertheless, although there was a certain difference between the healthy category and the two diseased categories for PC3, there was no difference between the PC’s means corresponding to the two disease-infected categories, and the overall difference between the three categories was not obvious. These results show that different PCs may reflect distinct aspects of the initial remote sensing and meteorological features, and thus be sensitive to varied disease types. Therefore, combining the four PCs to construct a disease discrimination model is necessary.
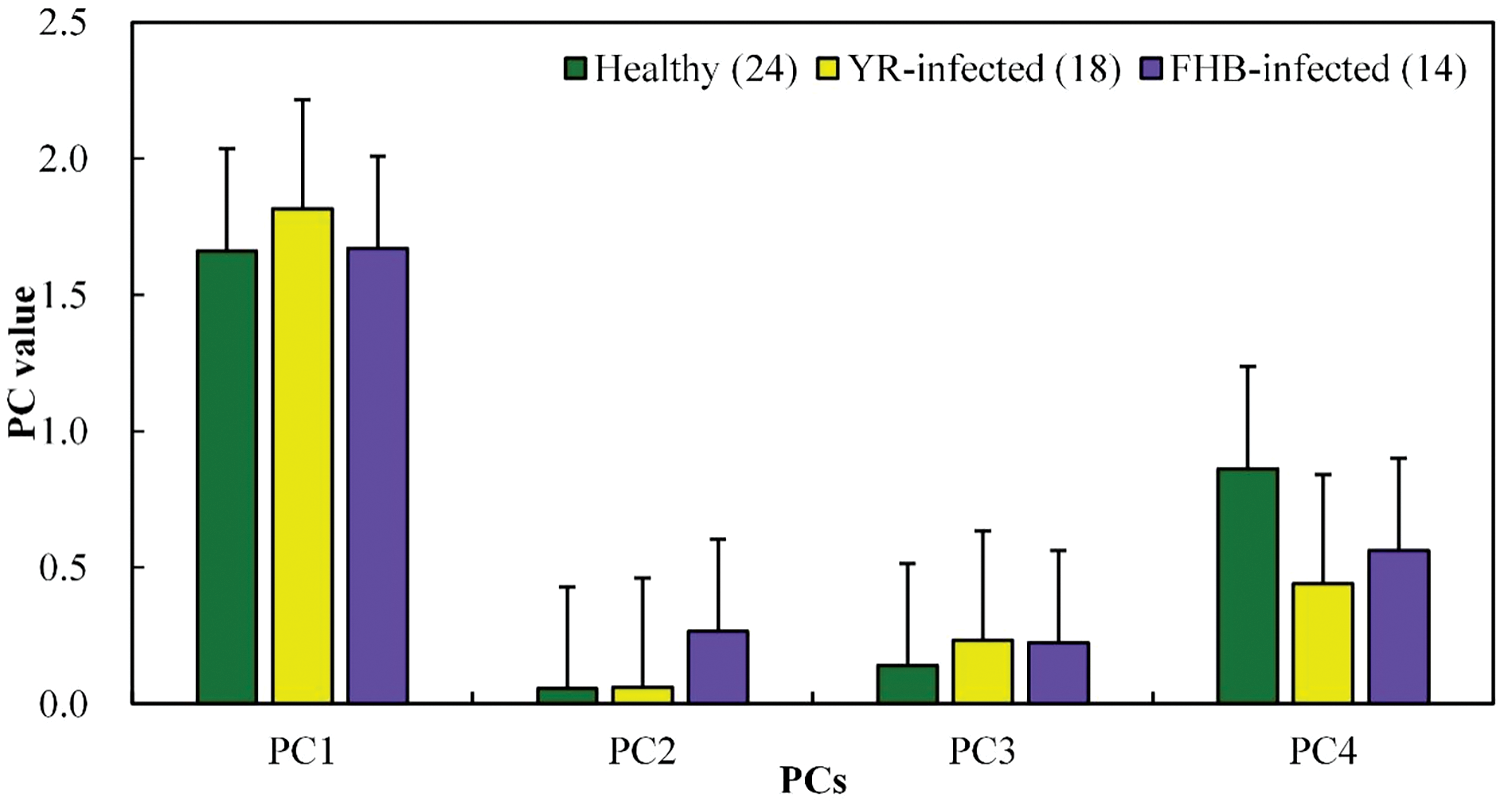
Figure 5: Response of the selected PCs to YR and FHB
3.2 Evaluation of YR and FHB Wheat Discrimination Models
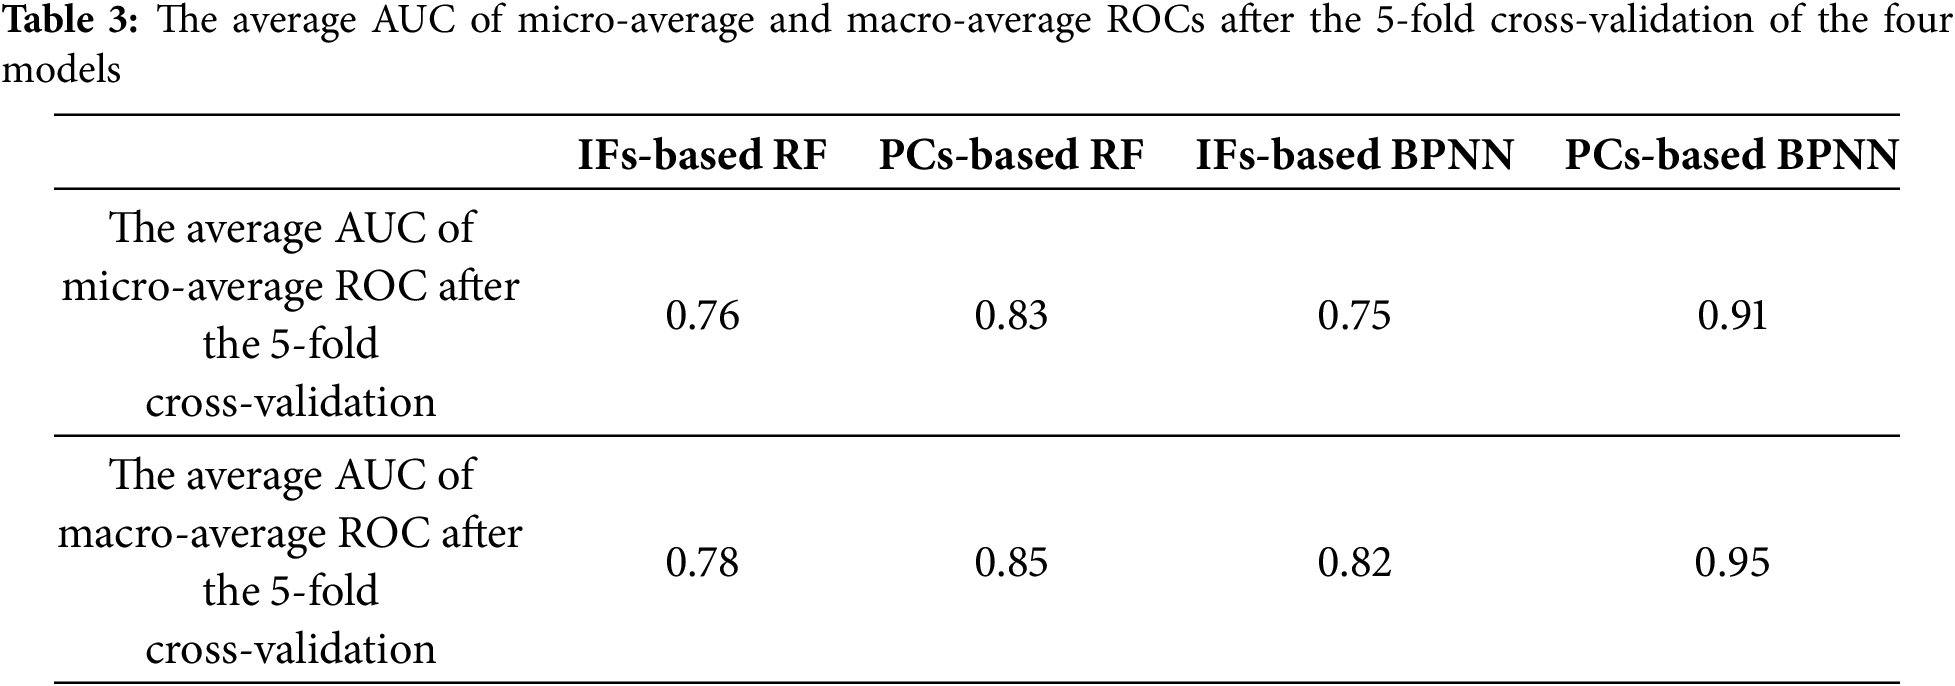
Discrimination models applying the RF and BPNN classifier to PCs were constructed to evaluate the feasibility of discriminating YR and FHB wheat using multi-source data. For comparison, the IFs were also used to build the discrimination models. Fig. 6 and Table 3 respectively show the ROC curves of the 5-fold cross-validation of the four distinguishing models and the corresponding average AUC of each model. The PC-based BPNN discrimination model is the most stable among the four models. The 5-fold cross-validation of the PC-based BPNN model has the highest average AUC, and its AUCs based on micro-average and macro-average ROCs reached 0.91 and 0.95, respectively. Moreover, the two PCs-based models outperformed the two IFs-based models. Compared to the IFs-based RF model, the PCs-based RF model saw improvements of 0.07 in its AUCs based on both micro-averaged and macro-averaged ROCs. Similarly, the PCs-based BPNN model outperformed the BPNN model based on IFs, with enhancements of 0.16 and 0.13 in its AUCs based on both micro-averaged and macro-averaged ROC, respectively.
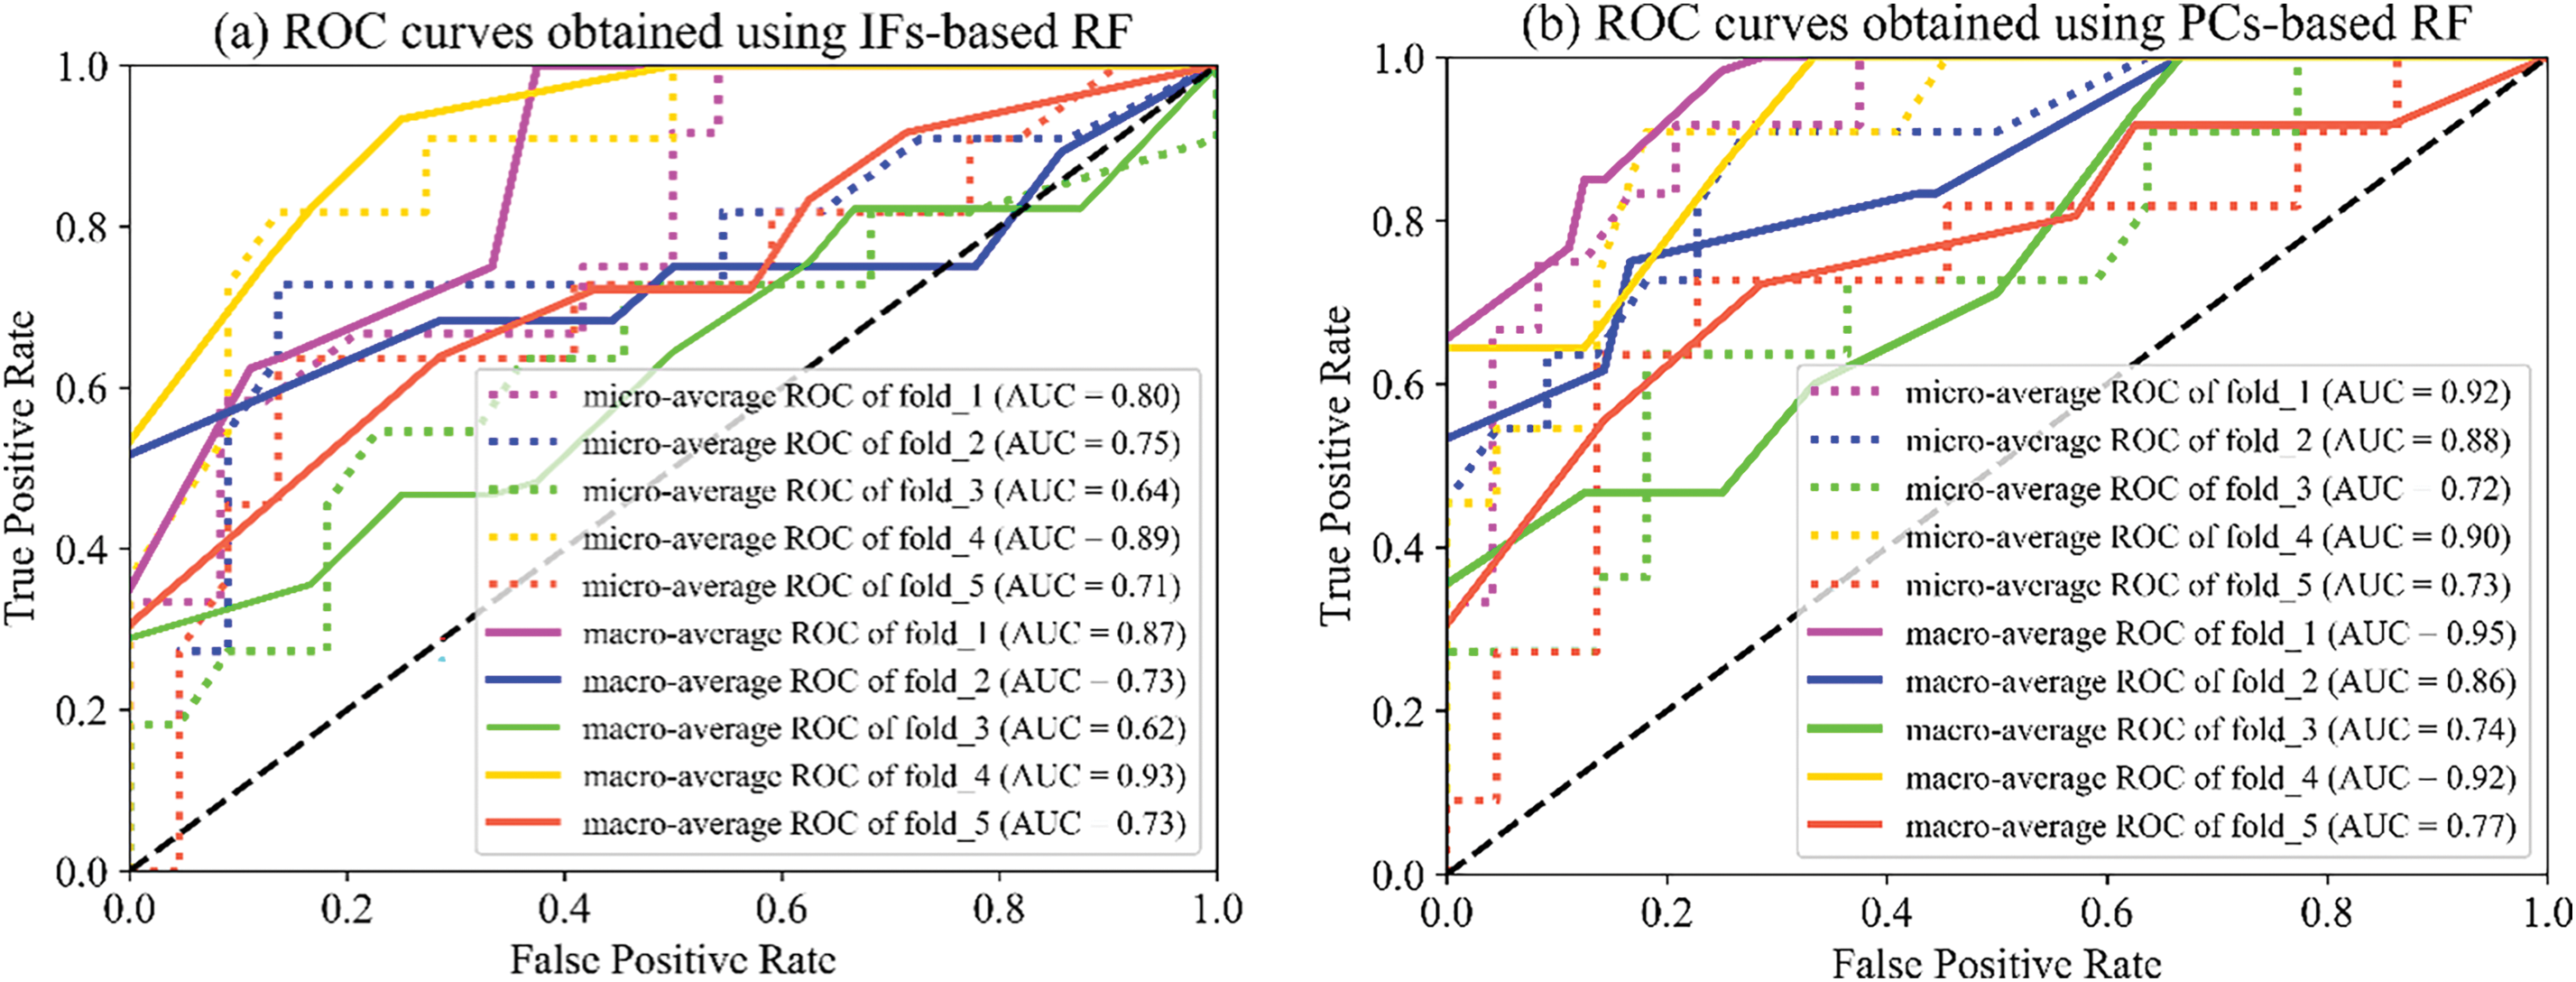
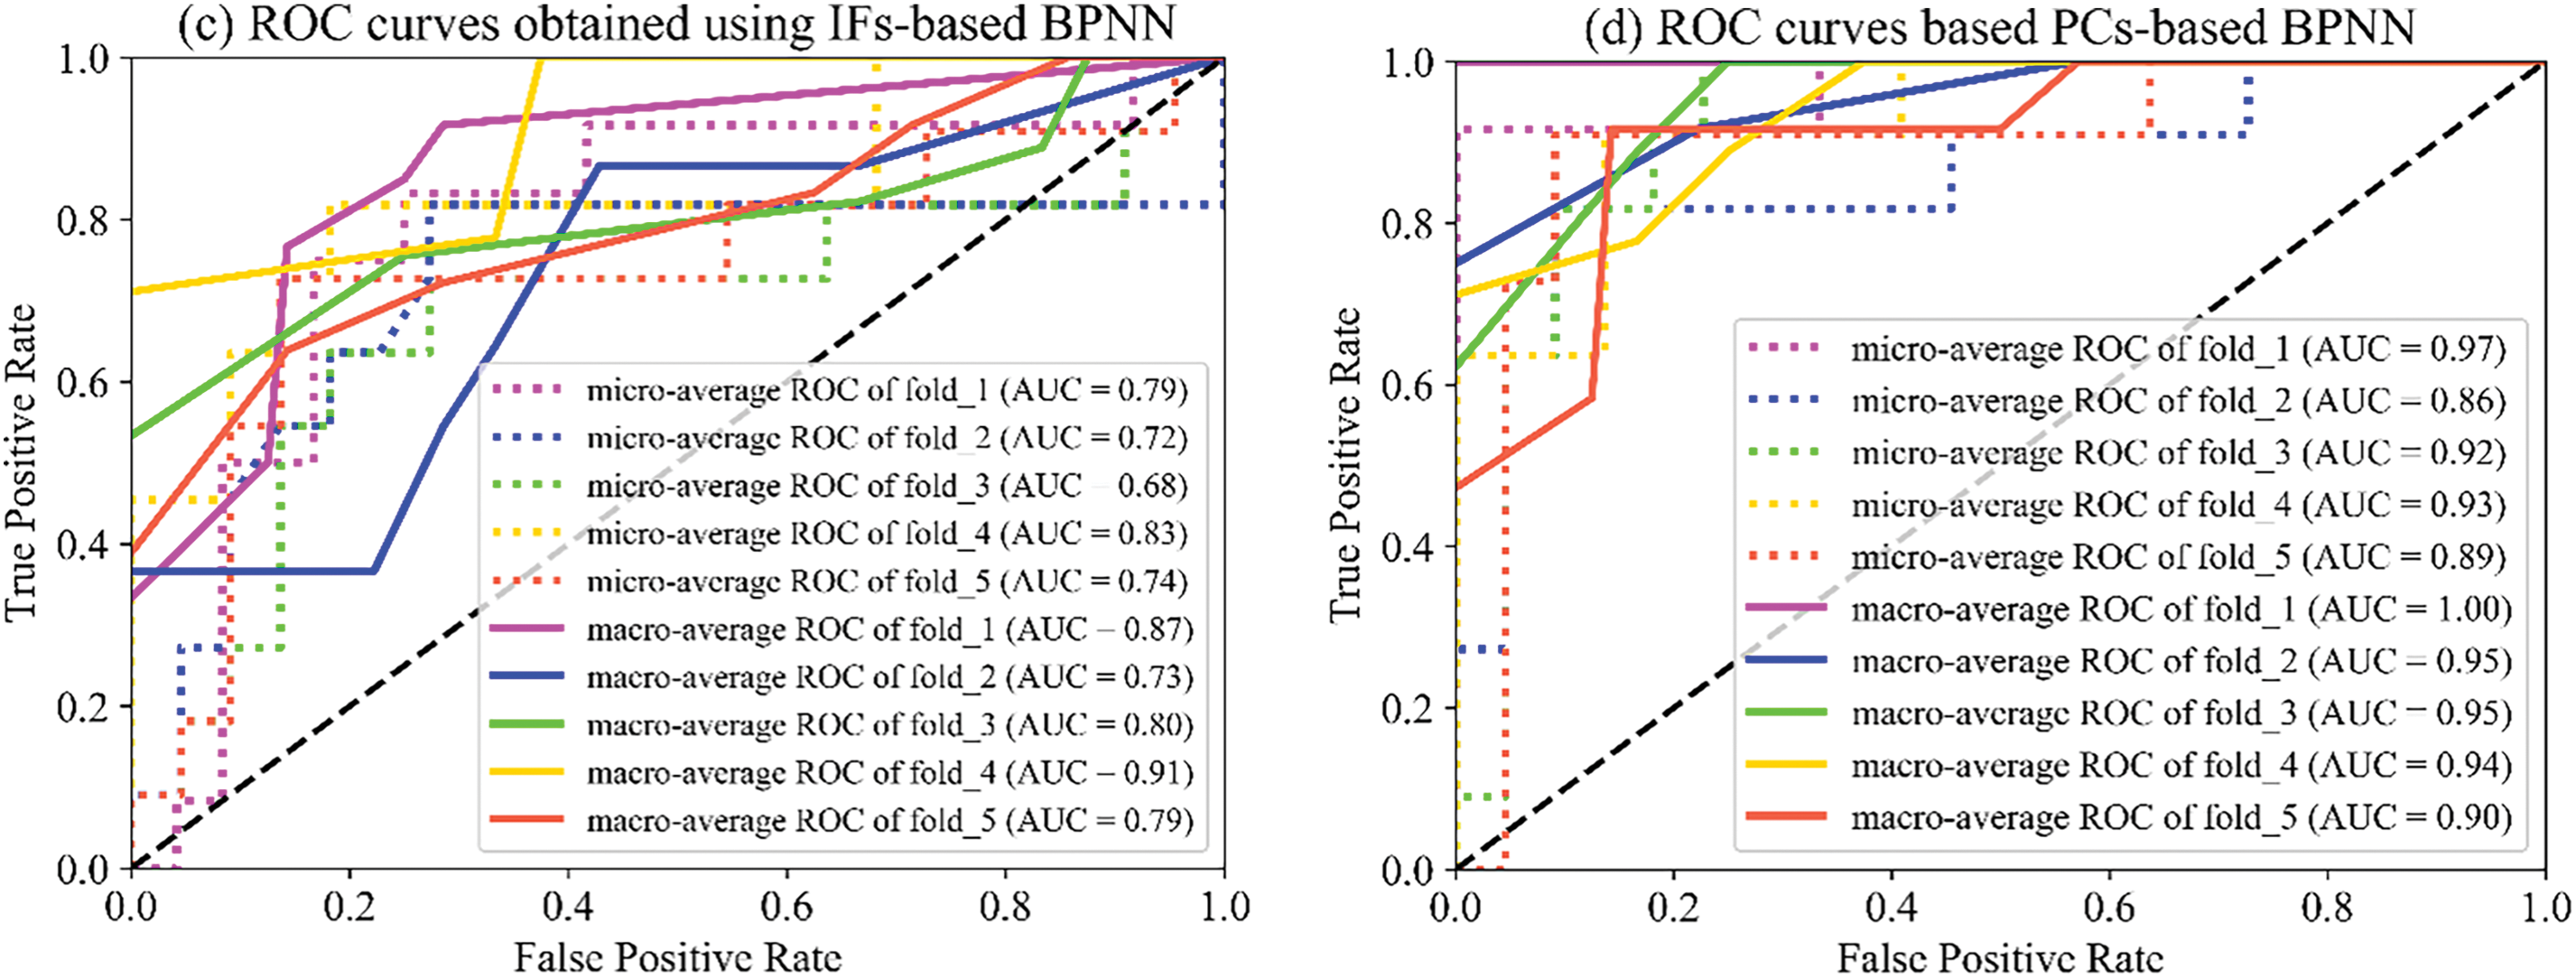
Figure 6: Average ROC curves and their corresponding AUC of 5-fold cross-validation of (a) IFs-based RF, (b) PCs-based RF, (c) IFs-based BPNN, and (d) PCs-based BPNN models
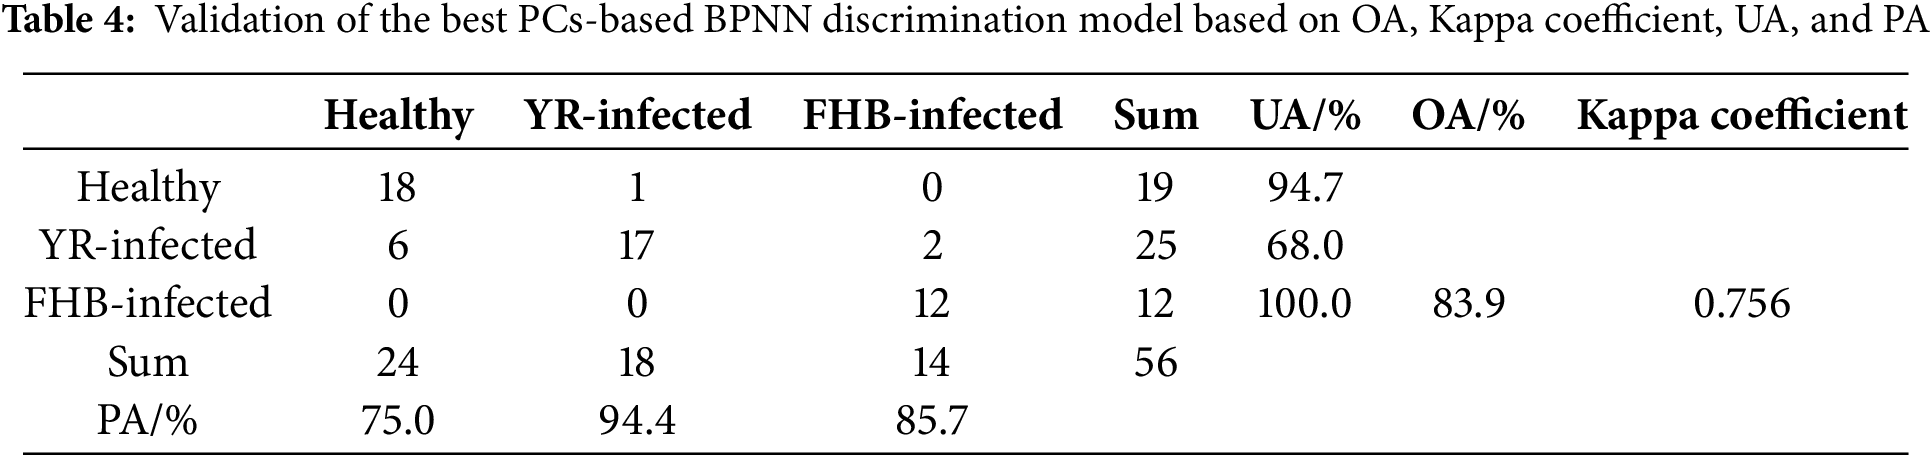
Furthermore, the PCs-based BPNN model with the optimal AUC value, which was obtained from fold 1, was selected for disease differentiation, and its performance was further evaluated using four accuracy evaluation indicators: OA, kappa coefficient, UA, and PA (Table 4). The result illustrated that the OA and kappa coefficient of the model reached 83.9% and 0.756. The PAs of the YR- and FHB-infected classes reached 94.4% and 85.7%, respectively. All the above results indicate that the coupled use of multisource remote sensing and meteorological data is promising for crop disease discrimination in clouded and rainy areas. The PCs-based BPNN discrimination approach proposed in this article meets the developmental needs of precision agriculture.
3.3 Mapping of YR and FHB Damage
The best performing PCs-based BPNN discrimination model was used for mapping further YR and FHB wheat damages. Fig. 7 illustrates the spatial distribution of wheat damage caused by YR and FHB. Firstly, it may be noted that YR was widespread throughout the study area. In addition, the FHB occurred extensively in the southern part of the study area and occurred sporadically in the northern part. The mapping result of the entire study area was quantitatively counted to further compare the area proportion of the three disease types in the whole study area based on the optimal discrimination model with the field truth data. The results illustrated that in the mapping result based on the optimal discrimination model, healthy wheat accounted for 47.4%, 4.5% higher than the field truth, YR-damaged wheat accounted for 27.9%, 4.2% lower than the field truth, and the proportion of FHB-damaged wheat differed only 0.2% from the field truth.
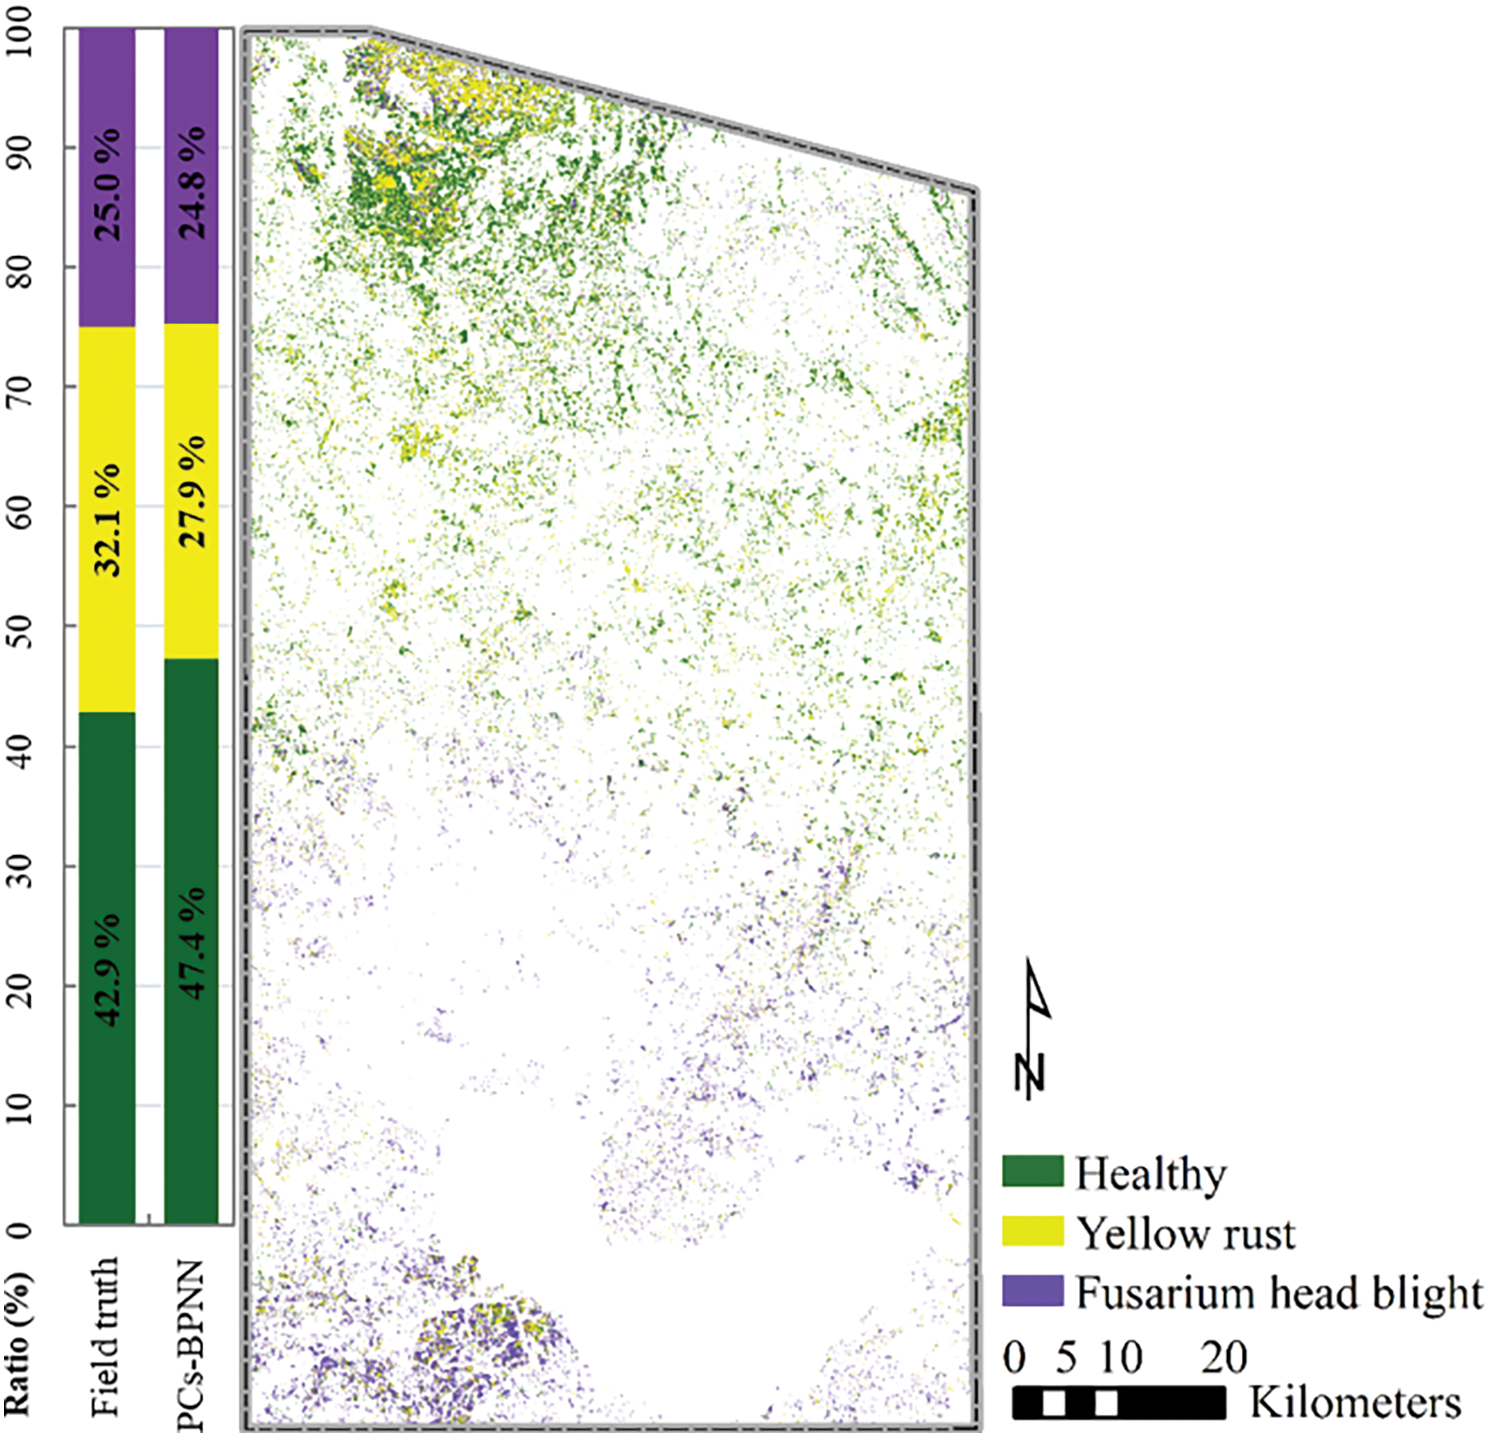
Figure 7: Damage maps of YR and FHB wheat obtained using PCs-based BPNN discrimination models
4.1 The Impact of IFs on Disease Characterization for the Four PCs
In this study, a dimensionality reduction technique, PCA, was utilized to compress the initial remote sensing and meteorological features with high redundancy to improve the accuracy of disease discrimination modeling. 22 multi-temporal remote sensing features and 6 meteorological parameters were condensed into 4 PCs. However, the four PCs showed obvious differential responses to healthy, YR- and FHB-infected wheat (Fig. 5).
To clarify the four PCs’ differential responses to the three disease categories, we further analyzed the rotation components of each original feature in the four principal components. Fig. 8 shows the rotation components of IF in each PC. Commonly, the absolute rotation factor loading of PCs higher than 0.6 was considered to be high [42]. Therefore, after filtering through factor loading, the results indicated that PC1 mainly contained information on the IFs obtained using the Sentinel-2 image on 22 April and Greenness calculated using the Landsat-8 image on 23 April (sensitive to YR wheat). Secondly, PC2 primarily held the information on the six meteorological indicators (sensitive to FHB wheat). Thirdly, PC3 contained LST information, calculated using the Landsat-8 image on 23 April, while the four IFs (EVI, NDVI, RVI, and SIPI) were obtained by Gaofen-1 image on 30 April, SIPI was obtained using the Gaofen-1 image on 16 May (sensitive to healthy wheat). Lastly, PC4 predominantly retained information from the four IFs (DVI, EVI, NDVI, and RVI) obtained using the Gaofen-1 image on 16 May (both sensitive to YR and FHB wheat). These results revealed that the four PCs represented the IFs of different periods, that is, PC1 was dominated by remote sensing IFs in the early date, PC3 was dominated by IFs in the mid-term date, and PC4 was dominated by IFs in the late date, while PC2 was dominated by meteorological IFs. Furthermore, the meteorological parameters during the critical period of wheat growth can reflect the wheat phenology to a certain extent.
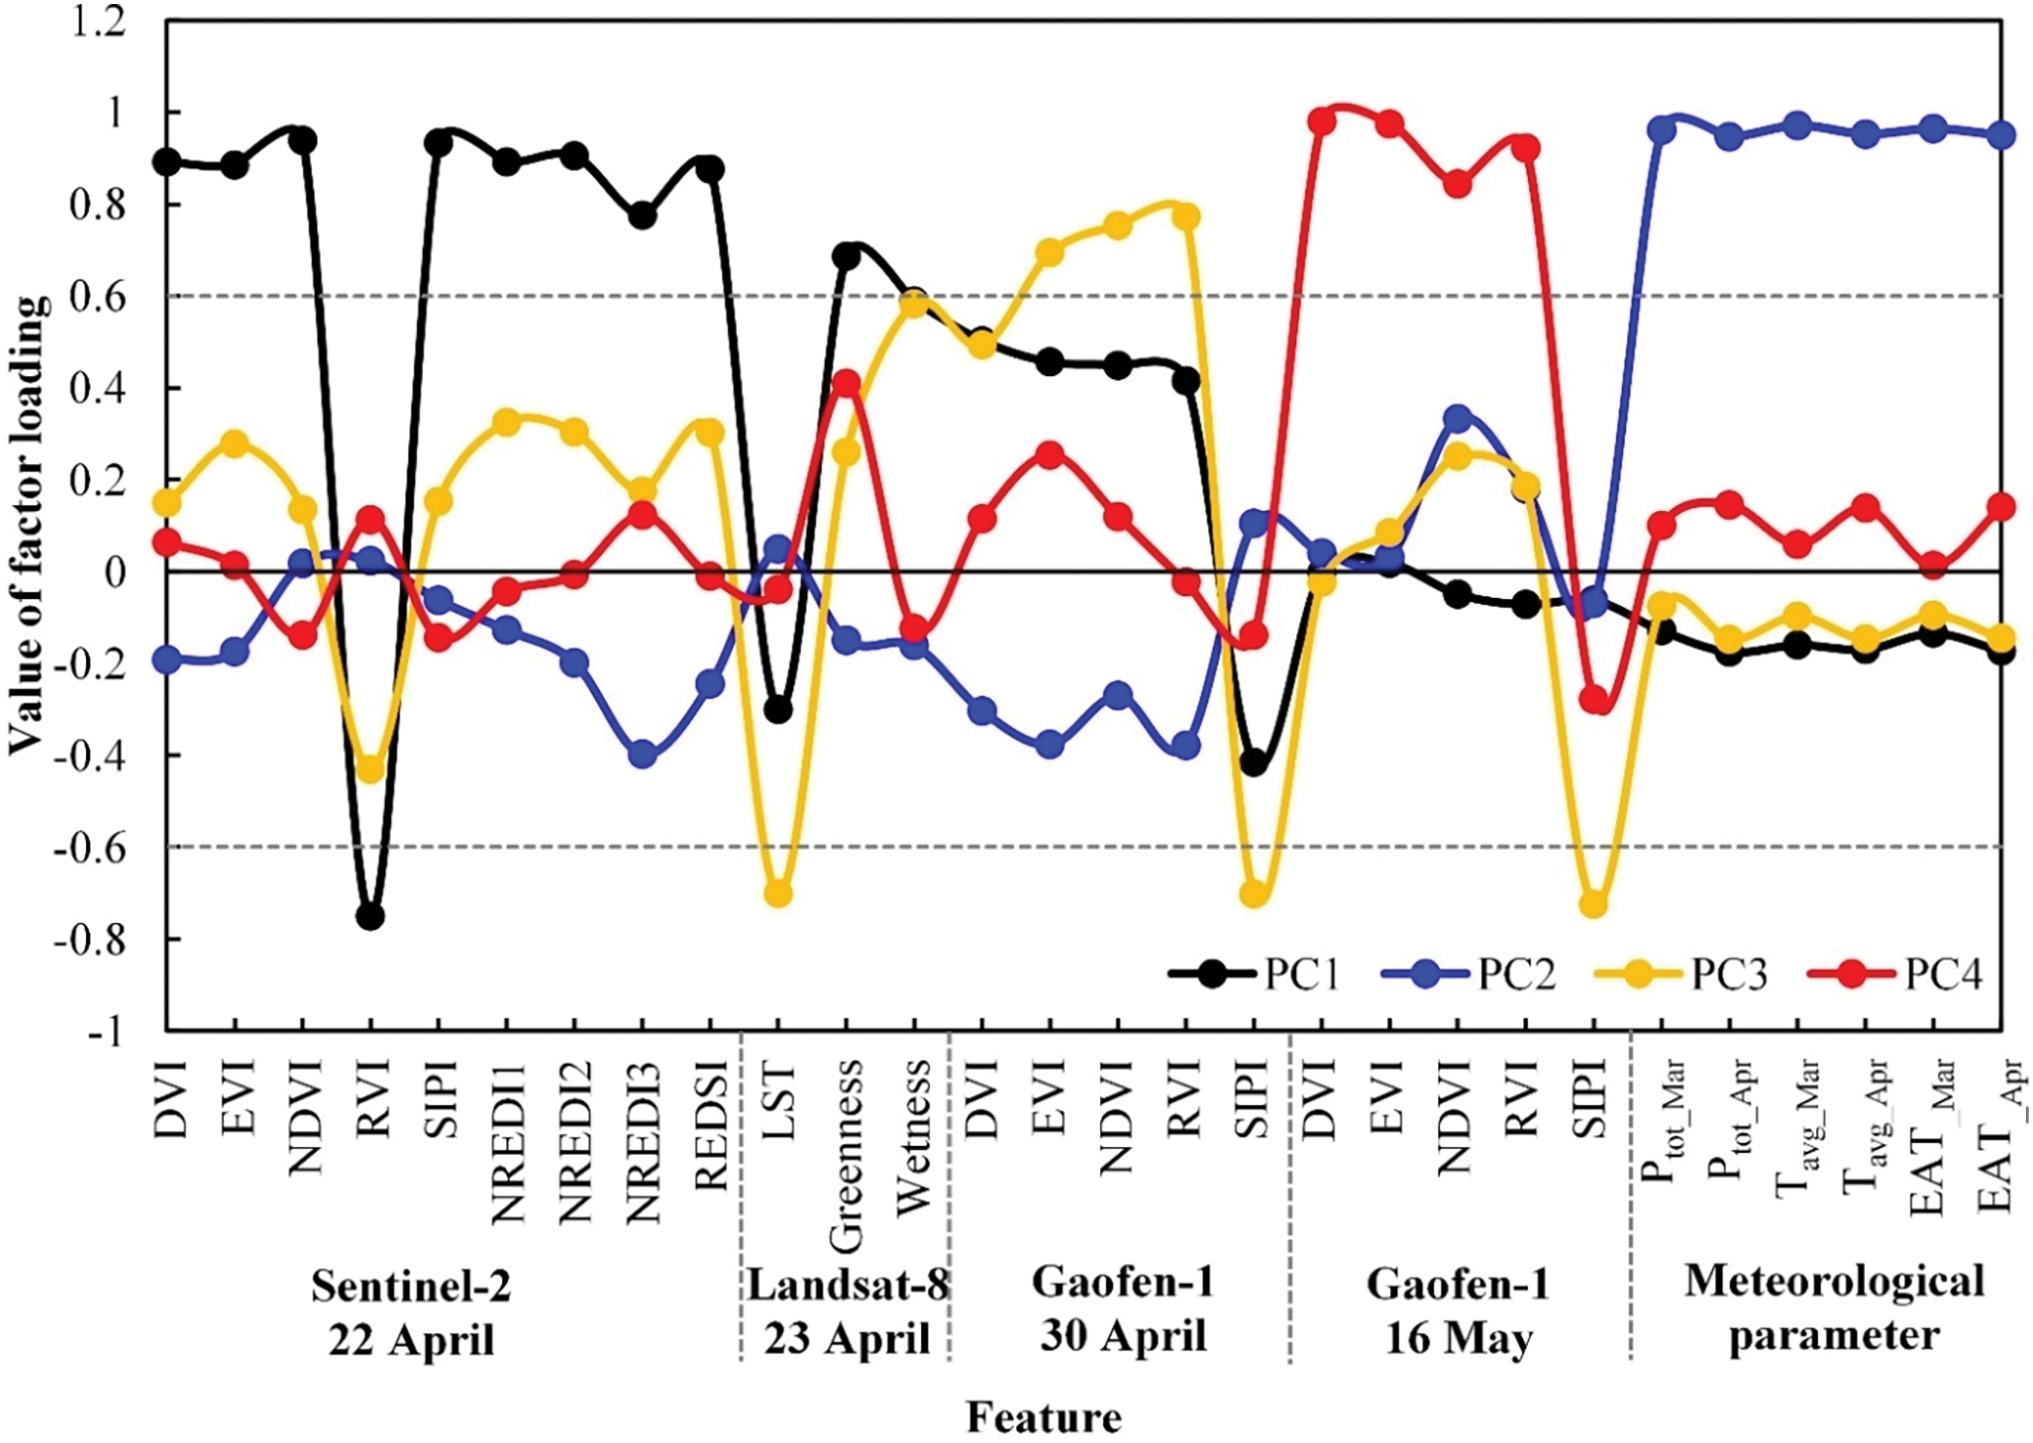
Figure 8: Rotated component of the IFs
In another study on remote sensing monitoring wheat YR, we summarized the annual infection cycle of wheat YR in China [43]. That is, from late February to early-to-mid March each year, after winter wheat turns green, the YR fungus begins to revive, entering the main epidemic period of wheat YR, then rapidly spreads to the main wheat-producing areas in eastern China. Furthermore, Huang et al. found that from early April to mid-May 2017, wheat YR in the Huang-Huai-Hai region entered a period of rapid expansion and spread, with the diseased area and number of counties growing exponentially, and the diseased range expanding day by day [44]. For wheat FHB, meteorological conditions during the heading and flowering period (mainly April in Anhui Province, China) affect its pathogen infection, and its symptoms and rapid development are affected by meteorological conditions during the grain filling and milk maturity stage [13]. These existing reports indicate that wheat YR enters the peak period of significant symptom occurrence earlier, the symptoms of FHB appear and spread rapidly, and the two diseases may thus both show obvious symptoms in the field in the later stages.
Therefore, the above results may be the main reasons for the differential responses of the four PCs to the three wheat health categories. Besides, our study also demonstrates the necessity of multi-temporal and multi-source information coupling in crop multi-stress discrimination.
4.2 The Disease Discrimination Model Based on PCs and Its Performance
We explored the use of IFs and PCs in RF and BPNN algorithms to construct a YR and FHB discriminant model. For the same algorithm, the discriminant models based on PCs outperformed IFs-based models, demonstrating the effectiveness of PCA dimensionality reduction technology in improving model accuracy. It’s worth noting that for the models based on IFs, compared to the BPNN model’s average AUC of 0.75 from the micro-averaged ROC, the RF model obtained a relatively higher average AUC of 0.76 (Table 3). However, after using the principal component analysis (PCA) algorithm, the average AUC of the PCs-based BPNN model significantly improved to 0.91, outperforming the PCs-based RF model’s average AUC of 0.83. This may be because, on the one hand, RF has been shown to have more advantages than BPNN concerning small samples, multiclass, and unbalanced data without pre-processing [45]. On the other hand, when the PCs obtained after dimensionality reduction of IFs were taken as the input variable, the convergence rate of weight parameters in the BPNN training process can be accelerated effectively [46,47].
Furthermore, we compared the spatial distribution mapping results of wheat YR and FHB damage in the study area based on the optimal discriminant model (Fig. 8) with the existing reported results of the two diseases in the study area to further evaluate the model performance. According to the report, in 2017, affected by the extremely warm winter climate and rainy and suitable temperature conditions in the spring, YR wheat was prevalent in Huang-Huai-Hai wheat growth areas in China [44]. Therefore, the YR spatial distribution mapped by the present study’s discrimination models corresponds to real-life data. For wheat FHB, official reports (Department of Agriculture and Rural Affairs of Anhui Province, http://nync.ah.gov.cn, accessed on 01 December 2024) indicate that the actual area where wheat scab occurred in Anhui Province in 2017 was 380.3 thousand hectares, a decrease of 866.4 thousand hectares compared with 2016, and the overall area was on the lighter side. Meanwhile, according to the official report of the Anhui Provincial Bureau of Statistics (https://tjj.ah.gov.cn/, accessed on 01 December 2024), the winter wheat planting area in Anhui Province in 2017 was 2391.99 thousand hectares. From this, we calculated that the area of wheat FHB in Anhui Province in 2017 was only about 1.6%, much lower than our model and actual field survey results. Although our study area is located in a high-risk region for wheat FHB in Anhui Province [48], combined with official reports, we speculate based on this that our model overestimates wheat scab. Analyzing the possible reasons for this result, we found that our survey data in the southern part of the study area only included samples from plots where scab occurred, and the sample distribution was also relatively concentrated (Fig. 2). This uneven distribution of modeling samples may have led to overfitting of the model, which in turn caused a high incidence of scab in the southern part of the study area where only the scab survey plot was located. In the future, the number of ground survey samples should be increased while ensuring the uniformity and representativeness of sample distribution and combining crop growth conditions and sampling strategies during critical growth periods to conduct ground surveys for pests and diseases may be a possible way.
In the present study, a YR and FHB wheat discrimination model for clouded and rainy weather areas was proposed by coupling remote sensing and meteorological data. Furthermore, the BPNN method was combined with the PCA algorithm to establish a YR and FHB discrimination model. The results suggest that the coupled use of multi-source remote sensing and meteorological data may be beneficial in discrimination between crop diseases in clouded and rainy weather areas. The use of the PCA algorithm to reduce the dimensionality of IFs was shown to significantly improve the accuracy of disease discrimination. Nevertheless, several issues remained unresolved and should be the subject of future studies.
This article focused on exploring the feasibility of combining multi-source remote sensing data with meteorological data to identify crop diseases in rainy weather areas. The multi-source remote sensing data includes three satellite sensor data, i.e., Sentinel-2, Landsat-8, and Gaofen-1. Different sensors have different band settings. For intuitive display, we combined the band setting information of Landsat-8, Sentinel-2, and Gaofen-1 satellite sensors to create Fig. 9. It can be seen that the wavelength ranges of the same band of the three satellite sensors are different. This difference in band settings may cause different spectral responses of the same target [49], which may hurt the universality of crop disease identification methods. Therefore, data fusion processing or cross-calibration processing between images may be necessary when comprehensively applying multi-source remote sensing images. However, this study was limited by the difference in transit time of various sensors in the study area and was only a simple coupling application of image data from three types of sensors. In the future, the impact of differences in sensor band settings on disease identification should be further analyzed, and methods of fusion and application of multi-source data should be explored to further improve the universality of crop disease discrimination models.
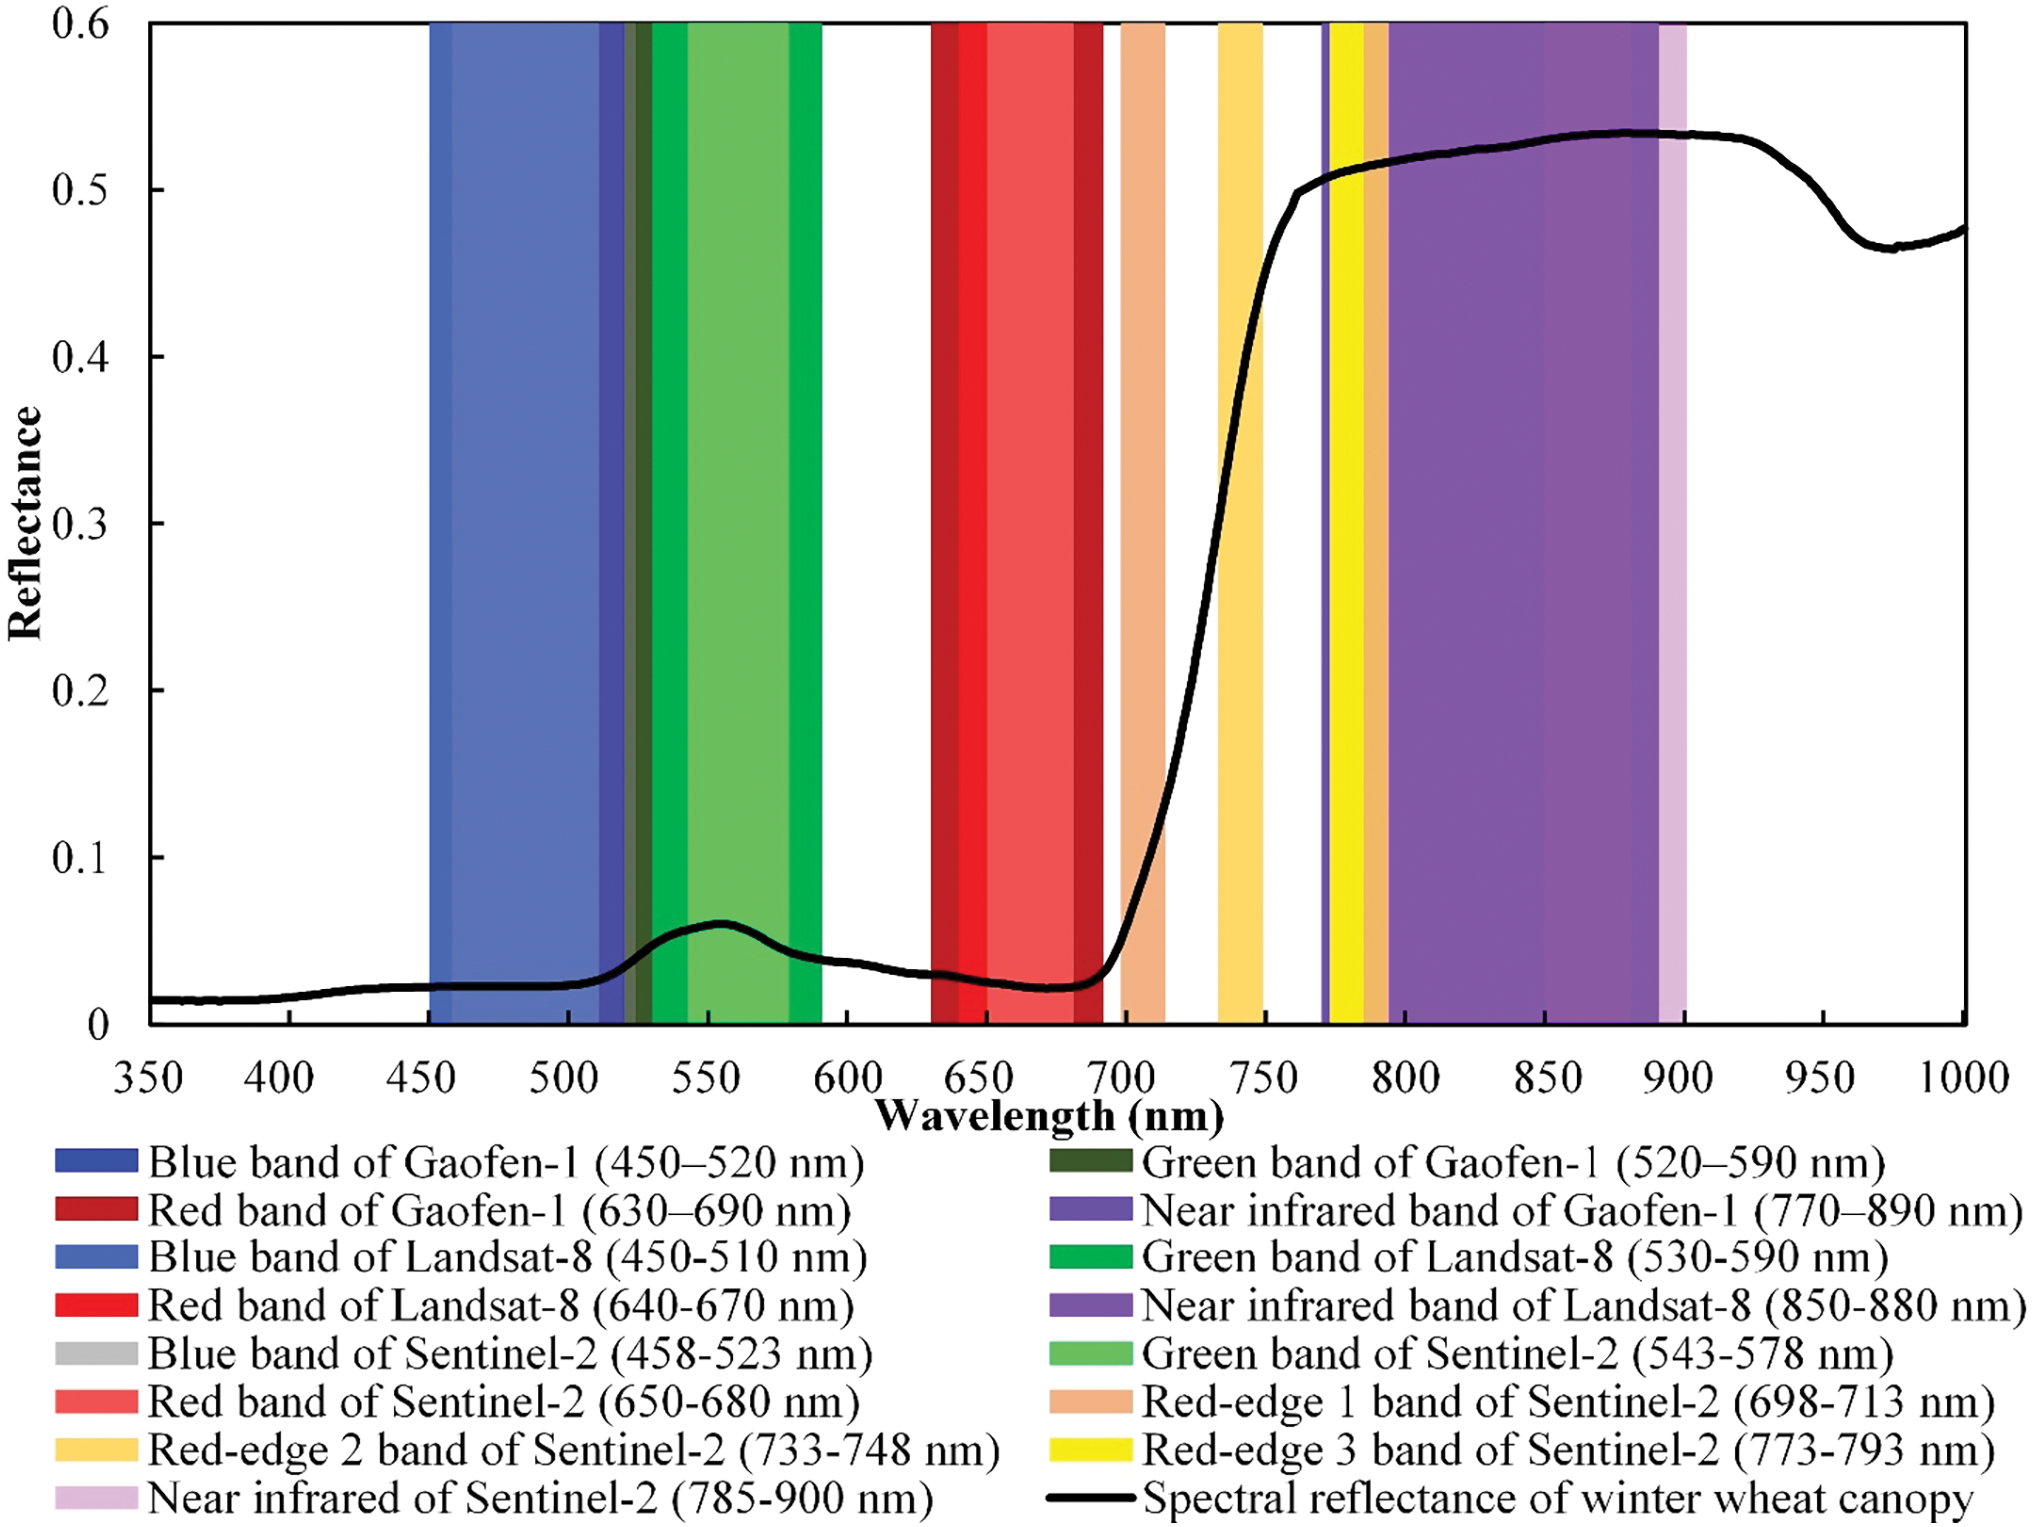
Figure 9: The wavelength range of different remote sensing satellite sensor image bands
Besides, the meteorological parameter indicators characterizing environmental conditions in this study were obtained through spatial interpolation of station meteorological data. This method can reflect the differences in environmental meteorological conditions in the study area to a certain extent. However, due to the influence of too sparse meteorological observation sites, planar data obtained by direct interpolation cannot accurately represent the response relationship between spatially differentiated meteorological conditions and the occurrence and development of pests and diseases under the influence of different underlying surfaces. Some scholars have explored downscaling methods to obtain high spatial resolution and high-quality spatially continuous meteorological data by combining rain gauge observations, satellite-derived precipitation data, and geographical ancillary data [50], providing important method references for obtaining more reliable input of crop disease discrimination models.
Furthermore, the occurrence characteristics of individual diseases differ. Under suitable conditions, YR wheat occurs during any wheat growth period [51]. However, for FHB wheat is present only during the rainy weather present for the wheat heading and flowering period [52]. In the future, in addition to wheat growth conditions and habitat parameters, wheat growth period information should also be considered for the discrimination of YR and FHB wheat. Meanwhile, in recent years, emerging artificial intelligence technologies such as deep learning have become a new trend in the development of precision and smart agriculture [53]. Some scholars have proposed an optimized three-dimensional convolutional network that comprehensively considers the spectrum and space of satellite images and performs well in image classification [54]. Therefore, popular artificial intelligence technologies should try to replace traditional data mining algorithms in crop disease monitoring analysis in the future.
Finally, in actual farmland ecosystems, compared with our case scenario (YR and FHB coincide), there are usually more complex scenarios with more coexistence of crop diseases, pests, and abiotic stresses, which puts higher requirements on the stability and transferability of the discriminant model. Unfortunately, although our study considered the simultaneous occurrence of wheat YR and FHB, we still incorporated expert experience to a certain extent before conducting field truth surveying. Also, we did not fully consider the differences in wheat varieties. So, the transferability of our discrimination model needs to be further verified. Some reports show that remote sensing can be used for high-throughput phenotyping analysis of genes in crop disease resistance breeding research, which provides new ideas for regional crop pest and disease discrimination [55,56]. In the future, we should try to incorporate crop genotype/phenotype information that can be represented by remote sensing into crop multi-stress discriminant analysis to improve the reliability and universality of the discriminant model, enhancing agricultural informatization.
This study proposed a wheat disease discrimination model that couples multi-source remote sensing and meteorological data to map the spatial distribution of wheat YR and FHB in cloudy and rainy areas. This model completed the all-around representation of disease habitat impact information through the complementation of multi-time and multi-source information and achieved discriminated monitoring of wheat main diseases in cloudy and rainy areas. This model overcomes the limitations of a single satellite sensor in obtaining high-quality time series data in cloudy and rainy areas. The experimental results confirm the feasibility of this model in crop disease analysis in cloudy and rainy areas. In the future, we will focus on combining multi-source remote sensing data fusion, meteorological data downscaling, spectral-spatial attention three-dimensional networks in crop disease analysis to improve our crop disease analysis method, thereby increasing the stability and versatility of the discrimination model in cloudy and rainy areas.
Acknowledgement: Not applicable.
Funding Statement: This work was supported by National Key R&D Program of China (2022YFD2000100), National Natural Science Foundation of China (42401400), and Zhejiang Provincial Key Research and Development Program (2023C02018).
Author Contributions: The authors confirm contribution to the paper as follows: Conceptualization and methodology, Huiqin Ma, Jingcheng Zhang, Wenjiang Huang; software and validation, Qi Sheng, Huiqin Ma, Zhiqin Gui; formal analysis and investigation, Qi Sheng, Huiqin Ma, Zhiqin Gui; data curation, Qi Sheng, Huiqin Ma, Zhiqin Gui; writing—original draft preparation, Qi Sheng, Huiqin Ma; writing—review and editing, Qi Sheng, Huiqin Ma, Dongmei Chen, Bo Wang, Zhiqin Gui; project administration and funding acquisition, Jingcheng Zhang, Huiqin Ma. All authors reviewed the results and approved the final version of the manuscript.
Availability of Data and Materials: Data available on request from the authors.
Ethics Approval: Not applicable.
Conflicts of Interest: The authors declare no conflicts of interest to report regarding the present study.
References
1. Huang C, Jiang Y, Li C. Occurrence, yield loss and dynamics of wheat diseases and insect pests in China from 1987 to 2018. Zhi Wu Bao Hu. 2020;46(6):186–93 (In Chinese). [Google Scholar]
2. Zeng S, Luo Y. Systems analysis of wheat stripe rust epidemics in China. Eur J Plant Pathol. 2008;121(4):425–38. doi:10.1007/s10658-007-9267-9. [Google Scholar] [CrossRef]
3. Huang C, Jiang Y, Wu J, Qiu K, Yang J. Occurrence characteristics and reason analysis of wheat head blight in 2018 in China. Zhi Wu Bao Hu. 2019;45(2):160–3 (In Chinese). [Google Scholar]
4. Ministry of Agriculture and Rural Affairs of the People’s Republic of China. Announcement No. 333 of the ministry of agriculture and rural affairs of the People’s Republic of China; 2020 [cited 2021 Mar 24]. Available from: http://www.moa.gov.cn/govpublic/ZZYGLS/202009/t20200917_6352227.htm. [Google Scholar]
5. Ma K, Li X, Li Y, Wang Z, Zhao B, Wang B, et al. Disease resistance and genes in 146 wheat cultivars (lines) from the Huang-Huai-Hai region of China. Agronomy. 2021;11(6):1025. doi:10.3390/agronomy11061025. [Google Scholar] [CrossRef]
6. Abd El-Ghany N, Abd El-Aziz S, Marei S. A review: application of remote sensing as a promising strategy for insect pests and diseases management. Environ Sci Pollut Res. 2020;27(27):33503–15. doi:10.1007/s11356-020-09517-2. [Google Scholar] [CrossRef]
7. Zheng Q, Huang W, Cui X, Shi Y, Liu L. New spectral index for detecting wheat yellow rust using Sentinel-2 multispectral imagery. Sensors. 2018;18(3):868. doi:10.3390/s18030868. [Google Scholar] [PubMed] [CrossRef]
8. Tian L, Wang Z, Xue B, Li D, Yao X, Zhu Y, et al. A disease-specific spectral index tracks Magnaporthe oryzae infection in paddy rice from ground to space. Remote Sens Environ. 2023;285(27):113384. doi:10.1016/j.rse.2022.113384. [Google Scholar] [CrossRef]
9. Candotti A, De Giglio M, Dubbini M, Tomelleri E. A Sentinel-2 based multi-temporal monitoring framework for wind and bark beetle detection and damage mapping. Remote Sens. 2022;14(23):6105. doi:10.3390/rs14236105. [Google Scholar] [CrossRef]
10. Ma H, Huang W, Jing Y, Yang C, Han L, Dong Y, et al. Integrating growth and environmental parameters to discriminate powdery mildew and aphid of winter wheat using bi-temporal Landsat-8 imagery. Remote Sens. 2019;11(7):846. doi:10.3390/rs11070846. [Google Scholar] [CrossRef]
11. Xu H, Huang J, Zhang F. Spatio-temporal changing features of winter wheat yield in Anhui Province and its responses to ENSO. J Nat Disas. 2022;31(6):153–61 (In Chinese). [Google Scholar]
12. Te Beest D, Paveley N, Shaw M, Van Den Bosch F. Disease-weather relationships for powdery mildew and yellow rust on winter wheat. Phytopathology. 2008;98(5):609–17. doi:10.1094/PHYTO-98-5-0609. [Google Scholar] [CrossRef]
13. Birr T, Hasler M, Verreet J, Klink H. Composition and predominance of Fusarium species causing Fusarium head blight in winter wheat grain depending on cultivar susceptibility and meteorological factors. Microorganisms. 2020;8(4):617. doi:10.3390/microorganisms8040617. [Google Scholar] [PubMed] [CrossRef]
14. Ruan C, Dong Y, Huang W, Huang L, Ye H, Ma H, et al. Integrating remote sensing and meteorological data to predict wheat stripe rust. Remote Sens. 2022;14(5):1221. doi:10.3390/rs14051221. [Google Scholar] [CrossRef]
15. Xiao Y, Dong Y, Huang W, Liu L. Regional prediction of Fusarium head blight occurrence in wheat with remote sensing based Susceptible-Exposed-Infectious-Removed model. Int J Appl Earth Obs Geoinf. 2022;114(7):103043. doi:10.1016/j.jag.2022.103043. [Google Scholar] [CrossRef]
16. Jordan C. Derivation of leaf-area index from quality of light on the forest floor. Ecology. 1969;50(4):663–6. doi:10.2307/1936256. [Google Scholar] [CrossRef]
17. Qin Q, Ghulam A, Zhu L, Wang L, Nan P. Evaluation of Modis derived perpendicular drought index for estimation of surface dryness over northwestern China. Int J Remote Sens. 2008;29(7):1983–95. doi:10.1080/01431160701355264. [Google Scholar] [CrossRef]
18. Rouse J, Haas R, Schell J, Deering D. Monitoring vegetation systems in the great plains with ERTS. NASA Spec Public. 1973;351:309. [Google Scholar]
19. Peñuelas J, Filella I. Visible and near-infrared reflectance techniques for diagnosing plant physiological status. Trends Plant Sci. 1998;3(4):151–6. doi:10.1016/S1360-1385(98)01213-8. [Google Scholar] [CrossRef]
20. Peñuelas J, Inoue Y. Reflectance indices indicative of changes in water and pigment contents of peanut and wheat leaves. Photosynthetica. 1999;36(3):355–60. doi:10.1023/A:1007033503276. [Google Scholar] [CrossRef]
21. Gitelson A, Merzlyak M. Quantitative estimation of chlorophyll-a using reflectance spectra: experiments with autumn chestnut and maple leaves. J Photochem Photobiol Bio. 1994;22(3):247–52. doi:10.1016/1011-1344(93)06963-4. [Google Scholar] [CrossRef]
22. Baig M, Zhang L, Shuai T, Tong Q. Derivation of a tasselled cap transformation based on Landsat 8 at-satellite reflectance. Remote Sens Lett. 2014;5(5):423–31. doi:10.1080/2150704X.2014.915434. [Google Scholar] [CrossRef]
23. Chander G, Markham B, Helder D. Summary of current radiometric calibration coefficients for landsat MSS, TM, ETM+, and EO-1 ALI sensors. Remote Sens Environ. 2009;113(5):893–903. doi:10.1016/j.rse.2009.01.007. [Google Scholar] [CrossRef]
24. Hao P, Niu Z, Zhan Y, Wu Y, Wang L, Liu Y. Spatiotemporal changes of urban impervious surface area and land surface temperature in Beijing from 1990 to 2014. GISci Remote Sens. 2016;53(1):63–84. doi:10.1080/15481603.2015.1095471. [Google Scholar] [CrossRef]
25. Ueda T, Hoshiai Y. Application of principal component analysis for parsimonious summarization of dea inputs and/or outputs. J Oper Res Soc Jpn. 1997;40(4):466–78. doi:10.15807/jorsj.40.466. [Google Scholar] [CrossRef]
26. Fu H, Zhao H, Song R, Yang Y, Li Z, Zhang S. Cotton aphid infestation monitoring using Sentinel-2 MSI imagery coupled with derivative of ratio spectroscopy and random forest algorithm. Front Plant Sci. 2022;13:1029529. doi:10.3389/fpls.2022.1029529. [Google Scholar] [PubMed] [CrossRef]
27. Wang L, Zhou X, Zhu X, Dong Z, Guo W. Estimation of biomass in wheat using random forest regression algorithm and remote sensing data. Crop J. 2016;4(3):212–9. doi:10.1016/j.cj.2016.01.008. [Google Scholar] [CrossRef]
28. Svetnik V, Liaw A, Tong C, Culberson J, Sheridan R, Feuston B. Random forest: a classification and regression tool for compound classification and QSAR modeling. J Chem Inf Comput Sci. 2003;43(6):1947–58. doi:10.1021/ci034160g. [Google Scholar] [CrossRef]
29. Rodriguez-Galiano V, Ghimire B, Rogan J, Chica-Olmo M, Rigol-Sánchez J. An assessment of the effectiveness of a random forest classifier for land-cover classification. ISPRS J Photogramm Remote Sens. 2012;67(4):93–104. doi:10.1016/j.isprsjprs.2011.11.002. [Google Scholar] [CrossRef]
30. Palmer D, O’Boyle N, Glen R, Mitchell J. Random forest models to predict aqueous solubility. J Chem Inf Model. 2007;47(1):150–8. doi:10.1021/ci060164k. [Google Scholar] [PubMed] [CrossRef]
31. Wang Z, Wang Y, Zeng R, Srinivasan R, Ahrentzen S. Random Forest based hourly building energy prediction. Energy Build. 2018;171(2):11–25. doi:10.1016/j.enbuild.2018.04.008. [Google Scholar] [CrossRef]
32. Díaz-Uriarte R, Alvarez de Andrés S. Gene selection and classification of microarray data using random forest. BMC Bioinform. 2006;7(1):1–13. doi:10.1186/1471-2105-7-3. [Google Scholar] [PubMed] [CrossRef]
33. Wang L, Zeng Y, Chen T. Back propagation neural network with adaptive differential evolution algorithm for time series forecasting. Expert Syst Appl. 2015;42(2):855–63. doi:10.1016/j.eswa.2014.08.018. [Google Scholar] [CrossRef]
34. Aslanargun A, Mammadov M, Yazici B, Yolacan S. Comparison of ARIMA, neural networks and hybrid models in time series: tourist arrival forecasting. J Stat Comput Simul. 2007;77(1):29–53. doi:10.1080/10629360600564874. [Google Scholar] [CrossRef]
35. Jiang P, Ge Y, Wang C. Research and application of a hybrid forecasting model based on simulated annealing algorithm: a case study of wind speed forecasting. J Renew Sustain Energy. 2016;8(1):015501. doi:10.1063/1.4940408. [Google Scholar] [CrossRef]
36. Bhati H, Rathore M. An improved plant leaf disease identification using ResNet50 and Enhanced Back propagation neural network. Int J Commun Netw Inf Secur. 2024;16(3):271–7. [Google Scholar]
37. Lei S, Luo J, Tao X, Qiu Z. Remote sensing detecting of yellow leaf disease of arecanut based on UAV multisource sensors. Remote Sens. 2021;13(22):4562. doi:10.3390/rs13224562. [Google Scholar] [CrossRef]
38. Chen K, Yang S, Batur C. Effect of multi-hidden-layer structure on performance of BP neural network. In: 2012 8th International Conference on Natural Computation; 2012; Chongqing, China. p. 1–5. [Google Scholar]
39. Blum A. Neural networks in C++: an object-oriented framework for building connectionist systems.New York: John Wiley & Sons; 1992. [Google Scholar]
40. Shi Y, Zhao XT, Zhang YM, Ren NQ. Back propagation neural network (BPNN) prediction model and control strategies of methanogen phase reactor treating traditional Chinese medicine wastewater (TCMW). J Biotechnol. 2009;144(1):70–4. doi:10.1016/j.jbiotec.2009.08.014. [Google Scholar] [PubMed] [CrossRef]
41. Wong T. Performance evaluation of classification algorithms by k-fold and leave-one-out cross validation. Pattern Recognit. 2015;48(9):2839–46. doi:10.1016/j.patcog.2015.03.009. [Google Scholar] [CrossRef]
42. Kreil D, Ouzounis C. Identification of thermophilic species by the amino acid compositions deduced from their genomes. Nucleic Acids Res. 2001;29(7):1608–15. doi:10.1093/nar/29.7.1608. [Google Scholar] [PubMed] [CrossRef]
43. Ma H, Zhang J, Huang W, Ruan C, Chen D, Zhang H, et al. Monitoring yellow rust progression during spring critical wheat growth periods using multi-temporal Sentinel-2 imagery. Pest Manag Sci. 2024;80(12):6082–95. doi:10.1002/ps.8336. [Google Scholar] [CrossRef]
44. Huang C, Jiang Y, Li P, Peng H, Cui Yan, Yang J, et al. Epidemics analysis of wheat stripe rust in China in 2017. Plant Prot. 2018;44(2):162–6 (In Chinese). [Google Scholar]
45. Liu M, Wang M, Wang J, Li D. Comparison of random forest, support vector machine and back propagation neural network for electronic tongue data classification: application to the recognition of orange beverage and Chinese vinegar. Sens Actuat B: Chem. 2013;177:970–80. doi:10.1016/j.snb.2012.11.071. [Google Scholar] [CrossRef]
46. Liu Y, Sun X, Ouyang A. Nondestructive measurement of soluble solid content of navel orange fruit by visible-NIR spectrometric technique with PLSR and PCA-BPNN. LWT-Food Sci Technol. 2010;43(4):602–7. doi:10.1016/j.lwt.2009.10.008. [Google Scholar] [CrossRef]
47. Wu F, Jia Y. Classification of multispectral remote sensing image based On PCA-BPNN. Geospat Inform. 2006;4(1):15–17. [Google Scholar]
48. Yue W, Chen X, Yao W, Wang J, Wang X, Deng B, et al. Meteorological risk assessment and regionalization of wheat scab in Anhui province. Zhi Wu Bao Hu. 2022;48(5):167–73 (In Chinese). [Google Scholar]
49. Franke J, Heinzel V, Menz G. Assessment of NDVI-differences caused by sensor specific relative spectral response functions. In: 2006 IEEE International Symposium on Geoscience and Remote Sensing; 2006; Denver, CO, USA. p. 1138–41. [Google Scholar]
50. Chen Y, Huang J, Sheng S, Mansaray L, Liu Z, Wu H, et al. A new downscaling-integration framework for high-resolution monthly precipitation estimates: combining rain gauge observations, satellite-derived precipitation data and geographical ancillary data. Remote Sens Environ. 2018;214:154–72. doi:10.1016/j.rse.2018.05.021. [Google Scholar] [CrossRef]
51. Chen W, Kang Z, Ma Z, Xu S, Jin S, Jiang Y. Integrated management of wheat stripe rust caused by puccinia striiformis f. sp. tritici in China. Scientia Agricult Sinica. 2013;46(20):4254–62 (In Chinese). [Google Scholar]
52. Xiao J, Huo Z, Li N, Xin M, Wang L, Lu X. Progress in research on meteorological conditions of wheat scab. J Nat Disast. 2011;20:146–52 (In Chinese). [Google Scholar]
53. Pathan M, Patel N, Yagnik H, Shah M. Artificial cognition for applications in smart agriculture: a comprehensive review. Artif Intell Agricul. 2020;4(2):81–95. doi:10.1016/j.aiia.2020.06.001. [Google Scholar] [CrossRef]
54. Sun H, Zheng X, Lu X, Wu S. Spectral-spatial attention network for hyperspectral image classification. IEEE Trans Geosci Remote Sens. 2019;58(5):3232–45. doi:10.1109/TGRS.2019.2951160. [Google Scholar] [CrossRef]
55. Gholami M, Wimmer V, Sansaloni C, Petroli C, Hearne S, Covarrubias-Pazaran G, et al. A comparison of the adoption of genomic selection across different breeding institutions. Front Plant Sci. 2021;12:728567. doi:10.3389/fpls.2021.728567. [Google Scholar] [PubMed] [CrossRef]
56. Loladze A, Rodrigues J, Petroli C, Munoz-Zavala C, Naranjo S, San Vicente F, et al. Use of remote sensing for linkage mapping and genomic prediction for common rust resistance in maize. Field Crops Res. 2024;308(1):109281. doi:10.1016/j.fcr.2024.109281. [Google Scholar] [PubMed] [CrossRef]
Cite This Article
 Copyright © 2025 The Author(s). Published by Tech Science Press.
This work is licensed under a Creative Commons Attribution 4.0 International License , which permits unrestricted use, distribution, and reproduction in any medium, provided the original work is properly cited.
 Downloads
 Citation Tools