 Open Access
ARTICLE
Transcriptome Analysis Provides New Insights into Bulbil Formation in Bistorta vivipara
1 School of Ecol-Environmental Engineering, Qinghai University, Xining, 810016, China
2 Academic Affairs Office, Qinghai University, Xining, 810016, China
3 Northwest Key Laboratory of Cultivated Land Conservation and Marginal Land Improvement, Ministry of Agriculture and Rural Affairs, Delingha, 817000, China
4 Key Laboratory of Adaptation and Evolution of Plateau Biota, Northwest Institute of Plateau Biology, Chinese Academy of Sciences, Xining, 810008, China
5 State Key Laboratory of Plateau Ecology and Agriculture, Qinghai University, Xining, 810016, China
* Corresponding Author: Tao He. Email:
(This article belongs to the Special Issue: Transcriptional Regulation and Signal Transduction Networks in Plant Growth, Development, Morphogenesis, and Environmental Responses)
Phyton-International Journal of Experimental Botany 2025, 94(2), 393-406. https://doi.org/10.32604/phyton.2025.059531
Received 10 October 2024; Accepted 16 December 2024; Issue published 06 March 2025
Abstract
Bistorta vivipara is a facultative reproductive plant capable of asexual reproduction through underground rhizomes and bulbils, as well as sexual reproduction via seeds. The phenomenon of vegetative organ vivipary is a complex biological process regulated by a network of genes. However, the developmental mechanism regulating bulbil vivipary in B. vivipara remains largely unexplored. This study investigated different developmental stages of B. vivipara using RNA sequencing and transcriptome analysis. Approximately 438 million high-quality reads were generated, with over 61.65% of the data mapped to the de novo transcriptome sequence. A total of 154,813 reads were matched in at least one public database, and 49,731 genes were differentially expressed across developmental stages. Functional analysis revealed significant enrichment of these genes in phenylpropanoid biosynthesis, plant hormone signal transduction, protein processing, starch and sucrose metabolism, and plant-pathogen interaction. Ninety-four genes involved in phytohormones, plant pigments, enzymes, and transcription factors were identified as potential candidates for inducing vegetative organ vivipary. These differentially expressed genes (DEGs), detected through comparative transcriptome analysis, may serve as candidate genes for bulbil vivipary in B. vivipara, establishing a foundation for future studies on the molecular mechanisms underlying vegetative organ vivipary.Keywords
The majority of flowering plants possess the capability for asexual reproduction through diverse structures and mechanisms [1]. Asexual reproductive modes in plants are categorized into seed vivipary and vegetative organ vivipary. Seed vivipary, a rare reproductive phenomenon, involves seeds germinating while still attached to or within the parent plant or fruit [2,3]. Vegetative organ vivipary refers to the process where certain organs, such as rhizomes, bulbils, and leaves, remain attached after maturation, directly absorbing nutrients from the parent plant and continuing to grow and develop before detaching to form new plants in natural conditions [4]. The reproductive advantages of vivipary have been observed in various lineages of alpine, arctic, and tropical plants [5–8]. Vivipary serves as an adaptation mechanism to various harsh environmental factors, including short growing seasons, pollinator scarcity, cold, drought, high salinity, and elevated temperatures [9]. Vegetative vivipary enables plants to rapidly colonize different habitats, which is significant for species reproduction.
Bistorta vivipara is a perennial herbaceous plant in the family Polygonaceae, widely distributed in both arctic and alpine regions of the northern hemisphere [10]. B. vivipara predominantly inhabits shrub, alpine, and subalpine meadows at altitudes ranging from 2200 to 4800 m, with its characteristics varying significantly based on its geographical distribution [10–12]. This species exhibits both asexual reproduction through bulbils and belowground rhizomes and sexual reproduction via seeds, making it an ideal subject for studying the balance between sexual and asexual reproduction under changing climatic conditions [13,14]. B. vivipara is commonly found in shrub to alpine meadows in the Qinghai-Tibet Plateau (QTP), where it functions as a facultative plant [14]. Previous research on B. vivipara in the QTP has primarily focused on the influence of environmental factors on reproductive modes, morphological characteristics, and physiological and biochemical properties. However, the molecular mechanisms underlying vegetative organ vivipary in this plant remain unexplored. Our study examined the reproductive mode, morphological characteristics, and distribution of B. vivipara populations in the northeastern QTP, spanning altitudes from 2200 to 4200 m. The findings indicate that B. vivipara reproduces predominantly through bulbils, with both plant height and bulbil diameter decreasing at higher altitudes. This research conducted a comparative transcriptome analysis on three developmental stages of the plant growing in the Daban Mountain in the northeastern QTP: the inflorescences stage (IS), the bulbils stage (BS), and the viviparous plantlets stage (VS). The bulbils of B. vivipara originate from parenchyma cells situated between the bracts on the inflorescence axis. Individual bulbil development comprises three stages: initiation, expansion, and maturation [15]. As a vegetative reproductive organ of B. vivipara, the molecular mechanisms underlying bulbil development remain to be elucidated. This investigation into the vegetative vivipary of B. vivipara aims to enhance our understanding of the molecular mechanisms governing viviparous reproduction in plants while providing a theoretical foundation for comprehending how these mechanisms facilitate adaptation to alpine environments.
Specimens of B. vivipara at IS, BS, and VS were collected from Datong, Xining, Qinghai (101.6937° E, 36.9328° N, 2731 m). The growth forms of these developmental stages are illustrated in Fig. 1. The inflorescences, bulbils, and viviparous plantlets were flash-frozen in liquid nitrogen for use as experimental materials.
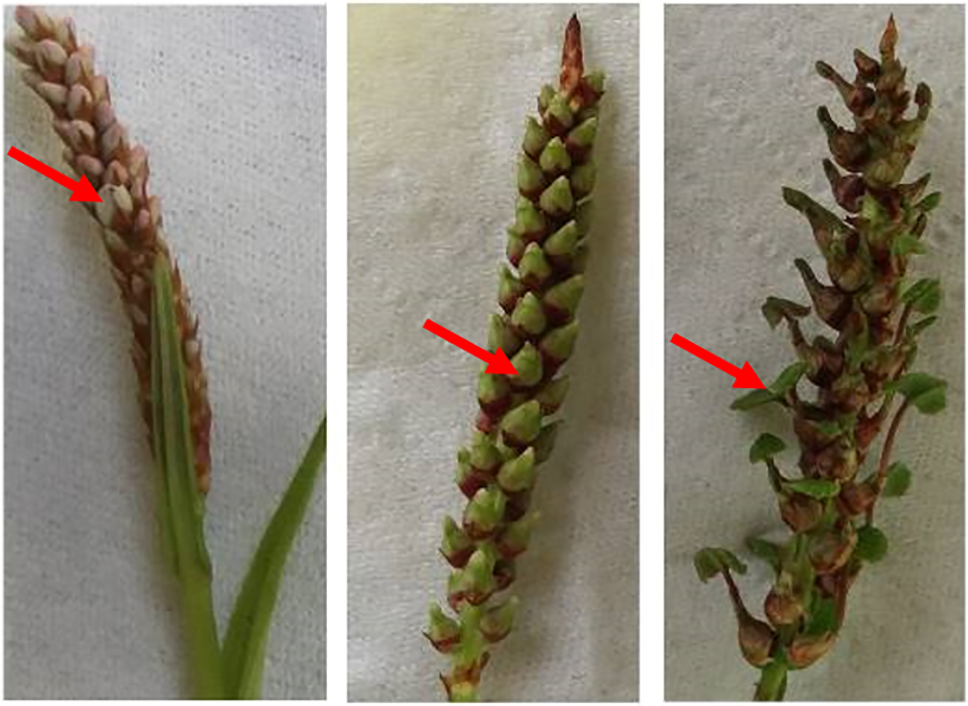
Figure 1: B. vivipara at different developmental stages
2.2 RNA Extraction and Transcriptome Sequencing
The total RNA of the experimental materials was extracted using Trizo® (Invitrogen-Thermo Fisher Scientific, Carlsbad, CA, USA). The RNA underwent DNase I treatment. Each sample contained 1.5 µg of RNA. RNA purity was assessed using a NanoPhotometer® spectrophotometer. RNA concentrations were determined using the Assay Kit in a Qubit® 2.0 Fluorometer (LifeTechnologies, Carlsbad, CA, USA). RNA integrity was evaluated using the RNA Nano 6000 Assay Kit of the Agilent Bioanalyzer 2100 system (Agilent Technologies, Carlsbad, CA, USA), with RNA Integrated Number (RIN) values ≥8. RNA that met the quality standards was enriched for mRNA using Oligo(dT)-attached magnetic beads for cDNA library construction.
The library was prepared using the NEBNext® UltraTM RNA Library Prep Kit for Illumina® (NEB, Ipswich, MA, USA). Library fragments underwent purification using the AMPure XP system (Beckman Coulter, Beverly, CA, USA). Assessment of library quality was conducted using the Agilent Bioanalyzer 2100 system. Raw reads were obtained through Illumina HiSeqTM 2500 sequencing; clean reads were generated by eliminating reads containing adapters, poly-N sequences, and low-quality reads from the raw data. Concurrently, Q20, Q30, GC-content, and sequence duplication levels of the clean data were calculated. All subsequent analyses were based on high-quality, clean data. The transcriptome was assembled by splicing clean reads using Trinity [16]. For each gene, the longest transcript was designated as the Unigene for further analysis.
2.3 Unigene Functional Annotation
The Unigenes were queried against public databases for functional annotation based on sequence similarity. The quantity and percentage of annotated Unigenes were evaluated across various public databases, including Nt (E-value ≤ 1E − 5), Pfam (E-value ≤ 0.01), EuKaryotic Orthologous Groups (KOG)/Clusters of Orthologous Groups (COG) (E-value ≤ 1E − 3), Swiss-Prot (E-value ≤ 1E − 5), Kyoto Encyclopedia of Genes and Genomes (KEGG) (E-value ≤ 1E − 10), and Gene Ontology (GO) (E-value ≤ 1E − 6).
2.4 Quantitative Analysis of Gene Expression Levels
Gene expression levels of the samples were quantified using RSEM, with a threshold of FPKM > 0.3 employed to determine gene expression [17]. The FPKM method is currently the most widely adopted approach for gene expression quantification [18].
The differential expression analysis between two samples was conducted using the DESeq (2010) R package. The p-value was adjusted using q-value [19]. A threshold of p-adj < 0.05 and an absolute value of log2 (fold change) > 1 was established to determine significantly differentially expressed genes (DEGs).
2.5 Quantitative Real-Time PCR (qRT-PCR) Expression Profiling of Selected Genes
The total RNA was extracted from flesh samples using the plant RNA extraction kit (TaKaRa, Dalian, China). Following DNase Ⅰ treatment, cDNA synthesis was performed using the 1st Strand cDNA Synthesis Kit (TaKaRa, Dalian, China). For validation, twenty DEGs involved in viviparous plantlet development were selected for qRT-PCR analysis. Primers were designed using Primer 5.0 software and are presented in Table A1. Primer amplification efficiency was evaluated through PCR amplification, 3% agarose gel electrophoresis, sequencing, and qRT-PCR amplification curve analysis. The qRT-PCR analysis was conducted using TB Green® Premix Ex TaqTM II (TaKaRa, Dalian, China) on a CFX ConnectTM Real-Time System (BIO-RAD, Hercules, CA, USA). Each 20 μL reaction mixture contained 10 μL of TB Green Premix Ex Taq II, 0.8 μL of each primer (10 μM), 6 μL of 60-fold diluted cDNA, and 2.4 μL of water (TaKaRa, Dalian, China). The amplification program consisted of one cycle at 95°C for 30 s, followed by 40 cycles of 95°C for 5 s and 60°C for 20 s. The relative expression levels of the selected genes were normalized to the expression of B. vivipara β-actin and analyzed using the 2−ΔΔCT Method [20,21]. The qRT-PCR analysis for each gene was performed with six independent biological replicates and three technical repeats per biological replicate.
3.1 Illumina HiSeq mRNA Sequencing
The sequencing process yielded 452 million raw reads (Error < 0.01, GC > 47.3%) from the nine libraries. Of these, 439 million high-quality reads (Q > 20) were selected for further analysis. Notably, 61.65%–64.4% of the clean reads aligned with the de novo transcriptome sequence (Table 1). The assembly process generated 265,021 Unigenes (N50 ≥ 1312, N90 ≥ 444) from 338,770 transcripts (N50 ≥ 1206, N90 ≥ 335) across various developmental stages.

3.2 Correlation Analysis between Samples
Pearson’s correlation coefficient was employed to evaluate the correlation between evaluation indexes of samples [22]. The correlation coefficients of gene expression levels demonstrated strong repeatability among replicated samples within groups, particularly between IS-2 and IS-3, BS-2 and BS-3, and VS-1 and VS-2 (Fig. 2). Consequently, development-related DEGs were analyzed using IS-2, IS-3, BS-2, BS-3, VS-1, and VS-2.
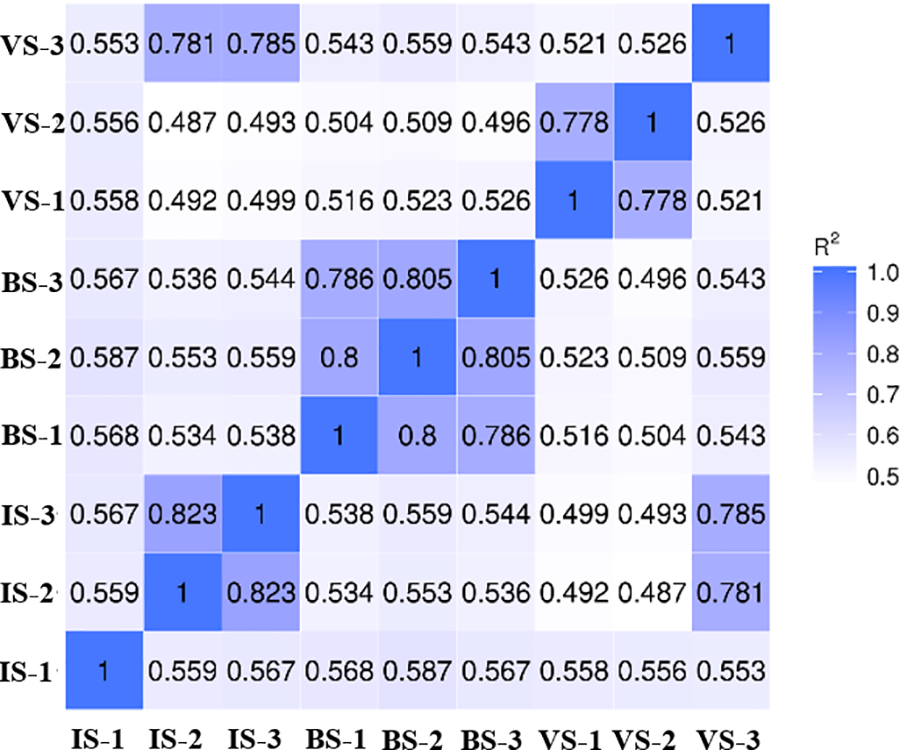
Figure 2: Correlation analysis of replicates among different groups
3.3 Functional Annotation and Classification of the Unigene
Of the 265,021 Unigenes, 20,782 were matched across all public databases, while 154,813 were matched in at least one public database (Table 2). Additionally, 99,344 Unigenes were annotated by GO assignments and categorized into 56 groups, encompassing Cellular Component (28.92%), Biological Process (47.91%), and Molecular Function (23.17%) (Fig. 3). The KOG function classification sorted 52,662 Unigenes into 26 sub-categories (Fig. 4). Furthermore, 56,240 Unigenes were classified into 19 sub-categories using the KEGG classification (Fig. 4).

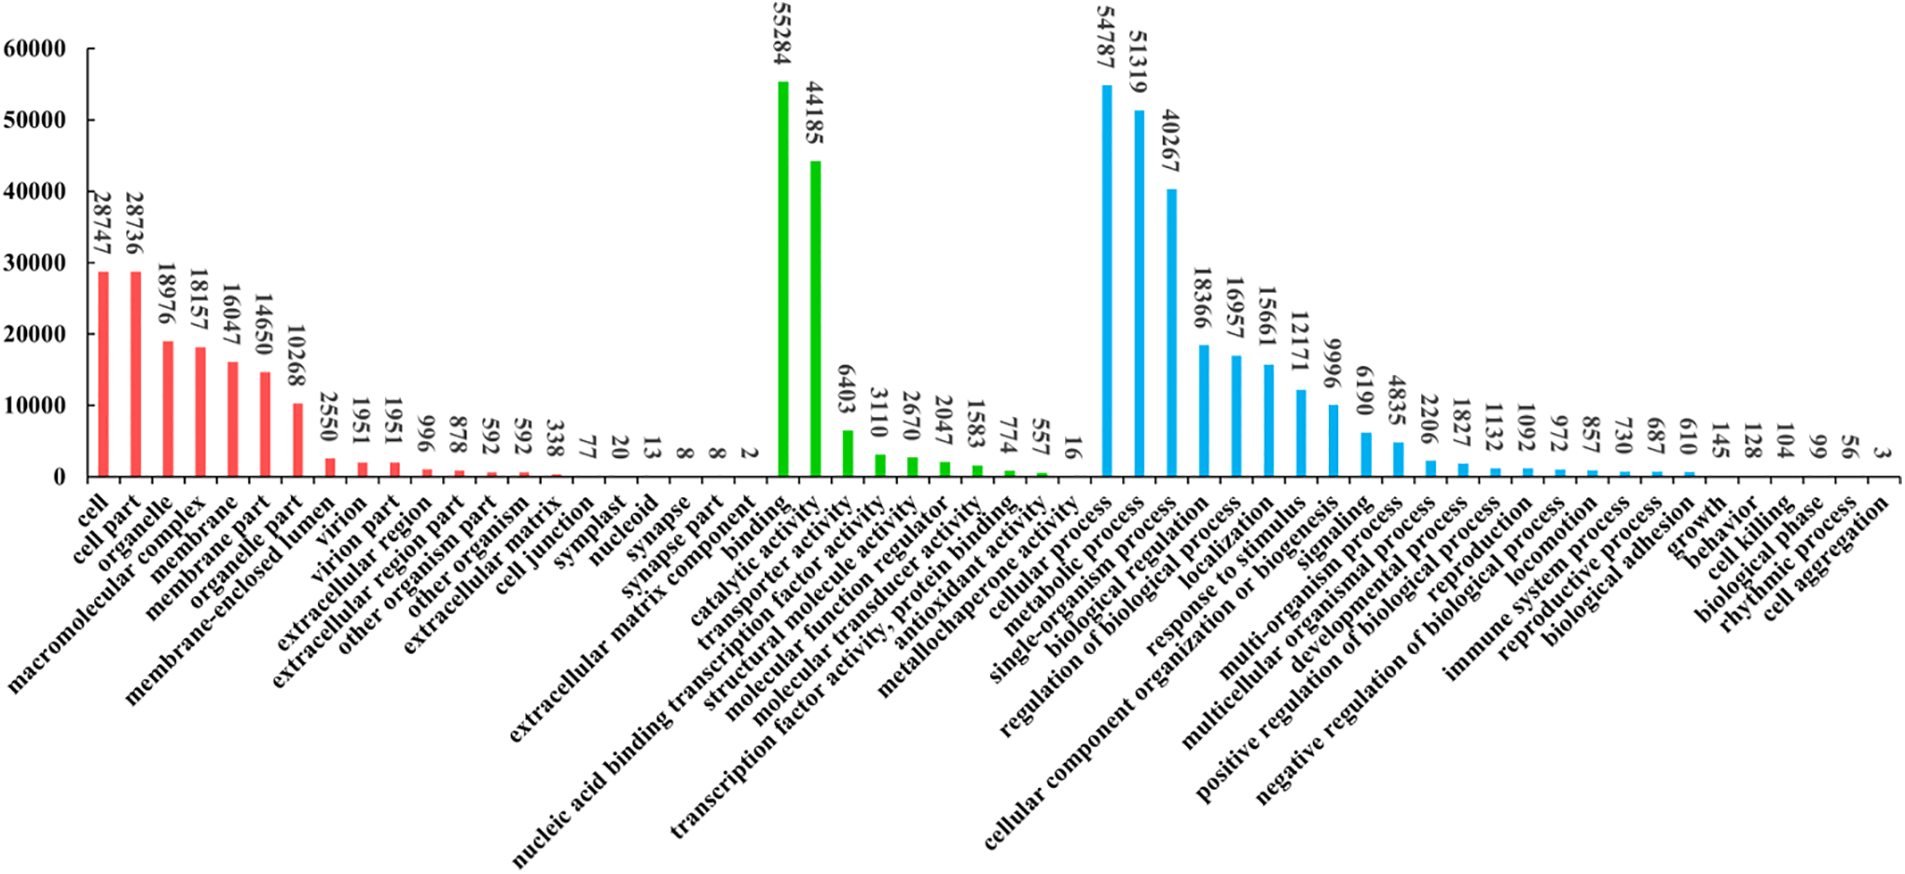
Figure 3: GO functional classification of Unigenes. The X-axis depicts the GO functional classification, while the Y-axis indicates the number of Unigenes. Red denotes cellular components, comprising 21 categories. Green represents Molecular Function, encompassing ten categories. Blue signifies Biological Process, consisting of 25 categories
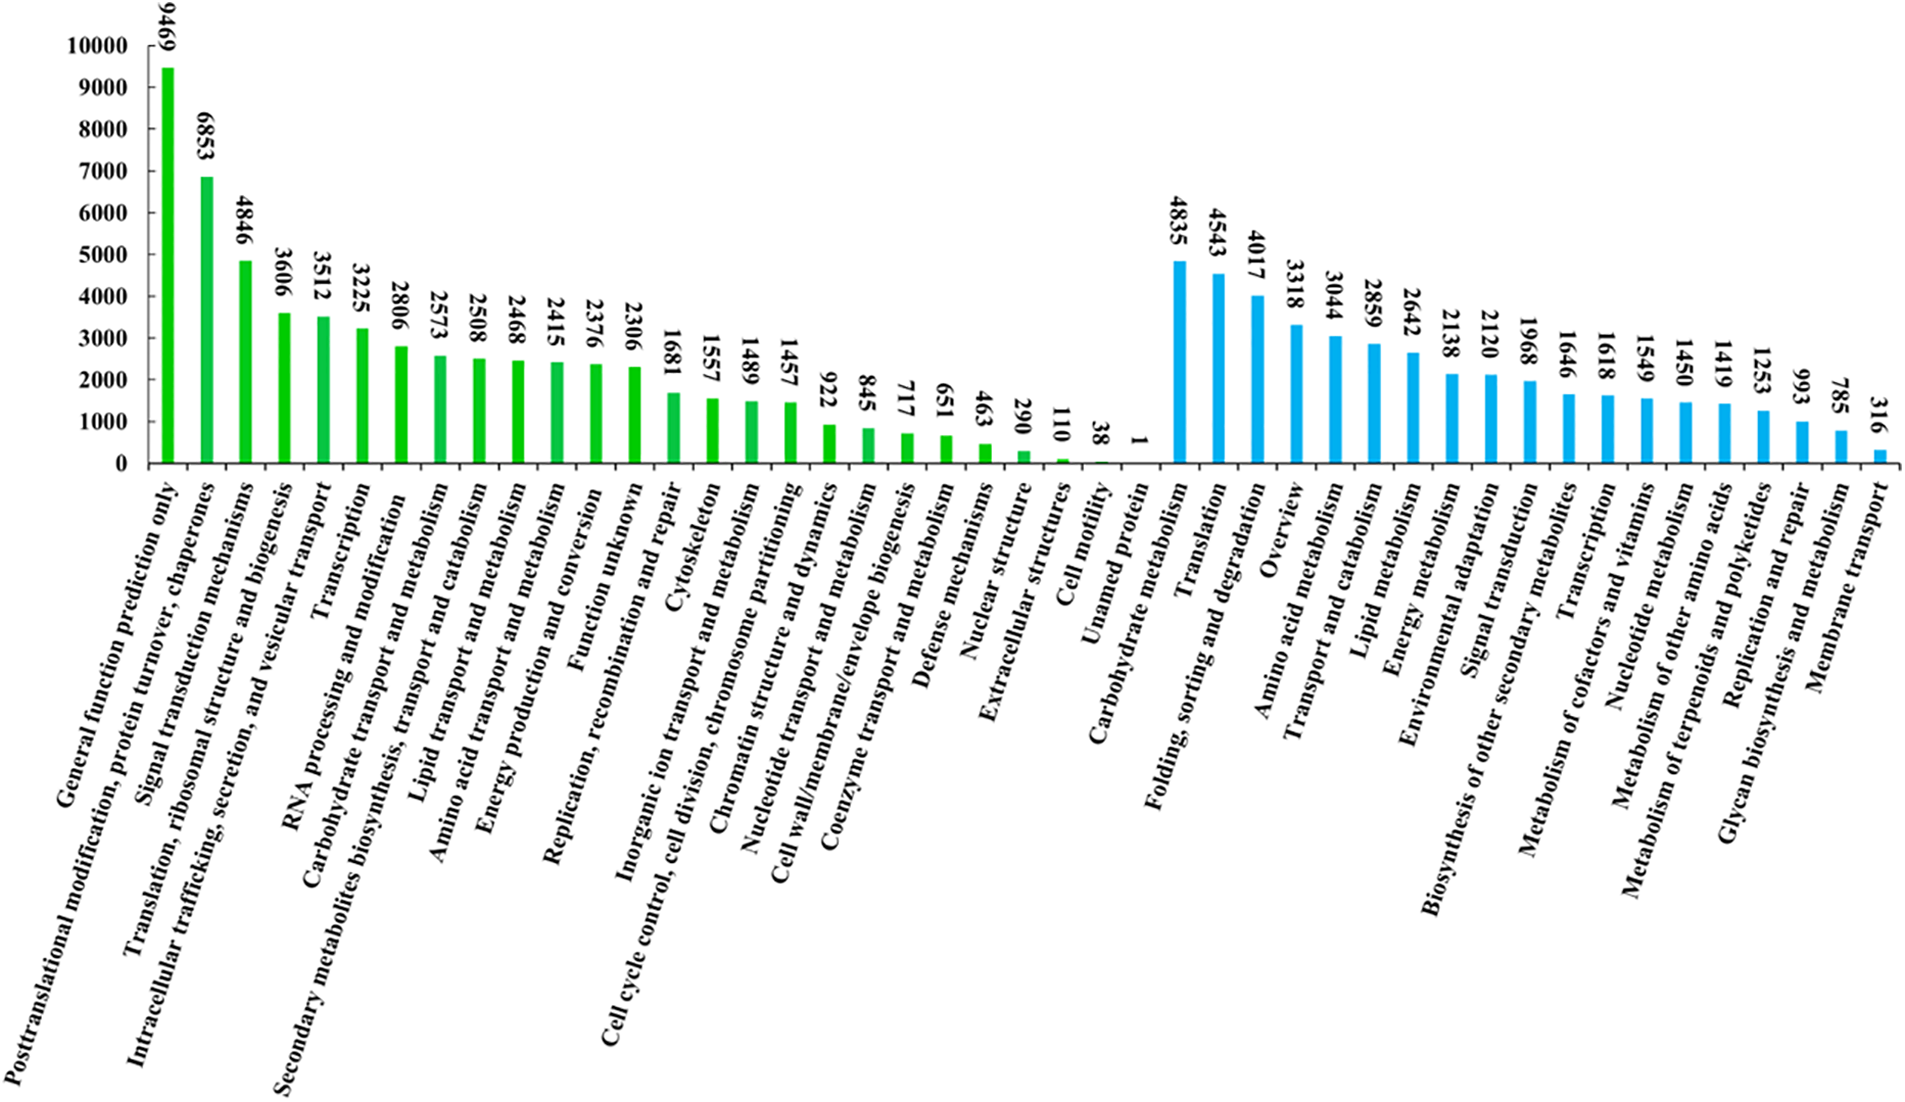
Figure 4: KOG and KEGG functional classification of Unigenes. The X-axis depicts the KOG and KEGG functional classifications, while the Y-axis depicts the number of Unigenes. Green denotes KOG, encompassing 26 categories. Blue represents KEGG, comprising 19 categories
3.4 DEGs at Different Developmental Stages
The differential gene expression across three developmental stages was analyzed, and DEGs were identified through pairwise comparisons of the nine libraries (Fig. 5). The analysis revealed 15,216 up-regulated DEGs in the VS vs. BS comparison, 13,225 in the BS vs. IS comparison, and 13,458 in the VS vs. IS comparison (Fig. 5b,d–f). Conversely, the analysis identified 13,303 down-regulated DEGs in the VS vs. BS comparison, 14,512 in the BS vs. IS comparison, and 13,212 in the VS vs. IS comparison (Fig. 5c–f). In aggregate, 49,731 genes exhibited differential expression across the three developmental stages (Fig. 5a). These findings suggest a substantial involvement of DEGs in the development of viviparous.
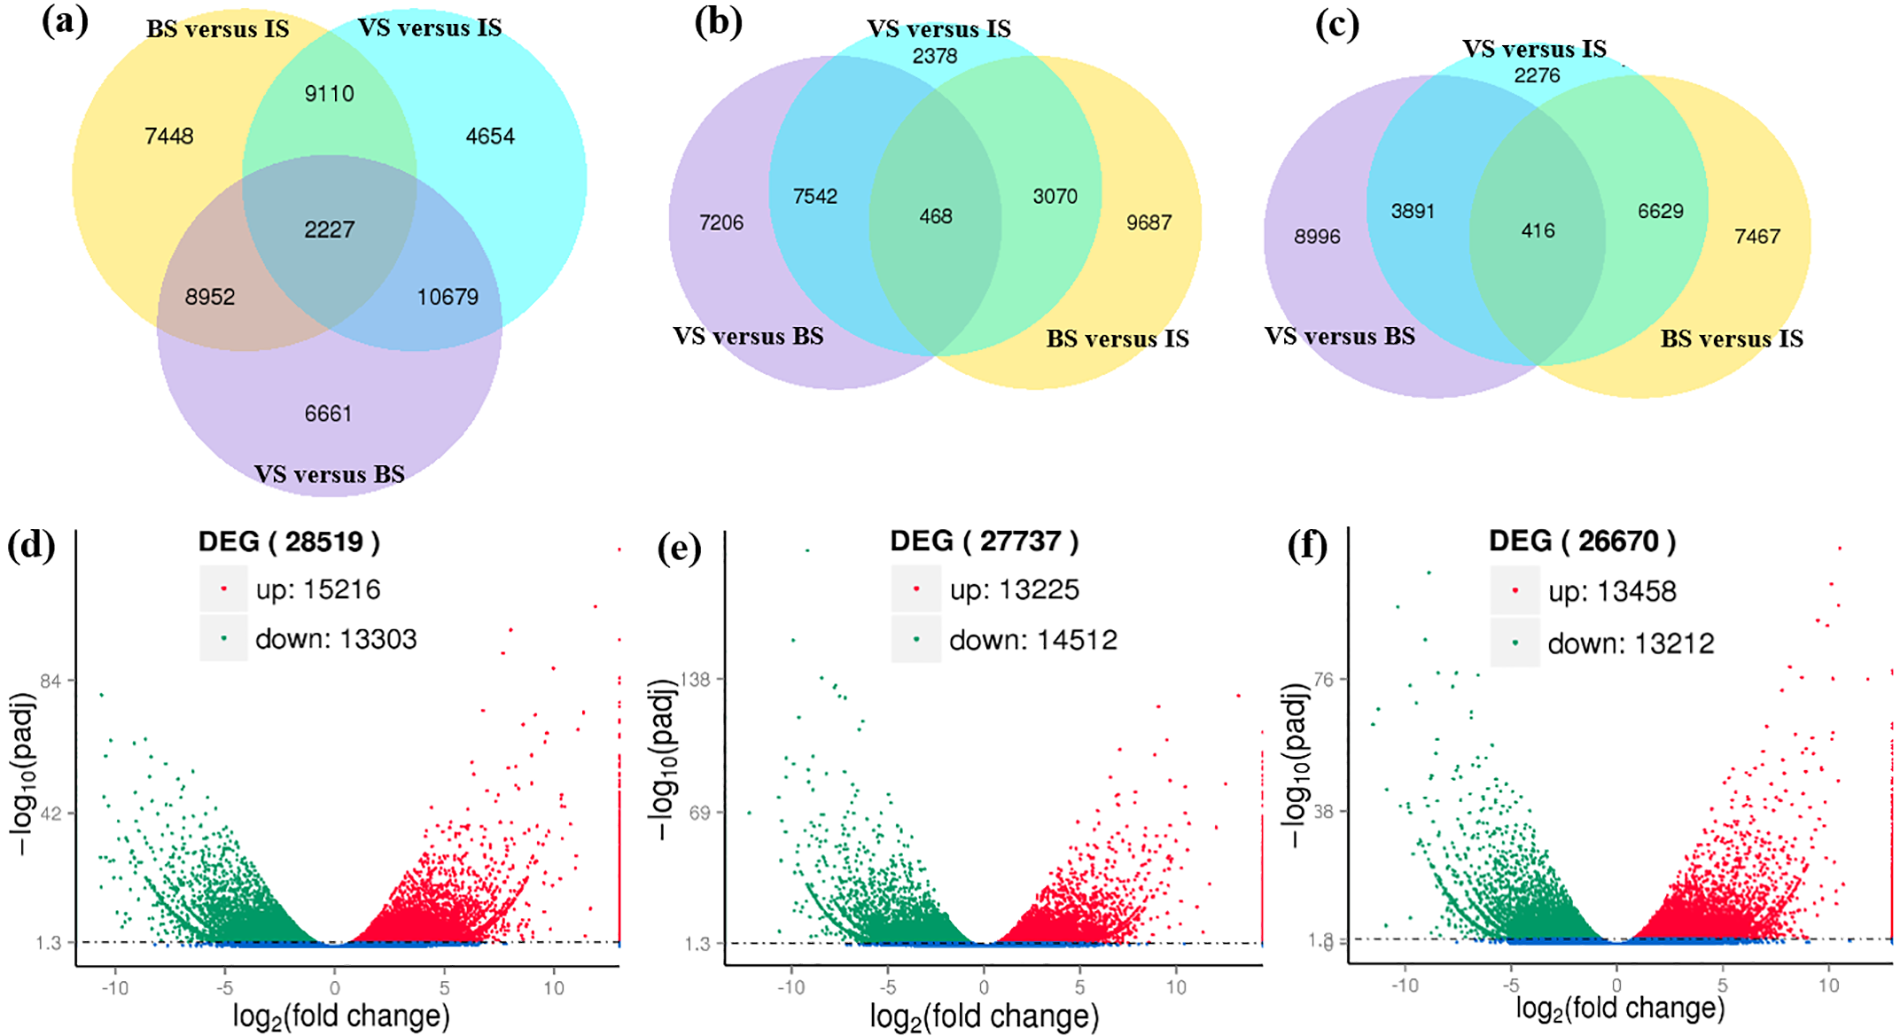
Figure 5: Overview of serial analysis of DEGs identified by pairwise comparisons of the nine transcriptomes: IS, BS, and VS. (a) Venn diagram illustrating DEGs at three developmental stages. (b) Venn diagram depicting up-regulated DEGs between VS and BS, BS and IS, and VS and IS, respectively. (c) Venn diagram showing down-regulated DEGs between VS and BS, BS and IS, and VS and IS, respectively. The individual and overlapping areas in each Venn diagram represent the number of specifically expressed and co-expressed genes between different developmental stages (a, b, c). (d–f) Volcano plot diagrams of DEGs between VS and BS, BS and IS, and VS and IS, with red and green colors indicating up-regulated and down-regulated transcripts, respectively
3.5 Functional Classification of DEGs during Viviparous Plantlet Development
We employed GO assignments to categorize the functions of DEGs in pairwise comparisons of cDNA libraries. The GO categories of DEGs exhibited significant differences in the comparisons of VS vs. BS, BS vs. IS, and VS vs. IS. In the BS vs. IS comparison, down-regulated DEGs were enriched in ‘microtubule-related functions’, ‘copper ion binding’, ‘tetrapyrrole binding’, and ‘serine-type carboxypeptidase activity’, while up-regulated DEGs were enriched in ‘oxidation-reduction process’, ‘hormone metabolic process’, ‘tetrapyrrole binding’, ‘response to water’, ‘metabolic process’, ‘response to abiotic stimulus’, and ‘iron ion binding’. In the VS vs. IS comparison, down-regulated DEGs were enriched in ‘translation-related functions’, ‘biosynthetic process’, ‘tetrapyrrole binding’, ‘copper ion binding’, ‘oxidation-reduction process’, ‘cytoplasm related functions’, and ‘metabolic process’, while up-regulated DEGs were enriched in ‘oxidation-reduction process’, ‘macromolecule modification’, ‘metabolic process’, ‘response to auxin’, ‘transmembrane transport’, ‘response to biotic stimulus’, ‘ion binding’, ‘tetrapyrrole binding’, and ‘glutamine biosynthetic process’. In the VS vs. BS comparison, down-regulated DEGs were enriched in ‘translation-related functions’, ‘steroid related’, ‘oxidation-reduction process’, ‘metabolic process’, ‘cytoplasmic-related functions’, ‘structural molecule activity’, and ‘starch binding’, while up-regulated DEGs were enriched in ‘oxidation-reduction process’, ‘macromolecule modification’, ‘metabolic process’, ‘kinase activity’, ‘photosynthesis’, ‘ion binding’, ‘adenyl ribonucleotide binding’, ‘tetrapyrrole binding’, ‘polysaccharide binding’, ‘defense response’, and ‘transport’. Further analysis of the overrepresented GO functions within each cluster revealed significant enrichment of genes associated with ‘metabolic process’ and ‘biosynthetic process’. Certain GO terms were enriched in particular clusters, including ‘heme binding’, ‘tetrapyrrole binding’, ‘glutamine biosynthetic process’, and ‘steroid metabolic process’, which were enriched specifically in the comparisons of VS vs. BS, BS vs. IS, and VS vs. IS. To further explore the biological pathways associated with the DEGs, we conducted a KEGG analysis. This analysis revealed that the DEGs were involved in pathways such as ‘phenylpropanoid biosynthesis’, ‘plant hormone signal transduction’, ‘protein processing’, ‘starch and sucrose metabolism’, and ‘plant-pathogen interaction’.
3.6 Identification of DEGs Involved in Viviparous Plantlet Development
Previous studies have identified DEGs involved in plant hormones, phytochromes, enzymes, and transcription factors as being associated with plant development [23–26]. In this study, we identified putative homologs of these genes in B. vivipara. Nineteen classes of DEGs related to the development of B. vivipara were identified in comparisons of VS vs. BS, BS vs. IS, and VS vs. IS (Fig. 6). These DEGs exhibited distinct expression patterns during different developmental periods. In the IS vs. BS comparison, 48 DEGs were identified and grouped into 15 categories, including enzymes associated with secondary metabolites, embryogenesis and cell division, plant hormones, proteins, and transcription factors that regulate plant growth (Fig. 6a). The comparison between BS and VS yielded 61 DEGs classified into 16 categories (Fig. 6b). In the VS vs. IS comparison, 56 DEGs were identified and grouped into 15 categories (Fig. 6c). Furthermore, variations in expression types and levels of DEGs were observed across different developmental stages (Fig. 6a–c). Cluster-22162. (42282, 208449, 133388, 110919, 46118, 214884, 32166) showed differences only in the IS and BS comparison. Cluster-22162. (183713, 14777, 106603, 106607, 86809, 110915, 218977, 120903, 122741, 127615), Cluster-22404.0, and Cluster-6515.0 revealed differences only in the BS and VS comparison. Cluster-22162. (90417, 76686, 149199, 199887, 110908, 66968, 46184, 200698, 149633, 204391, 160297, 160155) exhibited differences only in the IS and VS comparison.
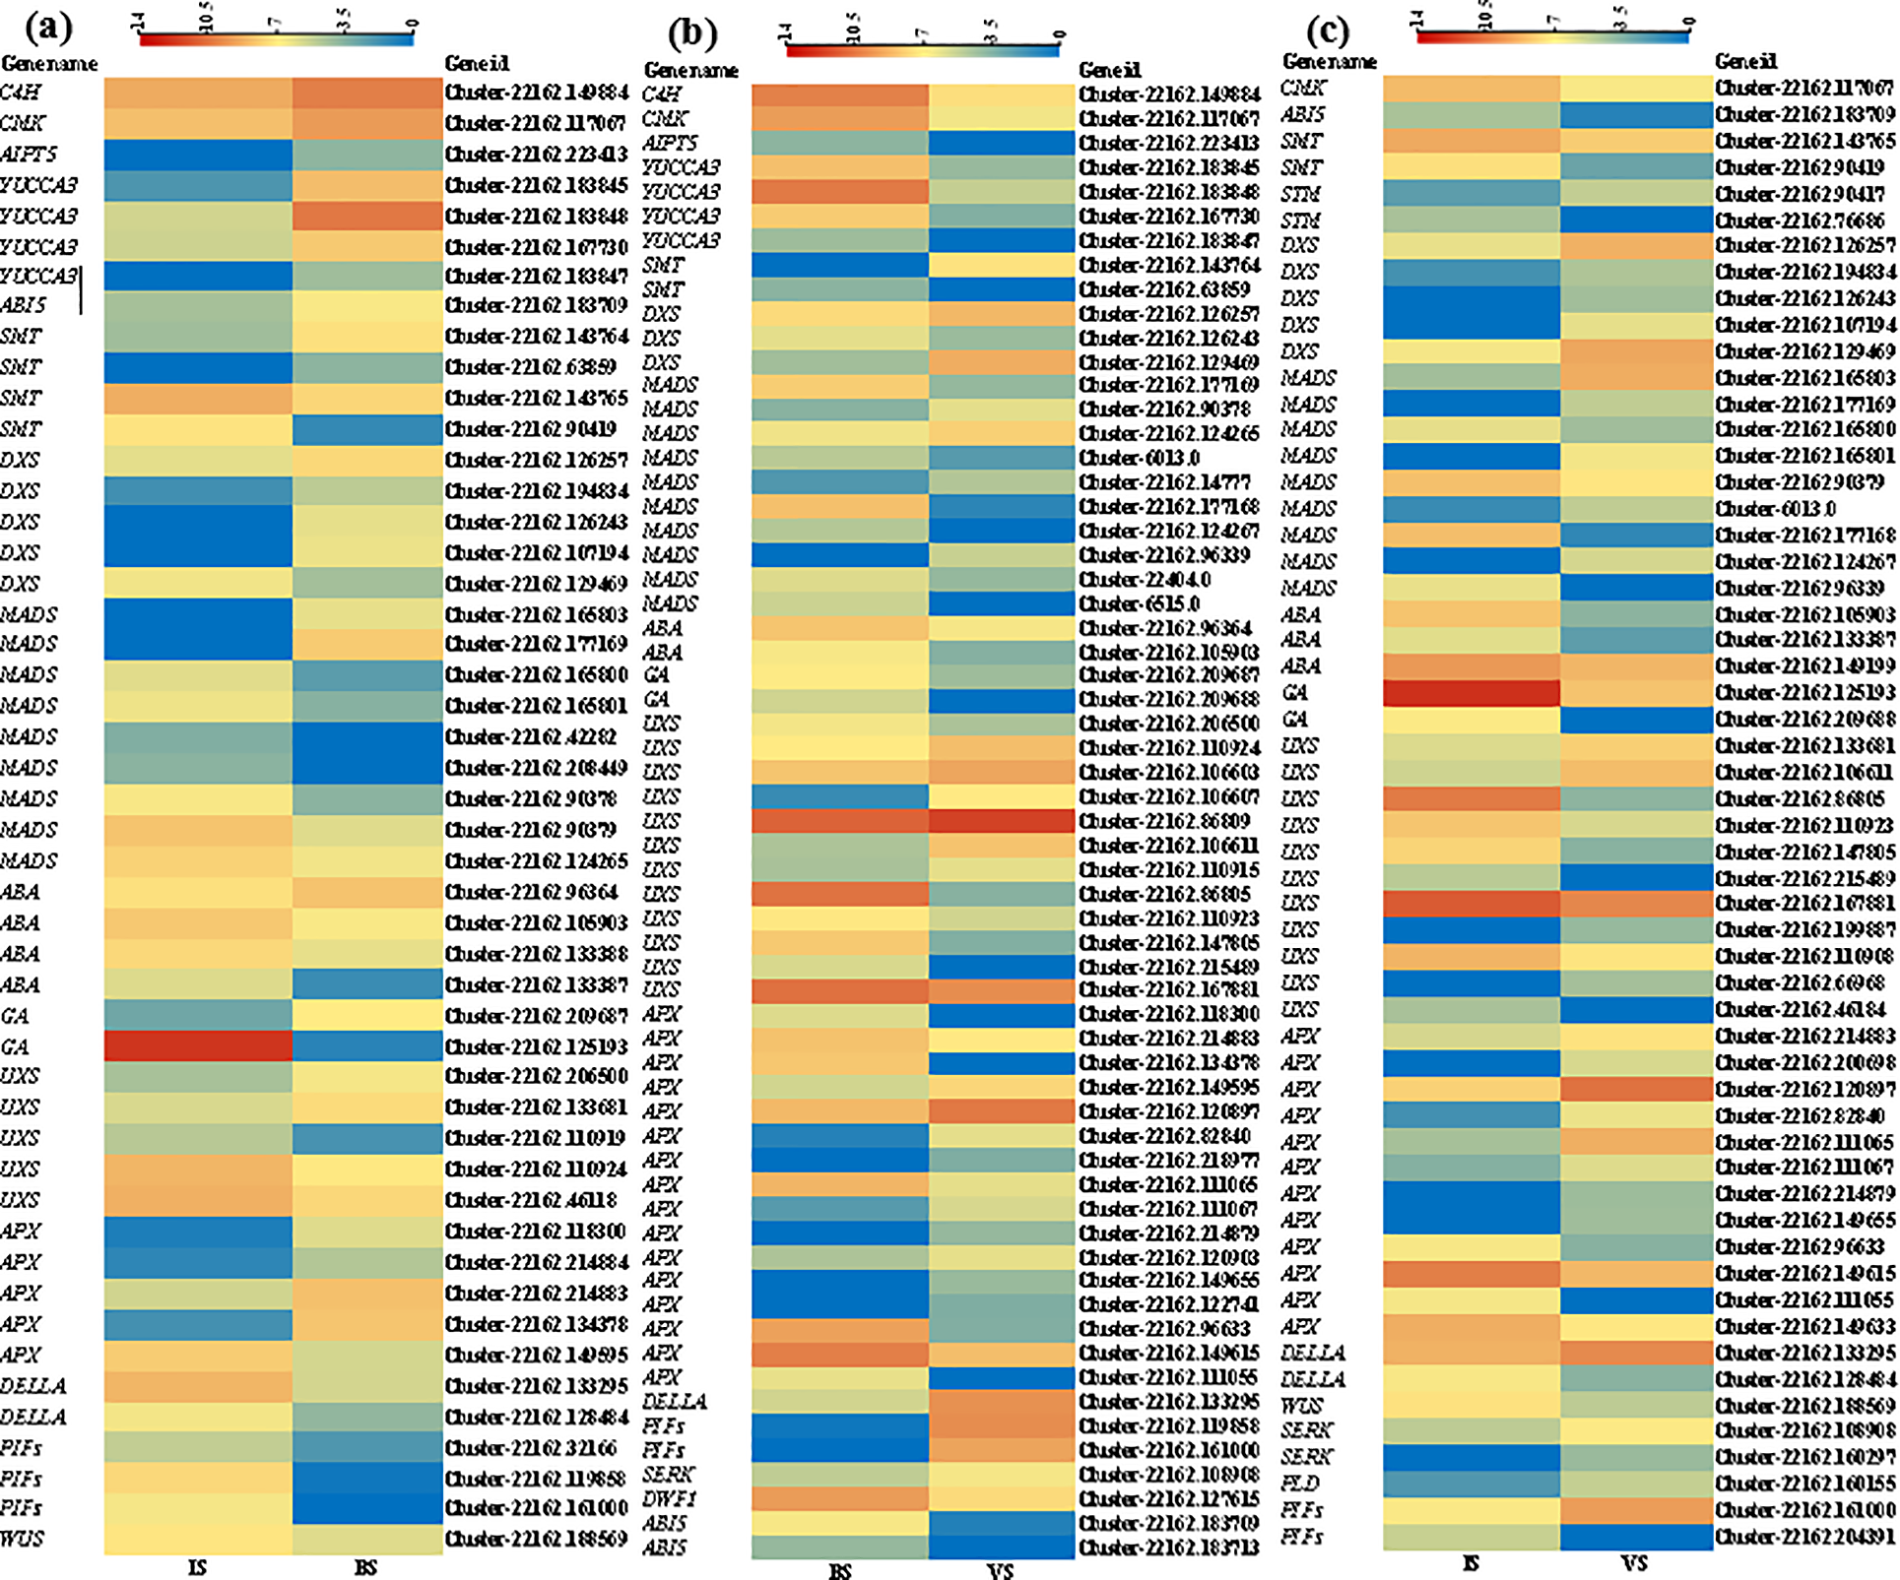
Figure 6: The heatmap of DEGs was found to be associated with developmental processes. (a–c) The heatmaps illustrate the comparative analysis between VS and BS, BS and IS, and VS and IS, respectively
3.7 Verification of the Gene Expression through qRT-PCR
To identify the DEGs associated with viviparous plantlet development, we selected 20 candidate genes for verification using qRT-PCR. Statistical analysis of the results revealed that 17 of these genes exhibited significantly different expressions (p ≤ 0.05; Fig. 7). Moreover, 12 genes demonstrated significant correlations between the qRT-PCR data and RNA sequencing (RNA-seq) results, indicating good reproducibility between the transcript abundance measured by RNA-seq and the expression profile obtained from RT-qPCR. These genes include Cinnamate 4-hydroxylase (C4H) (Cluster-22162.149884), CMK (Cluster-22162.117067), DXS (Cluster-22162.126257), DELLA (Cluster-22162.133295), plantlets. Phospholipase D (PLD) (Cluster-22162.160155), somatic embryogenesis receptor-like kinase (SERK) (Cluster-22162.108908), DXS (Cluster-22162.126243), Sterol C24-methyltransferase (SMT) (Cluster-22162.143764), UDP-glucuronic acid decarboxylase (UXS) (Cluster-22162.206500), Delta24-sterol reductase (DWF1) (Cluster-22162.127615), Abscisic acid (ABA) Insensitive 5 (ABI5) (Cluster-22162.183709) and Ascorbate peroxidase (APX) (Cluster-22162.214879) (Figs. 6 and 7).
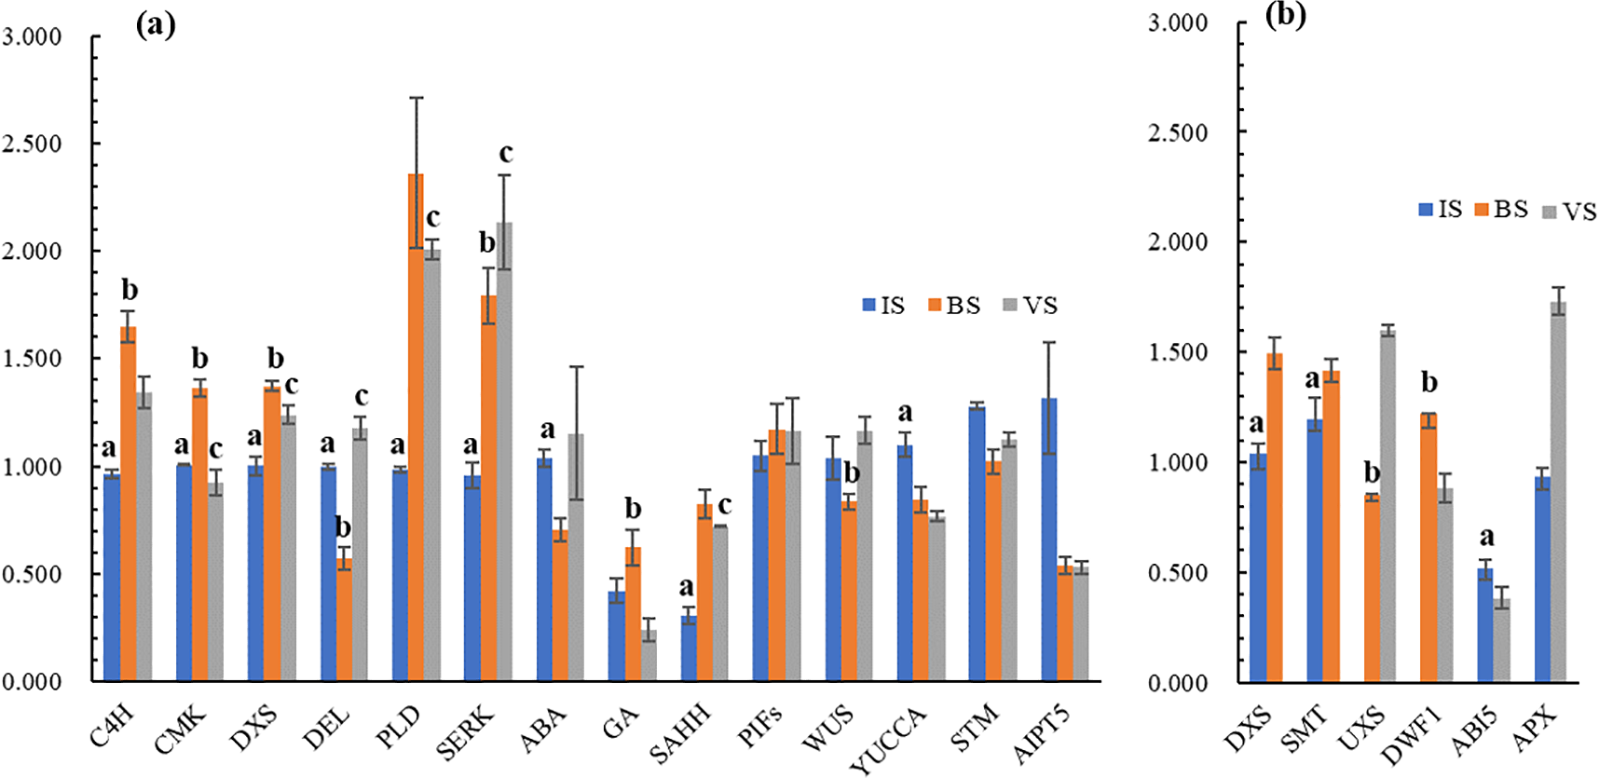
Figure 7: The qRT-PCR validation of 14 candidate genes across three developmental stages: IS, BS, and VS. (a) The left Y-axis represents relative gene expression levels determined by RT-qPCR. Expression values were normalized by setting the expression of IS1 to 1 for each gene. The lowercase letter a denotes significant differences between IS and BS at p ≤ 0.05. The lowercase letter b indicates significant differences between BS and VS at p ≤ 0.05. The lowercase letter c signifies significant differences between VS and IS at p ≤ 0.05. (b) The left Y-axis represents relative gene expression levels determined by RT-qPCR. For the IS vs. BS comparison, expression values were normalized by setting IS1 expression to 1 for each gene. For BS vs. VS, BS1 expression was set to 1, and for IS vs. VS, IS1 expression was set to 1. Lowercase letters indicate the same significance levels as described in Fig. 7a
Numerous flowering plants that inhabit harsh environments employ dual reproductive strategies: asexual and sexual reproduction. Vivipary, a result of long-term adaptation to environmental stressors such as drought, extreme temperatures, salinity, reduced insect diversity and activity, and shortened growing seasons, represents a crucial reproductive pathway [4]. Vegetative organ vivipary constitutes a distinct form of plant asexual reproduction. B. vivipara, widely distributed across shrub and alpine meadow habitats in the QTP, predominantly reproduces via bulbils, rendering it an ideal subject for comparative studies of plant adaptive mechanisms to climate change across diverse environments [14].
The study aimed to elucidate the molecular mechanisms underlying vegetative organ vivipary in B. vivipara. Transcriptome analysis identified 19 classes of DEGs associated with B. vivipara development across three comparisons: VS vs. BS, BS vs. IS, and VS vs. IS (Fig. 6). Two key enzymes, 1-Deoxy-D-xylulose-5-phosphate synthase (DXS) and 4-diphosphocytidyl-2-C-methyl-D-erythritol kinase (CMK), play crucial roles in terpenoid biosynthesis via the 1-deoxy-D-xylulose-5-phosphate (DXP) pathway. Terpenoids are essential for plant respiration, phytohormone regulation, and overall growth and development [25]. The DXS gene is particularly significant in synthesizing terpenoid secondary metabolites and acts as a key regulatory point for downstream products. Multiple copies of DXS within a species may have distinct functions. Notably, Cluster-22162 (126257, 126243) exhibits continuous upregulation throughout the developmental process. The varied expression patterns of other DXS genes may indicate differences in the types or quantities of substances required for IS, BS, and VS development.
C4H, a key enzyme in the phenylpropanoid pathway, plays a significant role in plant development [27,28]. Cytokinin, an essential hormone for plant growth and development, relies on adenylate isopentenyltransferase 5 (AIPT5) as a crucial enzyme for its biosynthesis [29]. Indole-3-pyruvate monooxygenase (YUCCA3) is instrumental in auxin biosynthesis and plays a vital role in embryogenesis and somatic embryo induction [30]. The notable upregulation of Cluster-22162.149884, AIPT5 (Cluster-22162.223413), and YUCCA3 (Cluster-22162.183845, 183848, 167730, 183847) in BS indicates their critical involvement in bulbil formation.
SMT plays a crucial role in plant growth and development, participating in steroid biosynthesis [31]. DELLA protein acts as a key negative regulator of gibberellin (GA) signaling [32]. ABA and GA are plant hormones that regulate various essential aspects of plant growth and development. ABI5 is essential for regulating seed germination and early seedling growth in response to ABA and abiotic stresses [23,33]. DWF1 is a sterol hormone that significantly influences plant growth and development regulation. The expression patterns and types of these hormone synthesis-related genes exhibit notable differences, indicating a complex regulatory pattern of plant hormones in vegetative reproduction. The specific mechanisms involved warrant further investigation.
Phytochrome interacting factor 3 (PIF3) is a central regulator of plant growth and development [24]. PIFs are key regulators of photomorphogenic development and play a crucial role in promoting stem growth [26]. The expression of PIF3 (Cluster-22162.161000) initially decreases and subsequently increases, with peak expression observed in VS, suggesting this gene’s significant role in viviparous plantlet development. Phospholipase D (PLD) is involved in root hair growth and development [34,35]. The expression of PLD (Cluster-22162.160155) significantly increases in VS, indicating its role in promoting root development in viviparous plantlets.
The SERK plays a regulatory role in plant growth and development by encoding the leucine-rich-repeat receptor-like kinase (LRR-RLK) [36]. WUSCHEL (WUS) and SHOOT MERISTEMLESS (STM) are crucial for maintaining the undifferentiated state of stem cells in the shoot meristem [37]. Analysis of gene expression differences reveals that WUS (Cluster-22162.188569) and STM (Cluster-22162.76686) exhibit significantly higher expression in IS compared to BS and VS, suggesting their critical roles in maintaining stem cell states and establishing the foundations for bulbil development. Moreover, SERK (Cluster-22162.108908) shows significantly higher expression in VS compared to IS and BS, indicating its potential role in regulating the differentiation of various tissue cells during viviparous plantlet development.
MADS proteins are involved in developmental control and signal transduction in plants [38]. APX participates in numerous growth processes, including lateral root formation, nodule development, leaf senescence, seed germination, and programmed cell death, and plays a crucial role in plant responses to environmental stimuli [39]. UXS contributes significantly to cellular growth and differentiation, as well as plant morphology and architecture [40]. Among the development-related DEGs, these three categories of genes exhibit the highest number of expressed genes, with complex expression types and patterns. The mechanisms underlying these processes require further investigation.
Through a comparative transcriptome analysis of three distinct developmental stages, this study has initially elucidated that the vivipary of B. vivipara is associated with phenylpropanoid biosynthesis, plant hormone signal transduction, protein processing, starch and sucrose metabolism, and plant-pathogen interaction. This investigation establishes a foundation for further research on vegetative organ vivipary and the adaptive mechanisms of B. vivipara to its environment.
Acknowledgement: None.
Funding Statement: This work was financially supported by the National Natural Science Foundation of China (31960222) and the Qinghai Provincial Major Science and Technology Special Funds (2023-NK-A3).
Author Contributions: Tao He: Project Administration, Supervision, Review and Editing. Weimin Zhao: Conceptualization, Methodology, Investigation; Writing—Original Draft. Guomin Shi: Project Administration, Investigation and Editing. Jialei Guo, Guifang He, Peilan Li, Xiaoying Ren, Leqi Yang, Taikun Qi: Investigation; Data Curation. All authors reviewed the results and approved the final version of the manuscript.
Availability of Data and Materials: The data that support the findings of this study are available from the corresponding author upon reasonable request.
Ethics Approval: Not applicable.
Conflicts of Interest: The authors declare no conflicts of interest to report regarding the present study.
Appendix A

References
1. Diggle PK, Meixner MA, Carroll AB, Aschwanden CF. Barriers to sexual reproduction in Polygonum viviparum: a comparative developmental analysis of P. viviparum and P. bistortoides. Ann Bot. 2002;89(2):145–56. doi:10.1093/aob/mcf020. [Google Scholar] [CrossRef]
2. Yao MQ, Chen WW, Kong JH, Zhang XL, Shi NN, Zhong SL, et al. METHYLTRANSFERASE1 and ripening modulate Vivipary during tomato fruit development. Plant Physiol. 2020;183(4):1883–97. doi:10.1104/pp.20.00499. [Google Scholar] [PubMed] [CrossRef]
3. Cota-Sánchez JH. A compendium of vivipary in the Cactaceae: new reports, data, and research prospects. Braz J Bot. 2022;45:1001–27. doi:10.1007/s40415-022-00834-z. [Google Scholar] [CrossRef]
4. Ai XM, Chen LQ, Li YH, Xin ZY, Xie H. Research progress of vegetative Vivipary in plants. J Trop Subtrop Bot. 2020;28(2):209–16. doi:10.11926/jtsb.4124. [Google Scholar] [CrossRef]
5. Lee JA, Harmer R. Vivipary, a reproductive strategy in response to environmental stress? Oikos. 1980;35(2):254–65. doi:10.2307/3544433. [Google Scholar] [CrossRef]
6. Elmqvist T, Cox PA. The evolution of vivipary in flowering plants. Oikos. 1996;77(1):3–9. doi:10.2307/3545579. [Google Scholar] [CrossRef]
7. Cota-Sánchez HJ. Vivipary in the Cactaceae: its taxonomic occurrence and biological significance. Flora. 2004;199(6):481–90. doi:10.1078/0367-2530-00175. [Google Scholar] [CrossRef]
8. García-Beltrán JA, Barrios D, González-Torres LR, Cuza A, Toledo S. Vivipary in cuban cacti and an assessment of establishment success in Leptocereus scopulophilus. J Arid Environ. 2021;184:104322. doi:10.1016/j.jaridenv.2020.104322. [Google Scholar] [CrossRef]
9. Tomlinson PB, Cox PA. Systematic and functional anatomy of seedlings in mangrove Rhizophoraceae: vivipary explained? Bot J Linn Soc. 2000;134(1–2):215–31. doi:10.1006/bojl.2000.0371. [Google Scholar] [CrossRef]
10. Engell K. A preliminary morphological, mytological, and embryological investigation in Polygonum viviparum. Botanisk Tidsskrift. 1973;67:305–16. doi:10.2478/pbj-2013-0070. [Google Scholar] [CrossRef]
11. Fan DM, Yang YP. Altitudinal variations in flower and bulbil production of an alpine perennial, Polygonum viviparum L. (Polygonaceae). Plant Biol. 2009;11(3):493–7. doi:10.1111/j.1438-8677.2008.00188.x. [Google Scholar] [CrossRef]
12. Marcysiak K. Morphological differentiation of PoLygonum viviparum (polygonaceae) in European population. Pol Bot J. 2013;58(2):639–51. doi:10.2478/pbj-2013-0070. [Google Scholar] [CrossRef]
13. Bauert MR. Vivipary in Polygonum viviparum: an adaptation to cold climate? Nord J Bot. 1993;13(5):473–80. doi:10.1111/j.1756-1051.1993.tb00085.x. [Google Scholar] [CrossRef]
14. Zhang C, Li XT, An YM, Zhang ZH, Ren F, Zhou HK. Effects of experimental warming on vegetative and reproductive growth of Polygonum viviparum in the Qinghai-Tibet Plateau. Nord J Bot. 2021;39(11):1–7. doi:10.1111/njb.03157. [Google Scholar] [CrossRef]
15. Jiang FX, Huang YX, Wang LN, Zhou P, Sun DJ, Li X, et al. Explore and analysis of the mystery of plant bulblit. Mol Plant Breed. 2017;15(1):346–52. doi:10.13271/j.mpb.015.000346. [Google Scholar] [CrossRef]
16. Grabherr MG, Haas BJ, Yassour M, Levin JZ, Thompson DA, Amit I, et al. Full-length transcriptome assembly from RNA-Seq data without a reference genome. Nat Biotechnol. 2011;29(7):644–52. doi:10.1038/nbt.1883. [Google Scholar] [CrossRef]
17. Li B, Dewey CN. RSEM: accurate transcript quantification from RNA-Seq data with or without a reference genome. BMC Bioinform. 2011;12:323. doi:10.1186/1471-2105-12-323. [Google Scholar] [CrossRef]
18. Trapnell C, Williams BA, Pertea G, Mortazavi A, Kwan G, Baren MJ, et al. Transcript assembly and quantification by RNA-Seq reveals unannotated transcripts and isoform switching during cell differentiation. Nat Biotechnol. 2010;28(5):511–5. doi:10.1038/nbt.1621. [Google Scholar] [CrossRef]
19. Storey JD, Tibshirani R. Statistical significance for genome wide studies. Proc Natl Acad Sci U S A. 2003;100(16):9440–5. doi:10.1073/pnas.1530509100. [Google Scholar] [CrossRef]
20. Livak KJ, Schmittgen TD. Analysis of relative gene expression data using real-time quantitative PCR and the 2−ΔΔCT method. Methods. 2001;25(4):402–8. doi:10.1006/meth.2001.1262. [Google Scholar] [CrossRef]
21. Adnan M, Morton G, Hadi S. Analysis of rpoS and bolA gene expression under various stress-induced environments in planktonic and biofilm phase using 2−ΔΔCT method. Mol Cell Biochem. 2011;357(1–2):275–82. doi:10.1007/s11010-011-0898-y. [Google Scholar] [PubMed] [CrossRef]
22. Anders S, Huber W. Differential expression analysis for sequence count data. Genome Biol. 2010;11(10):R106. doi:10.1186/gb-2010-11-10-r106. [Google Scholar] [PubMed] [CrossRef]
23. Skubacz A, Daszkowska-Golec A, Szarejko I. The role and regulation of ABI5 (ABA-Insensitive 5) in plant development, abiotic stress responses and phytohormone crosstalk. Front Plant Sci. 2016;16(7):1884. doi:10.3389/fpls.2016.01884. [Google Scholar] [PubMed] [CrossRef]
24. Yang DD, Liu Y, Ali M, Ye L, Pan CT, Li MZ, et al. Phytochrome interacting factor 3 regulates pollen mitotic division through auxin signalling and sugar metabolism pathways in tomato. New Phytol. 2022;234(2):560–77. doi:10.1111/nph.17878. [Google Scholar] [PubMed] [CrossRef]
25. Tian SK, Wang DD, Yang L, Zhang ZX, Liu Y. A systematic review of 1-Deoxy-D-xylulose-5-phosphate synthase in terpenoid biosynthesis in plants. Plant Growth Regul. 2022;96:221–35. doi:10.1007/s10725-021-00784-8. [Google Scholar] [CrossRef]
26. Leivar P, Elena M. PIFs: systems integrators in plant development. Plant Cell. 2014;26(1):56–78. doi:10.1105/tpc.113.120857. [Google Scholar] [PubMed] [CrossRef]
27. Khatri P, Chen L, Rajcan I, Dhaubhadel S. Functional characterization of Cinnamate 4-hydroxylase gene family in soybean (Glycine max). PLoS One. 2023;18(5):e0285698. doi:10.1371/journal.pone.0285698. [Google Scholar] [PubMed] [CrossRef]
28. Yin LM, Liu C, Liang ZC, Liu DJ, Feng GJ, Yan ZS, et al. Transcriptome analysis of molecular mechanisms underlying phenotypic variation in Phaseolus vulgaris Mutant ‘nts’. Phyton-Int J Exp Bot. 2023;92(11):2981–98. doi:10.32604/phyton.2023.043151. [Google Scholar] [CrossRef]
29. Zhang LP, Li MH, Yan P, Fu JY, Zhang L, Li X, et al. A novel adenylate isopentenyltransferase 5 regulates shoot branching via the ATTTA motif in Camellia sinensis. Phytochemistry. 2021;21(1):521. doi:10.1186/s12870-021-03254-5. [Google Scholar] [CrossRef]
30. Kumaravel M, Uma S, Backiyarani S, Saraswathi MS, Vaganan MM, Muthusamy M, et al. Differential proteome analysis during early somatic embryogenesis in Musa spp. AAA cv. Grand Naine. Plant Cell Rep. 2017;36(1):163–78. doi:10.1007/s00299-016-2067-y. [Google Scholar] [PubMed] [CrossRef]
31. Guan HY, Zhao YJ, Su P, Tong YR, Liu YJ, Hu TY, et al. Molecular cloning and functional identification of sterol C24-methyltransferase gene from Tripterygium wilfordii. Acta Pharmaceutica Sinica B. 2017;7(5):603–9. doi:10.1016/j.apsb.2017.07.001. [Google Scholar] [PubMed] [CrossRef]
32. Yoshida H, Hirano K, Sato T, Mitsuda N, Nomoto M, Maeo K, et al. DELLA protein functions as a transcriptional activator through the DNA binding of the indeterminate domain family proteins. Proc Natl Acad Sci U S A. 2014;111(21):7861–6. doi:10.1073/pnas.1321669111. [Google Scholar] [CrossRef]
33. Hu GH, Chao MN, Zhou XR, Fu YZ. Comparative transcriptome analysis of seed germination of a cotton variety with high tolerance to low temperature. Phyton-Int J Exp Bot. 2023;92(9):2981–98. doi:10.32604/phyton.2023.030163. [Google Scholar] [CrossRef]
34. Wang XM. Regulatory functions of phospholipase D and phosphatidic acid in plant growth, development, and stress responses. Plant Physiol. 2005;139(2):566–73. doi:10.1104/pp.105.068809. [Google Scholar] [PubMed] [CrossRef]
35. Lin DL, Yao HY, Jia LH, Tan JF, Xu ZH, Zheng WM, et al. Phospholipase D-derived phosphatidic acid promotes root hair development under phosphorus deficiency by suppressing vacuolar degradation of PIN-FORMED2. New Phytol. 2020;226(1):142–55. doi:10.1111/nph.16330. [Google Scholar] [CrossRef]
36. Fan M, Wang MM, Bai MY. Diverse roles of SERK family genes in plant growth, development and defense response. Sci China Life Sci. 2016;59(9):889–96. doi:10.1007/s11427-016-0048-4. [Google Scholar] [CrossRef]
37. Su YH, Zhou C, Li YJ, Yu Y, Tang LP, Zhang WJ, et al. Integration of pluripotency pathways regulates stem cell maintenance in the Arabidopsis shoot meristem. Proc Natl Acad Sci U S A. 2020;117(36):22561–71. doi:10.1073/pnas.2015248117. [Google Scholar] [PubMed] [CrossRef]
38. Fatima M, Zhang XD, Lin JS, Zhou P, Zhou D, Ming R. Expression profiling of MADS-box gene family revealed its role in vegetative development and stem ripening in S. spontaneum. Sci Rep. 2020;10(1):20536. doi:10.1038/s41598-020-77375-6. [Google Scholar] [CrossRef]
39. Li SC. Novel insight into functions of ascorbate peroxidase in higher plants: more than a simple antioxidant enzyme. Redox Biol. 2023;64:102789. doi:10.1016/j.redox.2023.102789. [Google Scholar] [PubMed] [CrossRef]
40. Kuang BQ, Zhao XH, Zhou C, Zeng W, Ren JL, Ebert B, et al. Role of UDP-glucuronic acid decarboxylase in Xylan biosynthesis in Arabidopsis. Mol Plant. 2016;9(8):1119–31. doi:10.1016/jmolp.2016.04.013. [Google Scholar] [CrossRef]
Cite This Article
 Copyright © 2025 The Author(s). Published by Tech Science Press.
This work is licensed under a Creative Commons Attribution 4.0 International License , which permits unrestricted use, distribution, and reproduction in any medium, provided the original work is properly cited.


 Submit a Paper
 Propose a Special lssue
 View Full Text
 Download PDF
 Downloads
 Citation Tools