
 Submit a Paper
 Propose a Special lssue
 Open Access
ARTICLE
High Throughput Image Analysis between Seed Traits Opens New Breeding Avenues in Tartary Buckwheat Germplasm
1 BK21 FOUR R&E Center for Plant Biotechnology, Korea University, Seoul, 02841, Republic of Korea
2 Department of Plant Resources and Environment, Jeju National University, Jeju, 63243, Republic of Korea
3 Department of Practical Course Education, Cheongju National University of Education, Cheongju, 28708, Republic of Korea
4 National Agrobiodiversity Center, Rural Development Administration (RDA), Jeonju, 54875, Republic of Korea
* Corresponding Authors: Wook Kim. Email: ; Yong Suk Chung. Email:
# These two authors contributed equally to this work
Phyton-International Journal of Experimental Botany 2024, 93(9), 2339-2347. https://doi.org/10.32604/phyton.2024.056439
Received 23 July 2024; Accepted 21 August 2024; Issue published 30 September 2024
 View Full Text
 Download PDF
Abstract
Recognizing the variation of genetic resources is the first step in selection. One of the most important variations in grain crops is the uniformity of seed grain weight, which can be converted into seed size. However, it has been challenging since it needs high labor costs and time to measure it on a large scale. The current study used an image analysis technique to measure the grain seed area of about 100 seeds per accession with 64 germplasm of Tartary buckwheat (Fagopyrum tataricum) to study variation among and within them. To understand the nature of variation, skewness and kurtosis analysis of probability density function curve for seed area were used. As a result, a large variation among and within accessions was found. This means that the seed sizes within an accession are not uniform in this given cleistogamous species due to its non-uniform flowering time. This implies that the seed size should be considered an important factor for the germplasm enhancement program.Keywords
Various traits affect yield in cereal crops. Those traits include plant height [1,2], leaf area, total chlorophyll content [3], canopy temperature environment [4], disease resistance [5,6], thousand-kernel weight, and seed morphological traits [7]. Thus, they were heavily measured for germplasm enhancement for crop breeding. However, the uniform maturity of cereal crops has not been considered a major subject while it could be a crucial factor when the harvesting time is limited.
Grain sizes within the same plant could vary depending on the maturity rate [8] They are also correlated with the grain weight [9]. If the maturity time is uniform, the yield and even quality could increase. However, phenotyping grains is time and labor-consuming due to their small size. Thus, the sampling of them has been done on a small scale. However, the advent of high-throughput phenotyping technologies made it easier, faster, and more accurate [10]. Furthermore, it enables breeders to obtain parameters such as the area of the subjects that were not possible before via image analysis, which extracts the target subjects from the taken images to measure the parameters [11].
The study aims to demonstrate variations in grain sizes within the germplasm of Tartary buckwheat (Fagopyrum tataricum) using image analysis technology. This analysis underscores the importance of considering uniform maturity in the enhancement of germplasm quality. For this goal, skewness and kurtosis analysis of the probability density function curve for seed area were used. The results may lead to a new aspect of the breeding area through phenotyping traits.
2.1 Buckwheat Germplasm Preparation and Measurement
Sixty-four Tartary buckwheat germplasm accessions were provided by the Rural Development Administration (RDA) genebank, Jeonju-si, Republic of Korea. Five phenotypic characteristics, seed area, width, height, circularity, and roundness, were imaged for analysis. Values greater than 1.5 times the interquartile range considered outliers were dropped [12]. The parameter was utilized in this study in area in mm2 (Fig. 1).
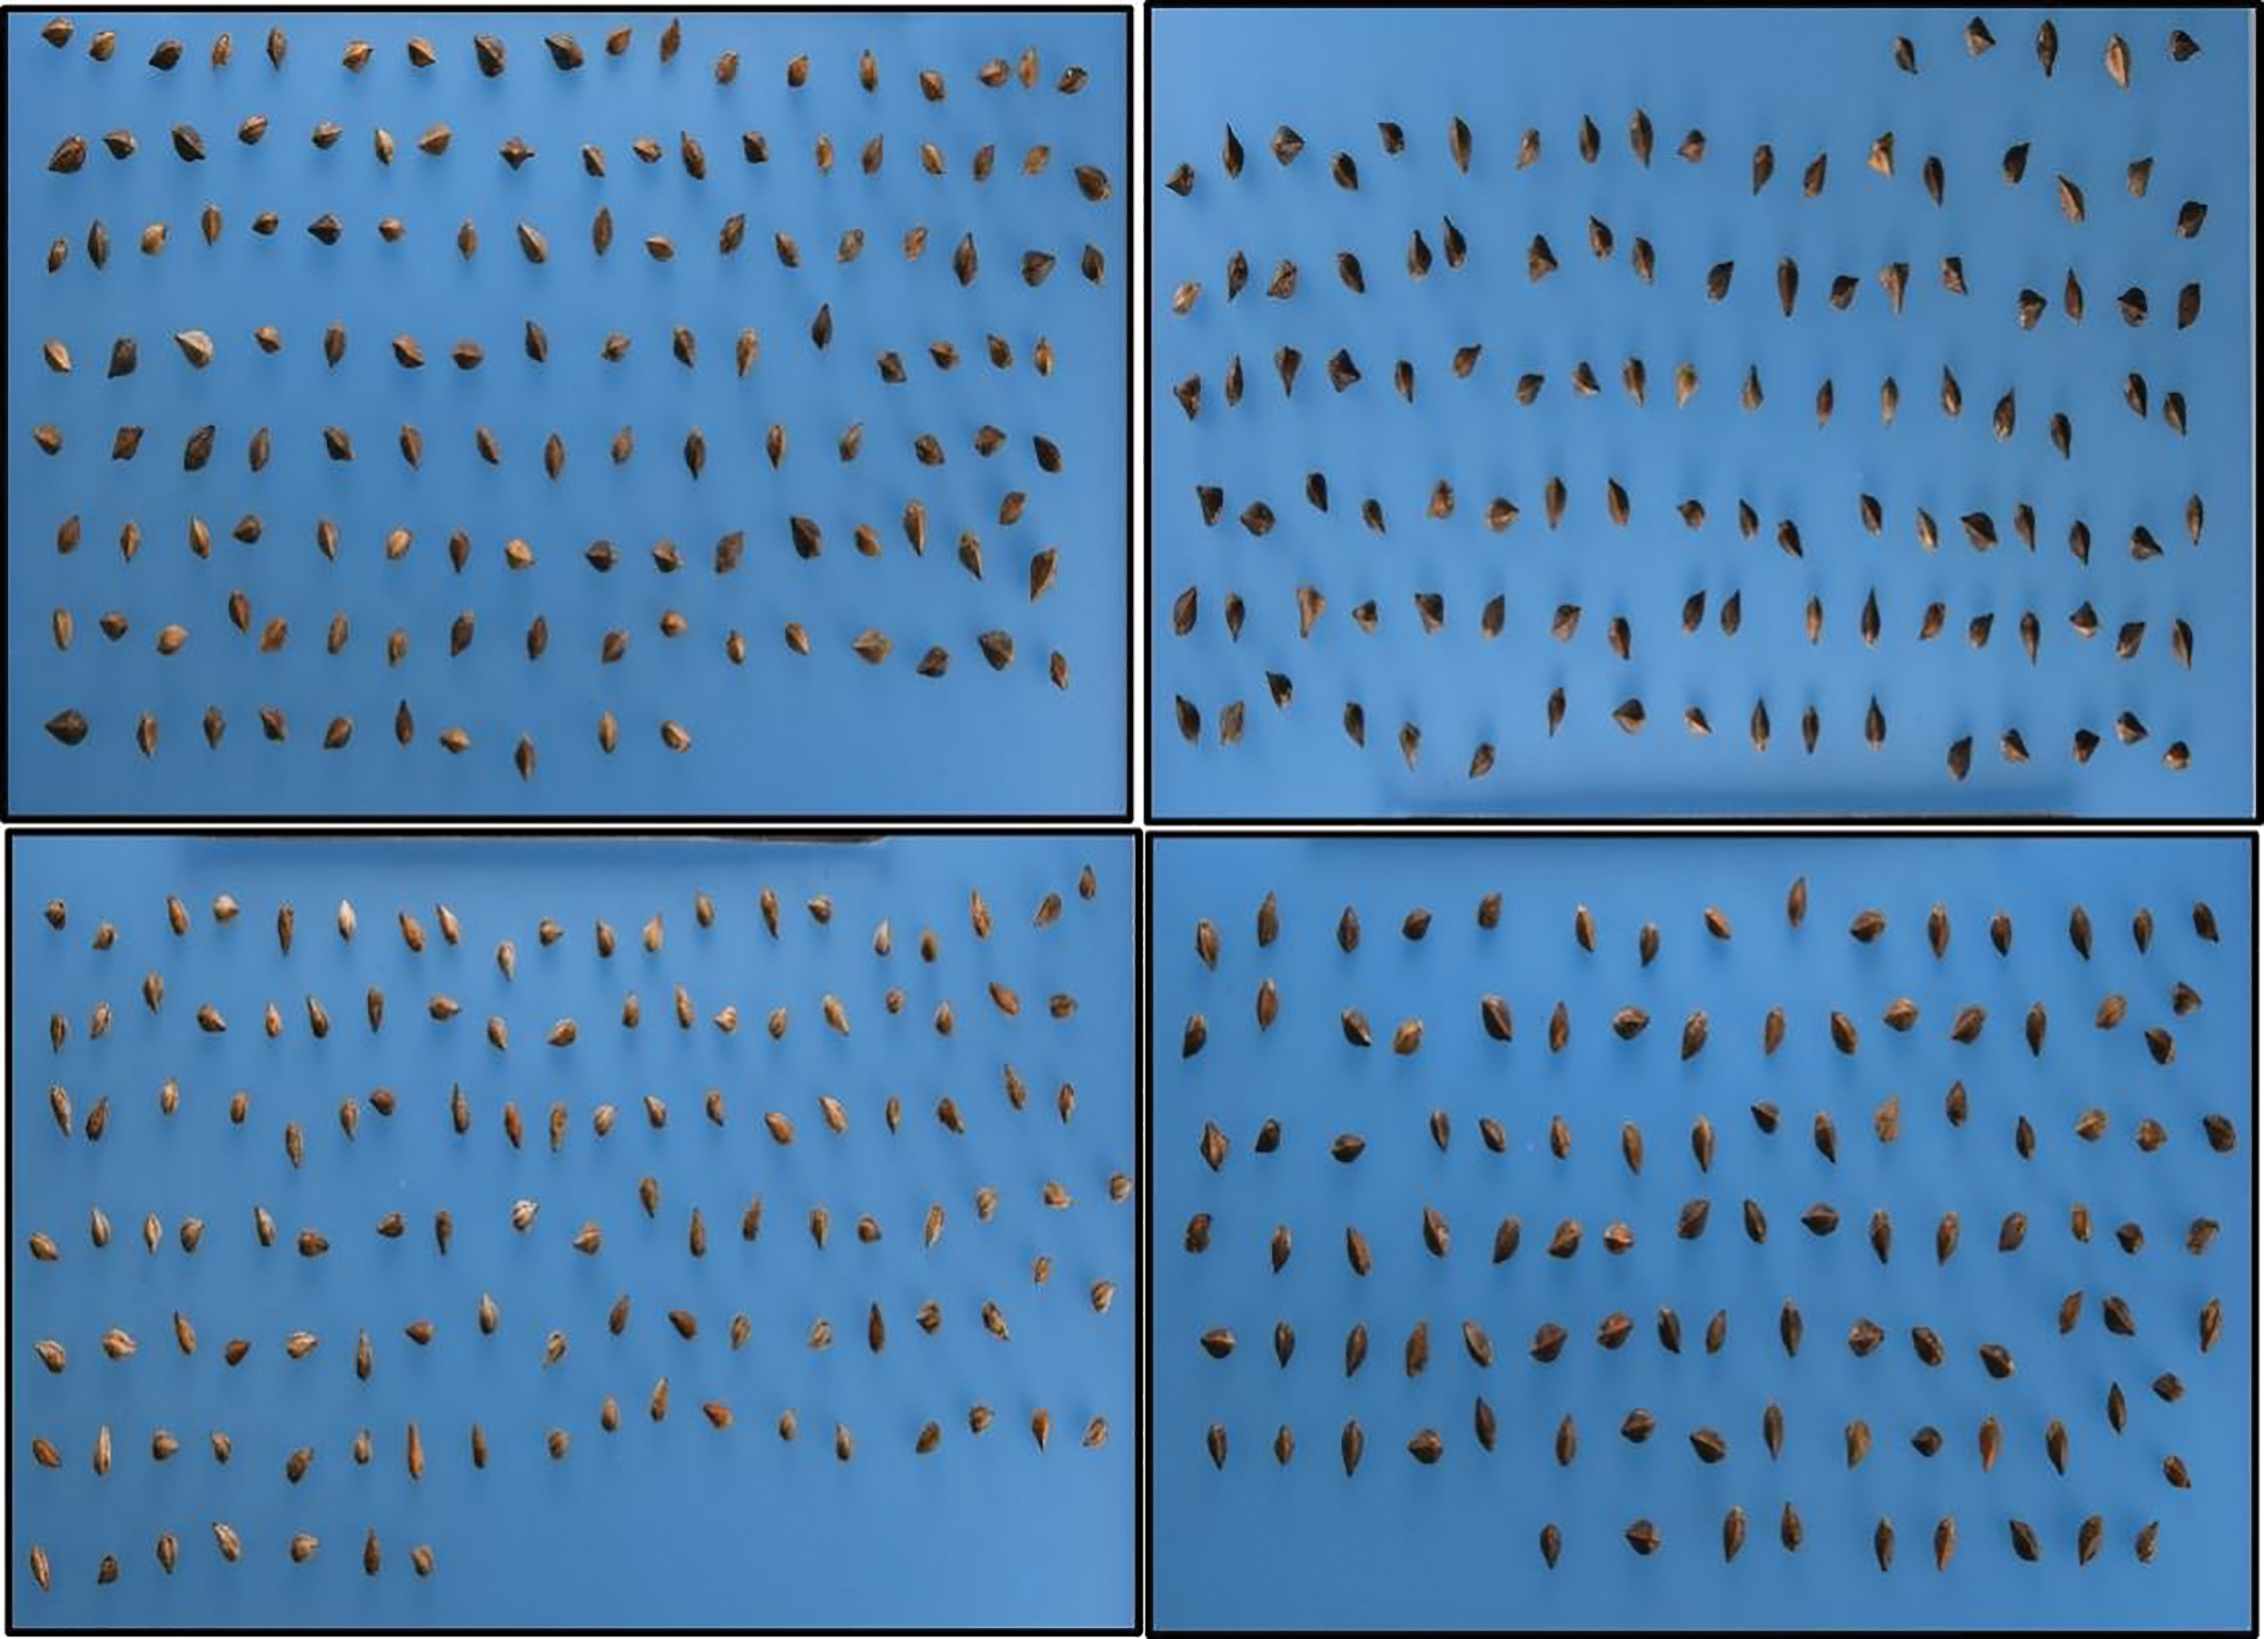
Figure 1: Some of the Tartary buckwheat germplasm accessions used for image analysis
To obtain the seed image of each buckwheat lines, we manually spread the seeds onto a blue polypropylene (PP) board (color clear PP “L” Holder, Hyunpoong Inc. Co. Pochen, Republic of Korea, 255 × 310 mm). After that, to capture red, green, and blue (RGB) images of the seeds, we set the RGB camera 25 cm above the board. In order to provide scale for the image analysis, 16 mm tag was used for a scale bar. To capture clear and accurate images of the buckwheat seeds, we used a color camera with a resolution of 23.5 × 15.7 mm (Nikon D7500, manufactured by Nikon Imaging Japan Inc. in Tokyo, Japan), equipped with a complementary met-al-oxide-semiconductor (CMOS) image sensor and a lens (af-s dx Nikkon 16–80 mm f/2.8-4 e ed vr, Nikon Imaging Japan Inc.). To minimize the effect of shadows on the seeds and reduce the likelihood of image errors, we set up a studio box (M80 Studio, China, with dimensions of 800 × 800 × 800 mm) and a Light-Emitting Diode (LED) board (ArtLight, from Unclepen Co. in Bucheon, Republic of Korea, with an area of 670 × 470 × 20 mm). In addition, we installed two light boards (measuring 600 × 10 mm and with a temperature of 5500 K ± 200) and two LED light stands (N-T96 LED, from Prodean Co. in Seoul, Republic of Korea, with a temperature of 5600 K). Fig. 2 explains steps for parameter calculation workflow.
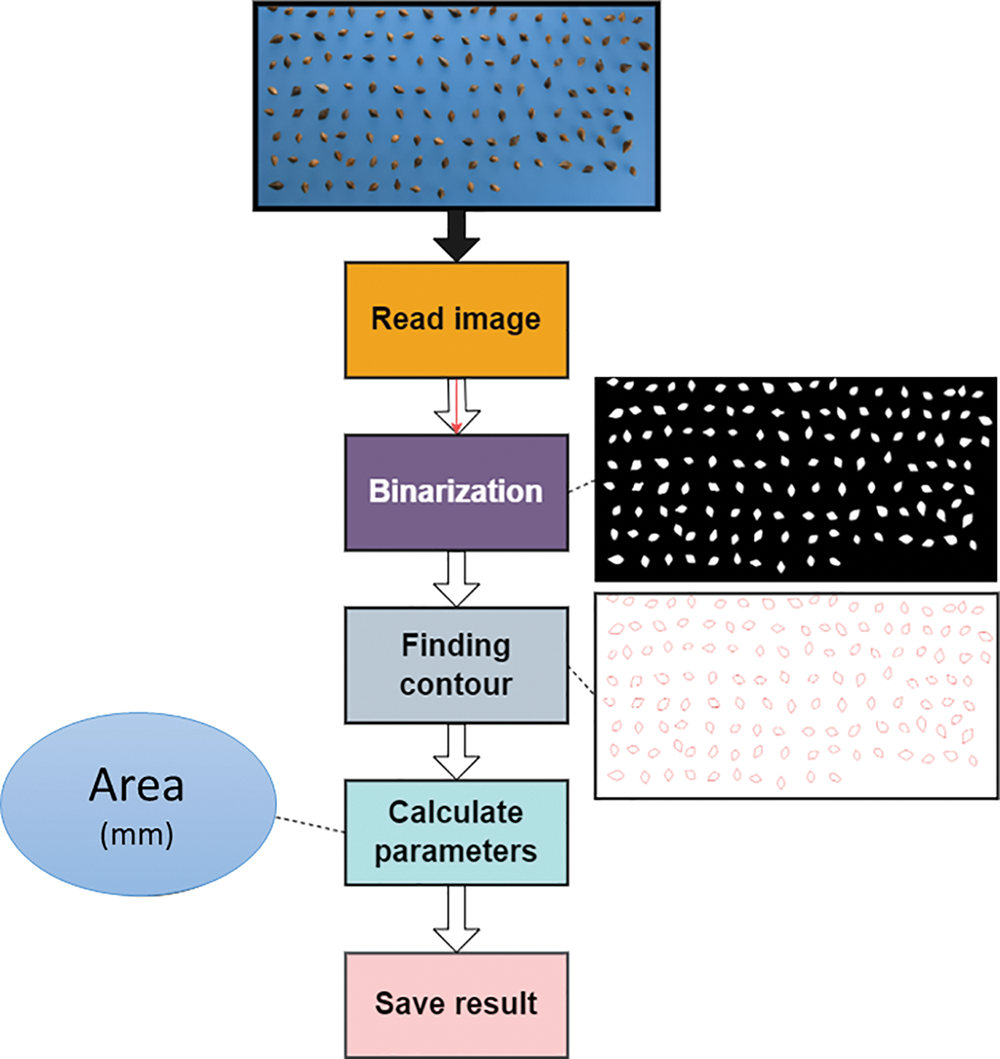
Figure 2: Flow diagram for parameter calculation workflow: from image to results
The ImageJ program was used to process the buckwheat seeds images (ImageJ, National Institutes of Health, USA, rsd.info.nih-gov/ij). In order to separate images of the seeds from the background, we first split the RGB channels. Next, we created binary images to completely isolate the seeds from the background. To reduce the impact of noise on the accuracy of our measurements, we removed any particles in the images that were smaller than 100 times the size of the buckwheat seeds. Finally, to obtain accurate and precise measurements, we measured each area of the buckwheat seeds separately without connecting them to any other objects in the image. In order to further check the data distribution, each feature in selected Tartary buckwheat seeds were carried out (Figs. 1 and 3).
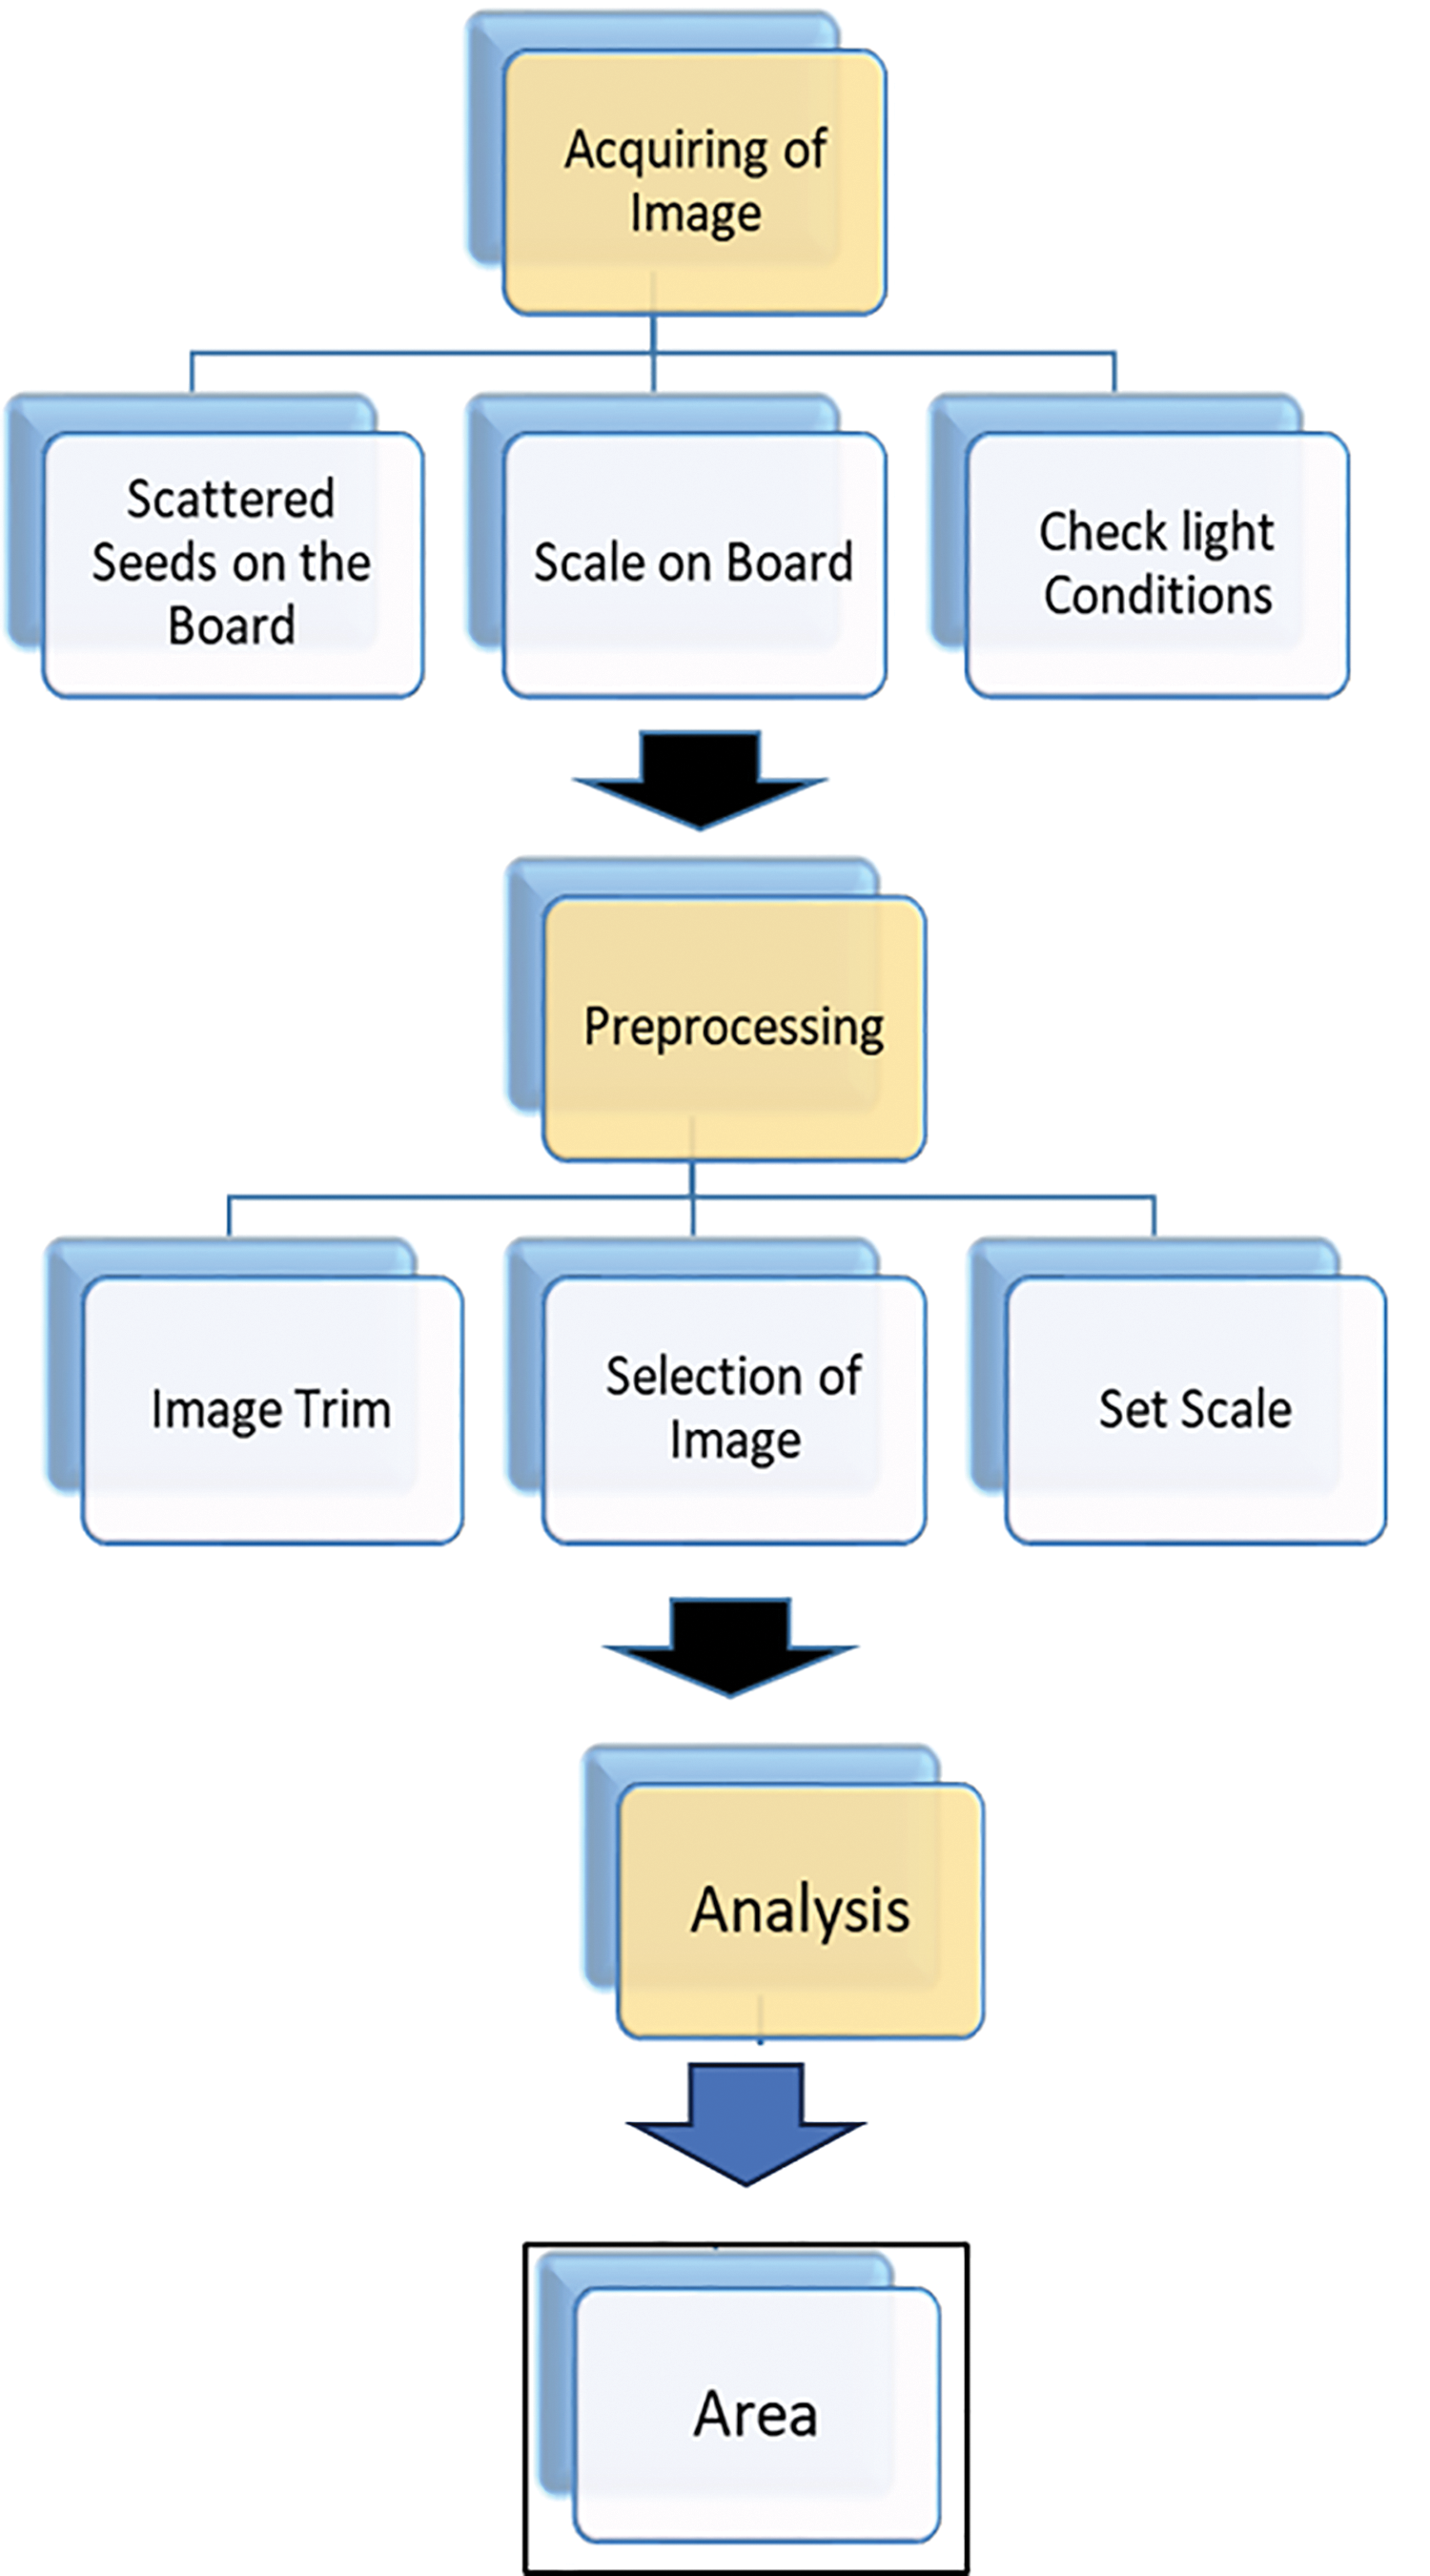
Figure 3: The complete workflow for high-throughput buckwheat seed phenotype analysis
All statistical analyses made by R studio software (Ver. 2022.02.0+443). The plots and probability density function curve for seed Area in supplementary data was made by ggplot2 package [13], and skewness and kurtosis were calculated as follows:
Skewness:
Kurtosis:
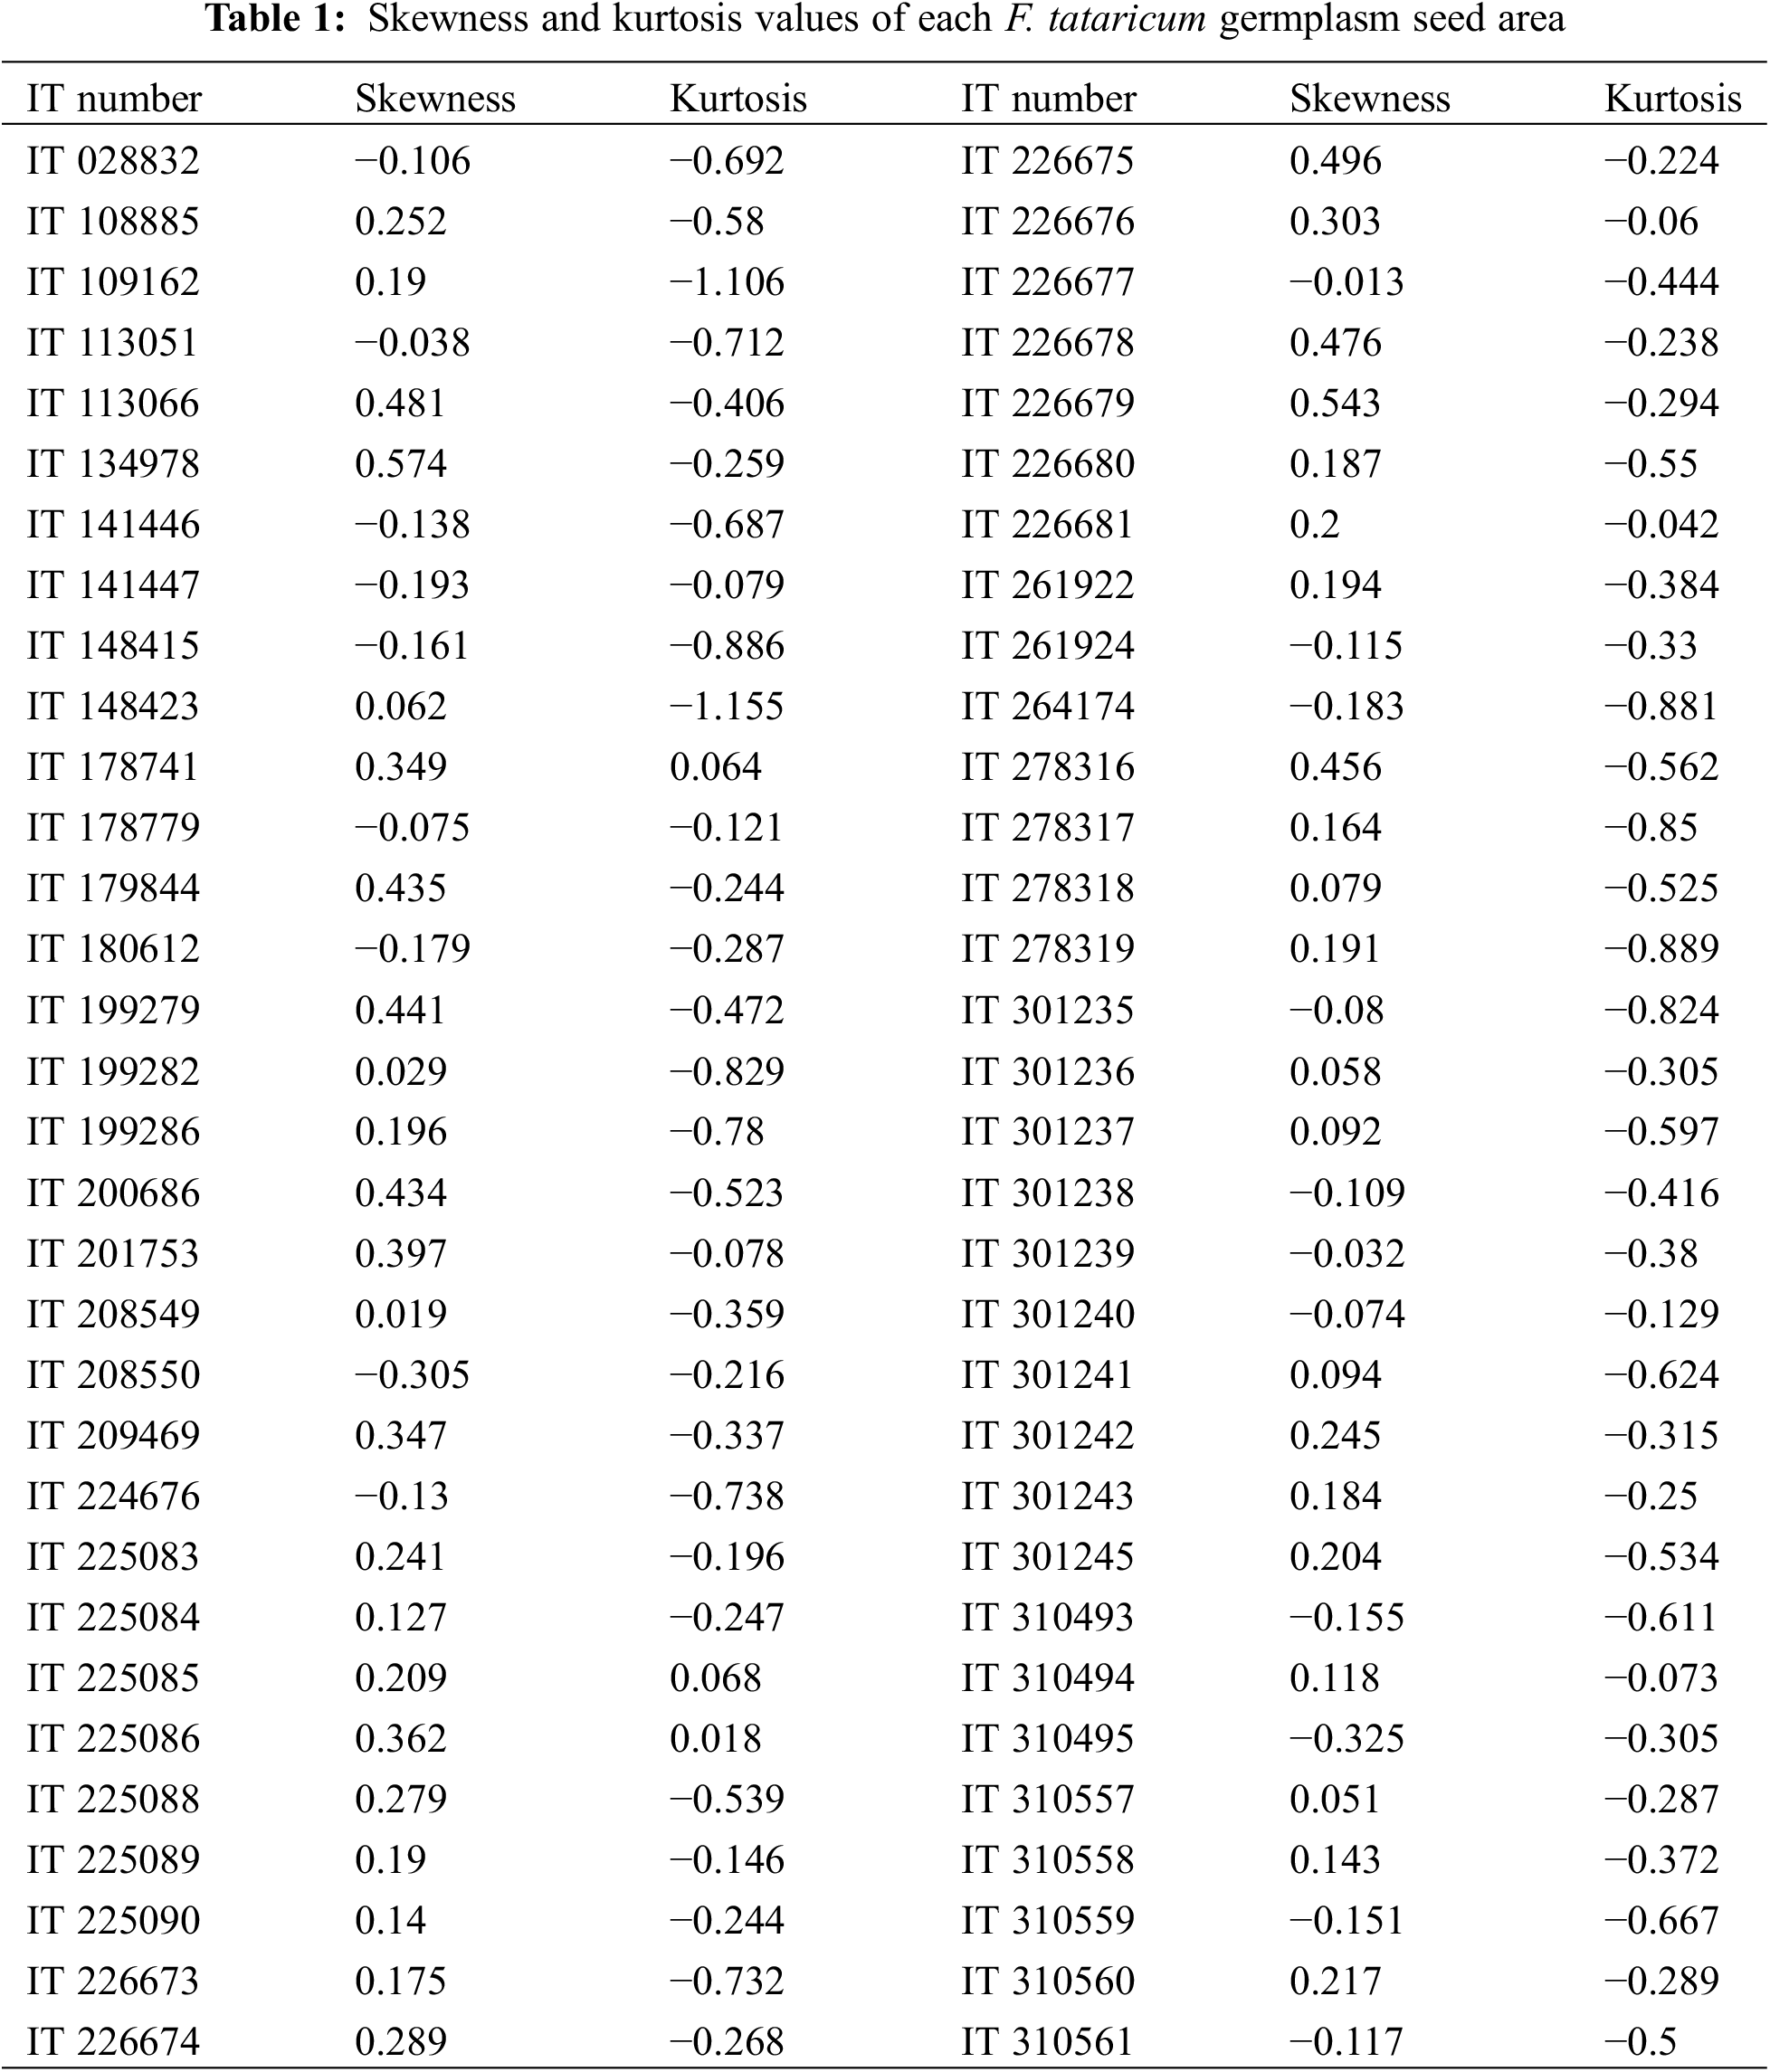
There are large variances in seed area among 64 germplasm of Tartary buckwheat (Fig. 4). The different level of variances among them were observed when each of them was visualized using probability density function curve of seed area (Fig. 5). Moreover, each density plot has different pattern one another. To show the degree of pattern, the skewness and kurtosis were measured (Table 1). The skewness represents the degree of shift from the normal distribution; if it is shifted to left, it has minus value while if it is to right, it does plus value The kurtosis indicates that if it has minus value, it has sharper shape than the normal distribution while if it has plus value, it has flatter shape [16,17]. For the absolute values of both skewness and kurtosis, it indicates the severe non-normality, moderate non-normality, and slight non-normality when it is more than 2.3, between 1 and 2.3, and less than 1, respectively [18,19]. Based on these two parameters, the degree of normality in density plot of each accession is found to be highly diverse.
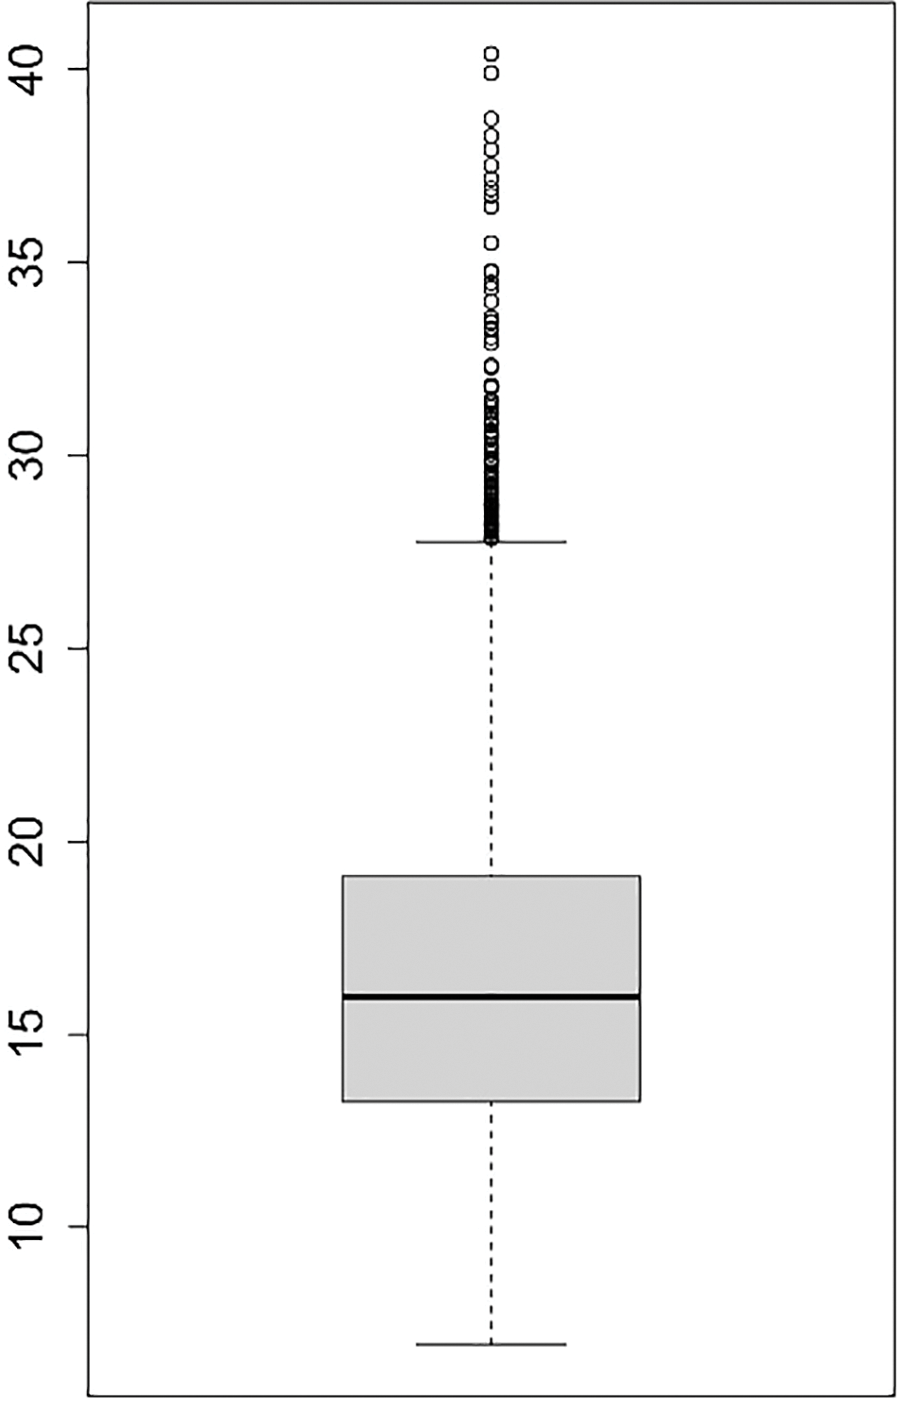
Figure 4: Boxplot of gran areas of 64 germplasm of Tartary buckwheat after outliers are deleted (the area means the number of pixels within square pixels or calibrated square units by image-processing)
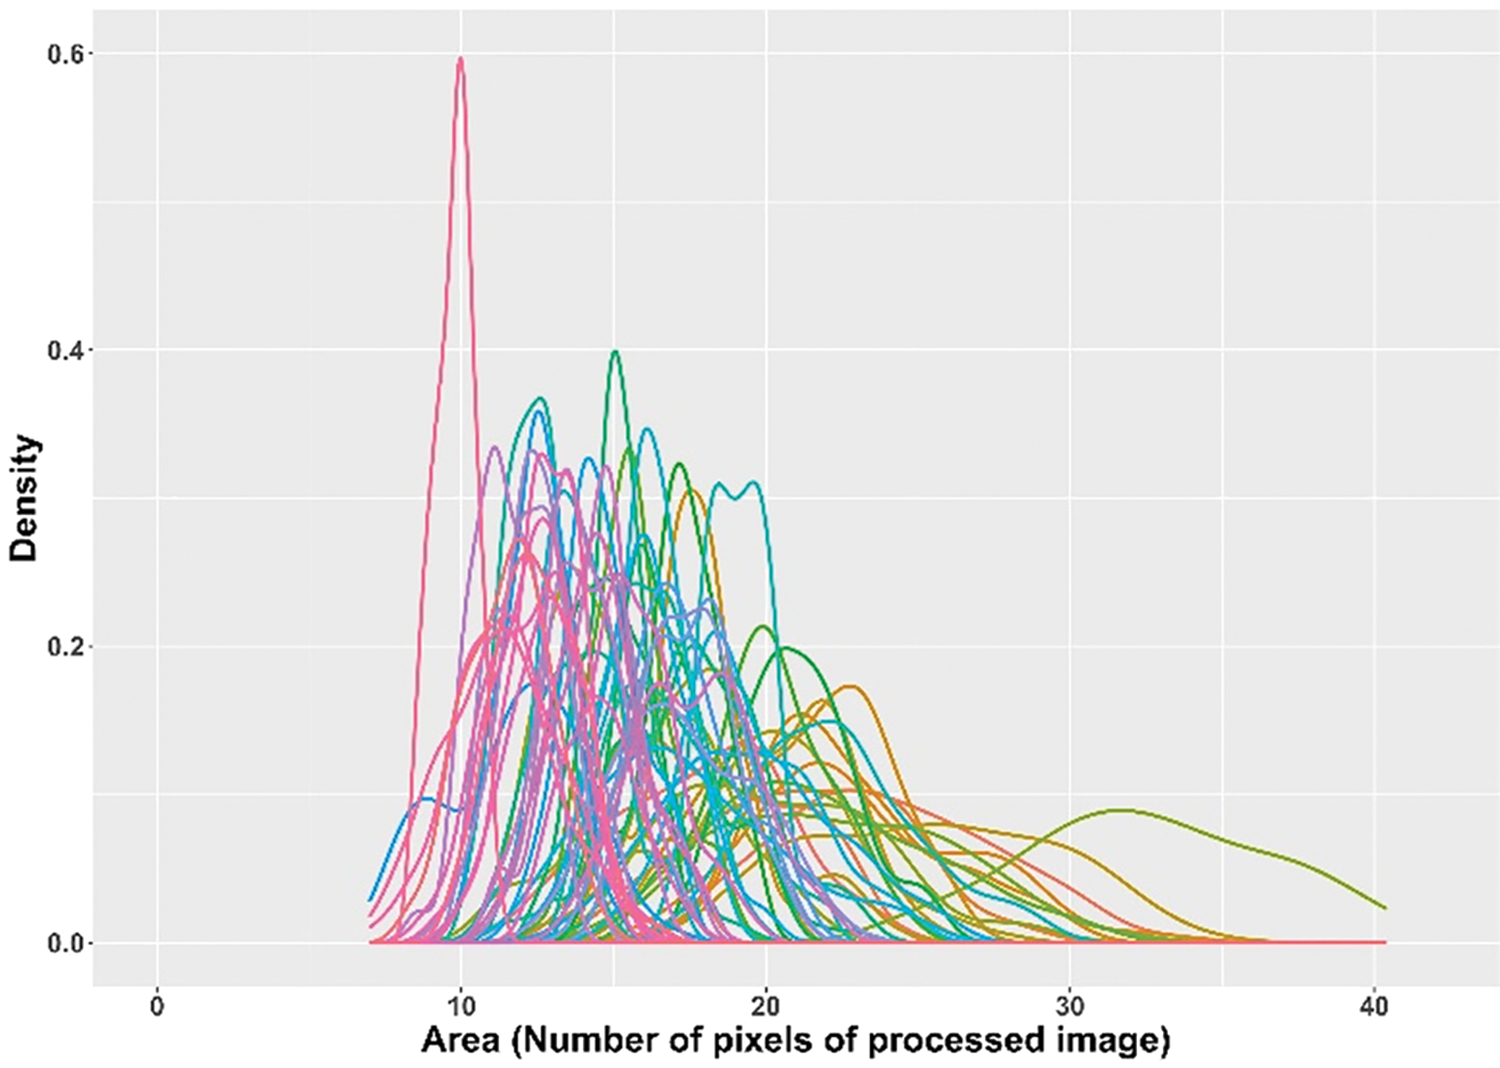
Figure 5: Probability density function curve for seed area of each 64 Tartary buckwheat accessions. The x-axis means image processed Area which is the number of pixels within square pixels or calibrated square units by image processing
The range of normal distribution shows it variance; the wider, the larger variance of seed size in each accession. Those germplasm in the current study have large variance in terms of degree of variance in seed size (Fig. 4). It means that some of them have uniform ripening time and others do not. Those that do not have uniform ripening time should be bred to be uniform to be used for commercial purpose.
The shifted density plot from normality indicates it violates normality. To be shifted to right means that larger numbers of individuals are distributed in the right side. In this case, it can be interpreted that the more individuals are ripened at the given harvest time. The results in the current study suggest that the degree of normality in each accession should be high (Table 1). Given the Tartary buckwheat is cleistogamous meaning it pollinates before flower open, it is not cross-pollinated suggesting that each plant in accession should be homozygous [20]. This means that the variance for seed size reflected by seed area within an accession is not from chromosome shuffling among different plants. Therefore, it can be concluded that this variance is caused by other factors. One of the most important factors could be the different flowering time within an individual plant. When flowering time is different, the seed developmental stage is different one another. Consequently, it affects seed size within a given individual plant unlike domesticated crops that have been selected to possess uniformity and simultaneous ripening unlike wild germplasm [21–23].
The current study demonstrates that there is high variance in the flowering time in each accession based on over 5000 data points by the image analysis technology. This was not possible to measure them manually not only because of the number but also because of the trait itself, area. Thus, it is suggested that this new parameter based on the image analysis technique should be considered for germplasm enhancement to have higher grain yield in the future breeding program.
The current study demonstrates that grain size variation within Tartary buckwheat germplasm is substantial and significantly impacts yield potential. Traditionally overlooked, uniform maturity is identified as a critical factor influencing grain size and overall yield. By employing high-throughput image analysis, we quantified seed area variation across 64 germplasm accessions, revealing a wide range of distributions. Skewness and kurtosis analysis confirmed the non-normal distribution patterns of seed area within accessions, indicating varying degrees of maturity uniformity. The observed seed size variation is attributed to differences in flowering time within individual plants, rather than genetic diversity, as Tartary buckwheat is predominantly self-pollinated. This study underscores the importance of incorporating grain size uniformity as a selection criterion in breeding programs. By targeting germplasm with more uniform maturity, breeders can potentially increase yield and improve overall crop performance. High-throughput image analysis has proven to be an invaluable tool for identifying this previously unquantified trait. This technology enables efficient and accurate assessment of seed size distribution, facilitating the selection of superior germplasm for breeding programs aimed at developing high-yielding and uniformly maturing Tartary buckwheat cultivars.
Acknowledgement: None.
Funding Statement: This research was supported by a grant from the Standardization and Integration of Resources Information for Seed-Cluster in Hub-Spoke Material Bank Program (Project No. PJ01587004), Rural Development Administration, Republic of Korea. We also thank Jeju Buckwheat Farmers Association Corporation, Jeju, Republic of Korea.
Author Contributions: Conceptualization, Yong Suk Chung; methodology, Bo Hwan Kim and Ji Eun Park; software, Bo Hwan Kim, Sheikh Mansoor and Ji Eun Park; validation, Sheikh Mansoor, Wook Kim, Gyung Deok Han and Yong Suk Chung; formal analysis, investigation, Sheikh Mansoor, Wook Kim, Gyung Deok Han and Yong Suk Chung. resources, Gyung Deok Han, Yong Suk Chung and Wook Kim; data curation, Ji Eun Park, Sheikh Mansoor, Wook Kim, Gyung Deok Han and Yong Suk Chung; writing—original draft preparation, writing—review and editing, Ji Eun Park, Sheikh Mansoor, Wook Kim, Gyung Deok Han and Yong Suk Chung; project administration, Yong Suk Chung; funding acquisition, Yong Suk Chung. All authors reviewed the results and approved the final version of the manuscript.
Availability of Data and Materials: None.
Ethics Approval: Not applicable.
Conflicts of Interest: The authors declare that they have no conflicts of interest to report regarding the present study.
References
1. Donmez E, Sears RG, Shroyer JP, Paulsen GM. Genetic gain in yield attributes of winter wheat in the Great Plains. Crop Sci. 2001;41(5):1412–9. doi:10.2135/cropsci2001.4151412x. [Google Scholar] [CrossRef]
2. Hassan MA, Yang M, Fu L, Rasheed A, Zheng B, Xia X, et al. Accuracy assessment of plant height using an unmanned aerial vehicle for quantitative genomic analysis in bread wheat. Plant Methods. 2019;15(1):1–2. doi:10.1186/s13007-019-0419-7. [Google Scholar] [PubMed] [CrossRef]
3. Al-Tahir FM. Flag leaf characteristics and relationship with grain yield and grain protein percentage for three cereals. J Med Plants Stud. 2014;2(5):1–7. [Google Scholar]
4. Balota M, Payne WA, Evett SR, Lazar MD. Canopy temperature depression sampling to assess grain yield and genotypic differentiation in winter wheat. Crop Sci. 2007;47(4):1518–29. doi:10.2135/cropsci2006.06.0383. [Google Scholar] [CrossRef]
5. Ahmed K, Shabbir G, Ahmed M, Shah KN. Phenotyping for drought resistance in bread wheat using physiological and biochemical traits. Sci Total Environ. 2020;10; 729(4):139082. doi:10.1016/j.scitotenv.2020.139082. [Google Scholar] [PubMed] [CrossRef]
6. Brown JK. Yield penalties of disease resistance in crops. Curr Opin Plant Biol. 2002;5(4):339–44. doi:10.1016/S1369-5266(02)00270-4. [Google Scholar] [PubMed] [CrossRef]
7. Neuweiler JE, Maurer HP, Würschum T. Long-term trends and genetic architecture of seed characteristics, grain yield and correlated agronomic traits in triticale (×Triticosecale Wittmack). Plant Breed. 2020;139(4):717–29. doi:10.1111/pbr.v139.4. [Google Scholar] [CrossRef]
8. Motuzaite-Matuzeviciute G, Hunt HV, Jones MK. Experimental approaches to understanding variation in grain size in Panicum miliaceum (broomcorn millet) and its relevance for interpreting archaeobotanical assemblages. Veg Hist Archaeobotany. 2012;21:69–77. doi:10.1007/s00334-011-0322-2. [Google Scholar] [CrossRef]
9. Kim J, Savin R, Slafer GA. Weight of individual wheat grains estimated from high-throughput digital images of grain area. Eur J Agron. 2021;124:126237. doi:10.1016/j.eja.2021.126237. [Google Scholar] [CrossRef]
10. Yang W, Feng H, Zhang X, Zhang J, Doonan JH, Batchelor WD, et al. Crop phenomics and high-throughput phenotyping: past decades, current challenges, and future perspectives. Mol Plant. 2020;13(2):187–214. doi:10.1016/j.molp.2020.01.008. [Google Scholar] [PubMed] [CrossRef]
11. Shahin MA, Symons SJ. Seed sizing from images of non-singulated grain samples. Can Biosyst Eng. 2005;47(3):49–55. [Google Scholar]
12. Ghasemi A, Zahediasl S. Normality tests for statistical analysis: a guide for non-statisticians. J Clin Endocrinol Metab. 2012;10(2):486. doi:10.5812/ijem.3505. [Google Scholar] [PubMed] [CrossRef]
13. Wickham H, Chang W, Wickham MH. Package ‘ggplot2’. Create elegant data visualisations using the grammar of graphics. Version. 2016;2(1):1–89. [Google Scholar]
14. Wheeler DJ. Advanced topics in statistical process control. Knoxville, TN: SPC Press; 1995. [Google Scholar]
15. Kline RB. Principles and practice of structural equation modeling. New York: The Guilford Press; 2023 May 24. [Google Scholar]
16. Groeneveld RA, Meeden G. Measuring skewness and kurtosis. J Royal Stat Soc Ser D: Stat. 1984;33(4):391–9. doi:10.2307/2987742. [Google Scholar] [CrossRef]
17. DeCarlo LT. On the meaning and use of kurtosis. Psychol Methods. 1997;2(3):292. doi:10.1037/1082-989X.2.3.292. [Google Scholar] [CrossRef]
18. Lei M, Lomax RG. The effect of varying degrees of nonnormality in structural equation modeling. Struct Equ Modeling. 2005;12(1):1–27. doi:10.1207/s15328007sem1201_1. [Google Scholar] [CrossRef]
19. Blanca MJ, Arnau J, López-Montiel D, Bono R, Bendayan R. Skewness and kurtosis in real data samples. Methodology: European J Res Meth Behav Social Sci. 2013;9(2):78–84. doi:10.1027/1614-2241/a000057. [Google Scholar] [CrossRef]
20. Joshi BK, Bimb HP, Okuno K. Hybridization technique in Tartary buckwheat (Fagopyrum tataricum Gaertn). Nepal Agri Res J. 2009;9:118–21. [Google Scholar]
21. Heiser CB. Aspects of unconscious selection and the evolution of domesticated plants. Euphytica. 1988;37:77–81. doi:10.1007/BF00037227. [Google Scholar] [CrossRef]
22. Ehrlén J. Selection on flowering time in a life-cycle context. Oikos. 2015;124(1):92–101. doi:10.1111/oik.01473. [Google Scholar] [CrossRef]
23. Han GD, Mansoor S, Kim J, Park J, Heo S, Yu J, et al. A study of the morphological and geographical diversity of Korean indigenous buckwheat landraces for breeding. J King Saud Univ Sci. 2024;103387. [Google Scholar]
Cite This Article
 Copyright © 2024 The Author(s). Published by Tech Science Press.
This work is licensed under a Creative Commons Attribution 4.0 International License , which permits unrestricted use, distribution, and reproduction in any medium, provided the original work is properly cited.
 Downloads
 Citation Tools