
 Submit a Paper
 Propose a Special lssue
 Open Access
ARTICLE
Linkage Mapping and QTL Analysis of Isoflavones Composition in Soybean Seeds
1 Department of Crop Genetics and Breeding, College of Agronomy City, Jilin Agricultural University, Changchun, 130118, China
2 Department of Biochemistry and Molecular Biology, College of Life Science, Jilin Agricultural University, Changchun, 130118, China
3 Department Biology, University of British Columbia, Okanagan, Kelowna, BC M6K 3C3, Canada
* Corresponding Authors: Jun Zhang. Email: ; Xueying Li. Email:
Phyton-International Journal of Experimental Botany 2024, 93(9), 2209-2225. https://doi.org/10.32604/phyton.2024.055046
Received 14 June 2024; Accepted 09 August 2024; Issue published 30 September 2024
 View Full Text
 Download PDF
Abstract
The high isoflavones content of soybeans is an important breeding goal due to the demonstrated benefits of isoflavones to human health and their association with plant resistance. In this study, quantitative trait loci (QTL) mapping for soybean isoflavone aglycones, including daidzin, glycerin, and genistin, and total isoflavones content was performed in a population of 178 F2:6 recombinant inbred lines (RILs) which was generated from a cross between varieties Jinong 17 and Jinong 18. A genetic linkage map covering 1248 cM was constructed using the simple sequence repeat (SSR) molecular markers. The results revealed 22 isoflavone-related QTLs, 5 for daidzin, 7 for genistin, 6 for glycerin, and 4 for total isoflavone content. Seven of these represented new QTLs. All QTL regions contained 6462 genes, of which 58 have been annotated for flavonoid synthesis. Using public databases, three candidate genes, namely Glyma.11G164400, Glyma.16G158400, and Glyma.19G217700, were subsequently identified. Quantitative reverse transcription polymerase chain reaction (qRT-PCR) demonstrated that the three genes exhibited specific, high expression in soybean seeds and a positive correlation with flavonoid content. These findings might be helpful in the efforts to breed new soybean varieties with improved isoflavone composition and content.Keywords
Supplementary Material
Supplementary Material FileIsoflavones are widely considered to be beneficial to human health as potential anticancer agents and as therapy to reduce menopausal symptoms [1]. Soybean seeds are widely recognized as a rich source of isoflavones, with particularly high levels in the hypocotyl, cotyledons, and seed coat [2,3]. Daidzin, glycerin, and genistin are the main isoflavone compounds in soybean seeds [4]. Daidzin is a specific inhibitor of aldehyde dehydrogenase which may help to suppress ethanol consumption [5] and has also been shown to help prevent bone loss [6], provide neuroprotection and neuro-nutrition [7], and have antioxidant and anti-inflammatory activities [8,9]. Glycitin may be useful for suppressing cartilage destruction in osteoarthritis [10] and protecting lung tissues from lipopolysaccharide-induced inflammation [11]. Genistin was also shown to be a potent anti-adipogenic and anti-lipogenic agent [12]. From the plant perspective, the functions of isoflavones include plant stress resistance, plant-environment interactions [13,14], and the role of important signals in interactions with beneficial N-fixing bacteria [15]. For example, the invasion of Sclerotinia sclerotiorum and soybean aphids can result in an elevation of the isoflavone concentration in soybeans [16–18]. Additionally, the plant’s defense mechanism against ultraviolet radiation involves the synthesis of isoflavones [19–21]. In conclusion, the analysis of the mechanism of soybean isoflavone synthesis and the isoflavone content of soybean seeds represents a significant area of investigation within the field of soybean breeding.
The content and composition of soybean isoflavones are quantitative traits controlled by multiple genes and influenced by the environment [22]. Isoflavones are produced from the p-coumaric CoA by the action of Chalcone Synthase (CHS) and/or Chalcone Reductase (CHR), followed by the sequential action of Chalcone Isomerase (CHI) and Isoflavone Synthase (IFS) [23]. The availability of a soybean genetic linkage map has greatly boosted soybean genetic research on isoflavones. Six QTLs associated with isoflavone content in soybean seeds were identified through linkage mapping constructed by SSR markers based on 474 RIL populations, which were located in the J, N, D2, and G linkage groups, respectively [24]. The other study employed the same approach to scan 34 QTLs associated with daidzein, glycitein, glycitein, and total isoflavone content in soybean seeds across 130 RIL populations with 95 SSR markers [25]. Additionally, the strategy of genome-wide association analysis (GWAS) and QTL mapping was combined to identify candidate loci for interesting traits. For instance, qISO8-1 was identified as the primary locus for seed isoflavone content through the integration of GWAS and QTL mapping [26]. To date, in addition to known genes in the isoflavone synthesis pathway, researchers have identified 61 daidzein-related QTLs, 68 genistein-related QTLs, 71 glycerin-related QTLs and 62 total isoflavone content-related QTLs, which are recorded in the SoyBase Genome Database (http://www.soybase.org, accessed on 21 May 2023). There have been some reports on transcript factors that regulate key enzymes of isoflavone synthesis. Chu et al. [27] reported one candidate gene, GmMYB29, that is significantly correlated with isoflavone content and can activate IFS2 and CHS8 promoters. Vadivel et al. [28] studied transcript factor GmMYB176 and showed it regulates isoflavones by activating the expression of CHS8. However, the available markers density and population sizes used in previous studies were not sufficient to identify the underlying genes [29]. Identification of QTLs affecting the isoflavone content will provide a theoretical basis for soybean quality improvement through molecular marker-assisted breeding and can provide leads on the key components of the pathway, and how they are regulated.
In this study, a genetic linkage map was constructed using 58 SSR molecular markers and a population of 178 F2:6 RILs, and QTLs were mapped for daidzin, glycerin, genistin, and total isoflavone content. We present new QTLs identify candidate genes and discuss their potential for the metabolic engineering of soybean seed isoflavones.
2.1 Plant Materials and Field Experiments
An F2:6 recombinant inbred line (RIL) population consisting of 178 lines was derived from the cross of the parental genotypes Jinong 17 (JSD 2005015) and Jinong 18 (JSD 2006009) that differed significantly in the composition and total content of isoflavones in soybean seeds. Jinong 17 was used as the female parent and contains higher daidzin, glycitin, genistin and total isoflavones than Jinong 18, the male parent.
The field experiment was conducted in the experimental field of Jilin Agricultural University in Changchun, Jilin Province (43°13′N, 125°19′E), China. The experiment was laid out in a randomized complete block design (RCBD) with three replications. Parents and RIL populations were planted with a row length of 4.5 m, a distance between rows of 0.65 m, 2 rows for each RIL material, and the planting density was 180,000-200,000 plants per hectare. Seeds were sampled after full maturity for further phenotypic characterization.
2.2 Soybean Seed Isoflavone Extraction and Determination
Soybean seed isoflavones were extracted and characterized as follows: Soybean seeds were ground into powder and were sifted through a 40-mesh screen [30]. The soybean powder obtained was degreased with petroleum ether at 65°C for 2 h, and then was dried at 37°C until reaching a constant weight. The skimmed powder (250 mg) was dissolved in 10 mL 80% methanol at room temperature for 2 h and then distilled at 80°C for 12 h. The supernatant was collected by centrifugation at 12,000 rpm for 15 min. 1 mL of supernatant solution was filtered into a separate HPLC vial using a glass syringe equipped with a 0.45 µm nylon filter (Amicon, Texas, USA) for further isoflavones determination. The standards (genistein, genistin, daidzein, glycitein, glycitin and daidzin with purity more than 98%, Sigma-Aldrich, USA) were dissolved in methanol to a concentration of 100 mg/L. Then the isoflavones standard solutions were serially diluted to 2 mg/L, 5 mg/L and 10 mg/L for the calibration curves. An internal standard (2-methoxyflavone, Sigma-Aldrich, USA) solution (5 mg/mL) was also prepared in the same solvent.
A high-performance liquid chromatography (HPLC, Shimadzu, Kyoto Prefecture, Japan) system was employed with a Shim-pack VP-DOS column (150 mm × 4.6 mm, Shimadzu, Japan) and a mobile phase of methanol-water (a cubage ratio of 30:70). The column temperature was set at 40°C, the wave length was 254 nm, the flow rate was 1 mL/min, and the filling amount was 10 μL. Analytes were quantified on the basis of the internal standard method. All samples were analyzed in triplicates.
2.3 Genotype Analysis and Construction of Genetic Maps
Fresh leaves of soybean plants at the three-leaf stage were used for total genome DNA extraction with the cetyltrimethylammonium bromide (CTAB) method [31]. DNA was dissolved in ddH2O to a concentration 100 ng/ml with RNAase A (Thermo Fisher Scientific, Waltham, Massachusetts, USA) added. All primer sequences were obtained from SoyBase database (https://www.soybase.org). A total of 274 primers from 14 linkage groups were used to detect polymorphism of SSR loci in the parents, and 58 of them were available and synthesized. PCR amplification was performed using the 2 × Taq PCR StarMix kit (Genstar Kangrun Bio, Beijing, China). The PCR reactions used 1.0 µg template DNA, 1.0 µL of 10 µM forward and reverse primers, 10 µL of 2 × Taq PCR Star Mix, and 7 µL of ddH2O. PCR was carried out as follows: 94°C pre-denaturation for 5 min, 94°C denaturation for 30 s, 53°C renaturations for 30 s, 72°C extension for 30 s, repeated 35 cycles, and 5 min final extension at 72°C after the last cycle. The polymorphisms of PCR products were detected by 6% Polyacrylamide Gel Electrophoresis (PAGE). Stain with silver nitrate solution and develop the color with sodium hydroxide solution. We used QTL Icimapping software [32] with the parameters set to nnTwoOpt algorithm with 50 cM window size (the rest of the parameters were defaulted) to map the genetic mapping by referring to the method of Zhang et al. [33]. Then, QTL scanning was performed using the BIP module of the same software at LOD = 2.5 in combination with phenotypic data and genetic mapping.
2.4 Obtain Candidate Genes and Their Information within the QTL Region
SoyBase database records the linkage groups of SSR markers and their physical location information on the Wm82.a2.v1 reference genome. This information is used to extract the gene names and functional annotations contained within the QTL interval. Gene expression levels of these genes in different soybean tissues were obtained from Phytozome database (http://phytozome.jgi.doe.gov/pz/portal.html) (accessed on 23 May 2023) [34,35]. The expression profiles of seeds at different developmental stages were derived from previous studies [36], and gene probes exhibiting at least 1.5-fold expression gap were selected for cultivars displaying differences in isoflavone content. Subsequently, the nucleotide base information of the selected probe was retrieved from the NCBI database (https://www.ncbi.nlm.nih.gov/) (accessed on 23 May 2023) and aligned to the reference genome using the BLASTN function in the Phytozome database. Finally, the gene sequence with the E-value < 0.0001 and the highest identity was considered the optimal outcomes for matching the corresponding probe. TBtools software was used to plot expression heatmaps [37].
2.5 mRNA Extraction and qRT-PCR
To validate candidate genes for synthesizing isoflavones, four varieties with high and low flavonoid content in seeds were used to extract mRNA. Among them, JinShanCha MoShiDou (JMSD, ZDD07610, seed isoflavones content: 1617.023 mg/kg) and JiYu108 (JY108, JSD2015007, seed isoflavones content: 1554.848 mg/kg) were identified as high-content materials, while ZiHua2 (ZH2, ZDD07218, seed isoflavones content: 254.962 mg/kg) and SuiNong79 (SN79, cultivar in Heilongjiang Province, seed isoflavones content: 189.487 mg/kg) were identified as low-content materials. The 70 days after sowing period, roots, stems, and leaves were collected. The gene expression level of seeds during the developmental stage was replaced by seeds that had germinated for 7 days [38]. All samples were promptly frozen in liquid nitrogen following collection, and mRNA from plants was extracted using (TransGen Biotech:ER501-01, Beijing, China) in accordance with the instructions provided by the reagent manufacturer.
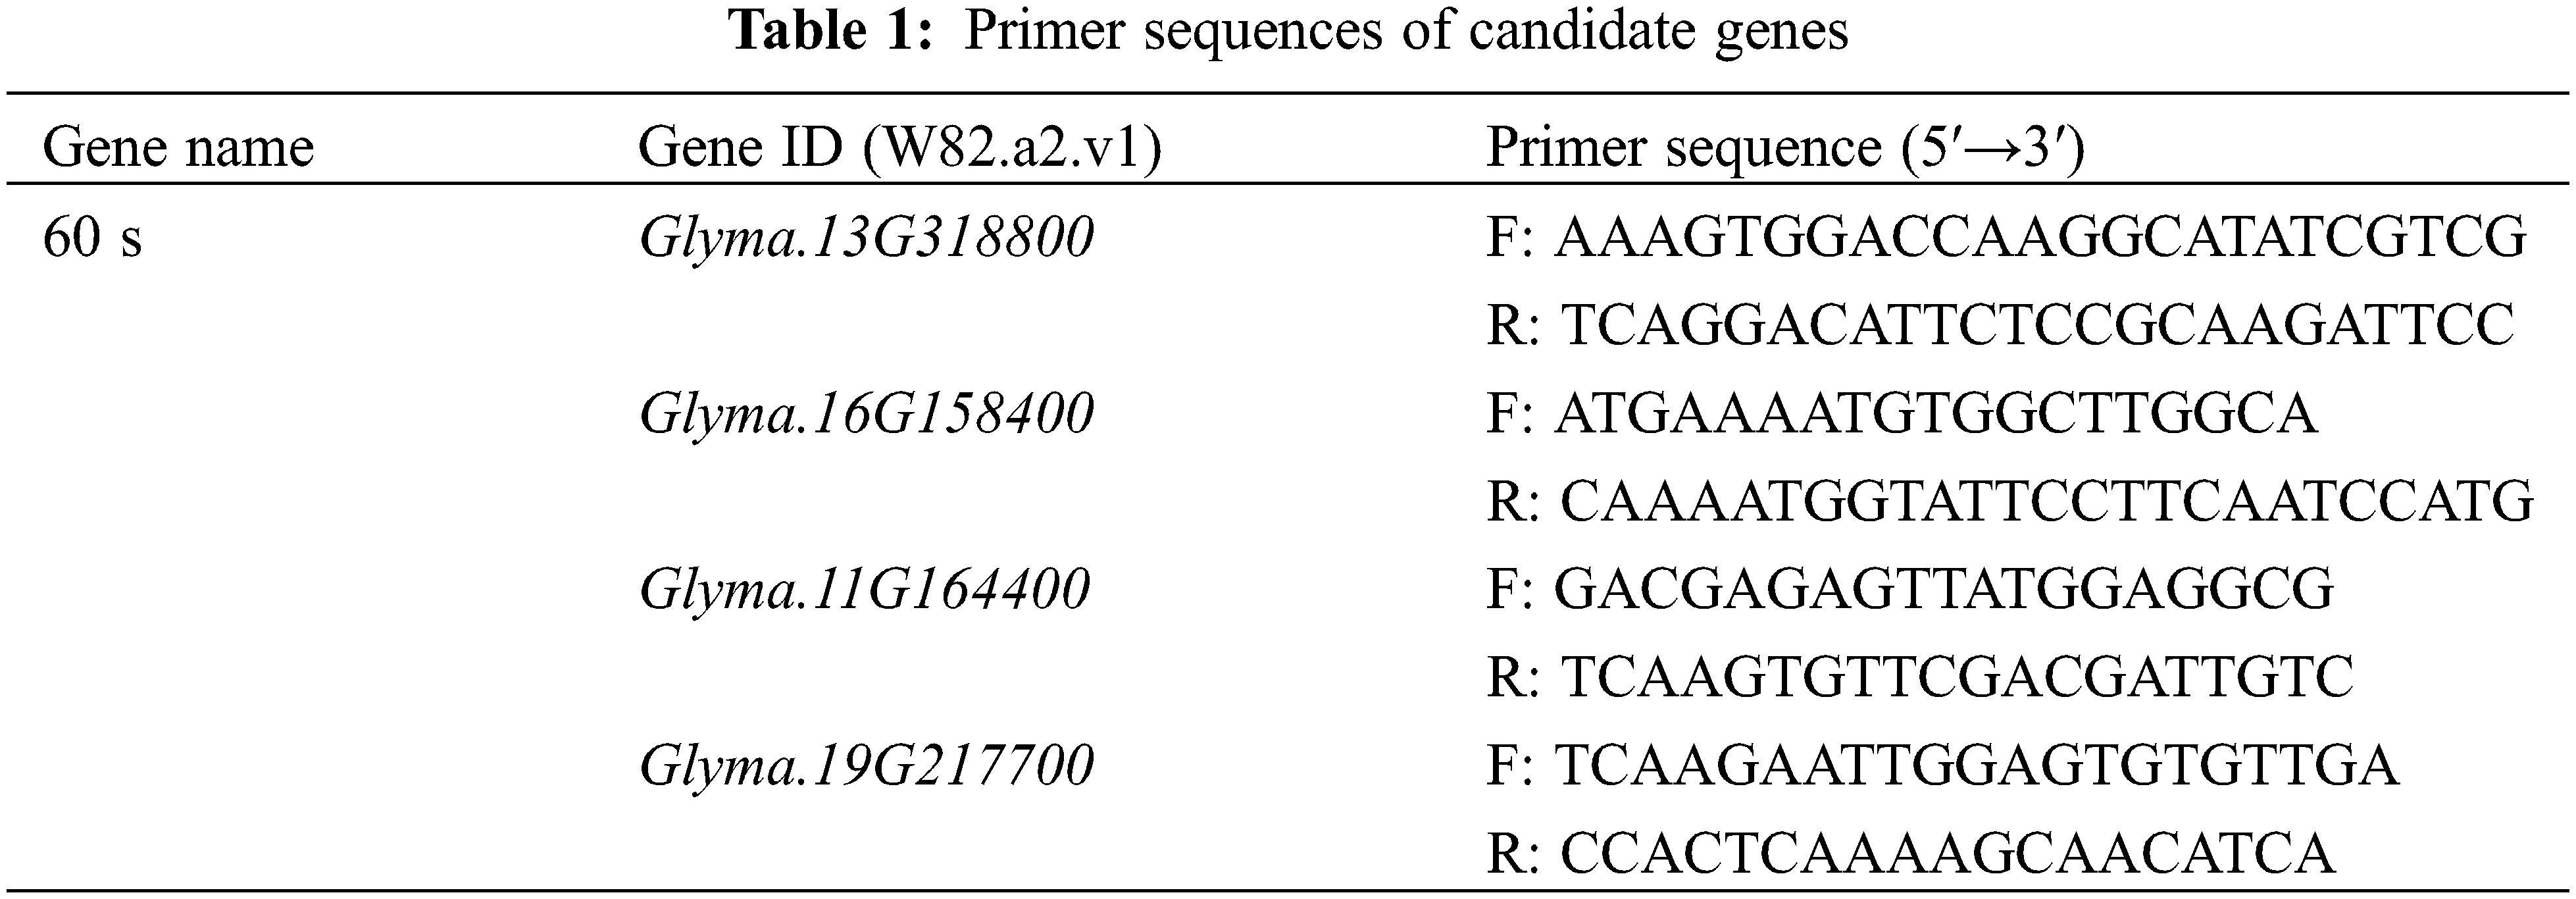
According to the gene sequences of Glyma.16G158400, Glyma.11G164400, and Glyma.19G217700 to design qRT-PCR primers, the 60 s (Glyma.13G318800) genes as the internal control [39]. The four gene sequences in this study were obtained from Phytozome database. Primers for all genes were designed using the NCBI Primer-BLAST (https://blast.ncbi.nlm.nih.gov/Blast.cgi) (accessed on 25 May 2023) for qRT-PCR (Table 1). The reaction system was prepared in accordance with the instructions provided for the 2 × PerfectStart Green qPCR SuperMix (TransGen Biotech: AQ602-01, Beijing, China). Three biological replicates were performed for each sample. The PCR procedure was as follows: 94°C for 30 s, 94°C for 5 s, and 60°C for 30 s, repeated for 45 cycles. The 2−ΔΔCt method was used to calculate the relative expression levels of genes [40], with the resulting data visualized using GraphPad Prism 6.01 software. The relative expression levels of different varieties within the same tissues were determined using one-way analysis of variance (ANOVA) in IBM SPSS Statistics 27.0 software.
3.1 Variation of Seed Isoflavone Content
The mean isoflavone content in dry seeds of the 178 RILs and the parental lines is shown in Table 2. Jinong 17 had significantly higher values for all isoflavone contents compared to Jinong 18 (t-test, p < 0.05), indicated that the two parents differed in the genes controlling individual and total isoflavone contents. The average total isoflavone content was 1235.6 µg/g, or 1.2% of the dry weight. The three main isoflavones, daidzin, glycitin and genistin, accounted for more than 90% of the total isoflavone content. The average content of the three components in the population was daidzin > genistin > glycitin.
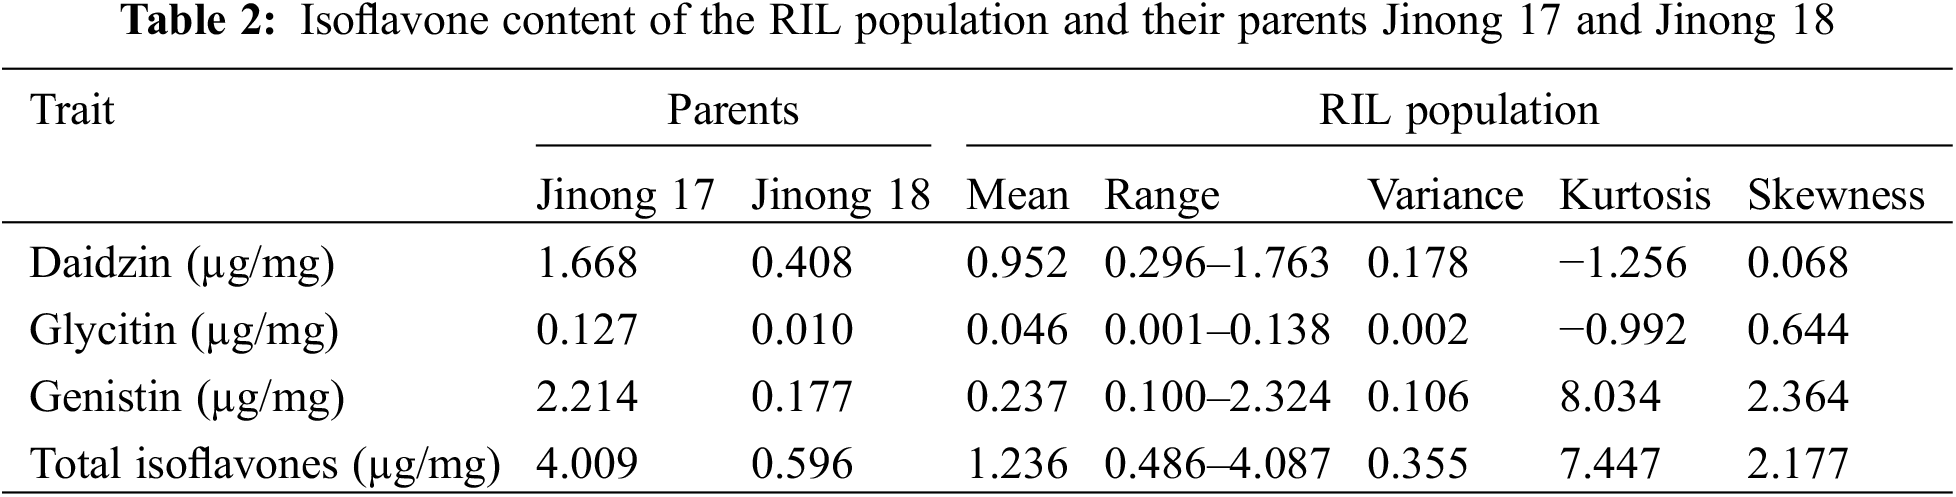
The population exhibited positively skewed distribution for individual and total isoflavones with values ranging from 0.068 to 2.18, indicating their seed isoflavone composition and content was more like Jinong 17 which has a higher isoflavones content. The kurtosis of daidzin and glycitin were lower than 3, indicating distributions broader than normal. Conversely, kurtosis of values of genistein and total isoflavones were higher, indicating distributions more narrow than normal.
3.2 SSR-Based Genetic Map Construction
A total of 278 polymorphic SSR markers were used to genotype the 178 RILs and 58 SSR markers showed polymorphism in the population. These SSR markers were assigned to 12 linkage groups (Fig. 1) with a total length of 1365.73 cM and an average distance between adjacent markers of 23.41 cM. The number of markers on each linkage group ranged from 2 to 9. The order of markers in the constructed linkage map and the soybean common linkage map (GmComposite 2003, http://www.soybase.org) (accessed on 25 May 2023) were consistent, except that Satt591 and Satt471 on linkage group A1 and Satt560 and Satt534 on the B2 linkage group were inversed (Fig. 2).
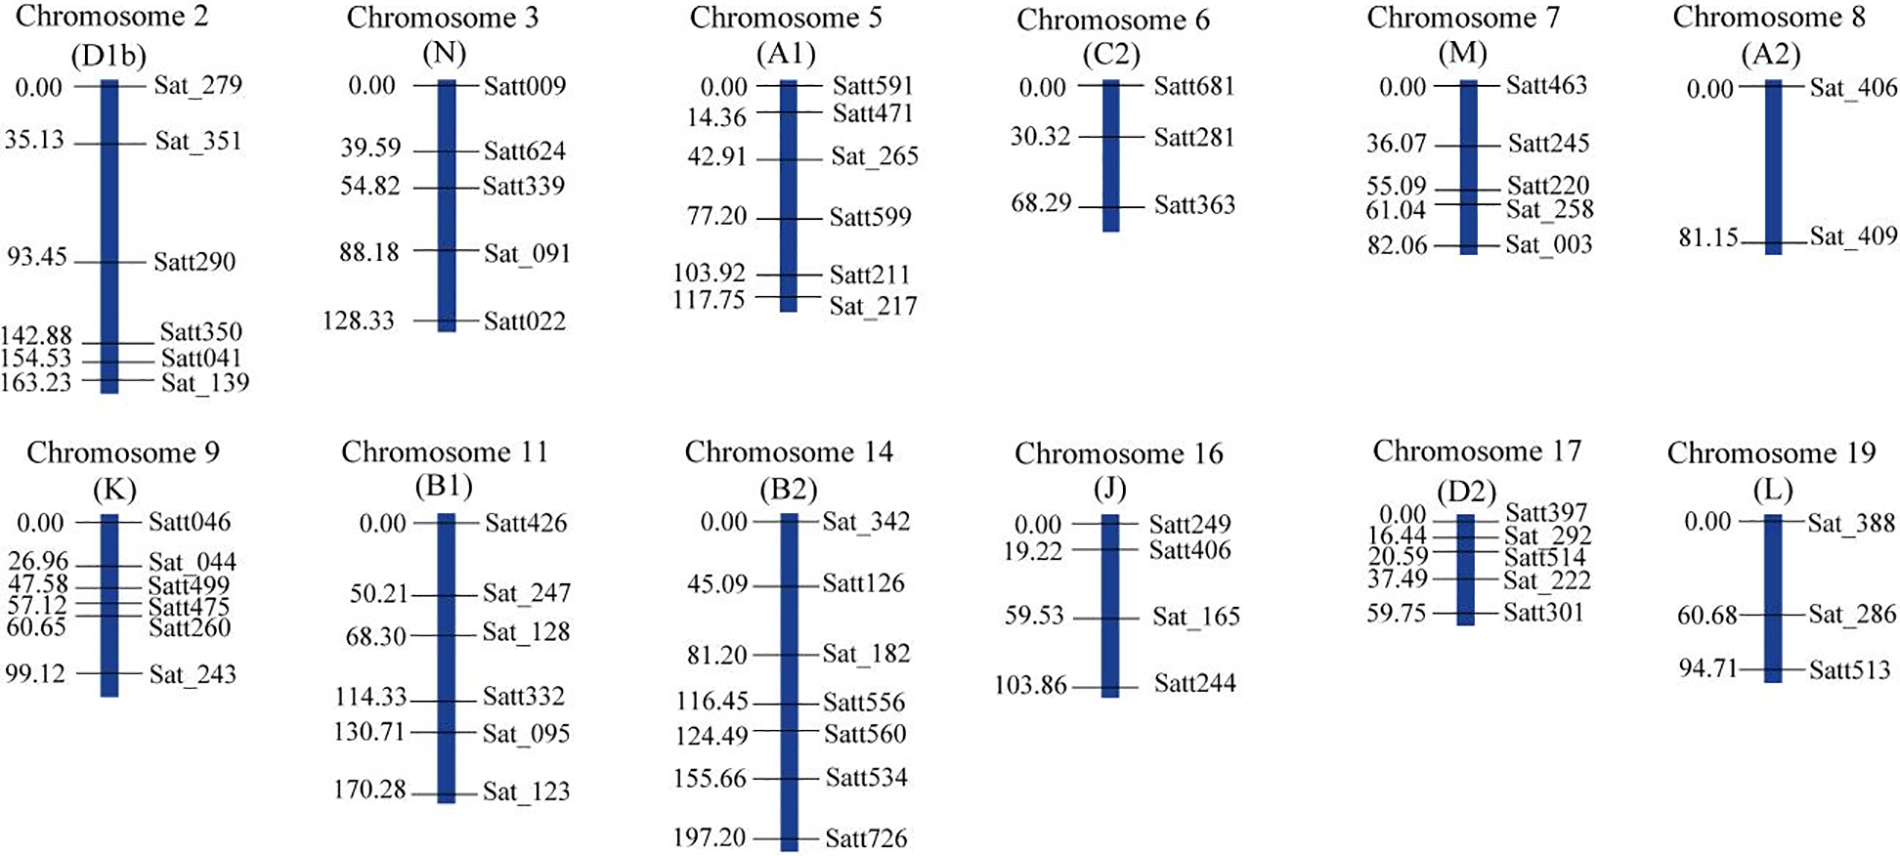
Figure 1: The genetic map of soybean based on SSR markers. The genetic distances (cM) were shown on the left side and the markers on the right
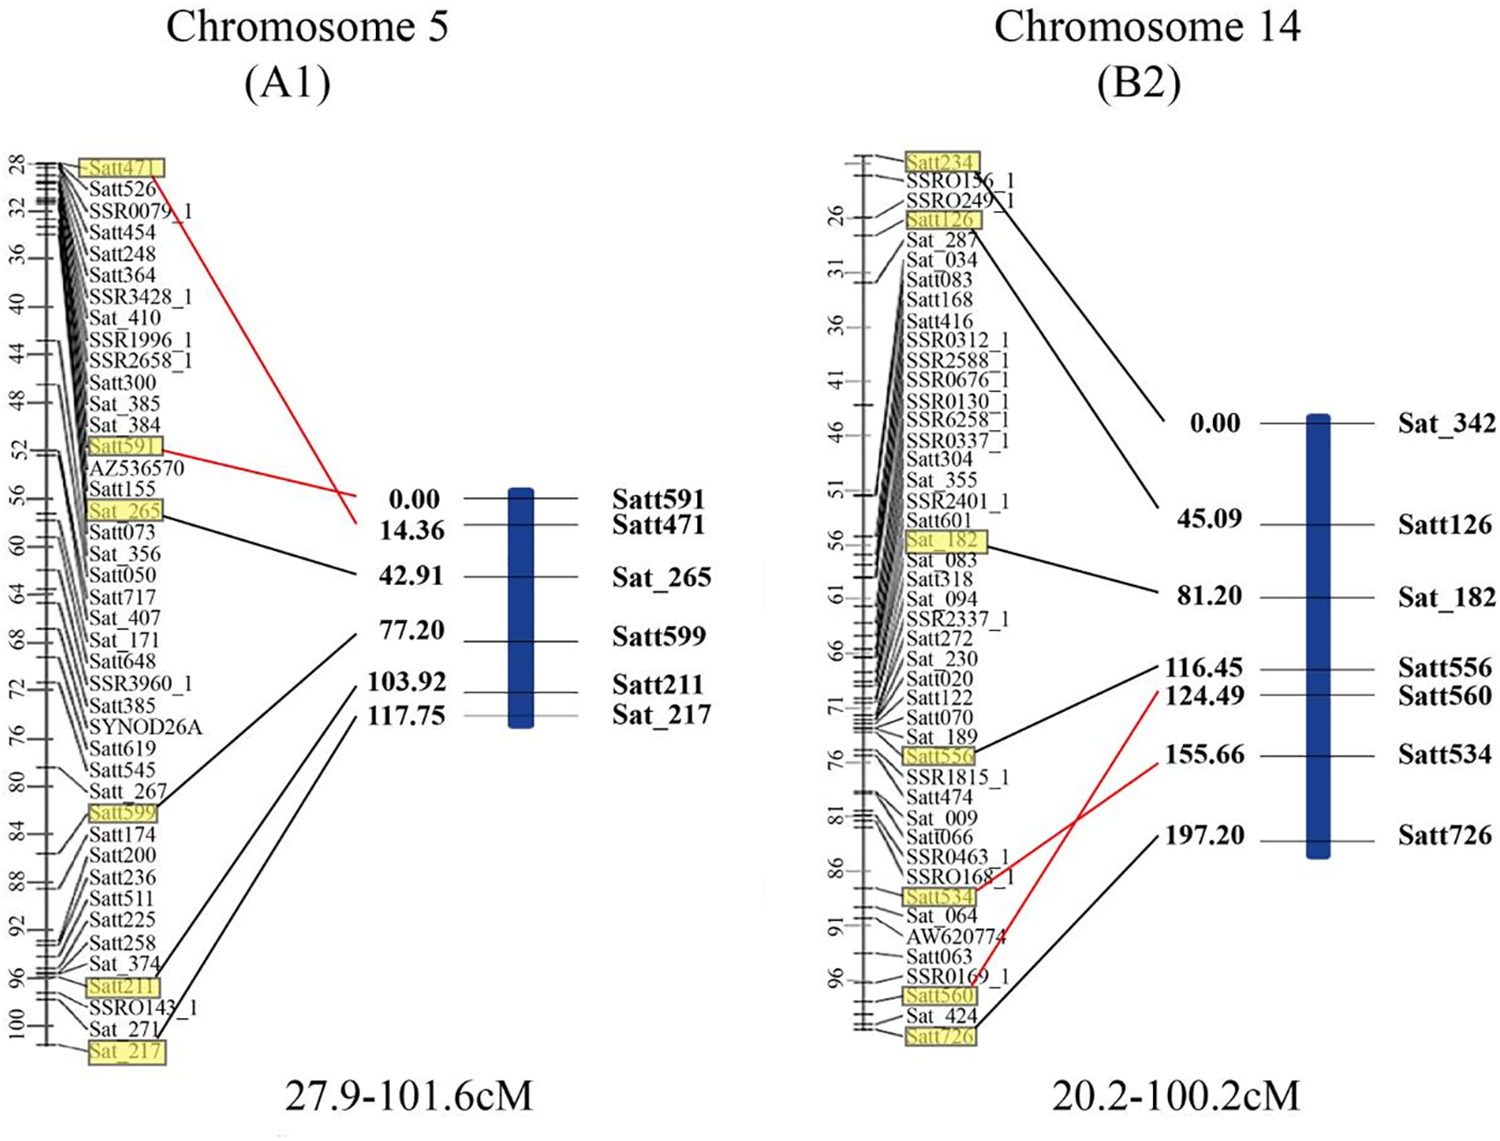
Figure 2: Comparison of the soybean A1 and B2 linkage groups (right) constructed by the Jinong 17 × Jinong 18 RIL population (right) with the corresponding linkage group of GmComposite 2003 genetic map (left). The genetic distances (cM) are shown on the left side and the markers on the right. The common markers between the two maps are highlighted in yellow boxes and connected by black lines, except for the ones of whose positions are rearranged which are connected by red lines
3.3 QTL Mapping for Isoflavone Content in Soybean Seeds
In total, we identified 22 QTLs associated with the main soybean isoflavones including daidzin, glycitin and genistin and total isoflavone content, explained 0.35% to 2.06% of the phenotypic variation. The detailed information for all QTLs is shown in Table 3. All QTLs located on 11 linkage groups. The range of LOD scores and additive effects for the QTLs ranged from 2.98 to 37.30 and −0.34 to 1.27, respectively.
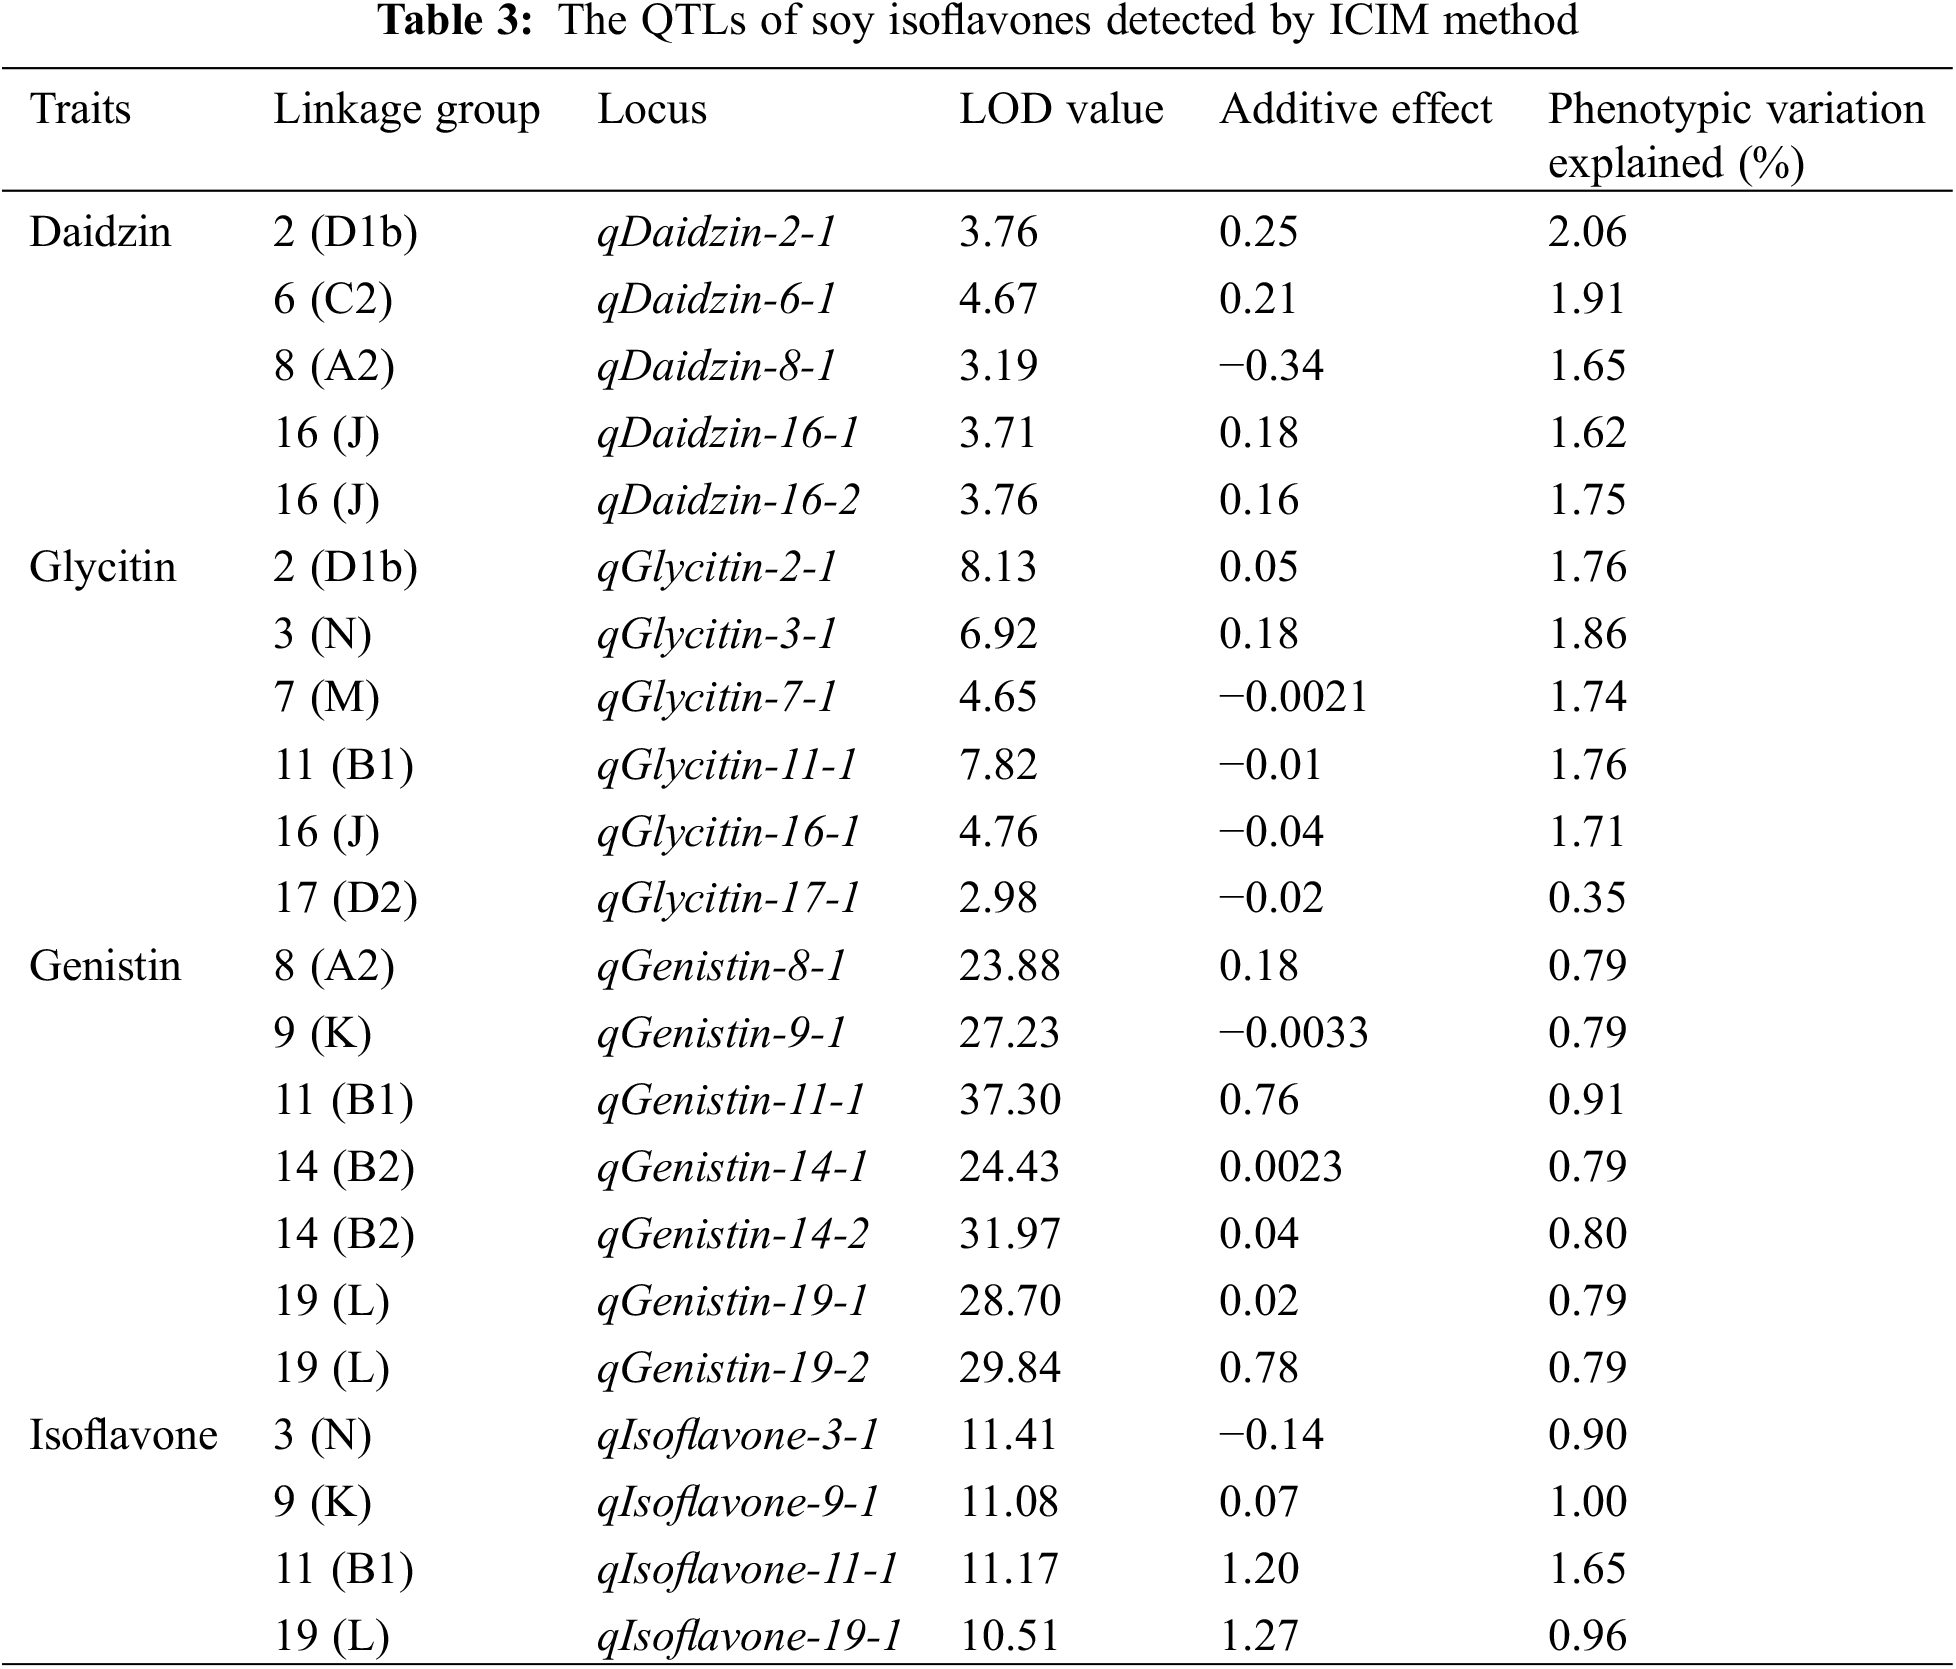
For daidzin, 5 QTLs were distributed on 4 linkage groups, including chromosome 2 (D1b), chromosome 6 (C2), chromosome 8 (A2) and chromosome 16 (J). Six QTLs related to glycitin content were located on chromosome 2 (D1b), chromosome 3 (N), chromosome 7 (M), chromosome 11 (B1), chromosome 16 (J) and chromosome 17 (D2). Seven QTLs related to genistin content were detected on chromosome 8 (A2), chromosome 9 (K), chromosome 11 (B1), chromosome 14 (B2) and chromosome 19 (L). Four QTLs related to the total amount of isoflavones were found on chromosome 3 (N), chromosome 9 (K), chromosome 11 (B1) and chromosome 19 (L). The location of all QTLs for soybean isoflavones detected is shown in Fig. 3.
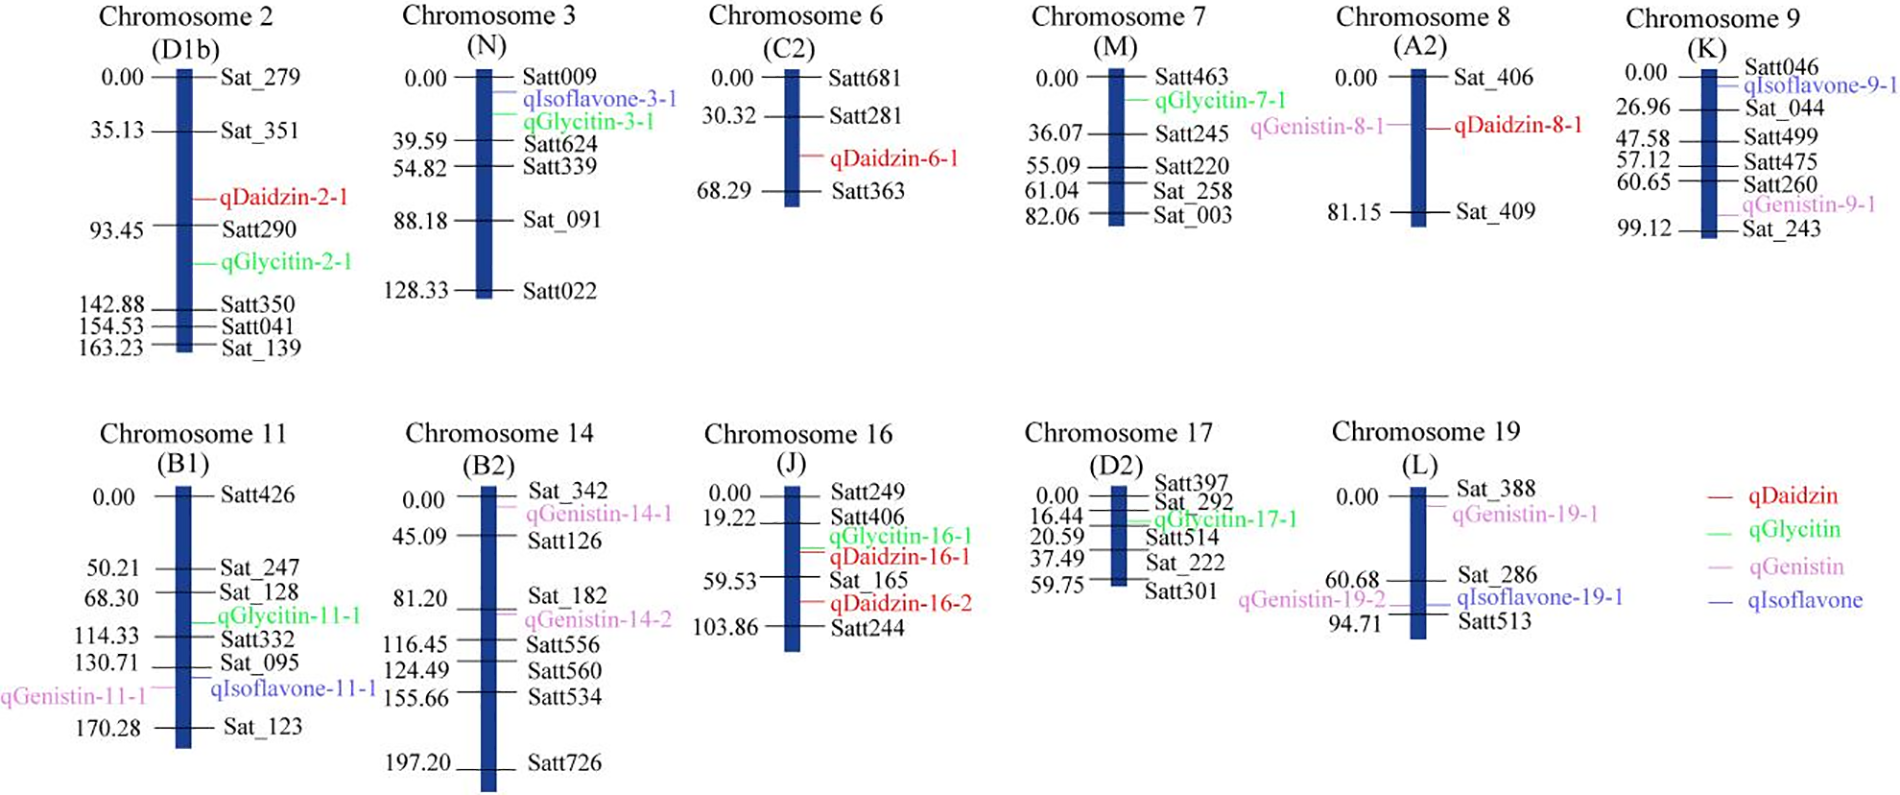
Figure 3: An SSR based linkage map of 22 QTLs for seed isoflavone content in soybean
Note: marker names are labeled at the right side of each linkage group, and distance between makers labeled at the left side, the isoflavones-related QTLs are indicated by colorful labels.
Five loci associated with daidzin content were found in 4 linkage groups. The QTL qDaidzin-8-1, was positioned between Sat_406 and Sat_409 on the chromosome 8 (A2) linkage group, with a LOD value of 3.19 and accounted for 1.65% of the phenotypic variation explained (PVE). The additive effect value for this QTL was −0.34, with the negative value indicating that the allele associated with increased daidzin content derived from the low-isoflavone male parent Jinong 18. Four other QTLs with positive additive effects were located on chromosome 2 (D1b), chromosome 6 (C2) and chromosome 16 (J) were identified for daidzin explaining 1.65%–2.06% of PVE with LOD scores ranging from 3.71 to 4.67 (Table 3).
For glycitin content, six loci were dispersed on 6 linkage groups. QTLs qGlycitin-7-1, qGlycitin-11-1, qGlycitin-16-1 and qGlycitin-17-1 had PVEs ranging from 0.35% to 1.76%, and LOD values ranging from 2.98 to 7.82 and had additive effects with negative values, indicating that the increased glycitin content originated from Jinong 18. Loci qGlycitin-2-1 and qGlycitin-3-1 located on chromosome 2 (D1b) and chromosome 3 (N), with PVE of 1.76% and 1.86% and additive effects of 0.05 and 0.18 (Table 3).
Genistin content was associated with seven loci in 5 linkage groups. The QTL qGenistin-9-1, found on chromosome 9 (K) linkage group between Satt260 and Sat_243, with a genetic distance from Sat_243 of 5.12 cM, had a PVE of 0.79% and an additive effect of −0.0033. However, the remaining QTL associated with genistin, which were located in chromosomes 8 (A2), 11 (B1), 14 (B2) and 19 (L), with PVEs ranging from 0.79%–0.91% and LOD scores ranging from 24.43–37.30 (Table 2), all had positive additive effect values, indicating the associated increases in genistein were derived from the female Jinong 17.
Four loci associated total isoflavone content were located in 4 linkage groups. The QTL qIsoflavone-3-1 was detected on chromosome 3 (N) between Satt009 and Satt624, 3.0 cM from Satt009, with a LOD values of 11.41, and it had additive effect of −0.14. However, the remining three QTLs had positive additive effects values. These QTL, qIsoflavone-9-1, qIsoflavone-11-1, qIsoflavone-19-1, were located on chromosomes 9 (K), 11 (B1) and 19 (L), and had PVEs from 0.96% to 1.65% with LOD scores ranging from 10.51–11.17 (Table 2).
3.4 Identification of Candidate Genes in Flavone or Isoflavone-Related QTL Regions
Referring to the SSR marker information in the SoyBase database, 22 QTLs were mapped to the Wm82.a2.v1 reference genome, resulting in a total of 6462 genes obtained. Gene annotation identified 58 genes related to isoflavone synthesis (Table S1). Among them, many genes were annotated as transcript factors and enzymes. Interestingly, nineteen of the candidate genes are involved in phenylpropanoid metabolism, which is a metabolic pathway associated with flavonoid metabolism and isoflavonoid metabolism [41] (Table 4). Of the nineteen genes, seven genes relates to lactase Laccase 2,3,5,7 and Laccase 15/TT10 were identified here compared with A. thaliana, and several studies have shown that laccase can regulate the synthesis of phenylpropanoid and lignin [42–44], as phenylpropanoid, lignin also associated with synthesis of flavonoid and isoflavonid metabolism [45]. Meanwhile, several transcript factors of A. thaliana homolog, e.g., bHLH42, MYB20 and TTG1, to directly regulate flavones or isoflavones synthesis in A. thaliana [46–48]. These results imply the accuracy of our QTL mapping. Finally, the RNA-Seq atlas of soybean different tissues the was obtained from Phytozome to use select candidate genes [49,50]. The expression dynamic variation of all these identified genes expressed in the seed were differed than other tissues (Fig. 4). We found that nine of the fifty-six genes with expression data were highly expressed in seeds, Glyma.02G076300, Glyma.02G147800, Glyma.06G136900, Glyma.08G062000, Glyma.08G062100, Glyma.09G020300, Glyma.16G158400, Glyma.17G156000 and Glyma.19G102000, respectively. Some genes were also expressed in seeds, although their expression was not higher than in other tissues, such as Glyma.02G125100, Glyma.06G16500 and Glyma.11G189100.
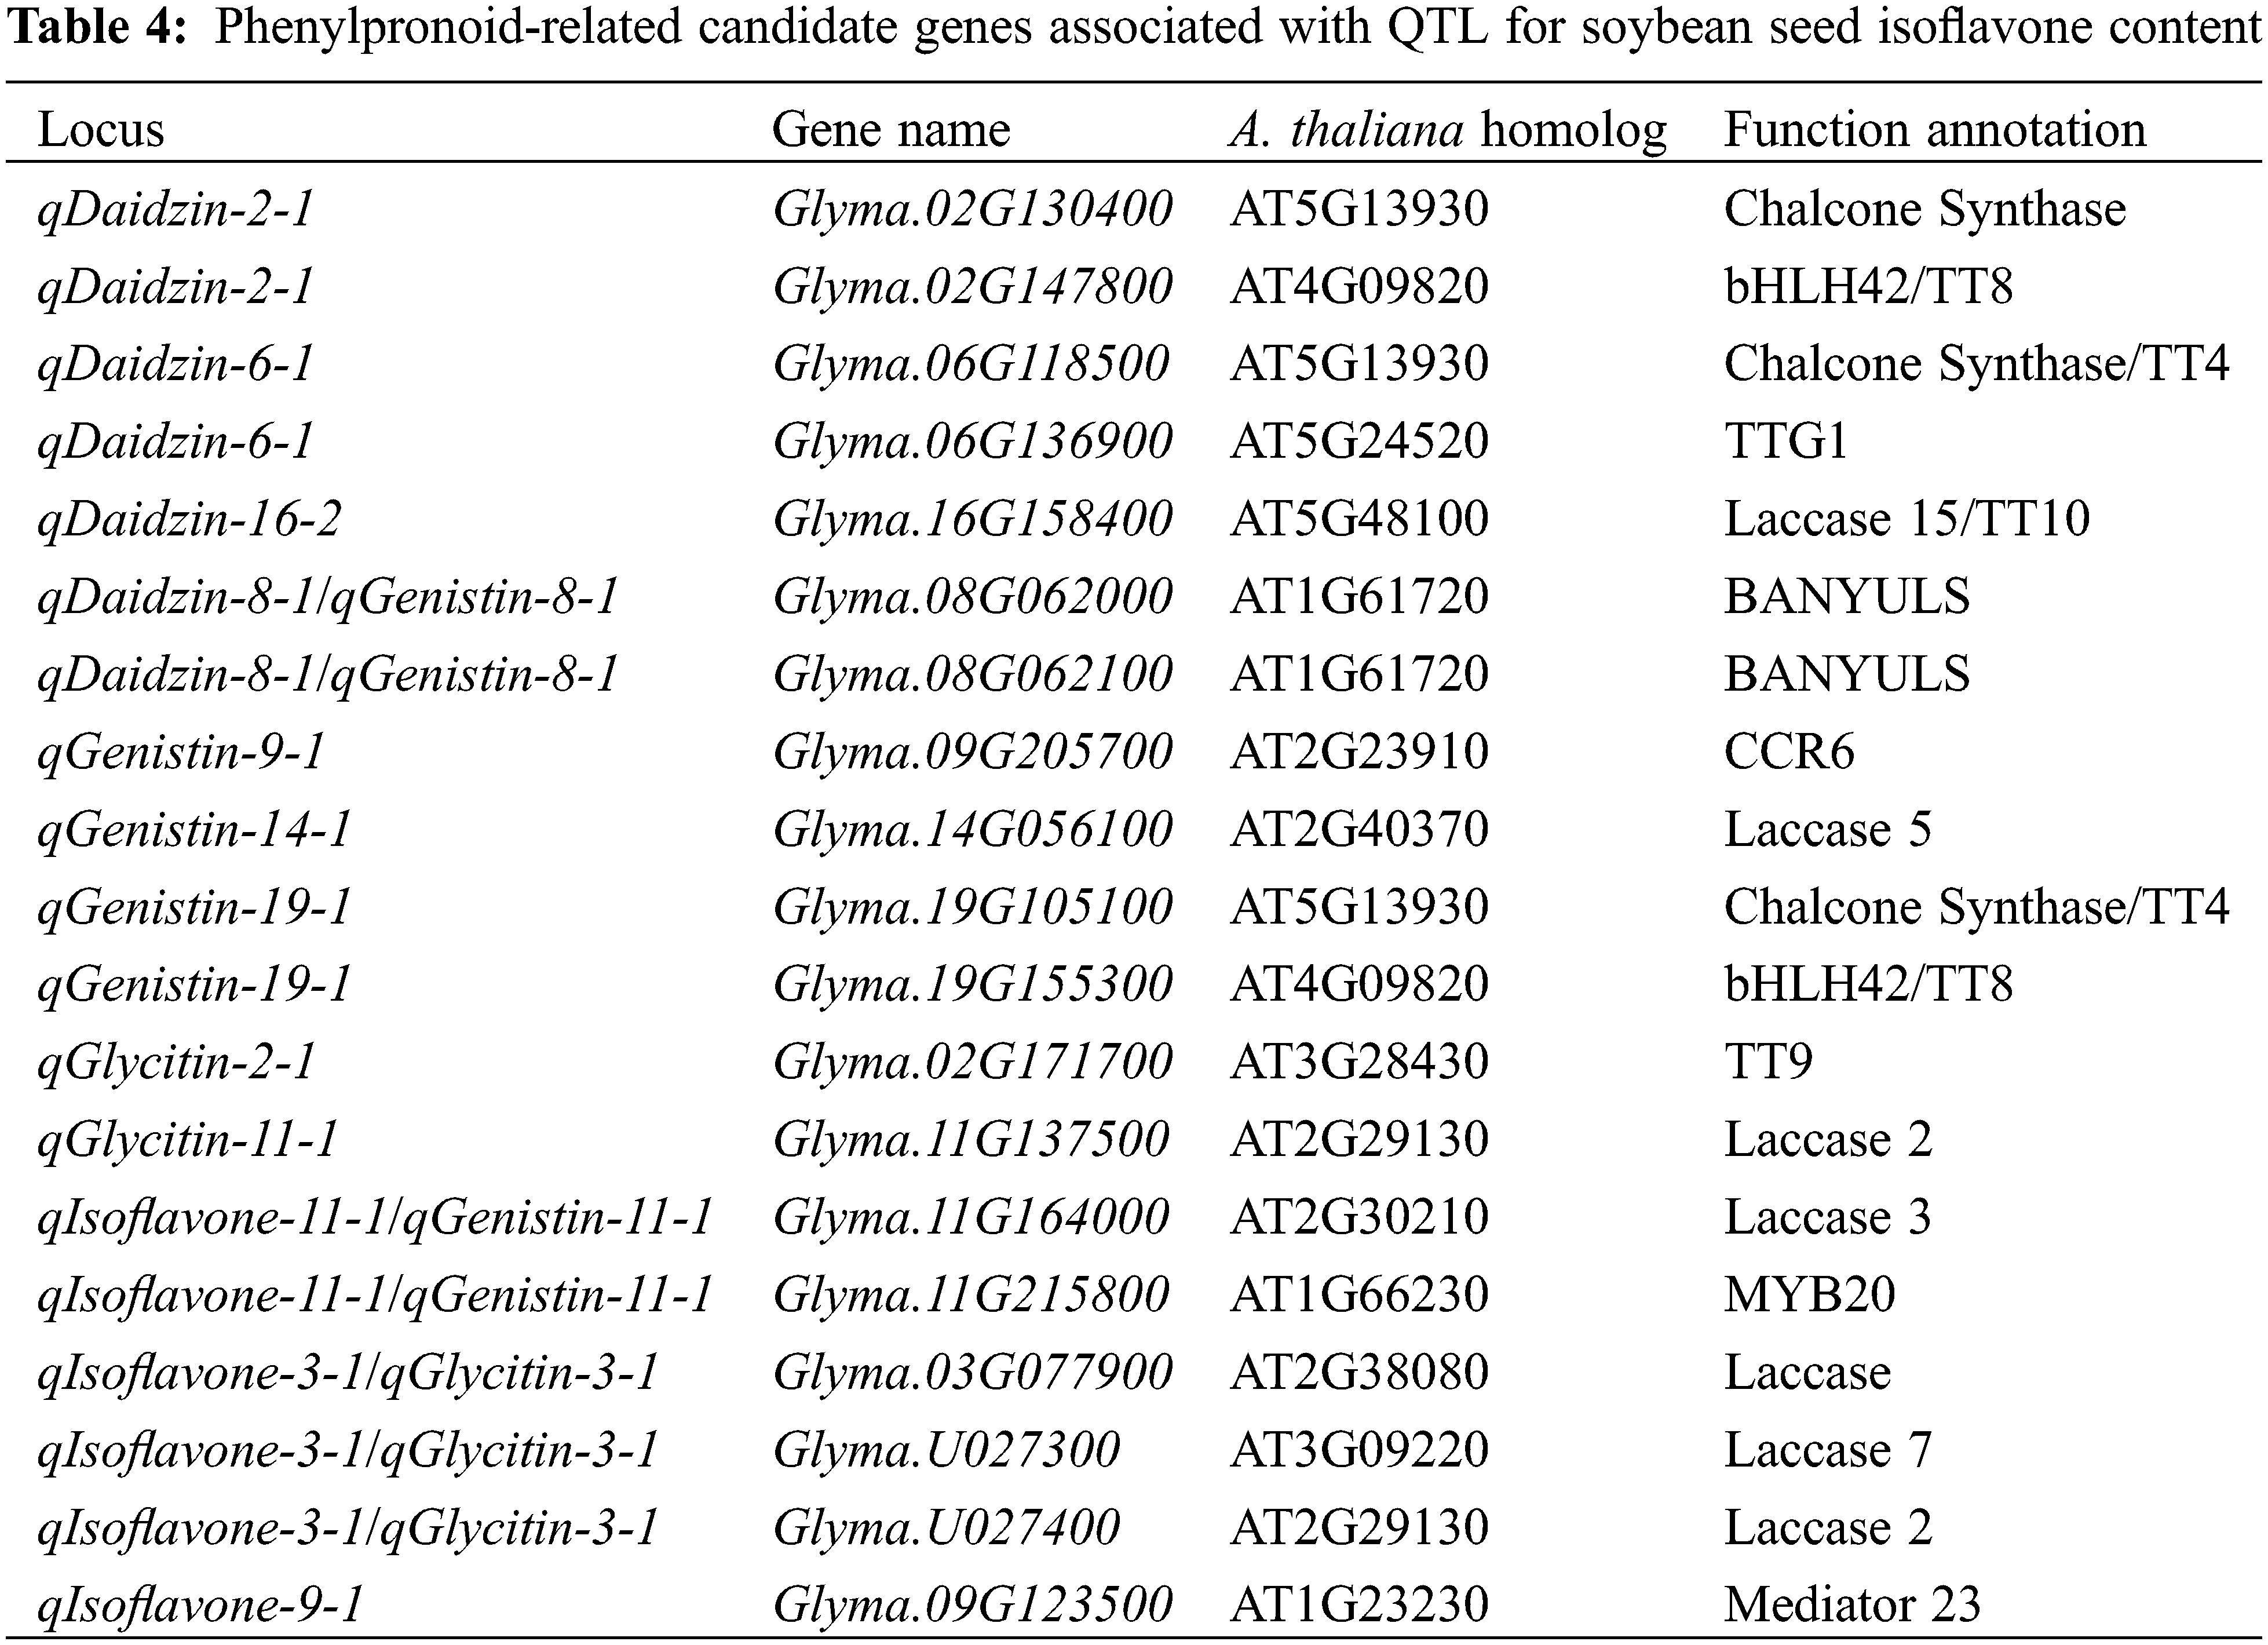
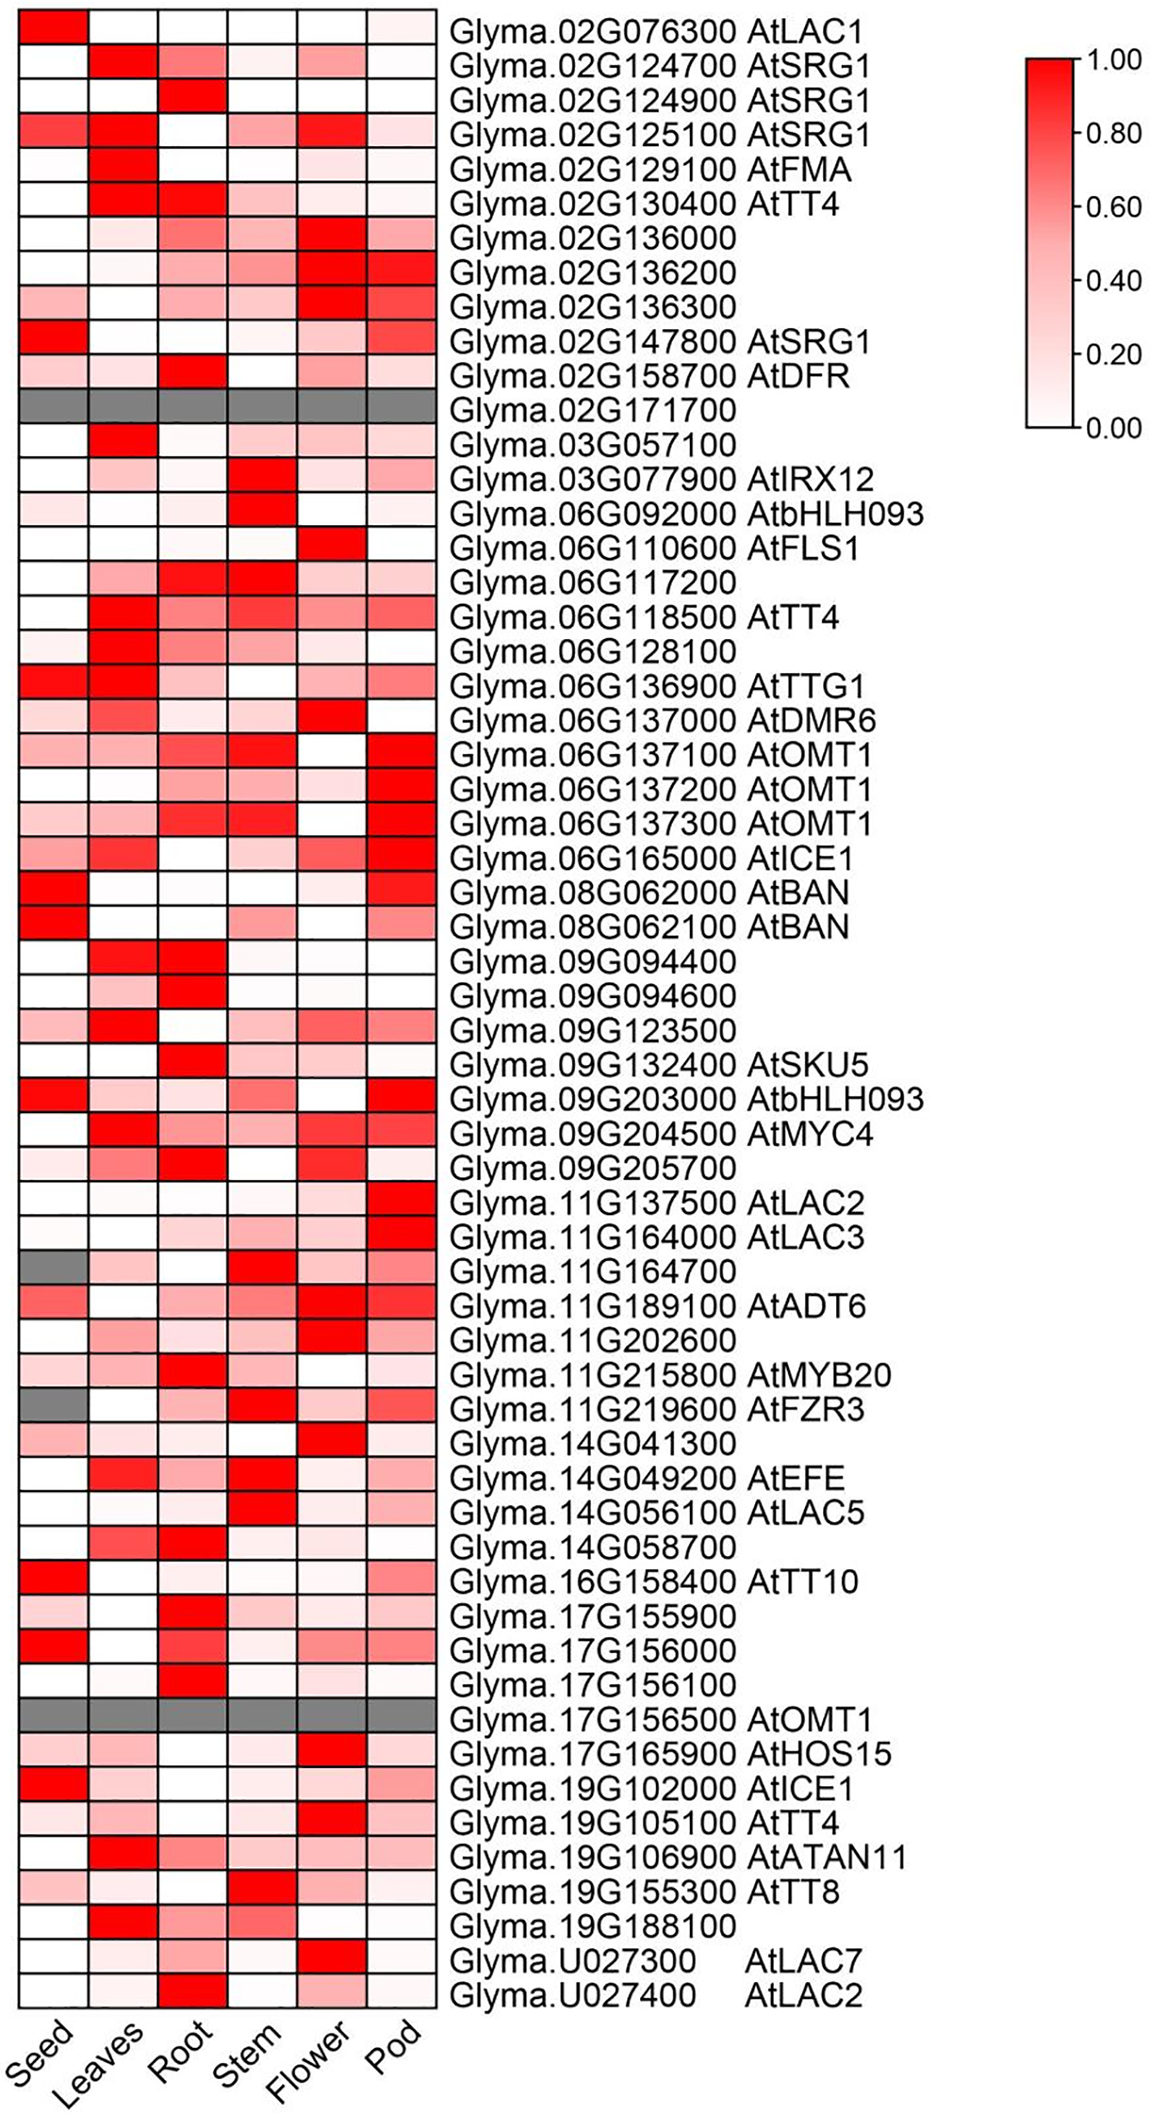
Figure 4: Identification of isoflavone-related candidate genes through transcriptome profile analysis. Normalized FPKM values (from Phytozome) are depicted on the Z-Score scale, gray indicates no expression data of the target gene in the database. If the candidate gene has homologous genes in Arabidopsis, annotate the homologous gene name after the Locus ID; otherwise, leave it blank
The expression profiles of flavonoid-rich soybean germplasm at different seed developmental stages were also used for candidate gene screening [51]. The results showed that 29 candidate genes were highly expressed at 70 days after flowering (DAF) when isoflavones accumulated rapidly in soybean seeds (Fig. 5). Annotation of these genes indicates that the majority of genes are functional proteins or genes of unknown function (Table S2). Furthermore, three genes exhibited high expression levels in seeds relative to other tissues, as evidenced in the Phytozome database (Fig. 6). It is noteworthy that one of these genes, Glyma.16G158400, is involved in the phenylpropanoid metabolic pathway and has been annotated laccase (Table 1). The remaining two genes are Glyma.19G217700, which is annotated as a stachyose synthase (EC 2.4.1.67), and the unknown protein gene Glyma.11G164400. As a result of the overlap of these three genes in two pivotal expression profiles, they are regarded as pivotal candidate genes.
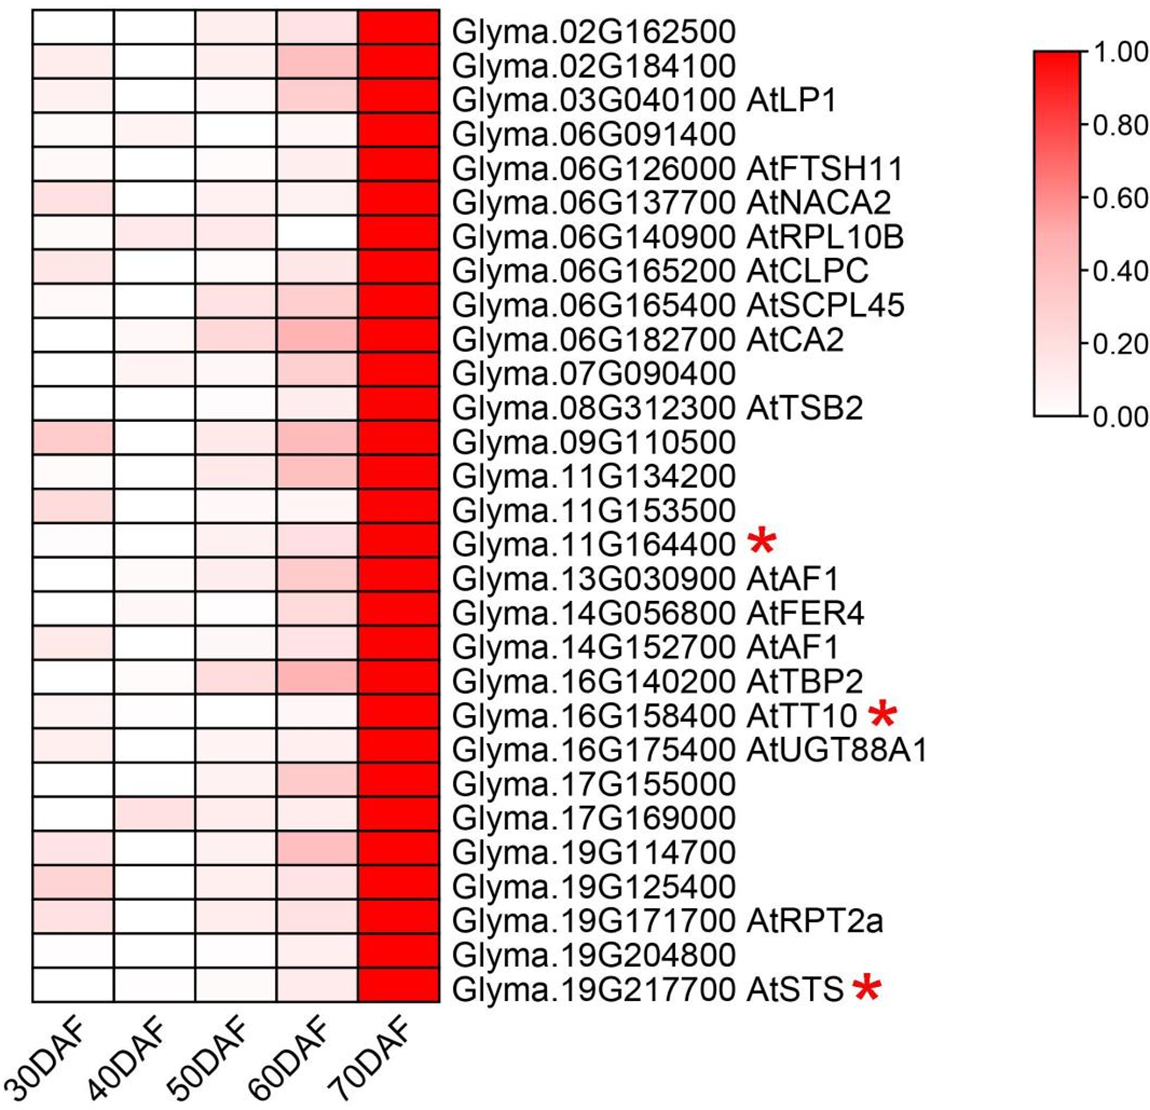
Figure 5: Gene expression profiles at different seed developmental periods in flavonoid-rich soybean. Expression scores (from previous research [36] are depicted on the Z-Score scale). If the candidate gene has homologous genes in Arabidopsis, annotate the homologous gene name after the Locus ID; otherwise, leave it blank. The asterisk after the Locus ID indicates a high expression in seeds in the public database as well (from Phytozome)
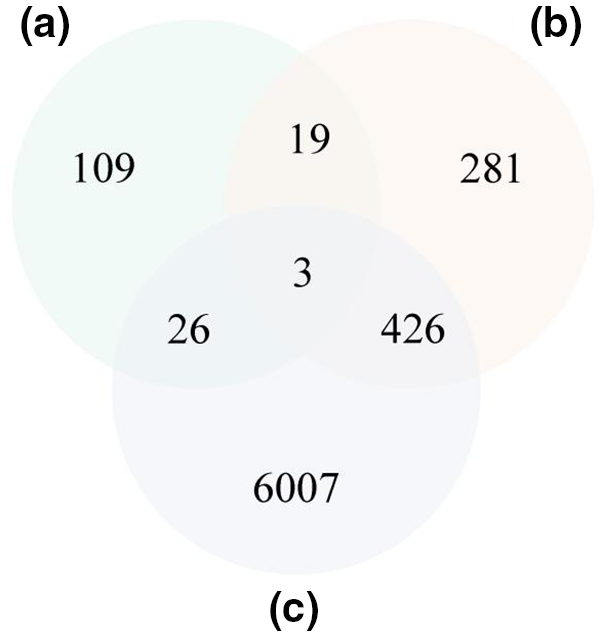
Figure 6: Identification of isoflavone-related candidate genes through integration of QTL analysis and transcriptome profile analysis. The Venn diagram displays (a: green circle) the genes which expressed highest at 70 DAF when isoflavones rapidly accumulate in soybean seeds overlapped with (b: orangish circle) the genes expressed highest in soybean seeds compared to other tissues and (c: purple circle) the genes in the isoflavone related QTL regions
3.5 Tissue Expression Levels Analysis of Candidate Genes for Soybean Isoflavones
To ascertain whether three pivotal candidate genes are associated with flavones synthesis, mRNA was extracted from the roots, stems, leaves, and seeds of two germplasm (JY108 and JMSD) with a high flavones content and two germplasm (ZH2 and SN79) with a low flavones content. The results of qRT-PCR displayed that the three genes in the low isoflavone varieties exhibited comparable expression levels across four tissues, with lower overall expression (Figs. 7–9). Conversely, high isoflavone varieties demonstrated markedly high relative expression levels in seeds, surpassing those of low flavonoid varieties (one-way ANOVA, p < 0.05). Additionally, the highest isoflavone content variety exhibited highest expression levels in comparison to other varieties. In conclusion, these three candidate genes not only demonstrate tissue-specific expression patterns but also exhibit a positive correlation between their expression levels and isoflavone content in seeds. Therefore, we hypothesize that these three genes play a pivotal role in regulating the synthesis of isoflavones in soybean seeds.
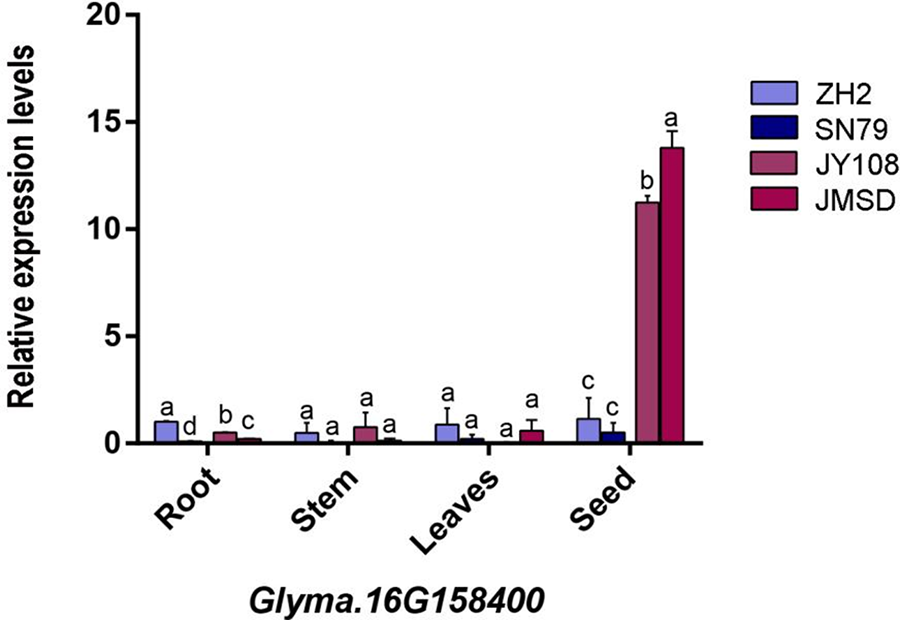
Figure 7: The expression level of the Glyma.16G158400 gene in the root, stem, leaves, and seed of four germplasms. The x-axis represents organs, and the y-axis represents gene expression levels. The lowercase letters in the figure represent the differences in expression levels between different samples within the same organ (one-way ANONA, p < 0.05)
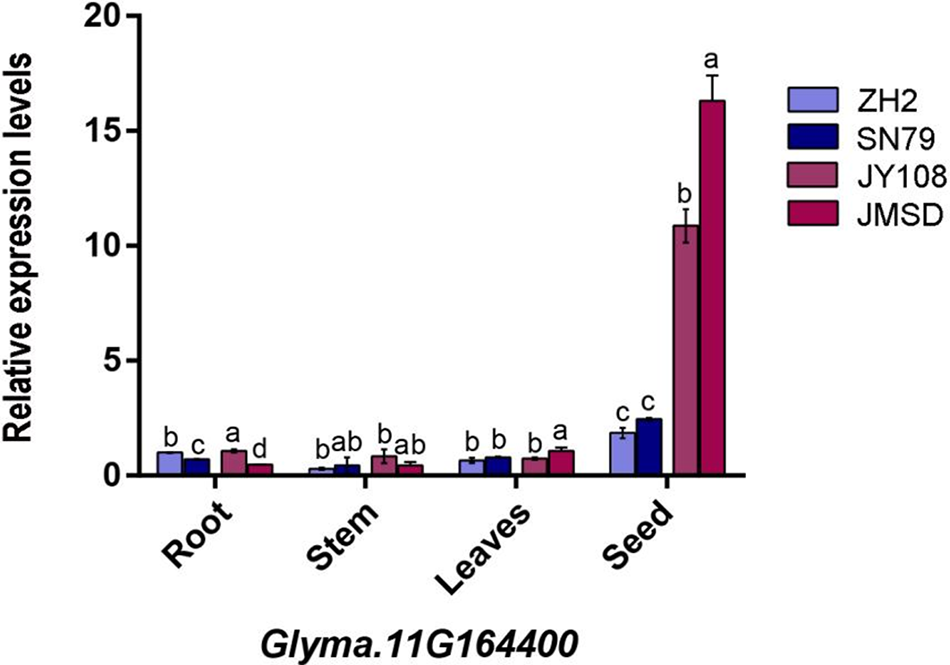
Figure 8: The expression level of the Glyma.11G164400 gene in the root, stem, leaves, and seed of four germplasms. The x-axis represents organs, and the y-axis represents gene expression levels. The lowercase letters in the figure represent the differences in expression levels between different samples within the same organ (one-way ANONA, p < 0.05)
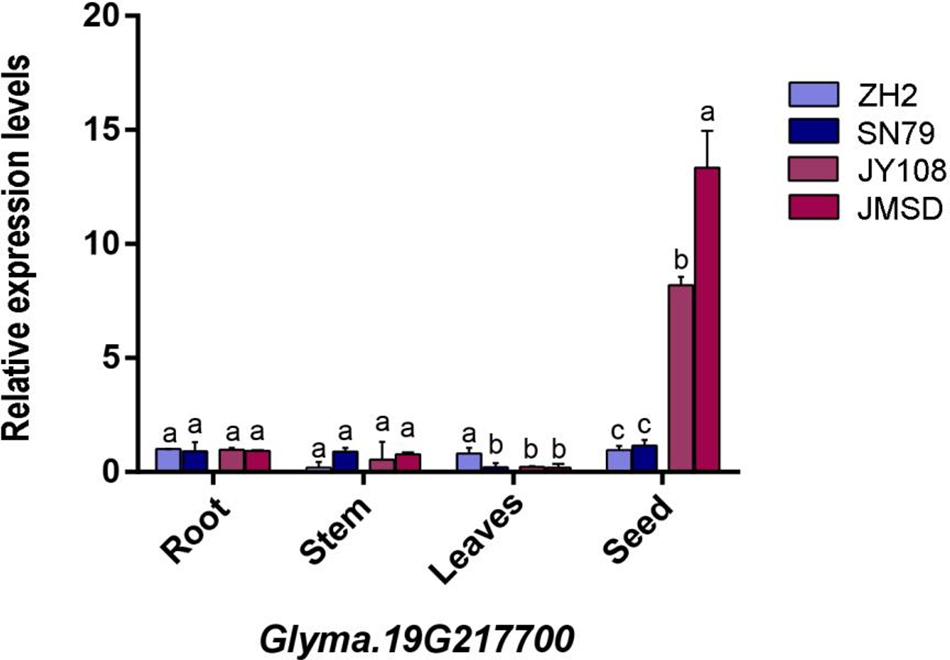
Figure 9: The expression level of the Glyma.19G217700 gene in the root, stem, leaves, and seed of four germplasms. The x-axis represents organs, and the y-axis represents gene expression levels. The lowercase letters in the figure represent the differences in expression levels between different samples within the same organ (one-way ANONA, p < 0.05)
The isoflavone content of soybean seeds is a quantitative trait that is determined by multiple QTLs and environmental factors [52]. Ideally, breeders would like to introduce multiple genes into elite soybean cultivars to produce a superior variety with high yield and high isoflavone content in seeds. Achieving this goal through traditional methods has proven to be a challenge due to long breeding cycles. Identification of QTLs would provide the much-needed tools for efficient selection of high isoflavone content [35]. The RILs described here, as a permanent isolated population, provided good material for genetic map construction and QTL mapping. Using an RIL population of 178 F2:6 and 58 SSR molecular markers, we assembled a genetic linkage map covering 11 chromosomes. This yielded a total of 22 QTLs related to isoflavone content. The sequence of SSR markers on the linkage groups was mostly consistent with previously reported maps. Among the detected sites, 5, 7 and 6 were associated with daidzin, genistin and glycitin content, respectively. Four QTLs were found to be associated with total isoflavones, two which corresponded to genistin QTLs, and one to a glycitin QTL. Referring to the 2003 soybean public genetic map (GmComposite 2003), 15 QTLs were classified corresponded to those in the SoyBase database (https://www.soybase.org), and 7 new ones were identified including qDaidzin-2-1, qGlycitin-11-1, qGlycitin-16-1, Genistin-8-1, qGenistin-9-1, qGenistin-14-1 and qGenistin-19-2.
The synthesis of flavonoids depends on the provision of precursors through phenylpropanoid phenylpropane metabolism [41]. A research of QTL mapping in pepper F2 population indicated that its candidate genes were associated with some synthesis of early compounds in phenylpropanoid/flavonoid synthesis pathway [53]. Additionally, the loss of function of candidate gene CaMYB12-like was demonstrated to cause a decrease in the flavonoid content of the fruits. Similarly, a study utilizing the F2 population to map the isoflavone content in soybean seeds also indicated that candidate genes contain some proteins encoding the phenylpropanoid pathway [54]. In this study, dozens of candidate genes were associated with phenylpropanoid metabolism (Table S1). One of these genes is Glyma.11G215800, whose homolog AtMYB20 has been confirmed to increase flavonoid content when its function is inhibited [55]. Multiple laccase genes are involved in phenylpropanoid/lignin metabolism and linked to the synthesis of isoflavones [42–45]. For instance, previous research revealed a significant increase of flavonoids in Laccase 1 RNAi lines in cotton (Gossypium hirsutum) [48], whereas Laccase 15 exhibited the opposite trend [56]. Notably, a laccase gene Glyma.16G158400, identified as a key candidate gene. Its expression in seeds shows a positive correlation with soy isoflavone content (Fig. 7) and is highly expressed in seeds according to public expression databases (Fig. 4). Hence, this gene is likely to be a key regulator of isoflavone synthesis in soybean seeds. Meanwhile, considering the interconnection between the phenylpropanoid/lignin/flavonoid synthesis pathway [41], it is plausible that these genes in QTL regions may contribute to flavonoid formation through influencing the synthesis of the first two types of compounds. Additionally, two other key candidate genes, Glyma.11G164400 and Glyma.19G217700, were identified as stachyose synthase and unknown proteins, and they also exhibited the same expression pattern as Glyma.16G158400 (Figs. 8 and 9). This indicates a correlation between carbohydrate metabolism and flavonoid synthesis; however, the mechanism by which this occurs remains to be determined. Finally, CHS is directly involved in the regulation of isoflavone synthesis [23]. Three candidate genes, Glyma.02G130400, Glyma.06G118500, and Glyma.19G105100, were identified as CHS in our research (Tabel 4), with Glyma.02G130400 also being associated with soybean isoflavone QTL mapping in another study [57,58]. All in all, the aforementioned genes are closely associated with the flavonoid content of soybean seeds. Utilizing molecular biology in the next study to elucidate the specific mechanisms involved could address the current knowledge gap in the synthesis of flavonoids in soybeans.
The present study used an RIL population derived from two parents with different isoflavones components, Jinong 17 and Jinong 18, to detect QTLs as well as mine possible candidate genes controlling soybean isoflavones content. A total of 22 QTLs were found, and 7 of these were novel ones. Through gene annotation, a total of 6462 candidate genes were obtained, among which 58 were shown to be related to flavonoid synthesis. Finally, qRT-PCR was used to detect the relative expression levels of three key genes Glyma.11G164400, Glyma.16G158400, and Glyma.19G217700 in soybean tissues with differences in seed isoflavone content in four germplasms. The results showed that all three genes showed a specifically high expression level in seeds and a positive correlation with the flavonoid content. These results advance our understanding of the genetic basis of isoflavone synthesis and accumulation in soybeans.
Acknowledgement: Not applicable.
Funding Statement: This research is funded by the Key Research and Development Program of Science and Technology of Jilin Province (No. 20220202011NC).
Author Contributions: Songnan Yang and Miao Zhang performed experiments, wrote original draft. Rongrong Yao, Liangyu Chen, Weixuan Cong, Dan Yao, Jian Zhang performed the experiments and data analyses. Jun Zhang and Xueying Li conceived and designed the study, provided their expertise and reviewed the manuscript. All authors reviewed the results and approved the final version of the manuscript.
Availability of Data and Materials: All the data are included in this article.
Ethics Approval: Not applicable.
Conflicts of Interest: The authors declare that they have no conflicts of interest to report regarding the present study.
Supplementary Materials: The supplemental material is available online at https://doi.org/10.32604/phyton.2024.055046.
References
1. Kim I-S. Current perspectives on the beneficial effects of soybean isoflavones and their metabolites for humans. Antioxidants. 2021;10(7):1064. doi:10.3390/antiox10071064. [Google Scholar] [PubMed] [CrossRef]
2. Azam M, Zhang S, Abdelghany AM, Shaibu AS, Feng Y, Li Y, et al. Seed isoflavone profiling of 1168 soybean accessions from major growing ecoregions in China. Food Res Int. 2020;130:108957. doi:10.1016/j.foodres.2019.108957. [Google Scholar] [PubMed] [CrossRef]
3. Dhaubhadel S, McGarvey BD, Williams R, Gijzen M. Isoflavonoid biosynthesis and accumulation in developing soybean seeds. Plant Mol Biol. 2003;53(6):733–43. doi:10.1023/B:PLAN.0000023666.30358.ae. [Google Scholar] [PubMed] [CrossRef]
4. Li X, Kamala S, Tian R, Du H, Li W, Kong Y, et al. Identification and validation of quantitative trait loci controlling seed isoflavone content across multiple environments and backgrounds in soybean. Mol Breed. 2017;38(1):8. doi:10.1007/s11032-017-0768-8. [Google Scholar] [CrossRef]
5. Lowe ED, Gao G-Y, Johnson LN, Keung WM. Structure of daidzin, a naturally occurring anti-alcohol-addiction agent, in complex with human mitochondrial aldehyde dehydrogenase. J Med Chem. 2008;51(15):4482–7. doi:10.1021/jm800488j. [Google Scholar] [PubMed] [CrossRef]
6. Yang MH, Jung SH, Chinnathambi A, Alahmadi TA, Alharbi SA, Sethi G, et al. Attenuation of STAT3 signaling cascade by daidzin can enhance the apoptotic potential of bortezomib against multiple myeloma. Biomolecules. 2020;10(1):23. [Google Scholar]
7. Wei G, Liang T, Wei C, Nong X, Lu Q, Zhao J. Daidzin inhibits RANKL-induced osteoclastogenesis in vitro and prevents LPS-induced bone loss in vivo (Retracted article. See vol. 123, pp. 1119, 2022). J Cell Biochem. 2019;120(4):5304–14. doi:10.1002/jcb.27806. [Google Scholar] [PubMed] [CrossRef]
8. Xiao F, Cui H, Zhong X. Beneficial effect of daidzin in dry eye rat model through the suppression of inflammation and oxidative stress in the cornea. Saudi J Biol Sci. 2018;25(4):832–7. doi:10.1016/j.sjbs.2016.11.016. [Google Scholar] [PubMed] [CrossRef]
9. Zhao L, Chen Q, Brinton RD. Neuroprotective and neurotrophic efficacy of phytoestrogens in cultured hippocampal neurons. Exp Biol Med. 2002;227(7):509–19. doi:10.1177/153537020222700716. [Google Scholar] [PubMed] [CrossRef]
10. Wang W, Yang R, Zhang M, Li J, Peng J, Xu M, et al. Glycitin suppresses cartilage destruction of osteoarthritis in mice. Inflammation. 2020;43(4):1312–22. doi:10.1007/s10753-020-01210-3. [Google Scholar] [PubMed] [CrossRef]
11. Chen Y, Guo S, Jiang K, Wang Y, Yang M, Guo M. Glycitin alleviates lipopolysaccharide-induced acute lung injury via inhibiting NF-κB and MAPKs pathway activation in mice. Int Immunopharmacol. 2019;75:105749. [Google Scholar] [PubMed]
12. Choi YR, Shim J, Kim MJ. Genistin: a novel potent anti-adipogenic and anti-lipogenic agent. Molecules. 2020;25(9):2042. [Google Scholar] [PubMed]
13. Graham TL. Flavonoid and isoflavonoid distribution in developing soybean seedling tissues and in seed and root exudates. Plant Physiol. 1991;95(2):594–603. [Google Scholar] [PubMed]
14. Lozovaya VV, Lygin AV, Zernova OV, Li S, Hartman GL, Widholm JM. Isoflavonoid accumulation in soybean hairy roots upon treatment with Fusarium solani. Plant Physiol Biochem. 2004;42(7):671–9. [Google Scholar] [PubMed]
15. Dong W, Song Y. The significance of flavonoids in the process of biological nitrogen fixation. Int J Mol Sci. 2020;21(16):5926. [Google Scholar] [PubMed]
16. Mortier V, Fenta BA, Martens C, Rombauts S, Holsters M, Kunert K, et al. Search for nodulation-related CLE genes in the genome of Glycine max. J Exp Bot. 2011;62(8):2571–83. doi:10.1093/jxb/erq426. [Google Scholar] [PubMed] [CrossRef]
17. Naoumkina M, Farag MA, Sumner LW, Tang Y, Liu C-J, Dixon RA. Different mechanisms for phytoalexin induction by pathogen and wound signals in Medicago truncatula. Proc Natl Acad Sci U S A. 2007;104(46):17909–15. doi:10.1073/pnas.0708697104. [Google Scholar] [PubMed] [CrossRef]
18. Wegulo SN, Yang X-B, Martinson CA, Murphy PA. Effects of wounding and inoculation with Sclerotinia sclerotiorum on isoflavone concentrations in soybean. Can J Plant Sci. 2005;85(4):749–60. doi:10.4141/P04-076. [Google Scholar] [CrossRef]
19. Algar E, Gutierrez-Mañero FJ, Garcia-Villaraco A, García-Seco D, Lucas JA, Ramos-Solano B. The role of isoflavone metabolism in plant protection depends on the rhizobacterial MAMP that triggers systemic resistance against Xanthomonas axonopodis pv. glycines in Glycine max (L.) Merr. cv. Osumi. Plant Physiol Biochem. 2014;82:9–16. [Google Scholar] [PubMed]
20. Dodds PN, Rathjen JP. Plant immunity: towards an integrated view of plant-pathogen interactions. Nat Rev Genet. 2010;11(8):539–48. doi:10.1038/nrg2812. [Google Scholar] [PubMed] [CrossRef]
21. Kosslak RM, Bohlool BB. Suppression of nodule development of one side of a split-root system of soybeans caused by prior inoculation of the other side. Plant Physiol. 1984;75(1):125–30. [Google Scholar] [PubMed]
22. Eldridge AC, Kwolek WF. Soybean isoflavones: effect of environment and variety on composition. J Agric Food Chem. 1983;31(2):394–6. [Google Scholar] [PubMed]
23. Jung W, Yu O, Lau SM, O’Keefe DP, Odell J, Fader G, et al. Identification and expression of isoflavone synthase, the key enzyme for biosynthesis of isoflavones in legumes. Nat Biotechnol. 2000;18(2):208–12. [Google Scholar] [PubMed]
24. Liang H-Z, Yu Y-L, Wang S-F, Lian Y, Wang T-F, Wei Y-L, et al. QTL mapping of isoflavone, oil and protein contents in soybean (Glycine max L. Merr.). Agric Sci China. 2010;9(8):1108–16. [Google Scholar]
25. Wang Y, Han Y, Zhao X, Li Y, Teng W, Li D, et al. Mapping isoflavone QTL with main, epistatic and QTL × environment effects in recombinant inbred lines of soybean. PLoS One. 2015;10(3):e0118447. [Google Scholar] [PubMed]
26. Wu D, Li D, Zhao X, Zhan Y, Teng W, Qiu L, et al. Identification of a candidate gene associated with isoflavone content in soybean seeds using genome-wide association and linkage mapping. Plant J. 2020;104(4):950–63. doi:10.1111/tpj.14972. [Google Scholar] [PubMed] [CrossRef]
27. Chu S, Wang J, Zhu Y, Liu S, Zhou X, Zhang H, et al. An R2R3-type MYB transcription factor, GmMYB29, regulates isoflavone biosynthesis in soybean. PLoS Genet. 2017;13(5):e1006770. doi:10.1371/journal.pgen.1006770. [Google Scholar] [PubMed] [CrossRef]
28. Vadivel AKA, Renaud J, Kagale S, Dhaubhadel S. GmMYB176 regulates multiple steps in isoflavonoid biosynthesis in soybean. Front Plant Sci. 2019;10:562. [Google Scholar]
29. Gutierrez-Gonzalez JJ, Wu X, Zhang J, Lee J-D, Ellersieck M, Shannon JG, et al. Genetic control of soybean seed isoflavone content: importance of statistical model and epistasis in complex traits. Theor Appl Genet. 2009;119(6):1069–83. doi:10.1007/s00122-009-1109-z. [Google Scholar] [PubMed] [CrossRef]
30. Zhang EJ, Ng KM, Luo KQ. Extraction and purification of isoflavones from soybeans and characterization of their estrogenic activities. J Agric Food Chem. 2007;55(17):6940–50. doi:10.1021/jf0708903. [Google Scholar] [PubMed] [CrossRef]
31. Doyle JJ, Doyle JL, Brown AHD. Analysis of a polyploid complex in Glycine with chloroplast and nuclear DNA. Aust Syst Bot. 1990;3(1):125–36. [Google Scholar]
32. Meng L, Li H, Zhang L, Wang J. QTL IciMapping: integrated software for genetic linkage map construction and quantitative trait locus mapping in biparental populations. Crop J. 2015;3(3):269–83. [Google Scholar]
33. Zhang H, Wang X, Pan Q, Li P, Liu Y, Lu X, et al. QTG-Seq accelerates QTL fine mapping through QTL partitioning and whole-genome sequencing of bulked segregant samples. Mol Plant. 2019;12(3):426–37. [Google Scholar] [PubMed]
34. Besseau S, Hoffmann L, Geoffroy P, Lapierre C, Pollet B, Legrand M. Flavonoid accumulation in Arabidopsis repressed in lignin synthesis affects auxin transport and plant growth. Plant Cell. 2007;19(1):148–62. [Google Scholar] [PubMed]
35. Uneda-Trevisoli SH, da Silva FM, Di Mauro AO. Marker-assisted selection and genomic selection. In: Lopes da Silva F, Borém A, Sediyama T, Ludke W, editors. Soybean breeding. Springer, Cham; 2017. vol. 124, no. 6, p. 275–91. doi:10.1007/978-3-319-57433-2_14. [Google Scholar] [CrossRef]
36. Dhaubhadel S, Gijzen M, Moy P, Farhangkhoee M. Transcriptome analysis reveals a critical role of CHS7 and CHS8 genes for isoflavonoid synthesis in soybean seeds. Plant Physiol. 2007;143(1):326–38. [Google Scholar] [PubMed]
37. Chen C, Chen H, Zhang Y, Thomas HR, Frank MH, He Y, et al. TBtools: an integrative toolkit developed for interactive analyses of big biological data. Mol Plant. 2020;13(8):1194–202. [Google Scholar] [PubMed]
38. Wang S-Y, Zhang Y-J, Zhu G-Y, Shi X-C, Chen X, Herrera-Balandrano DD, et al. Occurrence of isoflavones in soybean sprouts and strategies to enhance their content: a review. J Food Sci. 2022;87(5):1961–82. [Google Scholar] [PubMed]
39. Wan Q, Chen S, Shan Z, Yang Z, Chen L, Zhang C, et al. Stability evaluation of reference genes for gene expression analysis by RT-qPCR in soybean under different conditions. PLoS One. 2017;12(12):e0189405. [Google Scholar] [PubMed]
40. Livak KJ, Schmittgen TD. Analysis of relative gene expression data using real-time quantitative PCR and the 2−ΔΔCT method. Methods. 2001;25(4):402–8. [Google Scholar] [PubMed]
41. Vogt T. Phenylpropanoid biosynthesis. Mol Plant. 2010;3(1):2–20. [Google Scholar] [PubMed]
42. Hu Q, Min L, Yang X, Jin S, Zhang L, Li Y, et al. Laccase GhLac1 modulates broad-spectrum biotic stress tolerance via manipulating phenylpropanoid pathway and jasmonic acid synthesis. Plant Physiol. 2018;176(2):1808–23. doi:10.1104/pp.17.01628. [Google Scholar] [PubMed] [CrossRef]
43. Wang X, Zhuo C, Xiao X, Wang X, Docampo-Palacios M, Chen F, et al. Substrate specificity of LACCASE8 facilitates polymerization of caffeyl alcohol for C-Lignin biosynthesis in the seed coat of Cleome hassleriana. Plant Cell. 2020;32(12):3825–45. doi:10.1105/tpc.20.00598. [Google Scholar] [PubMed] [CrossRef]
44. Xue C, Yao JL, Xue YS, Su GQ, Wang L, Lin LK, et al. PbrMYB169 positively regulates lignification of stone cells in pear fruit. J Exp Bot. 2019;70(6):1801–14. doi:10.1093/jxb/erz039. [Google Scholar] [PubMed] [CrossRef]
45. Dong NQ, Lin HX. Contribution of phenylpropanoid metabolism to plant development and plant-environment interactions. J Integr Plant Biol. 2021;63(1):180–209. doi:10.1111/jipb.13054. [Google Scholar] [PubMed] [CrossRef]
46. Baudry A, Heim MA, Dubreucq B, Caboche M, Weisshaar B, Lepiniec L. TT2, TT8, and TTG1 synergistically specify the expression of BANYULS and proanthocyanidin biosynthesis in Arabidopsis thaliana. Plant J. 2004;39(3):366–80. doi:10.1111/j.1365-313X.2004.02138.x. [Google Scholar] [PubMed] [CrossRef]
47. Gonzalez A, Zhao M, Leavitt JM, Lloyd AM. Regulation of the anthocyanin biosynthetic pathway by the TTG1/bHLH/Myb transcriptional complex in Arabidopsis seedlings. Plant J. 2008;53(5):814–27. doi:10.1111/j.1365-313X.2007.03373.x. [Google Scholar] [PubMed] [CrossRef]
48. Li S. Transcriptional control of flavonoid biosynthesis: fine-tuning of the MYB-bHLH-WD40 (MBW) complex. Plant Signal Behav. 2014;9(1):e27522. doi:10.4161/psb.27522. [Google Scholar] [PubMed] [CrossRef]
49. Goodstein DM, Shu S, Howson R, Neupane R, Hayes RD, Fazo J, et al. Phytozome: a comparative platform for green plant genomics. Nucleic Acids Res. 2012;40(D1):D1178–D86. doi:10.1093/nar/gkr944. [Google Scholar] [PubMed] [CrossRef]
50. Schmutz J, Cannon SB, Schlueter J, Ma J, Mitros T, Nelson W, et al. Genome sequence of the palaeopolyploid soybean. Nature. 2010;463(7278):178–83. doi:10.1038/nature08670. [Google Scholar] [PubMed] [CrossRef]
51. Zhang H, Hu Z, Yang Y, Liu X, Lv H, Song BH, et al. Transcriptome profiling reveals the spatial-temporal dynamics of gene expression essential for soybean seed development. BMC Genom. 2021;22(1):453. doi:10.1186/s12864-021-07783-z. [Google Scholar] [PubMed] [CrossRef]
52. Han Y, Li D, Zhao G, Zhao X, Jiang Z, Hu H, et al. Dynamic quantitative trait loci underlies isoflavone accumulation in soybean seed. Plant Breed. 2016;135(3):335–41. [Google Scholar]
53. Wu Y, Popovsky-Sarid S, Tikunov Y, Borovsky Y, Baruch K, Visser RGF, et al. CaMYB12-like underlies a major QTL for flavonoid content in pepper (Capsicum annuum) fruit. New Phytol. 2023;237(6):2255–67. [Google Scholar] [PubMed]
54. Kim JM, Seo JS, Lee JW, Lyu JI, Ryu J, Eom SH, et al. QTL mapping reveals key factors related to the isoflavone contents and agronomic traits of soybean (Glycine max). BMC Plant Biol. 2023;23(1):517. [Google Scholar] [PubMed]
55. Geng P, Zhang S, Liu J, Zhao C, Wu J, Cao Y, et al. MYB20, MYB42, MYB43, and MYB85 regulate phenylalanine and lignin biosynthesis during secondary cell wall formation. Plant Physiol. 2020;182(3):1272–83. [Google Scholar] [PubMed]
56. Jiao J, Zheng H, Zhou X, Huang Y, Niu Q, Ke L, et al. The functions of laccase gene GhLAC15 in fiber colouration and development in brown-colored cotton. Physiol Plant. 2024;176(4):e14415. [Google Scholar] [PubMed]
57. Knizia D, Yuan J, Bellaloui N, Vuong T, Usovsky M, Song Q, et al. The soybean high density ‘Forrest’ by ‘Williams 82’ SNP-Based genetic linkage map identifies QTL and candidate genes for seed isoflavone content. Plants. 2021;10(10):2029. doi:10.3390/plants10102029. [Google Scholar] [PubMed] [CrossRef]
58. Liu ZD, Meng S, He JB, Xing GN, Wang WB, Zhao TJ, et al. A comparative study on linkage and association QTL mapping for seed isoflavone contents in a recombinant inbred line population of soybean. Sci Agricult Sin. 2020;53:1756–72. [Google Scholar]
Cite This Article
 Copyright © 2024 The Author(s). Published by Tech Science Press.
This work is licensed under a Creative Commons Attribution 4.0 International License , which permits unrestricted use, distribution, and reproduction in any medium, provided the original work is properly cited.
 Downloads
 Citation Tools