
 Submit a Paper
 Propose a Special lssue
 Open Access
ARTICLE
Contributions of Volume and Concentration on Runoff Nitrogen Losses from Intensive Vegetable in China
1 Department of Horticulture, Foshan University, Foshan, 528000, China
2 State Key Laboratory of Soil and Sustainable Agriculture, Institute of Soil Science, Chinese Academy of Sciences (CAS), Nanjing, 210008, China
3 College of Life Sciences, Anhui Normal University, Wuhu, 241000, China
4 Quality Department, Jiangsu Environmental Monitoring Center, Nanjing, 210036, China
* Corresponding Authors: Ju Min. Email: ; Weiming Shi. Email:
Phyton-International Journal of Experimental Botany 2024, 93(9), 2439-2453. https://doi.org/10.32604/phyton.2024.054182
Received 21 May 2024; Accepted 29 August 2024; Issue published 30 September 2024
 View Full Text
 Download PDF
Abstract
Vegetable runoff nitrogen (N) loss is a serious environmental issue. However, whether the volume or N content of runoff determines the final N losses has not been clarified, which limited the optimal N managements in vegetable production. Here, we conducted a simulated rainfall experiment to study the runoff N loss flux pattern and the accumulation rate as well as the main influencing factors. The results showed that at 20 to 30 min, the volume of runoff water with a high N content reaches a critical inflection point of increase. Under 55 mm/h rainfall intensity, the N concentration decreased continuously. Under 75 mm/h, the soluble N concentration decreased during the first 25 min; thereafter, it stabilized. However, the total and particulate N decreased significantly after 30 min. Nitrogen losses via runoff from vegetable fields were from 18.5 to 26.0 kg/ha under two rainfall intensities. Runoff soluble N losses were mainly attributed to applied fertilizers (79.7%–95.5%), while particulate N losses were primarily originated from soil-retained N. Our data indicates that there was a significant difference in N losses pattern and influencing factors under varied fertilizer N inputs and rainfall intensities, which can help to optimize water and N fertilizer managements to mitigate non-point source N pollutants. In the future, long-term multi-site and -crop studies should be conducted to comprehensively clarify the N runoff losses in vegetable soils.Keywords
Vegetables are important cash crops in China. However, non-point source pollution is a significant water pollution issue, mainly caused by agricultural runoff or leaching, particularly that from intensive vegetable fields under intensive cultivation [1,2]. As elsewhere, nitrogen (N) fertilizer application is widespread in vegetable field management to ensure good yield and quality of vegetables. However, farmers have been consistently applying excessive inorganic N fertilizer, which has resulted in a low N use efficiency (NUE) of vegetables (only 12%–18% in some cases) and high N environmental losses [3,4]. Of which, surface runoff N losses during rain cases from intensive vegetable cultivation fields are of great significant [5,6]. Therefore, it is of great importance to mitigate the runoff N losses from intensive vegetable production systems to protect the adjacent surface and shallow water environment [7].
Previous research provided several measures to lower the runoff N losses from vegetable fields. For example. Well known, land management impacts the soil properties and the initial soil erosion process in vegetable crops which were related to the N losses via runoff [8]. A previous study found that the total N concentration in runoff was significantly correlated with the rainfall intensity under different soil management modes [9]. The generation of agricultural non-point source pollution is a continuous and dynamic process [10], and the changes in runoff water N concentrations and volume during instances of rainfall are crucial for local farmers and the authorities to adopt appropriate measures to enhance their efficacy in mitigating runoff N losses. However, whether the N concentration or the runoff volume determine the final N runoff load was little known. Generally, most previous experimental studies only focused on the alone dynamics of either N concentration or runoff volume during soil erosion or runoff [11,12]. Moreover, most studies have focused on N surface runoff from paddy soils [6]. Nitrogen in vegetable field runoff mostly comes during the soil erosion process. Even without N fertilizer in put, 20–100 kg/ha of N will still be lost through runoff. What was more, when the N fertilizer was applied on the surface of vegetable soil, there would 20%–76% of N lost via runoff within 5 years. Therefore, the key to decreasing the runoff N losses is controlling the soil erosion brought about by the runoff, particularly during rainfall with strong density [13]. Reducing the chemical fertilizer application rate is one of the critical approaches in mitigating surface runoff from vegetable fields, and thereby a rational N fertilizer application rate during the rainy season can effectively reduce runoff N loss from vegetable systems [14]. Besides, there are various methods that are now commonly adopted to reduce runoff N losses like vegetating filter strips, ecological ditches, constructed wetlands and ecological ditches as well as with biogas plants [15]. For instance, the total N loss reduction efficiency of the wetland paddy that constructed at the end of vegetable soils could be near 50% [5]. Moreover, ecological ditches reduced the total N, nitrate (NO3−-N), and ammonium (NH4+-N) losses via runoff from vegetable fields by 76%, 64%, and 78%, respectively [16].
Field vegetable cultivation is difficult during the hot and rainy summer seasons, during which period the high rainfall intensity is susceptible to water-logging of vegetables, making continuous and long-term sampling work very hard. Therefore, rainfall simulation techniques are particularly useful, given the randomness of occurrence and intensity of rains [1,12]. By taking runoff samples over one hour simulating the experiment, it is possible to estimate the volume of runoff water and determine its N contents meanwhile to calculate the runoff N losses [12]. However, little works focused on clarifying the role of runoff water volume or N in it to determine the final N losses, in particular under field condition. This clarification could help local farmers and the authorities optimize the N managements to mitigate N losses and thereby protect the aquatic environment.
Therefore, we conducted simulating rainfall experiments under field conditions considering three N input levels and two rainfall intensities. Here, vegetable field runoff was collected firstly, and the N contents including NO3−-N, particulate nitrogen (PN), soluble total nitrogen (STN) and total nitrogen (TN) in the runoff water sample were determined thereafter. Combined with the runoff water volume investigation, we calculated the runoff N loss loads from vegetable soil. The main objective of current studies was to clarify the dynamic in vegetable runoff and the key control points of runoff N losses during rainfall cases, aiming to provide valuable recommendations for non-point source N pollution in vegetable production.
2.1 Study Area and Simulated Rainfall Experiment
A rainfall simulation experiment was conducted in a typical radish (Raphanus sativus L.) planted vegetable field at Yixing, China (31°14′ N, 119°53′ E) where has a subtropical monsoon climate with average annual temperature 15.6°C and precipitation 1180 mm). At the beginning of the experiment, the primary fertility properties of the 0–20 cm topsoil were as follows, pH 6.25 (soil and water mixed in a 1:2.5 ratio, w/v), nitrate N 120 mg/kg, total N 1.56 g/kg, Olsen-phosphorus (P) 56 mg/kg, available potassium 83 mg/kg, and organic matter 26.4 g/kg.
Rainfall simulation is a versatile and widely used research tool [17], according to which we conducted the current field experiment using an artificial rainfall simulation system and a runoff collection device. The device mainly comprises rainfall nozzles, centrifugal pumps, filters, and water storage tanks. The device (with a height of 2 m) covered a rainfall area of 1 m2 (1 m × 1 m). As there were no blind spots in the rainfall area, the rainfall uniformity in our experiment was >90%. Rainfall intensity could be adjusted by controlling the pressure of the centrifugal pump, with an adjustable range of 50–200 mm/h. The runoff device is mainly composed of poly vinyl chloride (PVC) partitions and runoff collection barrels, surrounded by PVC partitions and ridges. The PVC partitions were placed 10 cm above the soil surface and buried in the soil at 30 cm depth. One of the PVC partitions had a hole to connect the runoff overflow pipe to ensure that all surface runoff could flow into the catchment bucket after the runoff occurred.
In this experiment, we assessed three N fertilization levels, i.e., no N (Control), low N (LN, 291.9 kg/ha, scientifically recommended N input), and high N (HN, 417 kg/ha, farmers’ traditional N input). According to the general rainfall records in the Tai Lake area [1,5,6], the rainfall intensities were set at 55 and 75 mm/h for each N input level, respectively. Therefore, there were six treatments with three replicates each for the experiment. The simulated rainfall experiment was conducted from 15 September to 25 October 2022, with a total of 18 rainfall tests. For vegetable growth, chemical N fertilizer in form of urea was applied as basal and supplementary fertilizers on 16 August and 13 September 2022, respectively. At the same time of basal N fertilization 2160 kg/ha of organic fertilizer, 540 kg/ha of calcium and magnesium phosphate, and 120 kg/ha of potash were amended into the vegetable soils. In addition, the radish was harvested on 17 October 2022.
2.3 Sample Collection and Analysis
The runoff water samples were collected at 5-min intervals after the occurrence of runoff. The runoff samples were stirred in a runoff collection bucket, and the runoff volume generated within 5 min was recorded using a 200 mL plastic bottle. The runoff samples were returned to the laboratory, stored in a refrigerator at −20°C, and analyzed within a few days. Simulated rainwater was collected from the rainfall nozzles at the initiation of the experiment and its N content was also determined.
2.3.2 Determinations of Runoff and Soil Samples
The water samples were filtered through a 0.45 µm filter membrane firstly before analysis. Subsequently, we determined their NH4+-N, NO3−-N, and TN contents via the indophenol blue colorimetric, spectrophotometric, and alkaline potassium per-sulfate colorimetric methods. The STN content in runoff water was determined using the alkaline potassium per-sulfate colorimetric method.
Nutrients contained in the 0–20 cm topsoil form the vegetable plots were measured when the field experiment was accomplished. The soil NH4+-N, NO3−-N, and available P contents were determined.
Dissolved organic N (DON) concentration was calculated as the difference between contents of TN and inorganic N (NH4+-N and NO3−-N). Particulate N (PN) concentration was calculated by subtracting STN from total N.
Data were statistically analyzed using Excel 2016 and by ANOVA using the SPSS 21.0 statistics software. They were analyzed for the significance of differences using Duncan’s test (p < 0.05). We plotted the figures using Origin 8.0 software and Excel 2016.
3.1 Soil Fertility and Radish Production
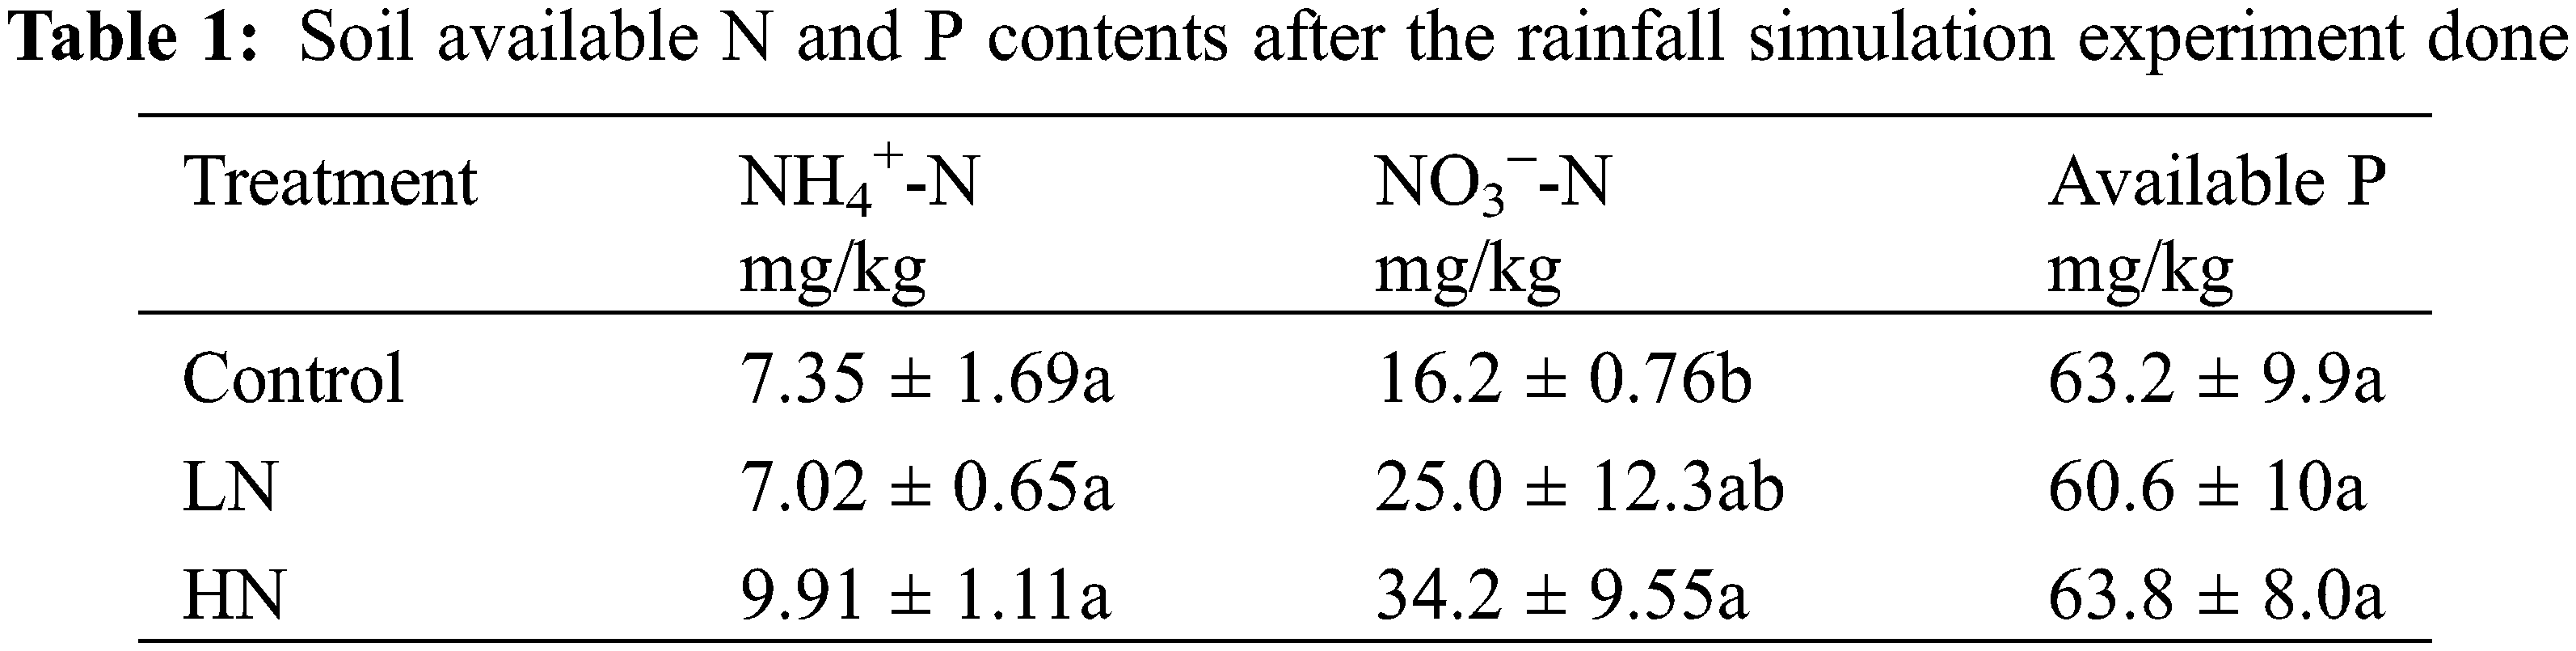
Either LN or HN had a short-term effect on the soil NH4+-N and available P contents, while the differences were not statistically significant. However, HN treatment significantly (p < 0.05) increased the soil NO3−-N content by 111.1% (Table 1). Excessive fertilization can elevate the soil NO3−-N which leading to an increased risk of runoff and leaching N losses [18,19]. Therefore, emphasis should be placed on soil NO3−-N content to control non-point source pollution from intensive vegetable production. Meanwhile, how N fertilization whether with a low or high rates impact soil available N and P contents should be studied in a long-term.
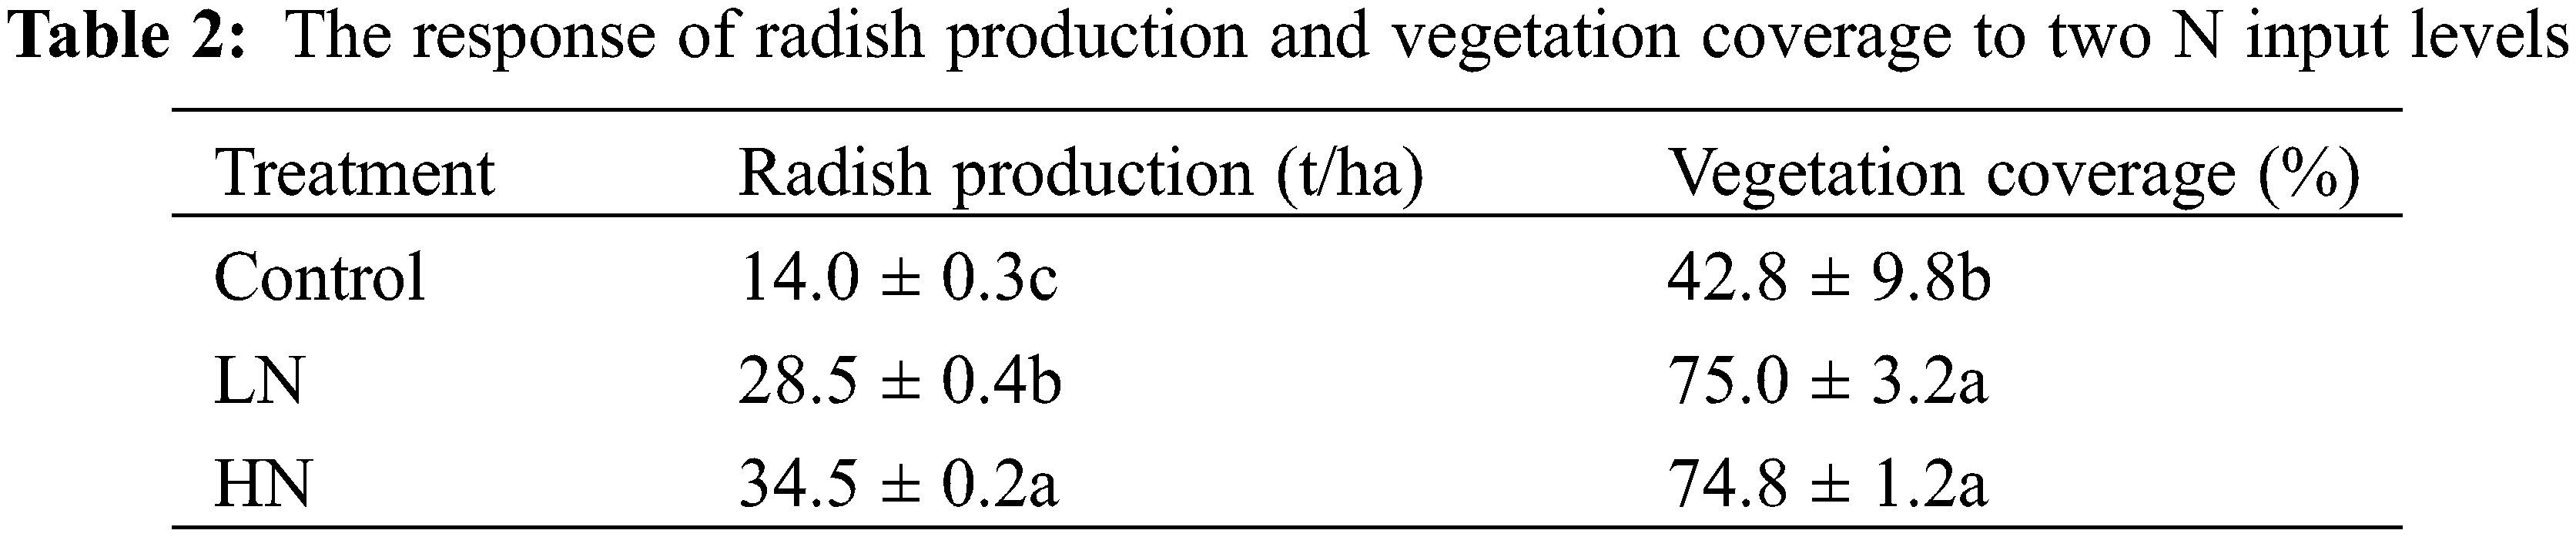
The two N amended treatments produced 103.6%–146.4% more radish production than the control treatment (Table 2), as N is the essential nutrient for vegetable plant growth and the final yield [20]. As shown in Table 2, the vegetation coverage were increased by 75.0% on average following urea N fertilization. However, no difference in vegetation coverage between the HN and LN treatments. Moreover, the high N input treatment produced a 21.0% higher radish yield than the low N input treatment. Within a reasonable application N application range, crop/vegetable production always increased with N nutrient input rates [21,22]. What is more, with high N input root vegetables (like radish in the current study) accumulate a significant amount of N in their roots, increasing the dry matter biomass in the storage roots [23], i.e., the production of radish in our work. However, farmers should avoid applying excessive N fertilizer that exceed the demand of vegetable growth to guarantee vegetable production and reduce N pollution meanwhile.
Under the both rainfall intensities, higher runoff volumes were recorded under the two N-applied treatments, compared with no N treatments (Fig. 1). For the 55 mm/h rainfall intensity, the cumulative runoff volumes in an hour under HN, LN, and Control were 9.4, 7.9, and 5.1 L, respectively (Fig. 1A), and there were 14.1, 9.6, and 6.5 L respectively for the 75 mm/h rainfall intensity (Fig. 1B). Overall, N fertilizer application led to more runoff from vegetable field soil. Moreover, we found that HN treatment resulted in significantly higher runoff rates than the LN treatment. Generally, soil with more vegetation would generate lower runoff [24,25]. And N fertilizer increased the vegetable biomass. However, the data shown in Table 2 summarized the vegetation coverage did not explain the difference in runoff rate difference between the control and N-added treatments. Intensive crop cultivation under intensive crop rotation always results in higher soil bulk density and lower water infiltration rates, and fertilizer application could exert negative impacts on soil porosity and deteriorate the structure as reported in previous works [26,27]. Generally, inorganic fertilizer application increased the macro-pores but not the intro-aggregate pores in soil cores, compared to no-fertilization [28]. Yield and nutrient concentration of root vegetables were elevated with increasing fertilizer [29,30]. In addition to these factors determining the runoff volume, we hypothesized that roots and rhizomes of radish gradually occupy the soil, and runoff plots with high N application follow the tendency to produce large amounts of runoff at the same rainfall intensity. This leads to a tendency for runoff water to accumulate on the soil surface, and thus runoff is generated. Of course, more long-term and full-scale experiments should be done to verify this phenomenon.
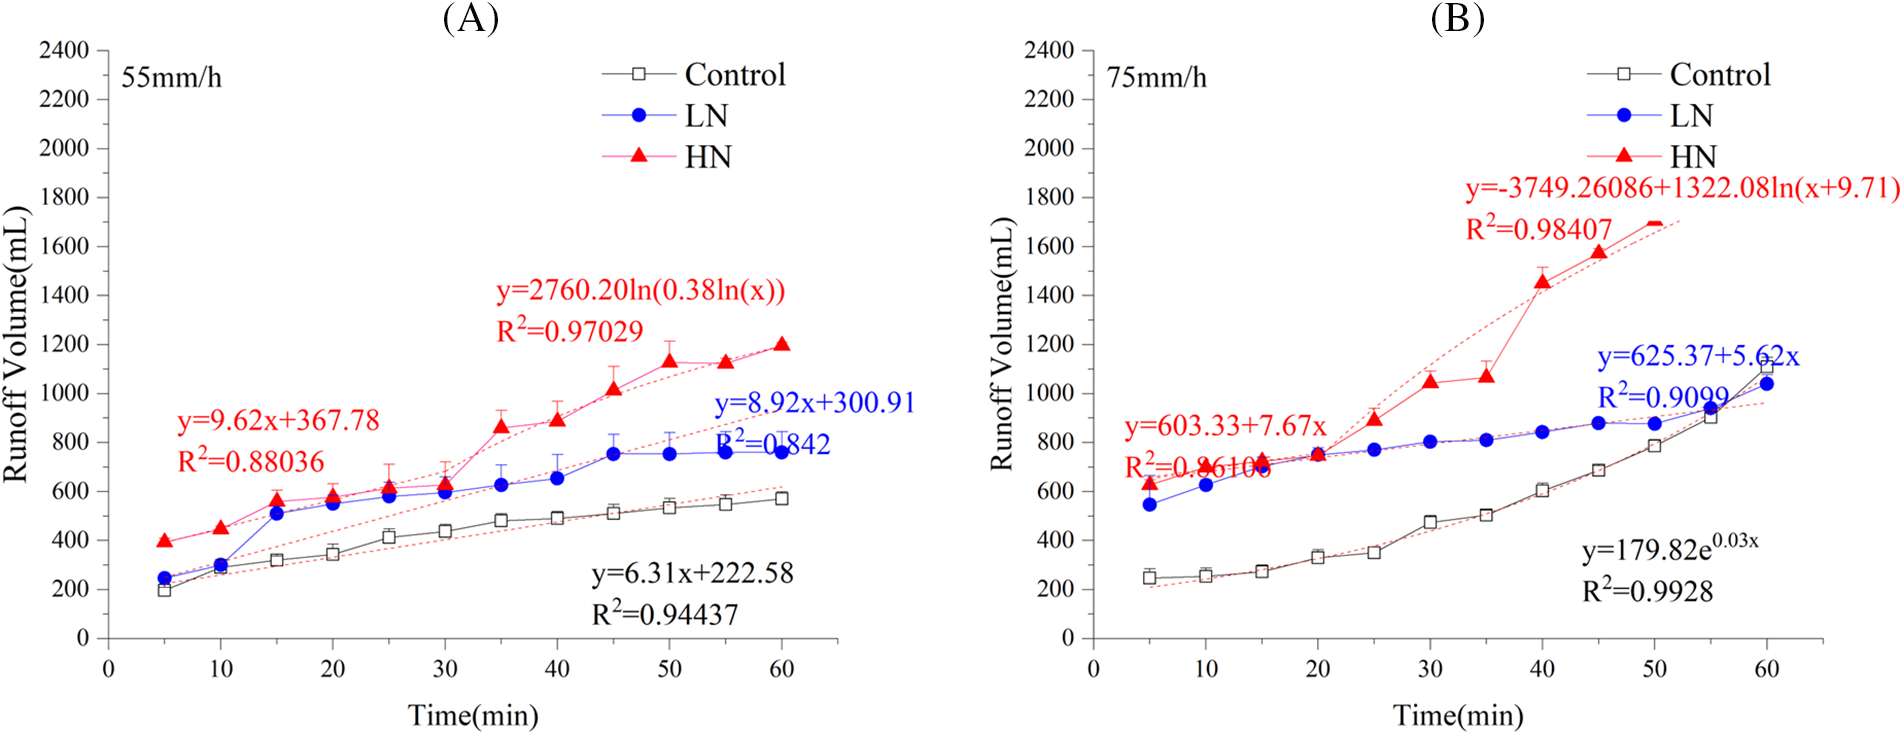
Figure 1: Dynamics of runoff water volume under different rainfall intensities and high (HN) and low (LN) N application rates. (A) 55 mm/h. (B) 75 mm/h
3.3 Dynamics of N Contents in Runoff Water
The dynamics of NH4+-N, NO3−-N, DON, and STN concentrations in runoff water from treatments with different N application rates under 55 mm/h rainfall intensity are shown in Fig. 2. The dynamic pattern of runoff NH4+-N under HN and LN were similar, and the average NH4+-N concentration only increased from 1.25 to 1.32 mg/L when N application increased from 291.9 to 471 kg/ha (Fig. 2A). Under two rainfalls intensities, the N-amended treatments had significantly higher NH4+-N concentrations than the control treatment, by 10.9 times and 10.3 times on average.
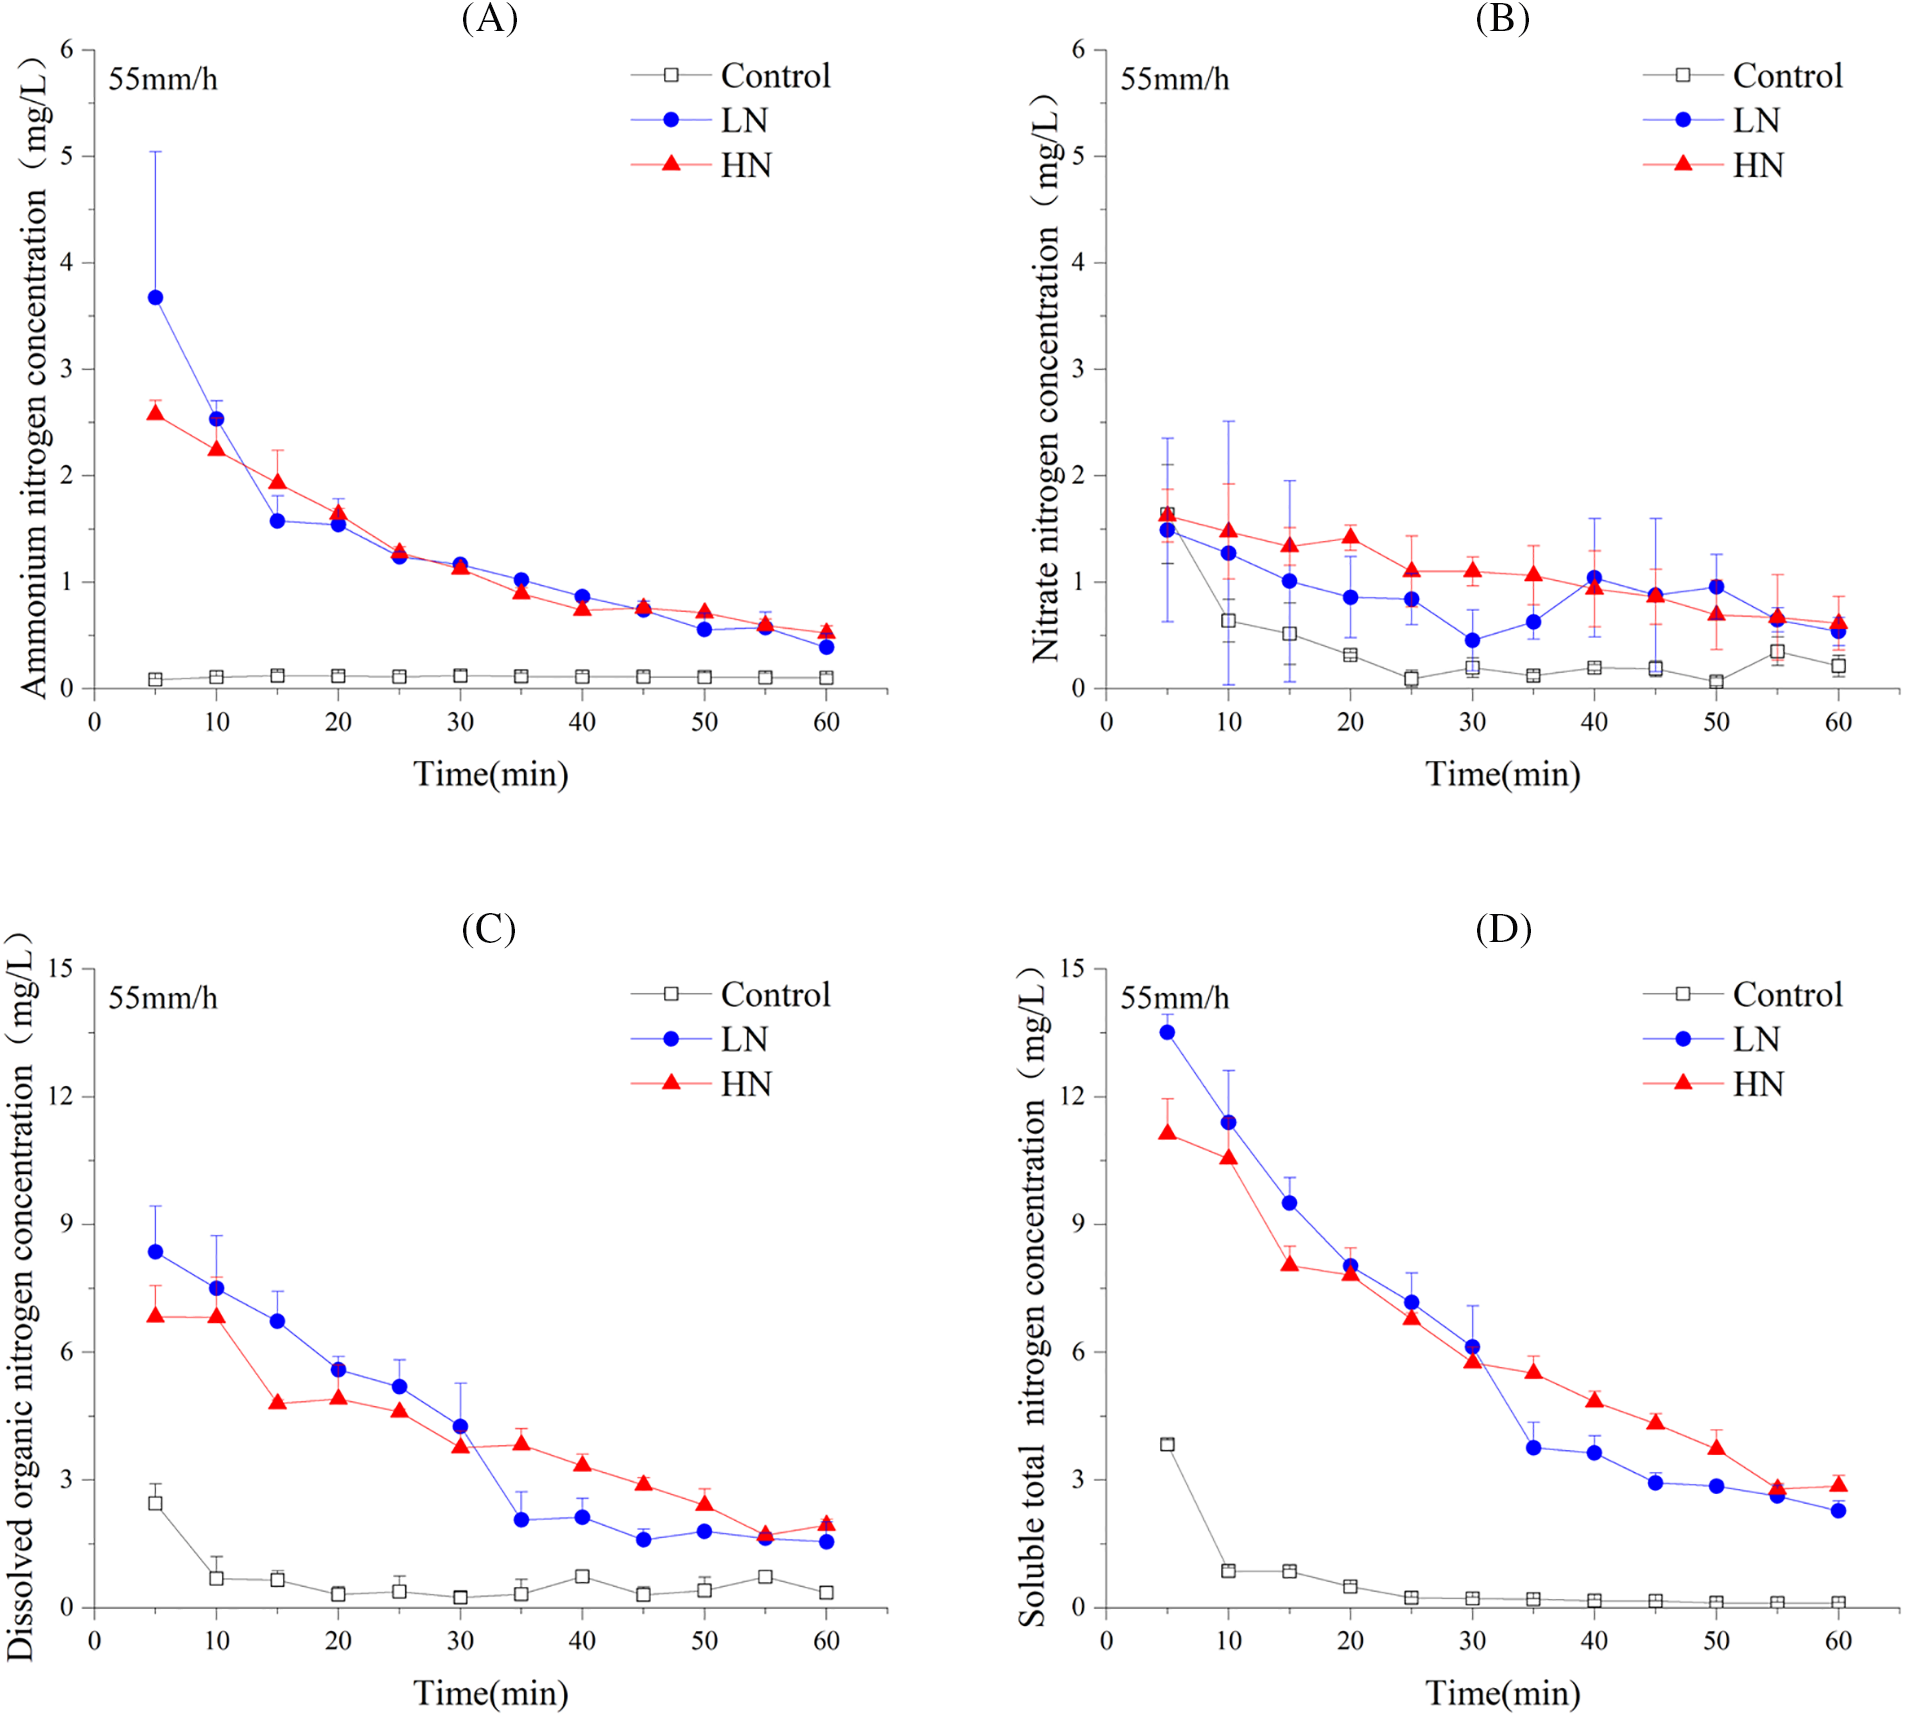
Figure 2: Dynamics of dissolved nitrogen (N) concentrations in the runoff at high (HN) and low (LN) and Control N application levels under 55 mm/h rainfall intensity. (A) ammonium-N (NH4+-N); (B) nitrate-N (NO3–-N); (C) dissolved organic N (DON); and (D) soluble total N (STN)
Similar changing trends were observed for NO3−-N, DON, and STN concentrations of runoff water under the 55 mm/h rainfall intensity (Fig. 2B–D). Overall, all of them in the N-applied treatments were higher than in the control treatment. The application of N fertilizers increased the soil mineralization rate immediately. Half of the soil mineralized N originated from applied N fertilizers, readily increasing the soil available N content of the soil at these high mineralization rates, which further led to a higher concentration of all forms of nitrogen in the runoff that than in the non-N added treatment [31,32]. Therefore, different fertilization practices suitable for precipitation conditions and vegetable species should be developed for vegetable cultivation, which can reduce runoff N losses from vegetable fields under heavy rainfall cases.
Under 55 mm/h rainfall, the initial NO3−-N concentrations of runoff water from N-amended treatments were from 1.34 to 1.73 mg/L, which was close to that from the control treatments (Fig. 2B). Thereafter, the average NO3–-N concentrations under LN and HN were up to significantly 140% and 184%, significantly higher than that from the control, respectively. With the rainfall continued, the NO3−-N concentrations were 0.81–1.22 mg/L during the first 35 min, which thereafter decreased to only 0.06–0.39 mg/L until the end of the rainfall experiment. Comprehensively considering the previous and current research results, there is an optimum time to control the runoff from the intensive vegetable field [33]. Our data suggested that the first 5–10 min after runoff generation produce higher runoff volume and sediment quantity. And till 20 min, the runoff sediment gradually decreases and tends to be stabilized. Therefore, controlling the runoff generated in the primary 20 min after flow production help to more effectively in inhibiting runoff N losses from vegetable fields.
At the initiation of the runoff case, the differences in initial DON and STN concentrations in runoff water under 55 mm/h rainfall intensity between LN and HN were minor (8.35 vs. 6.83 mg/L and 13.5 vs. 11.1 mg/L, respectively). By contrast, we recorded significantly lower DON (0.11–0.25 mg/L) and STN (2.5–3.8 mg/L) concentrations in the control treatment. Regarding their temporal dynamics, both DON and STN concentrations under LN were higher than that under HN (average 6.2 vs. 4.0 mg/L) during the first 30 min. However, after 30 min, HN treatment had higher DON and STN concentrations than LN (average 8.3 vs. 5.3 mg/L). At the beginning of the runoff, the surface soil was not eroded. Along with the runoff event, the N contained in the water-soil interface is also high, and the soil N easily migrates to the runoff at a fast rate, resulting in a sharp increase in runoff N concentrations [34]. As rainfall progresses, the topsoil is continually compacted by the raindrops, less soil lost with the runoff. Meanwhile, surface soil N is carried away by runoff or leaching into the sub-layer soil; therefore, the water-soil N concentration gradient decreases as well as for the runoff N concentration decreases [35].
The dynamics of runoff NH4+-N and NO3−-N concentrations were similar at different N application rates under 75 mm/h rainfall intensity (Fig. 3A,B). The mean NH4+-N concentrations under HN and LN (1.57 and 1.31 mg/L) were almost similar (1.6 vs. 1.3 mg/L) and were approximately 13 and 11 times higher than under Control, respectively. The runoff NH4+-N nitrogen concentrations under HN and LN decreased by 1.22–1.27 mg/L during the first 10 min after runoff flow production. During the first 25 min we found a significant decrease in NO3−-N concentrations 0.65–1.60 mg/L under two N amended treatments. Previous research reported that the remarkable decreasing trend of NH4+-N at the beginning of rainfall (approx. first 10 min) of runoff was consistent with the turbulence processes that brings N nutrients to the runoff [36]. This phenomenon was confirmed by our investigation, i.e., the dynamics of decrease and stabilization of the runoff NH4+-N concentrations [36].
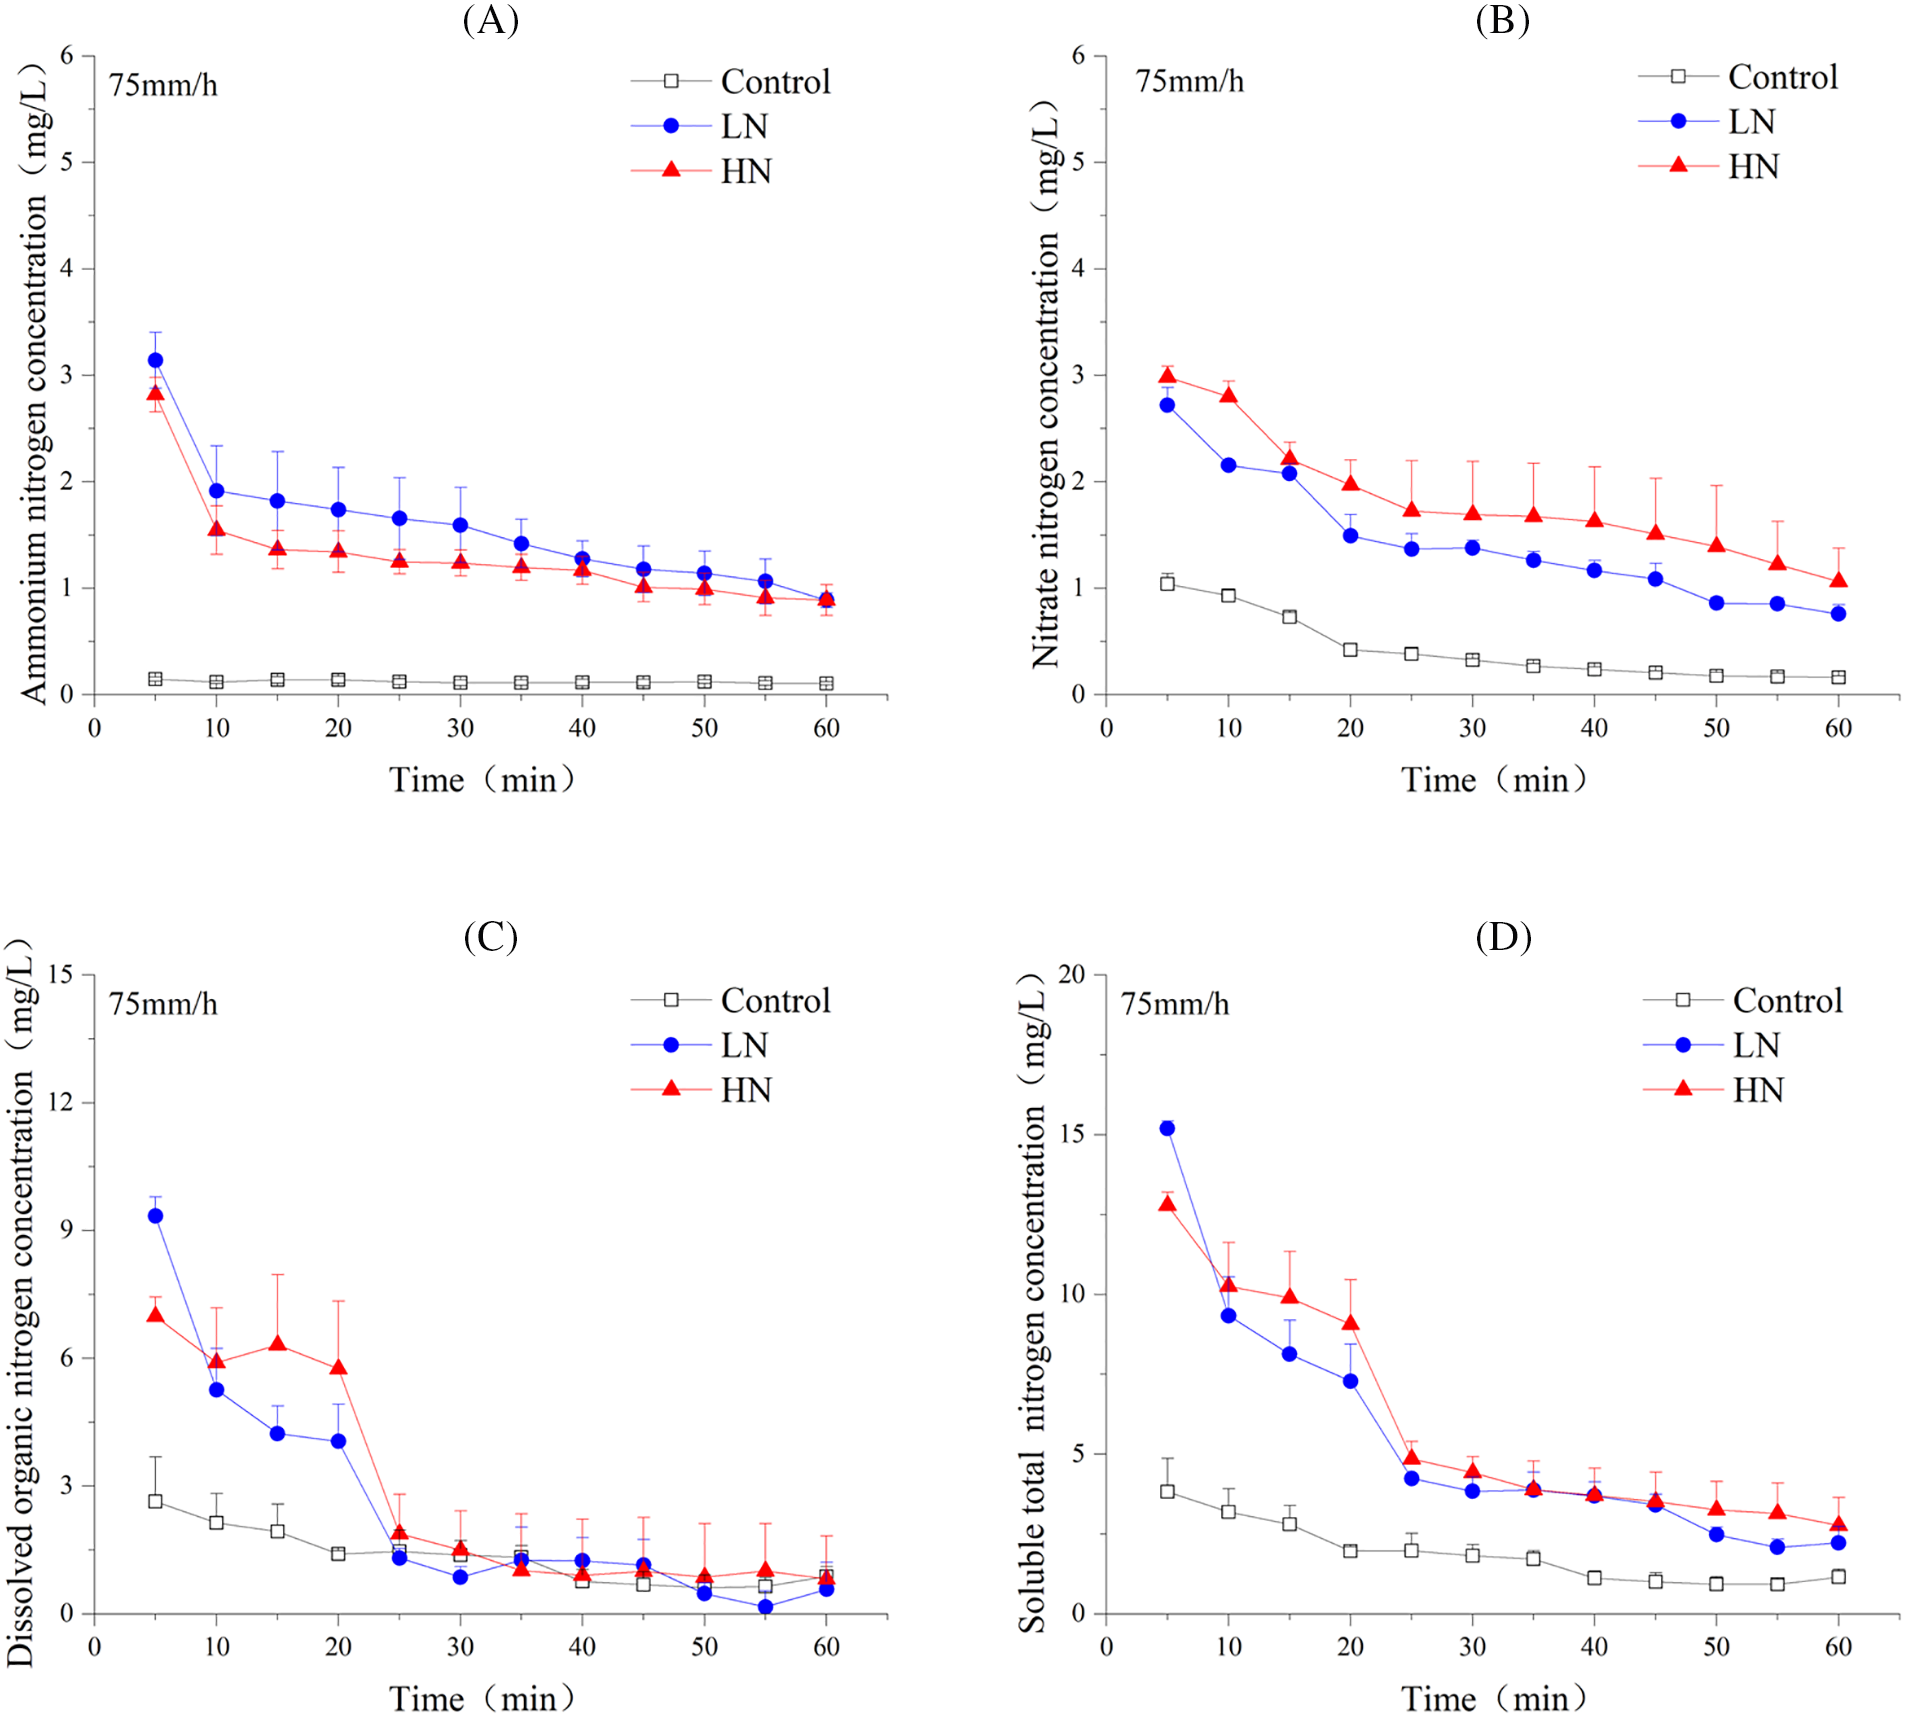
Figure 3: Dynamics of dissolved nitrogen (N) concentration in the runoff at different high (HN) and low (LN) and Control N application rates under 75 mm/h rainfall intensity. (A) ammonium (NH4+-N); (B) nitrate (NO3–-N); (C) dissolved organic N (DON); and (D) soluble total N (STN)
Data in Fig. 3 also showed a similar changing pattern for runoff DON (Fig. 3C) and STN (Fig. 3D) concentrations through the rainfall case. Runoff exhibited a downward trend. During the initial 25 min, the DON and STN of runoff water from two N applied treatments reduced by 5.1–8.1 mg/L and 7.9–11.0 mg/L in the LN and HN treatments, respectively. Compared to the non-fertilizer control, runoff N concentration was higher in all fertilizer N added which was easily understood. However, the control treatments had no changes in runoff DON and STN concentrations. A significant correlation has been observed between soluble N concentration and rainfall intensity on sediment flux, with nutrients from runoff sediments gradually diffusing into runoff water as rainfall intensity increased [37]. At the early stage of runoff, the soil surface water and eroded soil interacted sufficiently, allowing continuous infiltration of moisture into the soil. As the rainfall continued, the soil surface was waterlogged and the stripping of the nutrients from the soil surface was reducing, and the impact effect of the raindrops on the soil was reduced, which might be the reasons for the stepwise decreasing trend in the concentration of the soluble nitrogen fractions in the runoff from vegetable lands [38].
Under 55 mm/h rainfall intensity, the dynamics of runoff and TN concentrations at different N application levels is shown in Fig. 4A,B. Generally, with the increasing N application rate, the average PN and TN concentration of runoff water decreased from 37.4 to 23.9 mg/L (Fig. 4A), and from 38.0 to 30.1 mg/L (Fig. 4B). A similar trend was found under 75 mm/h, particularly during the first 25 min after runoff was generated (Fig. 4C,D).
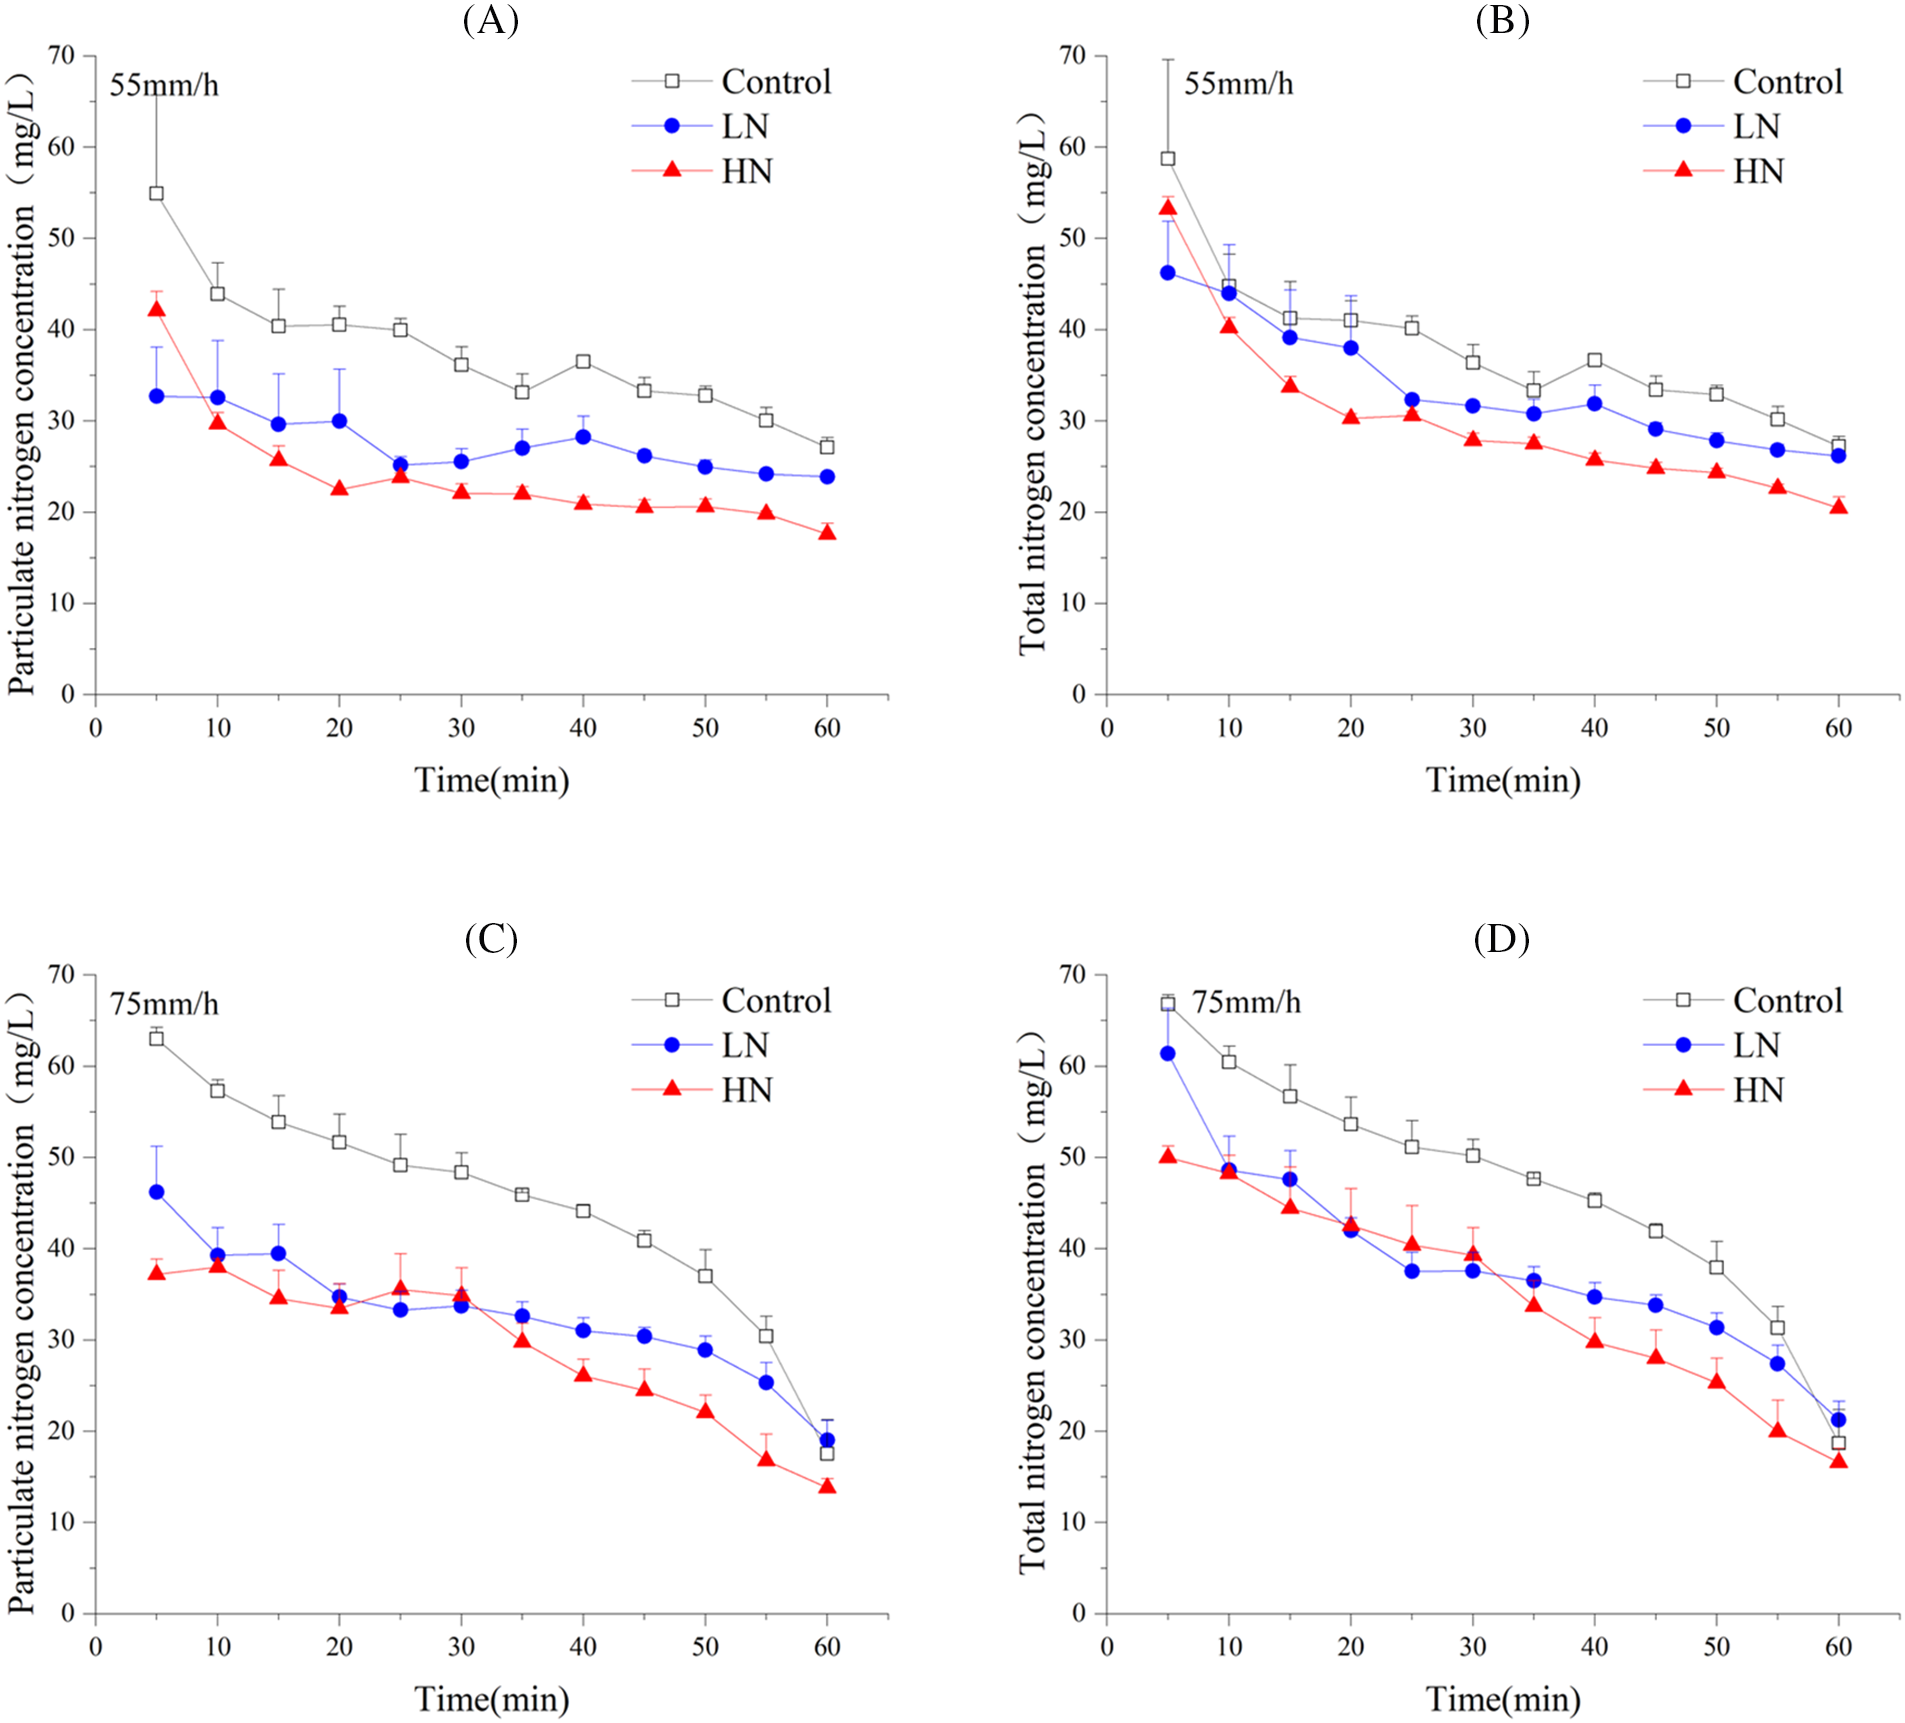
Figure 4: Dynamics of particulate nitrogen (PN) and total nitrogen (TN) concentration in the runoff at different high (HN), low (LN), and Control N application rates under different rainfall intensities. (A) particulate nitrogen (PN) at 55 mm/h; (B) total nitrogen (TN) at 55 mm/h; (C) particulate nitrogen (PN) at 75 mm/h; and (D) total nitrogen (TN) at 75 mm/h
There was a dilution effect during one runoff cases [39], which explained the significant decrease in PN and TN concentrations under HN treatment during the period 30 through 60 min. Under both 55 and 70 mm/h rainfall intensities, the soluble N concentrations of runoff water from the control and N-application treatments were consistent in the following order: DON > NO3−-N > NH4+-N (Figs. 2 and 3). This result suggested that DON was the main form in runoff N losses from the vegetable production system. By contrast, one previous study have found that in the N lost from agricultural runoff was dominated as the PN, then the DON and, which were mostly derived from the applications of organic and inorganic/chemical fertilizers [40]. To mitigate the non-point N pollutants, previous work has suggested that ecological ditched and wetland rice paddies can effectively reduce 50%–60% of vegetable runoff N losses ecological ditches and wetland rice paddies can effectively reduce 50% to 60% of the nitrogen N losses [41]. Meanwhile, considering the uncertainty the forms of N in runoff from agricultural lands during each runoff in a short term, optimizing the amount of N fertilizer is still the most effective approach to decrease runoff N from insensitive vegetable production in China.
3.4 Nitrogen Losses from Vegetable Land
The cumulative N losses from vegetable system through simulated rainfall experiment under 55 and 75 mm/h rainfall intensities were 18.5–26.0 kg/ha and 27.4–44.4 kg/ha, respectively (Fig. 5). It is clear that heavier rainfall leads to more nutrient losses from agricultural soils. As the intensity of rainfall increases, the ability of raindrops to erode the soil surface intensifies, resulting an increase in runoff N losses from agricultural land [42]. Compared with the non-N control urea N application through fertilizers increased total N losses via runoff from vegetable field soil by 22.3%–40.7% (Fig. 5A) and 28.2%–62.2% (Fig. 5C), under 55 and 75 mm/h of rainfall intensities, respectively (Fig. 5A,C). Consistent with previous studies work conducted in paddy field, runoff N losses from the fertilizer application N applied treatments could be near 4.0 times higher than that from the no-N treatment [43]. They also found that there was a significant positive correlation between runoff N losses and N applied rates [43,44], which was also confirmed by our results of STN (Fig. 5A). However, there was no significant difference in cumulative N losses between LN and HN in our study. Interestingly, our data demonstrated that PN is the main constituent of the cumulative N losses via runoff, and its percentage reached 80%–99% and 84%–96% (Fig. 5D) under 55 and 75 mm/h, respectively (Fig. 5B,D). Some previous studies that also conducted under field condition found that soluble N dominated the N lost via runoff from agricultural soils [45,46]. For intensive vegetable soils, we revealed that PN is the primary form in runoff N. Therefore, implementing measures to reduce sediment runoff should first be considered when controlling N pollutants from intensive vegetable production systems. Only mitigating the soluble N is not effective enough.
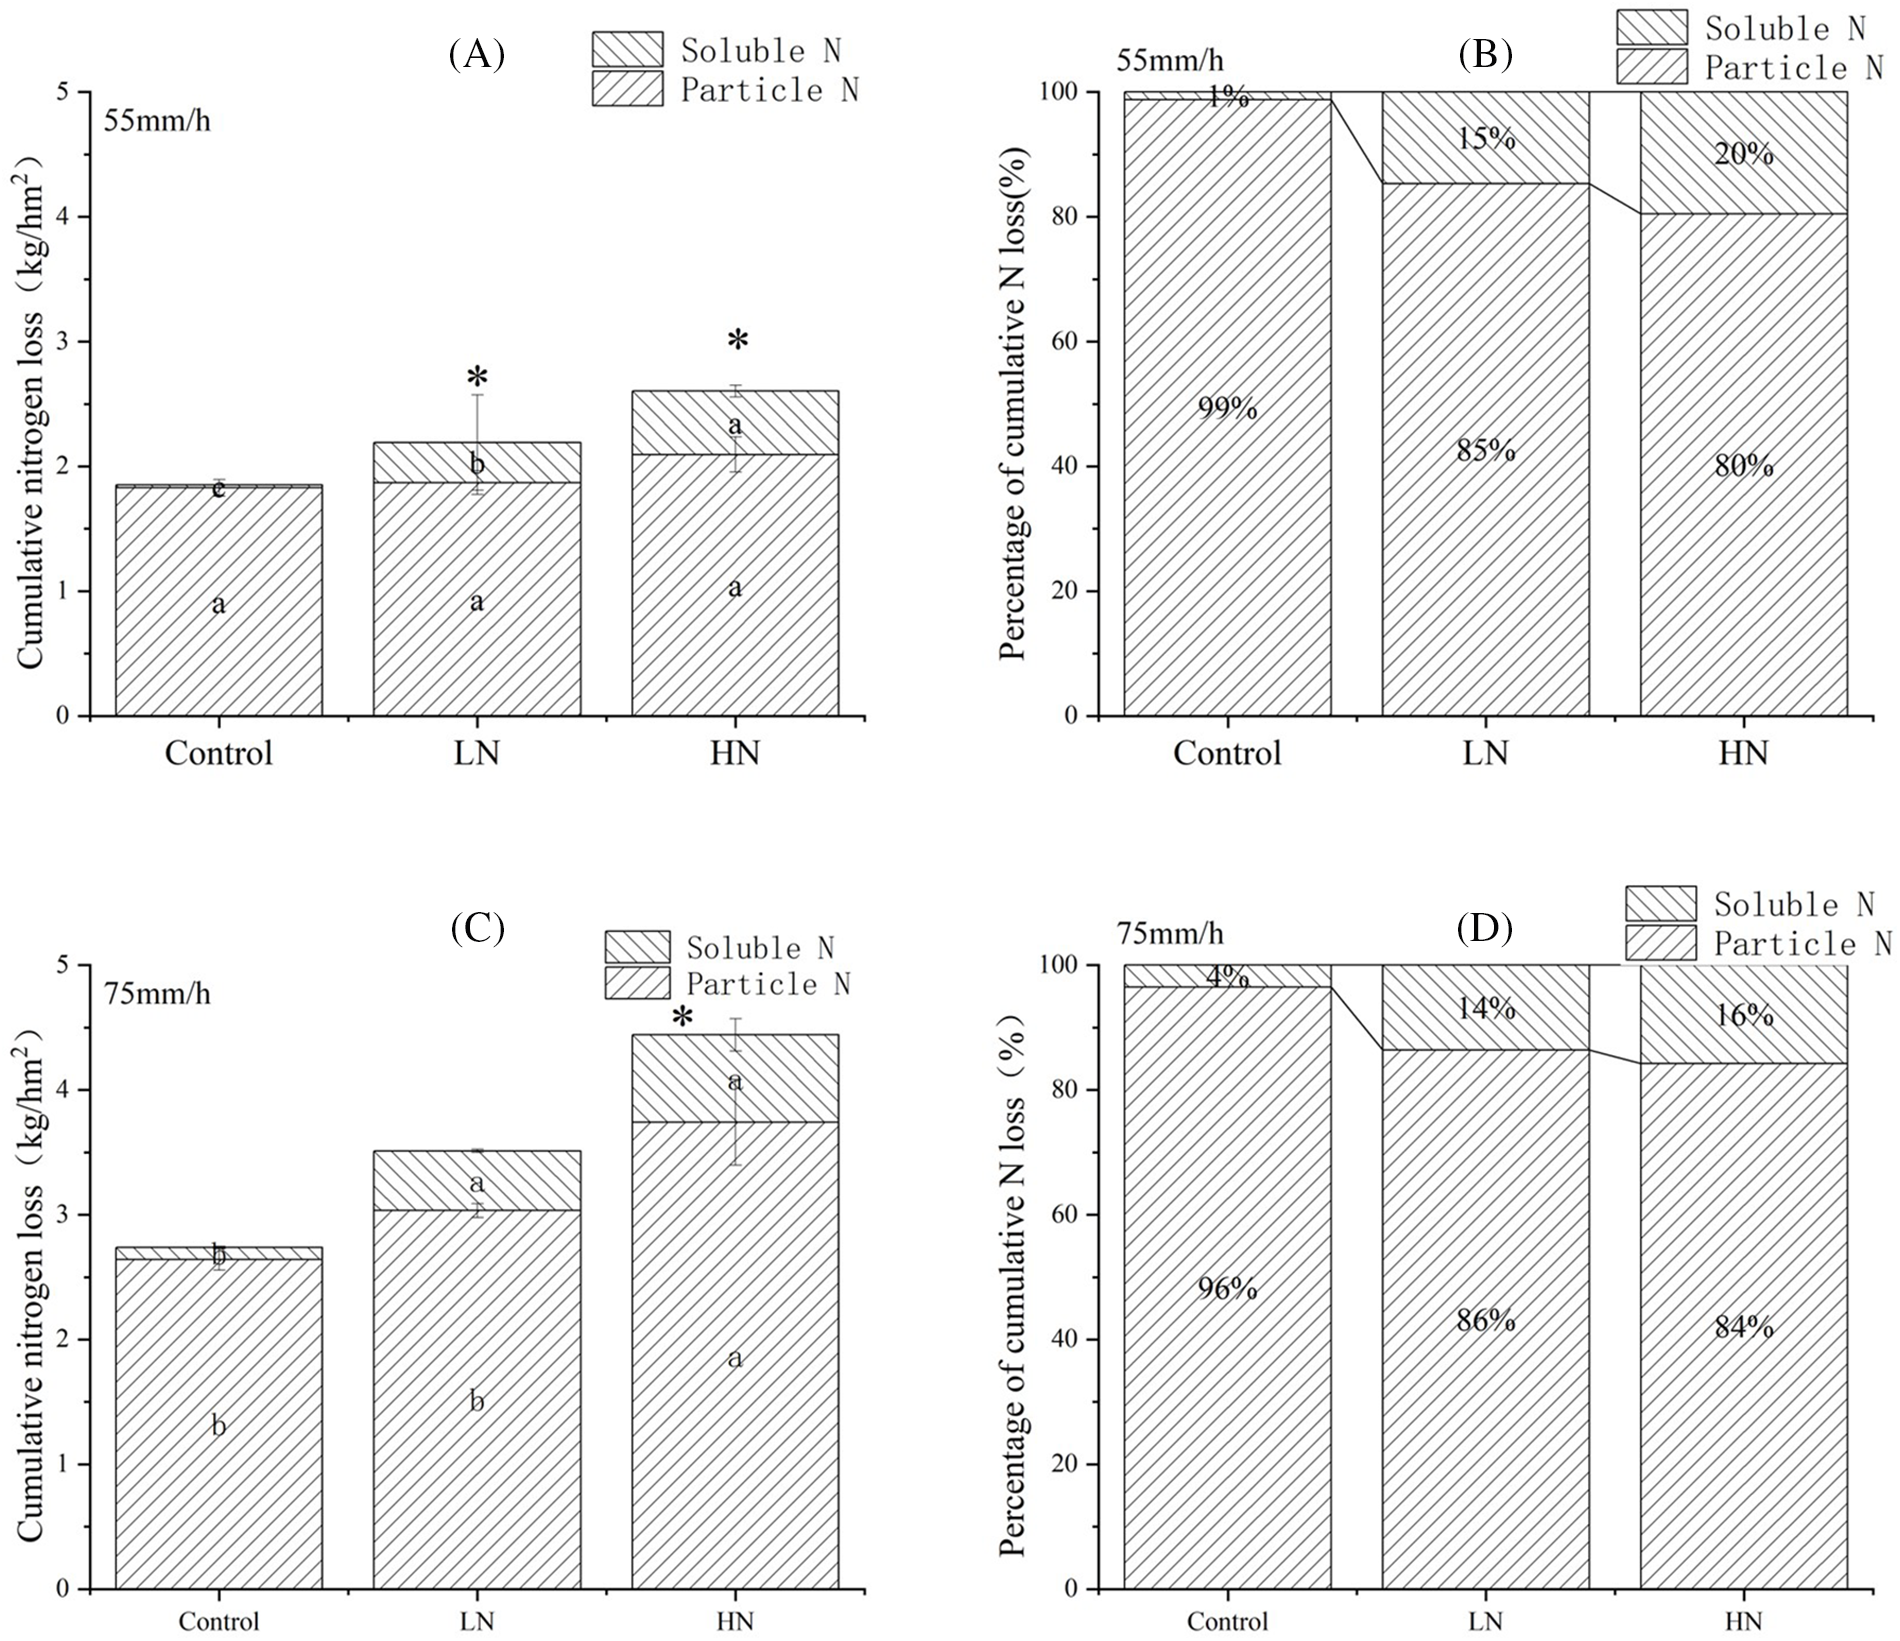
Figure 5: Cumulative runoff nitrogen losses and percent cumulative runoff nitrogen losses under different rainfall intensities and different high (HN) and low (LN) and Control N applications. (A) Cumulative nitrogen losses at 55 mm/h. (B) Percentage of cumulative nitrogen losses at 55 mm/h. (C) Cumulative nitrogen losses at 5 mm/h. (D) Percentage of cumulative nitrogen losses at 75 mm/h
Many factors determine the N losses via runoff from farmland, such as amounts of irrigation water, and N fertilizer, plant uptake capacity as well as the mulch managements [47,48]. As shown in Fig. 6, we here conducted a principal component analysis (PCA) to clarify the factors determining the runoff N losses from vegetable plantations. Overall, 89.3% of the total variation could be explained by PCA plot. Of which, PC1 explained the highest proportion of the variance (57.1%). Moreover, PN, STN, and TN runoff losses were positively correlated with the runoff volume, indicating that runoff volume mainly determined the N losses from vegetable fields. These results suggested that reducing the runoff rate from vegetable soil is of great importance to mitigate non-point source N pollutants from vegetable-producing systems.
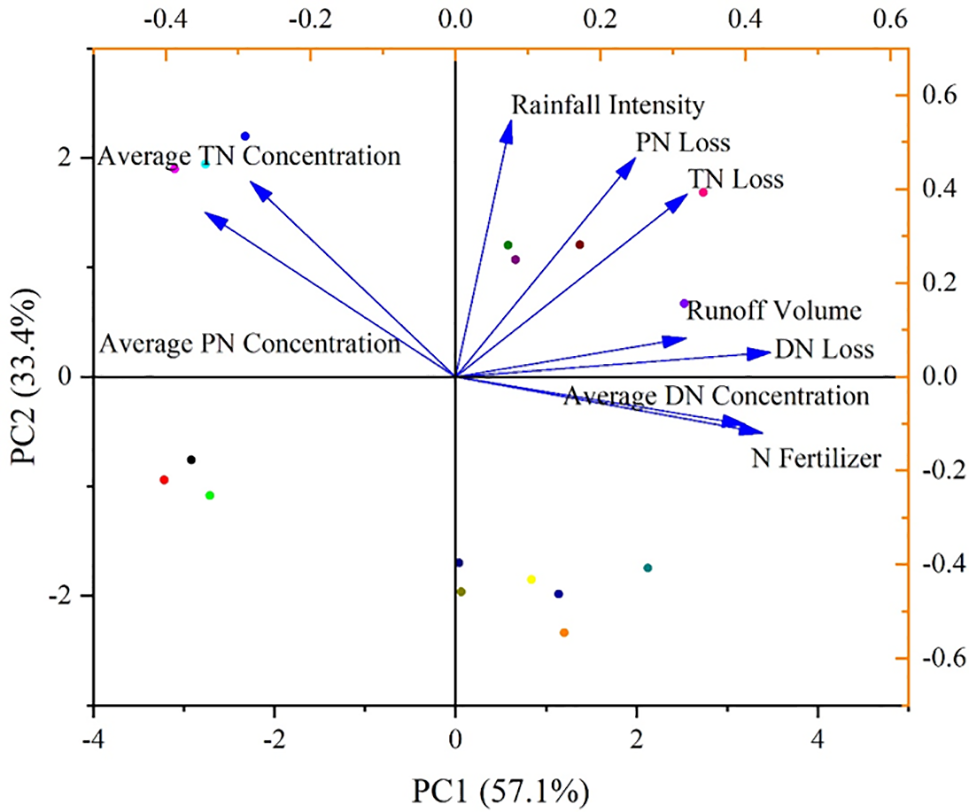
Figure 6: Principal component analysis (PCA) of the factors that contribute to the runoff N losses
In addition to chemical N fertilizer, N retained in the soil is also lost via runoff during rainfall events. Nitrogen fertilizers applied into the farmland and organic N in the soil increase the runoff N losses; therefore, appropriate fertilization can reduce fertilizer application rate and soil N losses [49]. In terms of runoff N fertilizer losses that from fertilizer applied in current season, there was minor difference in runoff loss rates between the two rainfall intensities (Table 3).
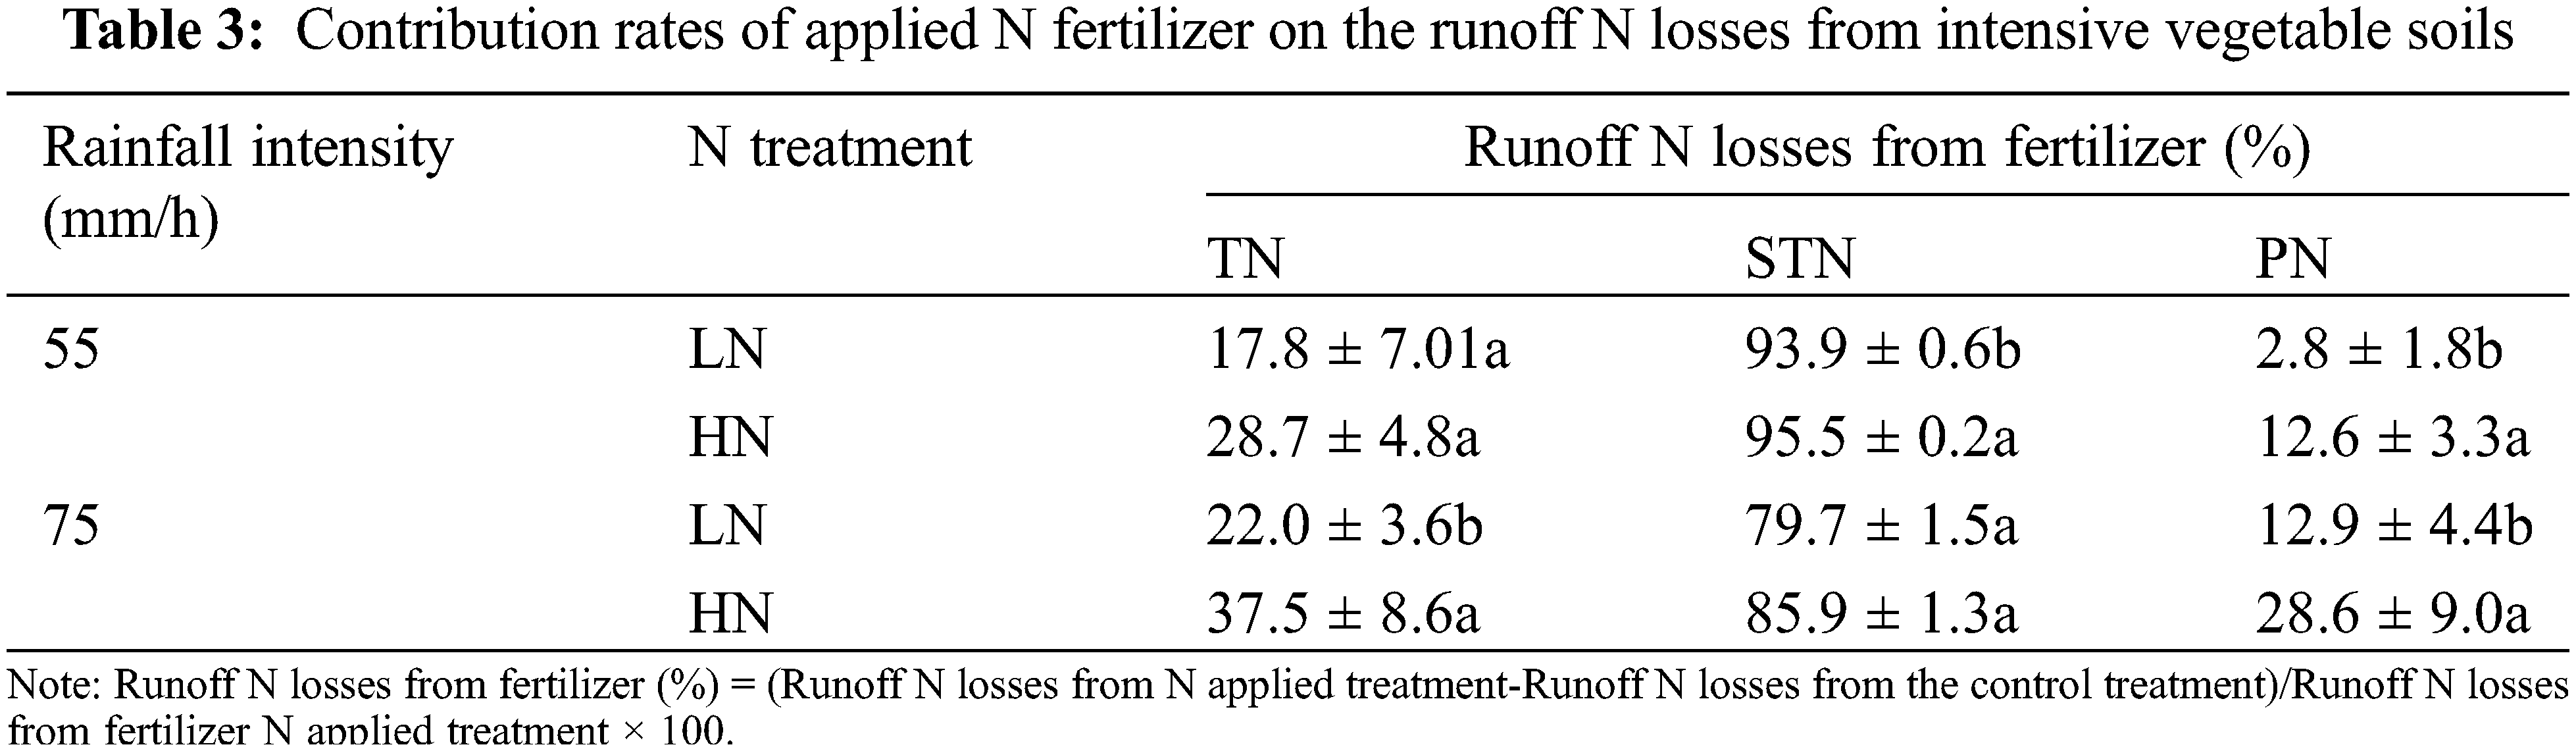
With the N fertilizer applied rate raise, the runoff losses of TN, STN, and PN from fertilizers generally increased. For example, under 55 mm/h rainfall intensity, runoff N lost via PN from fertilizers in the HN treatment was 4.5-fold higher than that in the LN treatment. Furthermore, under 75 mm/h, the runoff N losses in forms of both TN and PN from fertilizers that applied into HN treatment were significantly greater than LN treatment. These results indicated that more N would lost via runoff when the chemical N fertilizers are applied at high rates, which was overlooked in previous studies [50,51]
As shown in Table 3, the percentages of different forms of runoff N losses from fertilizer applied were STN (79.7%–95.5%), TN (17.8%–37.5%), and PN (2.8%–28.6%), respectively. Therefore, we suggested that most runoff N losses via soluble and particle N were contributed by the N that provided from fertilizers and that retained in retained in topsoil, respectively.
We conducted a simulated rainfall experiment considering different rainfall intensities and N application rates to investigate their interaction effects on the runoff N losses from an intensive vegetable field. The results showed that the most remarkable inflection point (increasing) of runoff volume was found at 20–30 min under two rainfall intensities. The LN and HN treatments were with similar dynamics in the concentration of each N form in the runoff at both rainfall intensities. A continuous decrease in the runoff N concentration was observed under the 55 mm/h rainfall intensity. Under 75 mm/h, there was a significant drop in the soluble N concentration during the first 25 min, which tended to be stabilized thereafter. Nevertheless, the particulate and total N decreased considerably after 30 min. Compared to the non-N control, N fertilizer application increased total runoff N losses from vegetable soil by 22.3%–40.7% and 28.2%–62.2% under 55 and 75 mm/h rainfall intensities, respectively. At both rainfall intensities, particulate N was the main form in runoff N (80%–99%). Moreover, 79.7%–95.5% of the soluble N and 17.8%–37.5% of the total N losses were from applied N fertilizers. Meanwhile, long-term studies considering multi-sites and -crops should be conducted to comprehensively clarify the law and influencing factors of N losses from vegetable soil.
Acknowledgement: None.
Funding Statement: This work was financially supported by the National Key Research and Development Program of China (No. 2021YFD1700801).
Author Contributions: Study conception and design: Mingkun Cheng, Ju Min, Xia Wang and Weiming Shi; data collection: Mingkun Cheng; analysis and interpretation of results: Mingkun Cheng and Ju Min; Mingkun Cheng, Yanying Zhang and Yuhe Wang conducted field sampling; draft manuscript preparation and review: Mingkun Cheng, Ju Min, and Weiming Shi. All authors reviewed the results and approved the final version of the manuscript.
Availability of Data and Materials: The data that support this study will be shared upon reasonable request to the corresponding author.
Ethics Approval: Not applicable.
Conflicts of Interest: The authors declare that they have no conflicts of interest to report regarding the present study.
References
1. Min J, Sun H, Kronzucker HJ, Wang Y, Shi W. Comprehensive assessment of the effects of nitrification inhibitor application on reactive nitrogen loss in intensive vegetable production systems. Agric Ecosyst Environ. 2021;307:107227. [Google Scholar]
2. Kumar S, Prasad S, Yadav KK, Shrivastava M, Gupta N. Hazardous heavy metals contamination of vegetables and food chain: role of sustainable remediation approaches—a review. Environ Res. 2019;179:108792. [Google Scholar] [PubMed]
3. Li B, Bi Z, Xiong Z. Dynamic responses of nitrous oxide emission and nitrogen use efficiency to nitrogen and biochar amendment in an intensified vegetable field in southeastern China. GCB Bioenergy. 2017;9(2):400–13. [Google Scholar]
4. Song XZ, Zhao CX, Wang XL, Li J. Study of nitrate leaching and nitrogen fate under intensive vegetable production pattern in northern China. C R Biol. 2009;332(4):385–92. [Google Scholar] [PubMed]
5. Min J, Shi W. Nitrogen discharge pathways in vegetable production as non-point sources of pollution and measures to control it. Sci Total Environ. 2018;613–614:123–30. [Google Scholar] [PubMed]
6. Wang R, Min J, Kronzucker HJ, Li Y, Shi W. N and P runoff losses in China’s vegetable production systems: loss characteristics, impact, and management practices. Sci Total Environ. 2019;663:971–9. [Google Scholar] [PubMed]
7. Sun H, Jeyakumar P, Xiao HD, Li XW, Liu J, Yu M, et al. Biochar can increase chinese cabbage (Brassica oleracea L.) yield, decrease nitrogen and phosphorus leaching losses in intensive vegetable soil. Phyton-Int J Exp Bot. 2021;91(1):197–206. doi:10.32604/phyton.2022.016492. [Google Scholar] [CrossRef]
8. Bogunovic I, Telak LJ, Pereira P, Filipovic V, Filipovic L, Percin A, et al. Land management impacts on soil properties and initial soil erosion processes in olives and vegetable crops. J Hydrol Hydromech. 2020;68(4):328–37. [Google Scholar]
9. Zhou P, Zhang D, Zhuang L, Zhang L, Yuan W, Singh RP. Assessment of runoff nutrients loss in Phyllostachys praecox cv. prevernalis forest land under simulated rainfall conditions. Environ Sci Pollut Res. 2021;28(17):21874–86. [Google Scholar]
10. Ma B, Guan RH, Liu L, Huang ZX, Qi SW, Xi ZF, et al. Nitrogen loss in vegetable field under the simulated rainfall experiments in Hebei, China. Water. 2021;13(4):552. doi:10.3390/w13040552. [Google Scholar] [CrossRef]
11. Gao C, Zhu JG, Zhu JY, Gao X, Dou YJ, Hosen Y. Nitrogen export from an agriculture watershed in the Taihu Lake area, China. Environ Geochem Health. 2004;26(2):199–207. doi:10.1023/B:EGAH.0000039582.68882.7f. [Google Scholar] [PubMed] [CrossRef]
12. Marques MJ, Bienes R, Jiménez L, Pérez-Rodríguez R. Effect of vegetal cover on runoff and soil erosion under light intensity events. Rainfall simulation over USLE plots. Sci Total Environ. 2007;378(1–2):161–5. [Google Scholar] [PubMed]
13. Douglas CL Jr, King KA, Zuzel JF. Nitrogen and phosphorus in surface runoff and sediment from a wheat-pea rotation in northeastern Oregon. J Environ Qual. 1998;27(5):1170–7. doi:10.2134/jeq1998.00472425002700050023x. [Google Scholar] [CrossRef]
14. Uribe N, Corzo G, Quintero M, van Griensven A, Solomatine D. Impact of conservation tillage on nitrogen and phosphorus runoff losses in a potato crop system in Fuquene watershed, Colombia. Agr Water Manage. 2018;209(1):62–72. doi:10.1016/j.agwat.2018.07.006. [Google Scholar] [CrossRef]
15. Wu M, Tang XQ, Li Q, Yang WJ, Jin F, Tang MZ. Review of ecological engineering solutions for rural non-point source water pollution control in Hubei province, China. Water Air Soil Pollut. 2013;224(5):1561. doi:10.1007/s11270-013-1561-x. [Google Scholar] [CrossRef]
16. Chen L, Liu F, Wang Y, Li X, Zhang S, Li Y, et al. Nitrogen removal in an ecological ditch receiving agricultural drainage in subtropical central China. Ecol Eng. 2015;82:487–92. doi:10.1016/j.ecoleng.2015.05.012. [Google Scholar] [CrossRef]
17. Dunkerley D. The case for increased validation of rainfall simulation as a tool for researching runoff, soil erosion, and related processes. Catena. 2021;202(1):105283. doi:10.1016/j.catena.2021.105283. [Google Scholar] [CrossRef]
18. Tei F, De Neve S, de Haan J, Kristensen HL. Nitrogen management of vegetable crops. Agr Water Manage. 2020;240(3):106316. doi:10.1016/j.agwat.2020.106316. [Google Scholar] [CrossRef]
19. Han J, Shi J, Zeng L, Xu J, Wu L. Impacts of continuous excessive fertilization on soil potential nitrification activity and nitrifying microbial community dynamics in greenhouse system. J Soils Sediments. 2017;17(2):471–80. doi:10.1007/s11368-016-1525-z. [Google Scholar] [CrossRef]
20. Wang Z, Li S. Effects of nitrogen and phosphorus fertilization on plant growth and nitrate accumulation in vegetables. J Plant Nutr. 2004;27(3):539–56. doi:10.1081/PLN-120028877. [Google Scholar] [CrossRef]
21. Warner J, Zhang TQ, Hao X. Effects of nitrogen fertilization on fruit yield and quality of processing tomatoes. Can J Plant Sci. 2004;84(3):865–71. doi:10.4141/P03-099. [Google Scholar] [CrossRef]
22. Caruso G, Conti S, Rocca G. Influence of crop cycle and nitrogen fertilizer form on yield and nitrate content in different species of vegetables. Acta Hortic. 2011;25:81–9. [Google Scholar]
23. Greenwood DJ, Cleaver TJ, Turner MK, Hunt J, Niendorf KB, Loquens SMH. Comparison of the effects of nitrogen fertilizer on the yield, nitrogen content, and quality of 21 different vegetable and agricultural crops. J Agric Sci. 1980;95(2):471–85. doi:10.1017/S0021859600039514. [Google Scholar] [CrossRef]
24. Mohammad AG, Adam MA. The impact of vegetative cover type on runoff and soil erosion under different land uses. Catena. 2010;81(2):97–103. doi:10.1016/j.catena.2010.01.008. [Google Scholar] [CrossRef]
25. El Kateb H, Zhang H, Zhang P, Mosandl R. Soil erosion and surface runoff on different vegetation covers and slope gradients: a field experiment in Southern Shaanxi Province, China. Catena. 2013;105:1–10. [Google Scholar]
26. Głąb T. Effect of soil compaction and N fertilization on soil pore characteristics and physical quality of sandy loam soil under red clover/grass sward. Soil Till Res. 2014;144:8–19. [Google Scholar]
27. Lu S, Yu X, Zong Y. Nano-microscale porosity and pore size distribution in aggregates of paddy soil as affected by long-term mineral and organic fertilization under rice-wheat cropping system. Soil Till Res. 2019;186:191–9. [Google Scholar]
28. Zhang X, Neal AL, Crawford JW, Bacq-Labreuil A, Akkari E, Rickard W. The effects of long-term fertilizations on soil hydraulic properties vary with scales. J Hydrol. 2021;593:125890. [Google Scholar]
29. Maltas A, Dupuis B, Sinaj S. Yield and quality response of two potato cultivars to nitrogen fertilization. Potato Res. 2018;61(2):97–114. [Google Scholar]
30. Ali Md. S. Effect of different levels of organic fertilizer on growth, yield, and economic benefits of radish (Raphanus sativus L.). J Biosci Agric Res. 2023;30:2533–40. [Google Scholar]
31. Smith DR, Owens PR, Leytem AB, Warnemuende EA. Nutrient losses from manure and fertilizer applications as impacted by time to first runoff event. Environ Pollut. 2007;147(1):131–7. [Google Scholar] [PubMed]
32. Glendining MJ, Powlson DS, Poulton PR, Bradbury NJ, Palazzo D, Ll X. The effects of long-term applications of inorganic nitrogen fertilizer on soil nitrogen in the broadbalk wheat experiment. J Agric Sci. 1996;127(3):347–63. [Google Scholar]
33. Yang L, Yang G, Li H, Yuan S. Effects of rainfall intensities on sediment loss and phosphorus enrichment ratio from typical land use type in Taihu Basin, China. Environ Sci Pollut Res. 2020;27(12):12866–73. [Google Scholar]
34. Luo C, Gao Y, Zhu B, Wang T. Sprinkler-based rainfall simulation experiments to assess nitrogen and phosphorus losses from a hillslope cropland of purple soil in China. Sustain Water Qual Ecol. 2013;1(2):40–7. [Google Scholar]
35. Wu L, Peng M, Qiao S, Ma X. Assessing impacts of rainfall intensity and slope on dissolved and adsorbed nitrogen loss under bare loessial soil by simulated rainfalls. Catena. 2018;170(1):51–63. doi:10.1016/j.catena.2018.06.007. [Google Scholar] [CrossRef]
36. Xing W, Yang P, Ao C, Ren S, Xu Y. Mathematical model of ammonium nitrogen transport to runoff with different slope gradients under simulated rainfall. Water. 2019;11(4):675. doi:10.3390/w11040675. [Google Scholar] [CrossRef]
37. Wu L, Qiao S, Peng M, Ma X. Coupling loss characteristics of runoff-sediment-adsorbed and dissolved nitrogen and phosphorus on bare loess slope. Environ Sci Pollut Res. 2018;25(14):14018–31. doi:10.1007/s11356-018-1619-9. [Google Scholar] [PubMed] [CrossRef]
38. Gao B, Walter MT, Steenhuis TS, Parlange JY, Nakano K, Rose CW, et al. Investigating ponding depth and soil detachability for a mechanistic erosion model using a simple experiment. J Hydrol. 2003;277(1):116–24. doi:10.1016/S0022-1694(03)00085-4. [Google Scholar] [CrossRef]
39. Jin ZF, Xiao JZ, Ye HY, Fu GW, Li GG, Wu WB, et al. Determination of nitrogen sources and losses in surface runoff from different lands at a watershed scale. Environ Sci Pollut Res. 2023;30(22):63052–64. doi:10.1007/s11356-023-26459-7. [Google Scholar] [PubMed] [CrossRef]
40. Min J, Lu K, Zhao X, Sun H, Zhang H, Shi W. Nitrogen removal from the surface runoff of a field scale greenhouse vegetable production system. Environ Technol. 2015;36(24):3136–47. [Google Scholar] [PubMed]
41. Chang JF, Liu Y, Li C, Luo M, Ma YH. Characteristics of nitrogen and phosphorus loss in farmland and the influencing factorschin. Agric Sci Bull. 2023;39(15):69–75. [Google Scholar]
42. Hou PF, Jiang Y, Yan L, Petropoulos E, Wang JY, Xue LH. Effect of fertilization on nitrogen losses through surface runoffs in Chinese farmlands: a meta-analysis. Sci Total Environ. 2021;793:148554. [Google Scholar] [PubMed]
43. Zeng SC, Su ZY, Chen BG, Wu QT, Ouyang Y. Nitrogen and phosphorus runoff losses from orchard soils in South China as affected by fertilization depths and rates. Pedosphere. 2008;18(1):45–53. [Google Scholar]
44. Schuman GE, Burwell RE, Piest RF, Spomer RG. Nitrogen losses in surface runoff from agricultural watersheds on missouri valley loess. J Environ Qual. 1973;2(2):299–302. [Google Scholar]
45. Baker JL, Laflen JM. Effects of corn residue and fertilizer management on soluble nutrient runoff losses. Trans ASAE. 1982;25(2):344–8. [Google Scholar]
46. Zhang Q, Liu D, Cheng S, Huang X. Combined effects of runoff and soil erodibility on available nitrogen losses from sloping farmland affected by agricultural practices. Agr Water Manage. 2016;176:1–8. [Google Scholar]
47. Wang Q, Li FR, Zhao L, Zhang Eh, Shi SL, Zhao WZ, et al. Effects of irrigation and nitrogen application rates on nitrate nitrogen distribution and fertilizer nitrogen loss, wheat yield and nitrogen uptake on a recently reclaimed sandy farmland. Plant Soil. 2010;337(1):325–39. [Google Scholar]
48. Dong Y, Yang JL, Zhao XR, Yang SH, Mulder J, Dörsch P, et al. Nitrate runoff loss and source apportionment in a typical subtropical agricultural watershed. Environ Sci Pollut Res. 2022;29(14):20186–99. [Google Scholar]
49. Thayer C, Gilley JE, Durso L, Marx D. Runoff nutrient loads as affected by residue cover, manure application rate, and flow rate. Trans ASABE. 2012;55:249–58. [Google Scholar]
50. Diaz DAR, Sawyer JE, Barker DW, Mallarino AP. Runoff nitrogen loss with simulated rainfall immediately following poultry manure application for corn production. Soil Sci Soc Am J. 2019;651:2927–42. [Google Scholar]
51. Gupta N, Yadav KK, Kumar V, Kumar S, Chadd RP, Kumar A. Trace elements in soil-vegetables interface: translocation, bioaccumulation, toxicity and amelioration—a review. Sci Total Environ. 2019;651:2927–42. [Google Scholar] [PubMed]
Cite This Article
 Copyright © 2024 The Author(s). Published by Tech Science Press.
This work is licensed under a Creative Commons Attribution 4.0 International License , which permits unrestricted use, distribution, and reproduction in any medium, provided the original work is properly cited.
 Downloads
 Citation Tools