
 Submit a Paper
 Propose a Special lssue
 Open Access
ARTICLE
Integrative Analysis of the Transcriptome and Metabolome of Poplar, Populus deltoides ‘Shalinyang’. (Salicaceae), Reveals Responses to Attack by Anoplophora glabripennis (Coleoptera)
1 College of Life Science, Institute of Life Science and Green Development, Hebei University, Baoding, 071002, China
2 Experimental Center of Desert Forest, Chinese Academy of Forestry, Bayannur, 015200, China
3 Shanxi Experiment Bureau for High-Yield Poplar Forests, Datong, 037006, China
4 Hebei Innovation Center for Bioengineering and Biotechnology, Hebei University, Baoding, 071002, China
* Corresponding Authors: Dandan Cao. Email: ; Jianrong Wei. Email:
# These authors contributed equally to this work
Phyton-International Journal of Experimental Botany 2024, 93(9), 2167-2188. https://doi.org/10.32604/phyton.2024.052858
Received 17 April 2024; Accepted 05 August 2024; Issue published 30 September 2024
 View Full Text
 Download PDF
Abstract
Anoplophora glabripennis is one of the most devastating wood-boring beetles that attacks poplars. However, one poplar species, Populus deltoides, has strong resistance to Anoplophora glabripennis infestation, the underlying defense mechanisms against Anoplophora glabripennis are poorly understood. Secondary metabolites play a crucial role in plants to combat biological stress. Here, based on transcriptome and metabolome, we demonstrated that the mechanisms for responses to mechanical damage and insect infestation were different. The degree of reactions to adult groove production, larval incubation, and larval frass production was not identical. In addition, the potential genes with insect resistance activity were identified. Predominant differentially expressed genes (DEGs) found in the phloem of Populus deltoides include anthocyanidin 3-O-glucosyltransferase5 (PdUGT72E), peroxidase 73 (PdPod73), peroxidase A2 (PdPodA2) and macrophage migration inhibitory factor (PdMIF) responded to stress caused by Anoplophora glabripennis, which further resulted in activation of the plant defense system against insects via changes in regulation of metabolic pathways, such as tyrosine metabolism pathway, phenylpropanoid biosynthesis pathway and flavonoid biosynthesis pathway. Therefore, this work has laid a foundation for further unraveling the mechanisms involved in this interaction.Keywords
Worldwide, poplar has become an important tree species for addressing afforestation and for use in shelterbelts [1,2]. However, there is a wide variety of insect pests that feed on it including leaf-eating insects (e.g., Lymantria dispar). Lepidoptera. Micromelalopha troglodyte. Graeser and Sylepta derogata. Fabricius [3]; and stem borers, e.g., Asian longhorned beetle (ALB), that damage plant transport tissue affecting plant growth and leading to tree death [4]. Especially, since ALB is the main wood-boring insect of poplars, it is difficult to prevent and control ALB, which caused annual losses of $1.5 billion in China [5]. According to a survey done between 2001 and 2008, the United States and Europe have also invested significant human and financial resources into eradicating this pest [6]. Populus deltoides ‘Shalinyang’ (PdS), a new disease-resistant variety, is a cross between Populus deltoides cl. Nankang and Populus deltoides cl. 175, specifically bred for the challenging conditions of northwestern China. Adult emergence rates of ALB are low on PdS, indicating that PdS has strong resistance to insects [4], but the mechanism of this resistance is unclear.
Through prolonged co-evolution, plants have developed diverse mechanisms to defend themselves against insect herbivores [7]. Plant-induced defenses and the production of secondary metabolites for protection from insect attack have been widely studied. When facing threats, plants can produce diverse metabolites, these include glucosinolates, alkaloids, phenolics, terpenoids that act as repellents, anti-digestives, and herbivore-induced plant volatiles (HIPVs) [8]; and toxins that either affect growth and development of herbivores [3,9], disrupt their metabolism, or attract predators upon herbivore attack. For example, berberine and isoquinoline are alkaloids found in the roots and bark of P. Renault and can kill various microorganisms [10]. Therefore, secondary metabolites play a crucial role in plant responses to stress.
Herbivores not only induce a series of physiological and biochemical reactions but also activate defense genes, which lead to a reconfiguration of metabolic processes in plants. During responses to herbivore infestation, plants can initiate pathogen-associated molecular pattern (PAMPs)-triggered responses that induce alterations in proteins and transcription factors, leading to the regulation of a variety of specific functional genes [11]. The transcriptome-level analysis provides insights into the molecular mechanisms underlying the defense of Arachis hypogaea against the nematode Meloidogyne incognita. Additionally, relevant studies reveal the characteristics and expression patterns of the TCP (Teosinte-like Capping Protein) transcription factors family in Allium senescens when subjected to drought stress conditions [12]. It has been estimated that about 500 mRNAs constitute the insect-responsive transcriptome in tobacco [13]. Transcriptome analysis has been used to identify a range of genes related to particular traits, and already identified key genes associated with responses to insects and disease in poplar [14,15]; and abiotic stress [16]. The metabolome encompasses the dynamic changes of all metabolites within an organism, interacting with the genome, transcriptome, and proteome to regulate various biological processes [17]. Therefore, combining metabolomics with transcriptome analysis can effectively identify key genes linked to specific biological functions.
In light of the damage caused to PdS by the Asian longhorned beetle (ALB), there is a growing focus on discovering anti-pest mechanisms to mitigate this damage. Our study involved a comparative transcriptome analysis of PdS phloem tissue, examining the enrichment of differentially expressed genes (DEGs) in response to both mechanical injury and insect infestation. We classified the enriched DEGs associated with secondary metabolic pathways to pinpoint the specific genes that respond to ALB attacks, followed by functional validation using real-time PCR. Ultimately, through a comprehensive analysis of transcriptomics and metabolomics, we identified the most significant relationships between differentially accumulated metabolites (DAMs) and DEGs. This screening highlights potential target factors for further investigation into the anti-pest mechanisms in PdS.
The sample of Populus deltoides ‘Shalinyang’ (PdS) was provided by the Experimental Center of Desert Forestry, Chinese Academy of Forestry. The field experiment was conducted at Dengkou, Inner Mongolia, China ( 40°25.935′ N, 106°43.442′ E), during the growth season (August), 2022.
The tested adults of A. glabripennis (ALB) were collected from infested logs from poplar felled at Dengkou, Inner Mongolia, China ( 40°25.935′ N, 106°43.442′ E) in spring, 2022. Infested logs were incubated indoors and after 4 months ALB adults emerged.
2.2 Establishment of Plant Treatments
Fifteen healthy PdS trees, each with a trunk diameter of approximately 8 cm, were selected from the same location and showed no visible signs of disease or pest infestation. The trunks were numbered and enclosed in ventilated nylon cages (height: 80 cm, radius: 40 cm, 10 mesh). For the pest infestation treatment (designated as treatment P, with trunk numbers 1–3), one male and three female insects were introduced into each cage to feed on the fresh branches and leaves of the current year’s growth. When over 30 eggs notch grooves (representing the offspring of the three females) were observed on each trunk, the oviposition time was recorded and the adults removed (about 3 days). The mechanical damage was achieved by Sterile knife to crescentic shaped grooves on the same day that obvious grooves were observed in the P treatment; The position of each groove corresponds to the groove gnawed by ALB. The remaining nine poplars served as the control (treatment C, trunk numbers 7–15). Samples were taken from trunk numbers 7–9, 10–12 and 13–15 at three different dates.
Following insect attack or mechanical damage trees ‘bleed’ phloem through the resulting wounds produced. We used this ‘bleeding’ as a tractable indication that defense responses were underway and identify appropriate sampling times. In the pest infestation treatment (P, tree numbers 1–3) sampling coincided with initial adult groove production (7th day; 3 days after initial ‘bleeding’ observed), larval incubation (18th day; 3 days after second ‘bleeding’ observed) and larvae pushing out frass (31st day). For comparison the same dates were used for sampling in control group (C), the mechanical damage group (M) and pest infestation group (P) were set three replicates for each treatment. New and healtht trees were selected as control each time. There were 27 phloem samples in total, identified as C_7_1, C_7_2, C_7_3, M_7_1, M_7_2, M_7_3, P_7_1, P_7_2, P_7_3, C_18_1, C_18_2, C_18_3, M_18_1, M_18_2, M_18_3, P_18_1, P_18_2, P_18_3, C_31_1, C_31_2, C_31_3, M_31_1, M_31_2, M_31_3, P_31_1, P_31_2 and P_31_31, respectively. Phloem samples were taken 2–3 cm from the grooves produced by adults. A piece of bark (3 cm × 2 cm) was removed along the direction of the trunk (about 1 g of phloem remains after scraping away the outermost bark). Care was taken to avoid affecting the grooves and eggs. Sampled phloem was immediately placed in tubes within liquid nitrogen and stored at −80°C. At the same time, the mechanical damage group and the control group were sampled, respectively. Samples were returned to the laboratory and subjected to sequencing analysis.
2.4 RNA Extraction and Library Preparation
Using TRIzol® The reagent extracts total RNA from PdS phloem and removes genomic DNA using DNase I (2270B, TaKara). The purity and integrity of RNA were detected on 1% agarose gel. Subsequently, the quality of RNA was evaluated using a 2100 Bioanalyzer (G2939A, Agilent Technologies, USA) and precise quantitative analysis was performed using ND-2000 (NanoDrop Technologies, Thermo Fisher Scientific, USA). Finally, we chose high-quality RNA samples (OD260/280 = 2.0) to further construct the sequencing library.
The PdS phloem RNA-seq transcriptome library was constructed using the Illumina® Stranded mRNA Prep, Ligation kit (San Diego, CA, USA), starting with 1μg of total RNA. mRNA was first isolated via polyA selection using oligo(dT) beads, followed by fragmentation with a fragmentation buffer. Subsequently, double-stranded cDNA was synthesized using the SuperScript double-stranded cDNA synthesis kit (11917020, Invitrogen, USA) and random hexamer primers (Illumina, USA). The synthesized cDNA underwent end-repair, phosphorylation, and ‘A’ base addition in accordance with Illumina’s library preparation protocol. Size selection was performed on cDNA target fragments of 300 bp using 2% Low Range Ultra Agarose, followed by PCR amplification with Phusion DNA polymerase (NEB, USA) for 15 cycles. After quantification with a Qubit 4.0, the paired-end RNA-seq library was sequenced on a NovaSeq 6000 sequencer, generating read lengths of 2 bp × 150 bp.
2.5 Quality Control and Read Mapping
Raw paired-end reads were trimmed and quality-checked using fastp [18] (https://github.com/OpenGene/fastp) (accessed on 10 April 2024) with default settings. Clean reads were aligned to the reference genome in orientation mode using HISAT2 software [19] (http://ccb.jhu.edu/software/hisat2/index.shtml) (accessed on 10 April 2024). The mapped reads for each sample were assembled using StringTie [20] (https://ccb.jhu.edu/software/stringtie/) (accessed on 10 April 2024) in a reference-based manner.
2.6 Functional Enrichment and Differential Expression Analysis
To identify differentially expressed genes (DEGs) between samples with varying treatments, transcript expression levels were calculated using the transcripts per million reads (TPM) method, and gene abundances were quantified with RSEM [21]. Differential expression analysis was conducted using either DESeq2 or DEGseq [22,23]. DEGs were considered significantly differentially expressed if they met the criteria of |log2FC| ≥ 2 and FDR ≤ 0.05 for DESeq2 or FDR ≤ 0.001 for DEGseq.
Additionally, functional annotation and enrichment analysis for Kyoto Encyclopedia of Genes and Genomes (KEGG) were performed using KOBAS software to identify which DEGs were significantly enriched in metabolic pathways compared to the whole transcriptome background, applying a Bonferroni-corrected p-value threshold of ≤0.05 [24].
Unigenes associated with isoquinoline alkaloid biosynthesis, tyrosine metabolism, phenylpropanoid biosynthesis, stilbenoid, diarylheptanoid and gingerol biosynthesis, and flavonoid biosynthesis pathways were identified through integrative annotation results. Heat maps were generated to illustrate the differential expression of these genes across different treatments.
2.7 Real-Time Quantitative PCR Validation
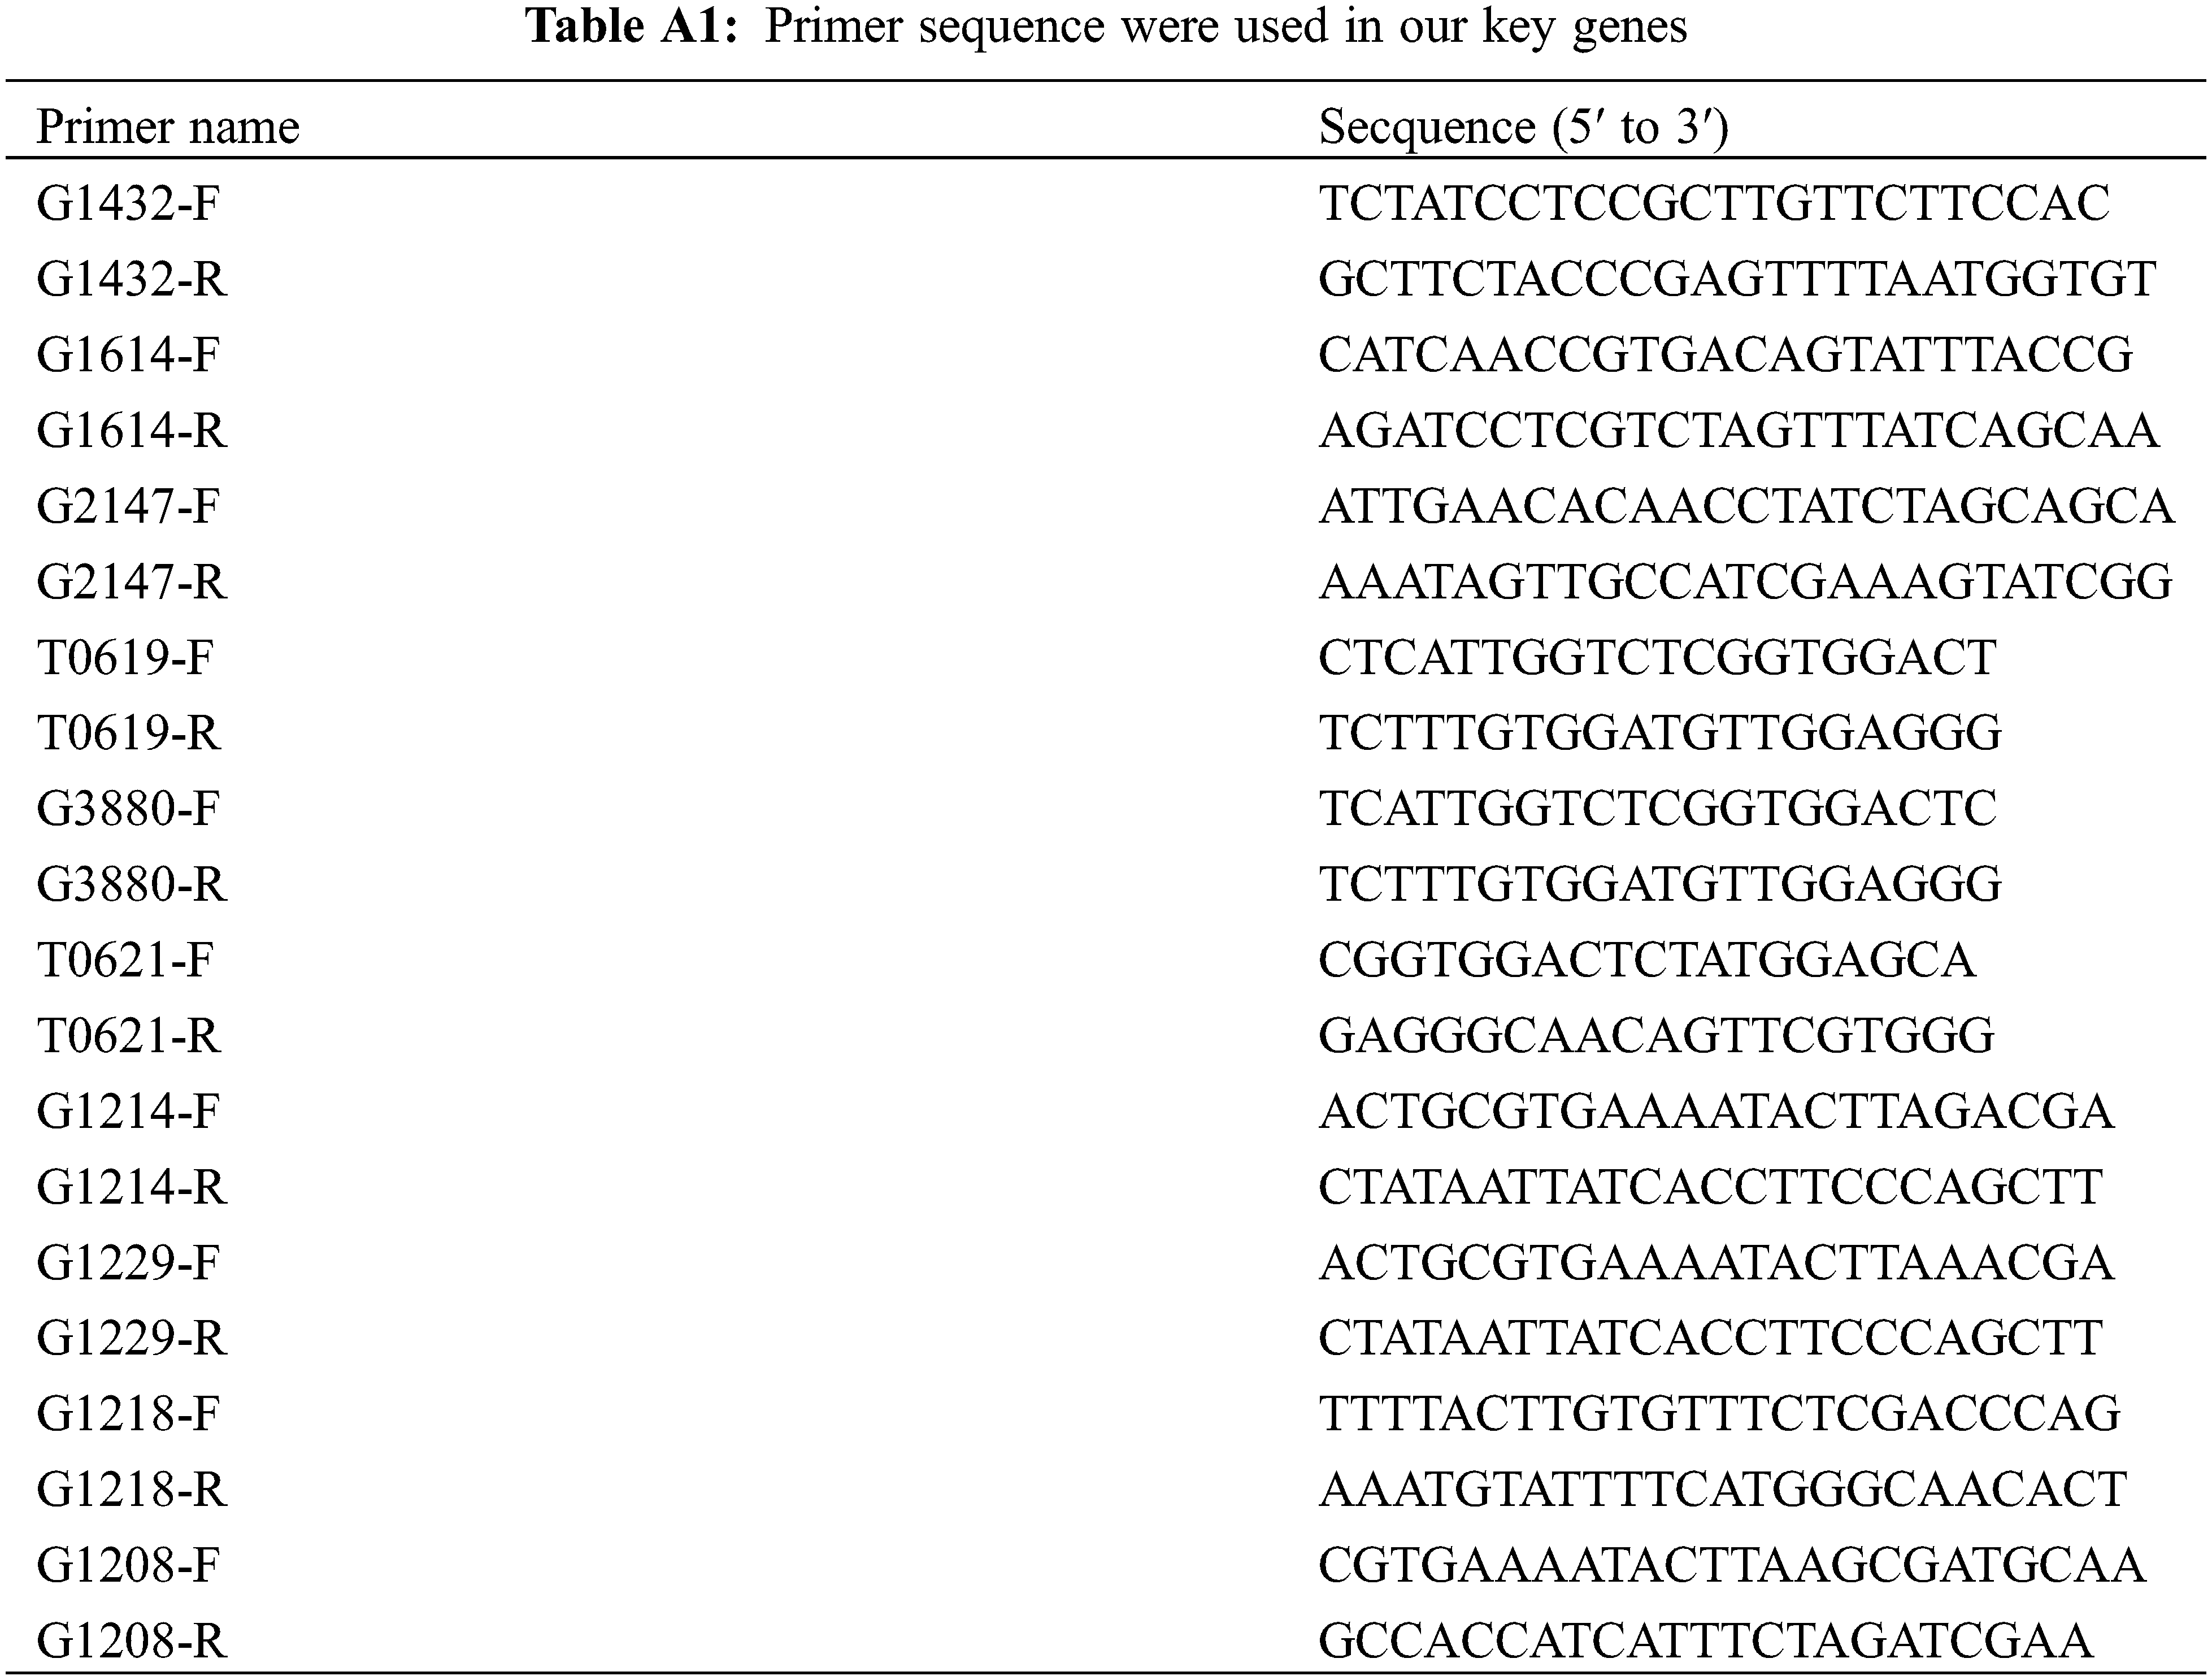
Ten differentially expressed genes (DEGs) that were up-regulated at all three stages following pest stimulation were selected from a total of 31 DEGs and validated by qRT-PCR. The qRT-PCR reaction mixture (10 µL) consisted of 5 µL TB Green® Premix Ex Taq™ (RR820A, TaKaRa, Dalian, China), 0.4 µL of each primer (10 µM), 0.8 µL of cDNA, and 3.4 µL of RNase-free water. The primer sequences for the ten genes are listed in Table A1. Real-time PCR was conducted using a CFX96 platform (Bio-Rad, Foster City, CA, USA), with three technical replicates for each sample. The Ubiquitin gene served as the reference gene for quantification. The qRT-PCR was performed using a three-step protocol with the following thermal cycling conditions: 95°C for 10 min, followed by 45 cycles of 95°C for 5 s and 55–58°C for 1 min. Gene expression levels were analyzed using the 2−ΔΔCt method [25].
2.8 Phloem Collection for Metabolome Analysis
For metabolomic analysis, sample processing, extraction, and detection were performed at Majorbio (Shanghai, China) according to their standard protocols. Nine PdS trees, each with similar diameter (8–10 cm), height (4–5 m), and age (4 years), were selected for the study. A cage was placed on the trunk of each tree, with three replicate trees for each of the three treatments: uninfested trees (C), trees mechanically damaged with a sterilization knife (M), and trees subjected to the release of ALB adults (one male and three females per cage, P). Phloem tissue from treatments C, M, and P was sampled. Samples were taken from the PdS bark 2–3 cm away from notch grooves, or equivalent locations in the C and M treatments. After removing the outer bark and cork, the remaining phloem (approximately 2 cm × 3 cm, 3 mm thick) was collected, weighing about 1 g. Each tree provided a sample, with three independent repetitions for each process.
2.9 Extraction of Metabolites for Analysis by Liquid Chromatography-Mass Spectrometry (LC-MS)
For metabolite extraction, 50 mg of phloem was placed in a 2 mL centrifuge tube along with a 6 mm grinding bead. The extraction solvent (400 μL) was a methanol-water mixture (4:1, v:v), and the internal standard (L-2-chlorophenylalanine) was added at 0.02 mg/mL. Samples were ground using a Wonbio-96c frozen tissue grinder at −10°C for 6 min at 50 Hz, followed by low-temperature ultrasonic extraction at 5°C for 30 min (40 kHz). After placing the samples at −20°C for 30 min, they were centrifuged at 4°C for 15 min at 13,000 g, and the supernatant was transferred to an injection vial for LC-MS analysis.
The LC-MS analysis was conducted using a Thermo UHPLC-Q Exactive HF-X system with an ACQUITY HSS T3 column (100 mm × 2.1 mm i.d., 1.8 μm; Waters, USA) at Majorbio Bio-Pharm Technology Co., Ltd. (Shanghai, China). The mobile phases included 0.1% formic acid in water:acetonitrile (95:5, v/v) for solvent A and 0.1% formic acid in acetonitrile: isopropanol: water (47.5:47.5, v/v) for solvent B. The flow rate was set to 0.40 mL/min, and the column temperature was maintained at 40°C. Mass spectrometry was performed using a Thermo UHPLC-Q Exactive HF-X mass spectrometer equipped with an electrospray ionization (ESI) source in both positive and negative modes. Optimal settings included a source temperature of 425°C, sheath gas flow rate at 50 arb, auxiliary gas flow rate at 13 arb, and ion-spray voltage floating (ISVF) at −3500 V for negative mode and 3500 V for positive mode. MS/MS normalized collision energy was set at 20-40-60 V, with full MS resolution at 60,000 and MS/MS resolution at 7500. Data acquisition was performed using the Data Dependent Acquisition (DDA) mode over a mass range of 70–1050 m/z.
The LC/MS raw data pre-processing was conducted using Genesis QI software (Waters Corporation, Milford, USA), resulting in the export of a three-dimensional data matrix in CSV format. Metabolite identification was performed through database searches, primarily utilizing HMDB (http://www.hmdb.ca/) (accessed on 10 April 2024), Metlin (https://metlin.scripps.edu/) (accessed on 10 April 2024), and the Majorbio Database. Variables from QC samples with a relative standard deviation (RSD) exceeding 30% were excluded and subjected to log10 transformation to create the final data matrix for further analysis. Subsequently, principal component analysis (PCA) and orthogonal least partial squares discriminant analysis (OPLS-DA) were executed using the R package ‘ropls’ (Version 1.6.2), along with a 7-cycle interactive validation to assess model stability. Metabolites were classified as significantly different if they exhibited a variable importance in projection (VIP) greater than 1 and a p-value less than 0.05, based on the OPLS-DA model’s VIP and p-values from Student’s t-test, while controlling for multiple testing with fold change criteria of ≥1 and ≤0.5.
2.11 Combined Transcriptome and Tetabolome Analyses
Differentially expressed genes (DEGs) and differentially accumulated metabolites were analyzed together to assess pathway enrichment. Gene-metabolite networks were constructed based on Pearson correlation coefficients (PCC) greater than 0.9.
The relative expression of genes was represented as means ± standard error (SE) from three independent replicates. Comparisons between treatments were performed using one-sample t-tests, with statistical significance set at p < 0.05, p < 0.01, and p < 0.001. Statistical analyses were carried out using Origin software (version 8.5, OriginLab, Guangzhou, China).
3.1 Statistical Analysis and Quality Evaluation of RNA-Seq
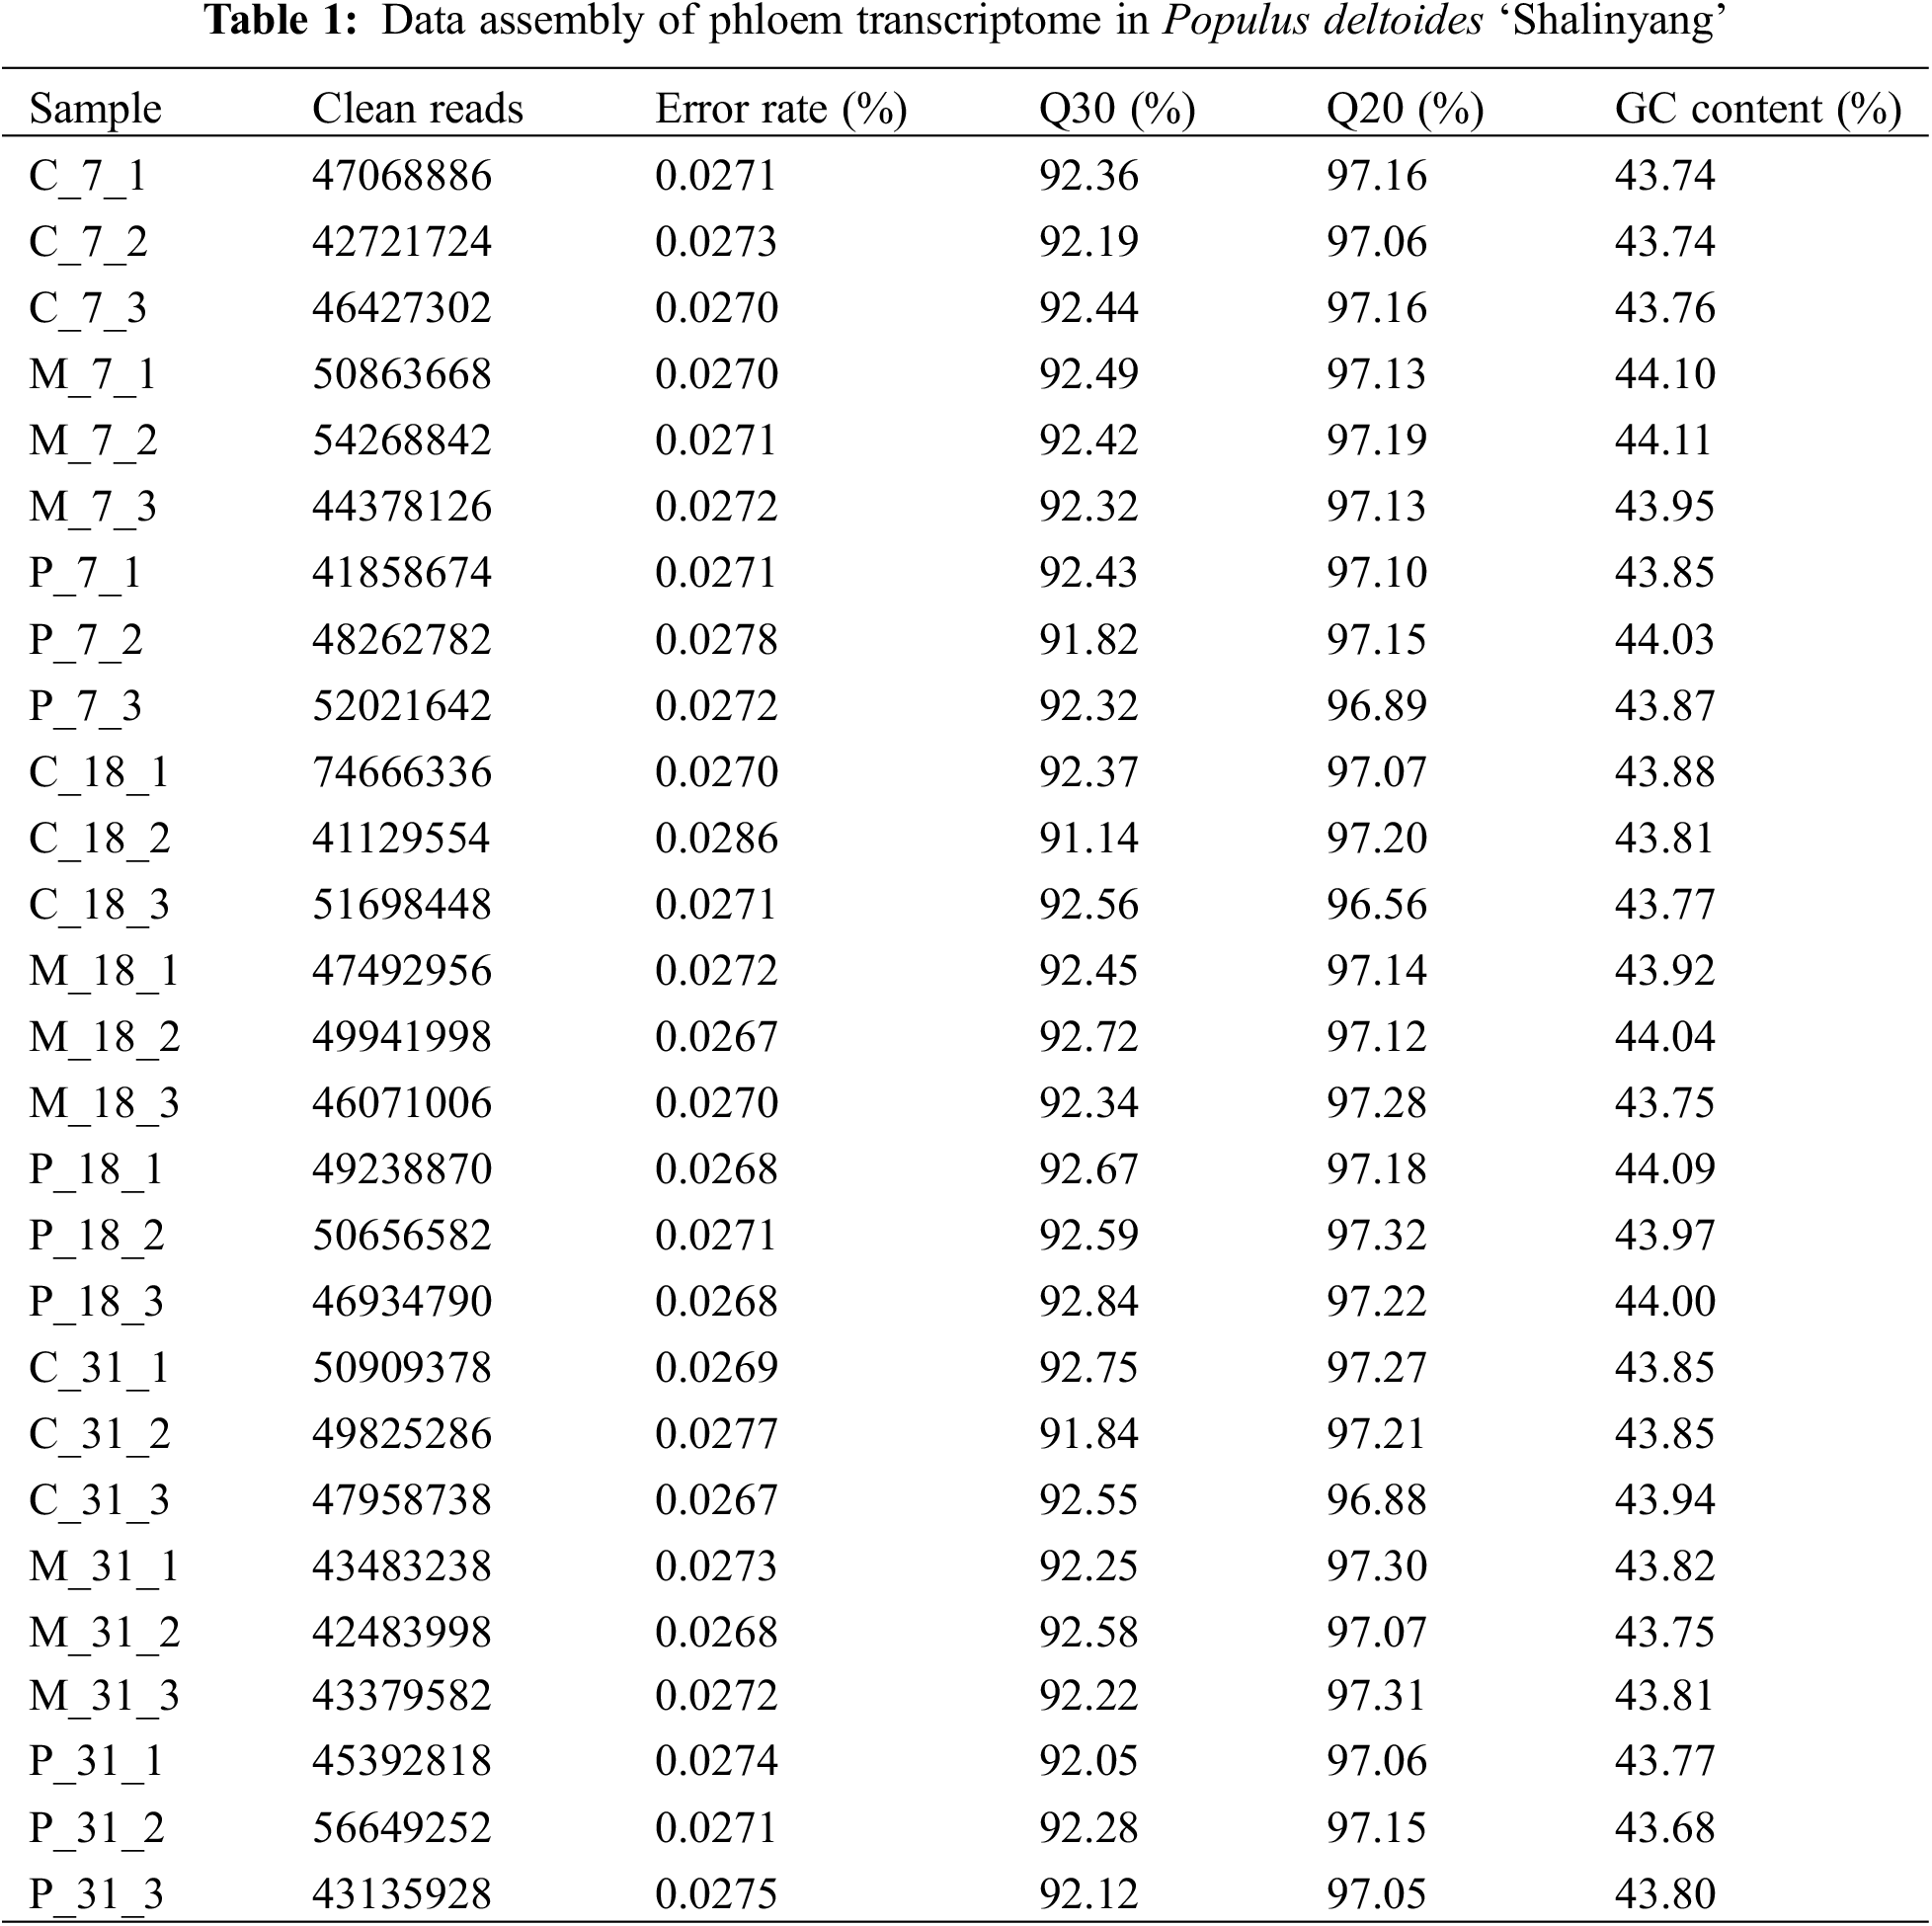
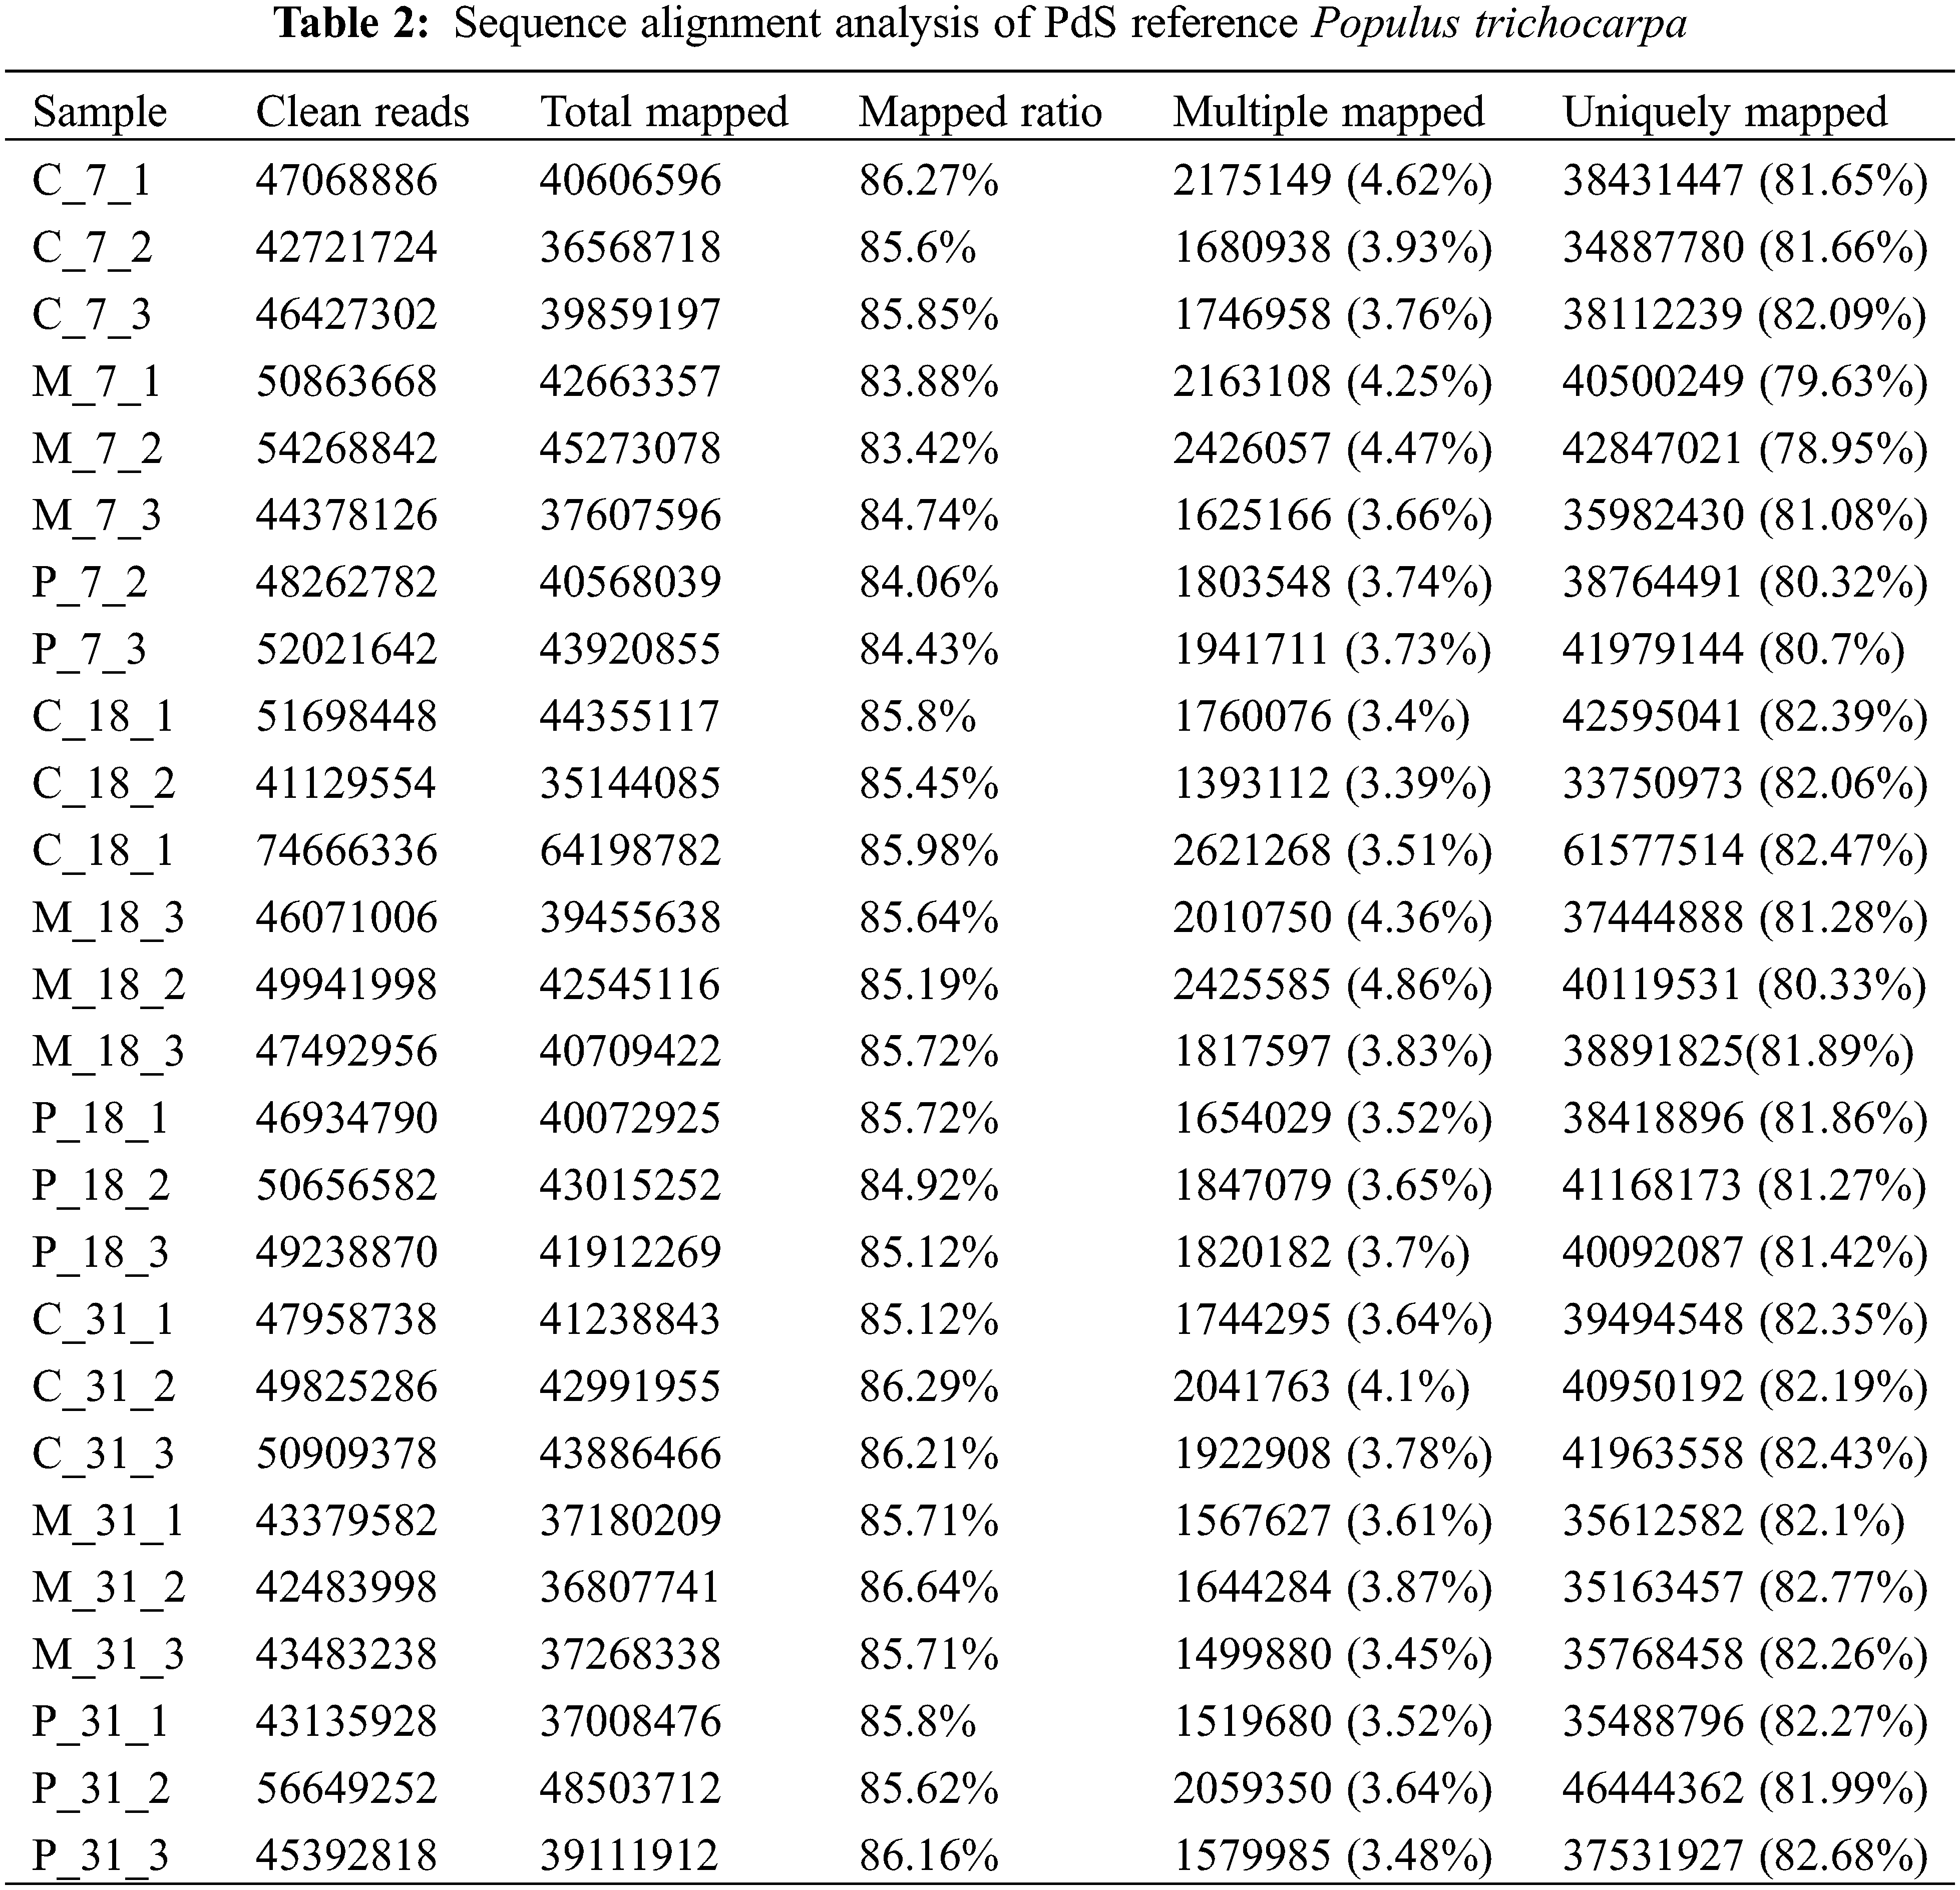
Phloem samples from the C, M, and P groups collected on the 7th, 18th, and 31st days underwent transcriptome sequencing, yielding 191.43 Gb of clean data. The distribution of read proportions from the library is summarized in Table 1. The effective data volume for each sample ranged from 6.06 Gb, with Q30 base distributions between 91.14% and 92.84% (Q30 > 80%), indicating compliance with quality control standards. The average GC content was between 43.68% and 44.11%. Clean reads were aligned with reference genome data using HISAT2, achieving a match rate of 83.42% to 86.64%, confirming the accuracy and reliability of the sequencing results (Table 2).
3.2 Numerical Analysis of Differentially Expressed Genes (DEGs)
Principal Component Analysis (PCA) revealed that samples at the same developmental stage were generally distinct from one another, with the exception of the C-31 and M-31 groups, which were more similar in their expression profiles. High similarity in gene expression was observed within samples (three replicates), indicating uniformity and consistency among samples in the same group (Fig. 1a).
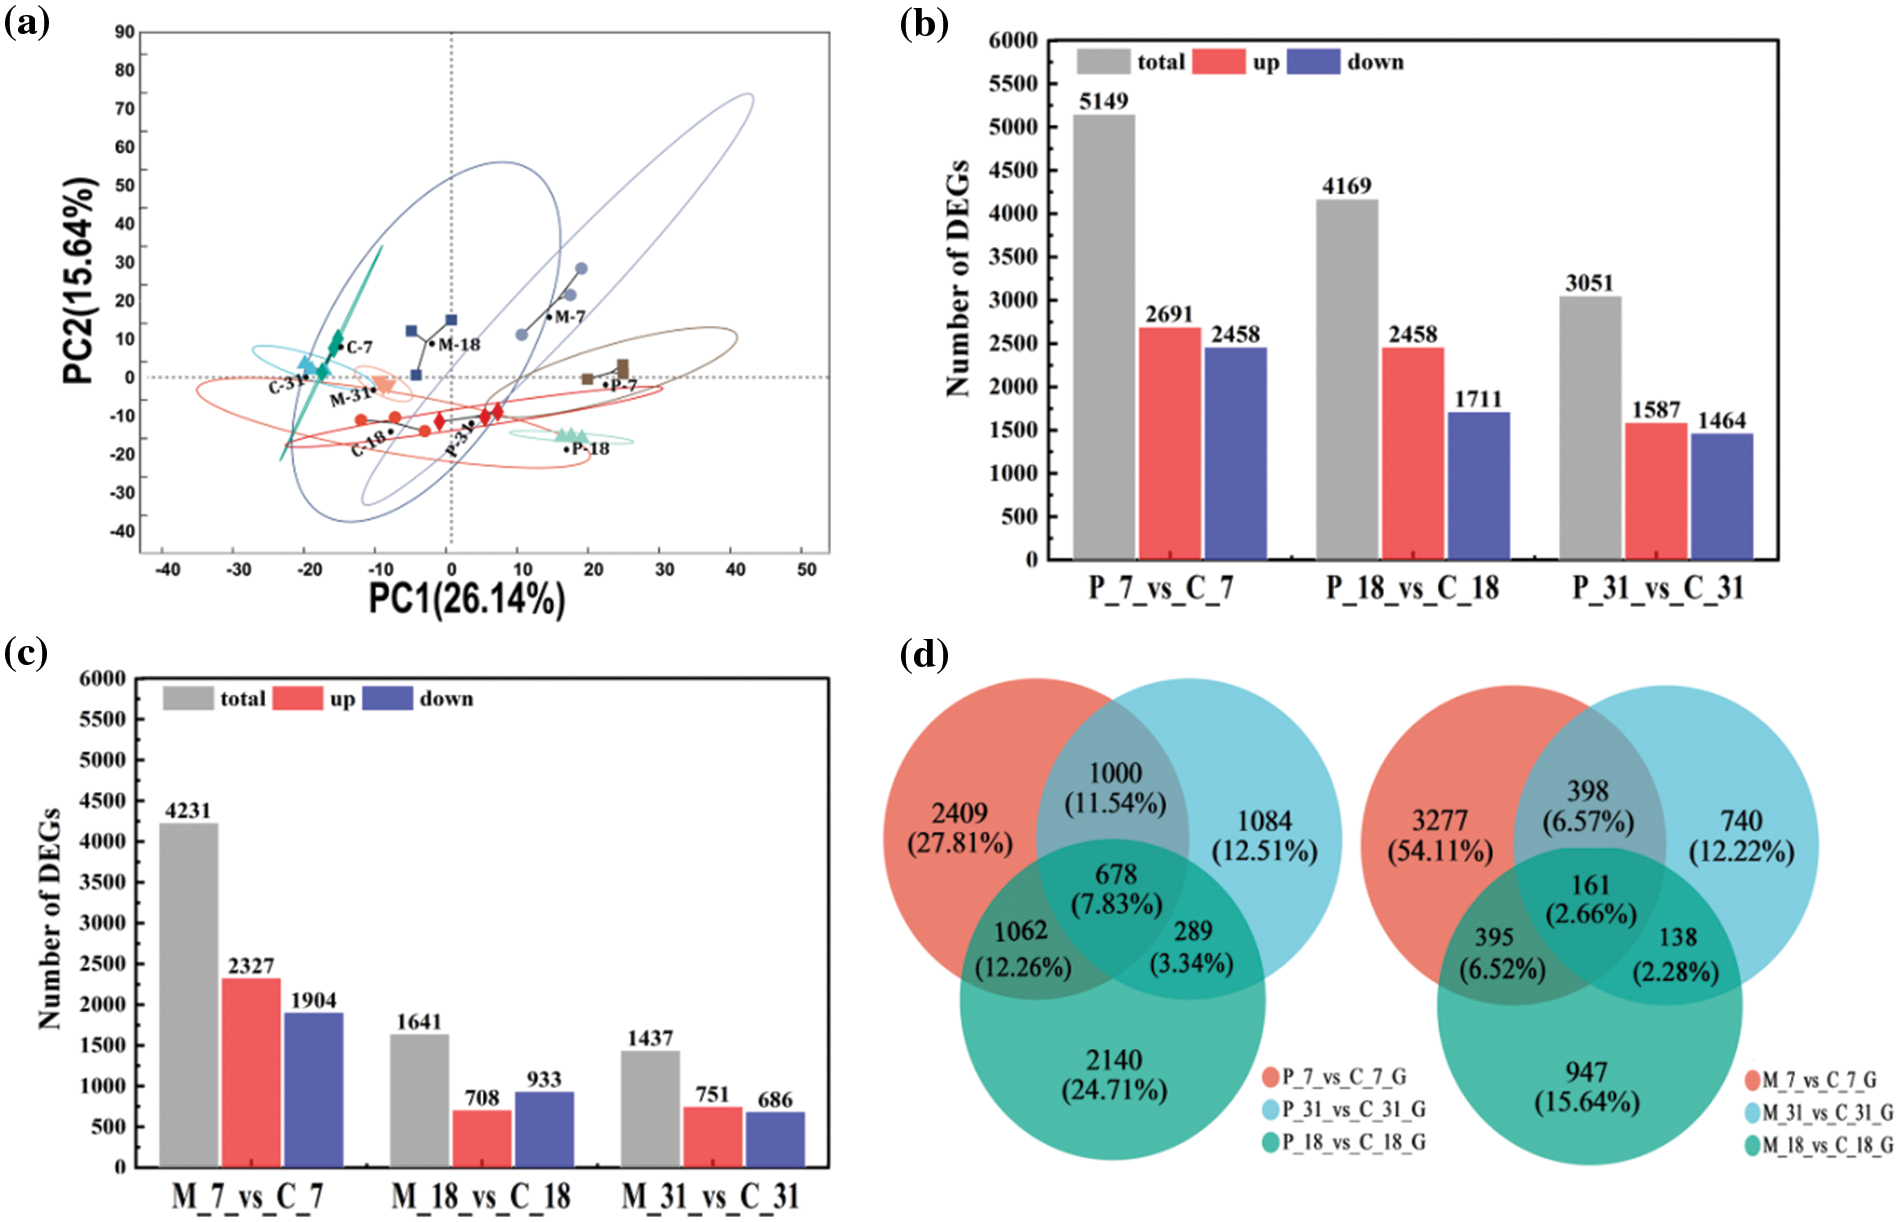
Figure 1: Analysis of differentially expressed genes (DEGs) in response to insect infestation and mechanical damage. (a) Principal component analysis of the sequenced samples. (b and c) Numbers of significantly regulated genes at different days after ALB infestation or mechanical damage. (d) Venn diagram analysis of significantly regulated genes after ALB infestation or mechanical damage for different days
When comparing the gene expression data from the three treatments against their respective controls (Fig. 1b), significant differences were noted (p-value < 0.05 and |log2(fold change)| > 2). Specifically, between P-7 and C-7, a total of 5149 differentially expressed genes (DEGs) were identified, with 2691 genes up-regulated and 2458 down-regulated. Similarly, between P-18 and C-18, 4169 DEGs were detected, comprising 2458 up-regulated and 1711 down-regulated genes. The fewest DEGs were found between P-31 and C-31, totaling 3051, with 1587 up-regulated and 1464 down-regulated genes.
Our analysis indicated that the mechanical damage treatment led to fewer DEGs compared to the ALB infestation treatment. The total number of DEGs in response to mechanical damage was 4231, 1641, and 1437 for the three respective sampling dates. Notably, the DEGs detected between P-18 and C-18 and between P-31 and C-31 were 2.54 and 2.12 times greater, respectively, than those between M-18 and C-18 and M-31 and C-31 (Fig. 1c). This suggests a stronger gene response to insect infestation than to mechanical damage, particularly in early stages of ALB feeding, with a decline in DEGs over time. Except for the M-18 vs. C-18 comparison, where down-regulated DEGs outnumbered up-regulated ones, in other comparisons, up-regulated DEGs predominated. Thus, the primary response of the phloem in PdS to ALB feeding across different periods involved up-regulation of genes.
A total of 678 DEGs were involved in the response of PdS to three stages of pest infestation (Fig. 1d), with the largest number of DEGs between P-7 and C-7 and between P-18 and C-18 groups. A total of 161 DEGs were involved in the response of PdS to three stages of mechanical damage, with the largest number of DEGs shared between M-7 and C-7 and between M-31 and C-31 treatments.
Overall, the mechanism for the PdS response to pest infestation was different to that of mechanical damage and it’s more responsive to insect infestation than to mechanical damage.
3.3 KEGG Functional Enrichment Analysis of Differential Expressed Genes (DEGs)
To explore the pathways significantly linked to insect infestation, we performed functional annotation of the DEGs through KEGG analysis. These genes were categorized into various biological processes, including Metabolism, Environmental Information Processing, Organismal Systems, Human Diseases, Cellular Processes, and Genetic Information Processing (Fig. 2). Metabolism emerged as the largest category, with the top three significant pathways being carbohydrate metabolism, secondary metabolism biosynthesis, and amino acid metabolism across all groups. Notably, a substantial number of DEGs related to the translation pathway were enriched in the P-7 vs. C-7 group following ALB stimulation (Fig. 2a).
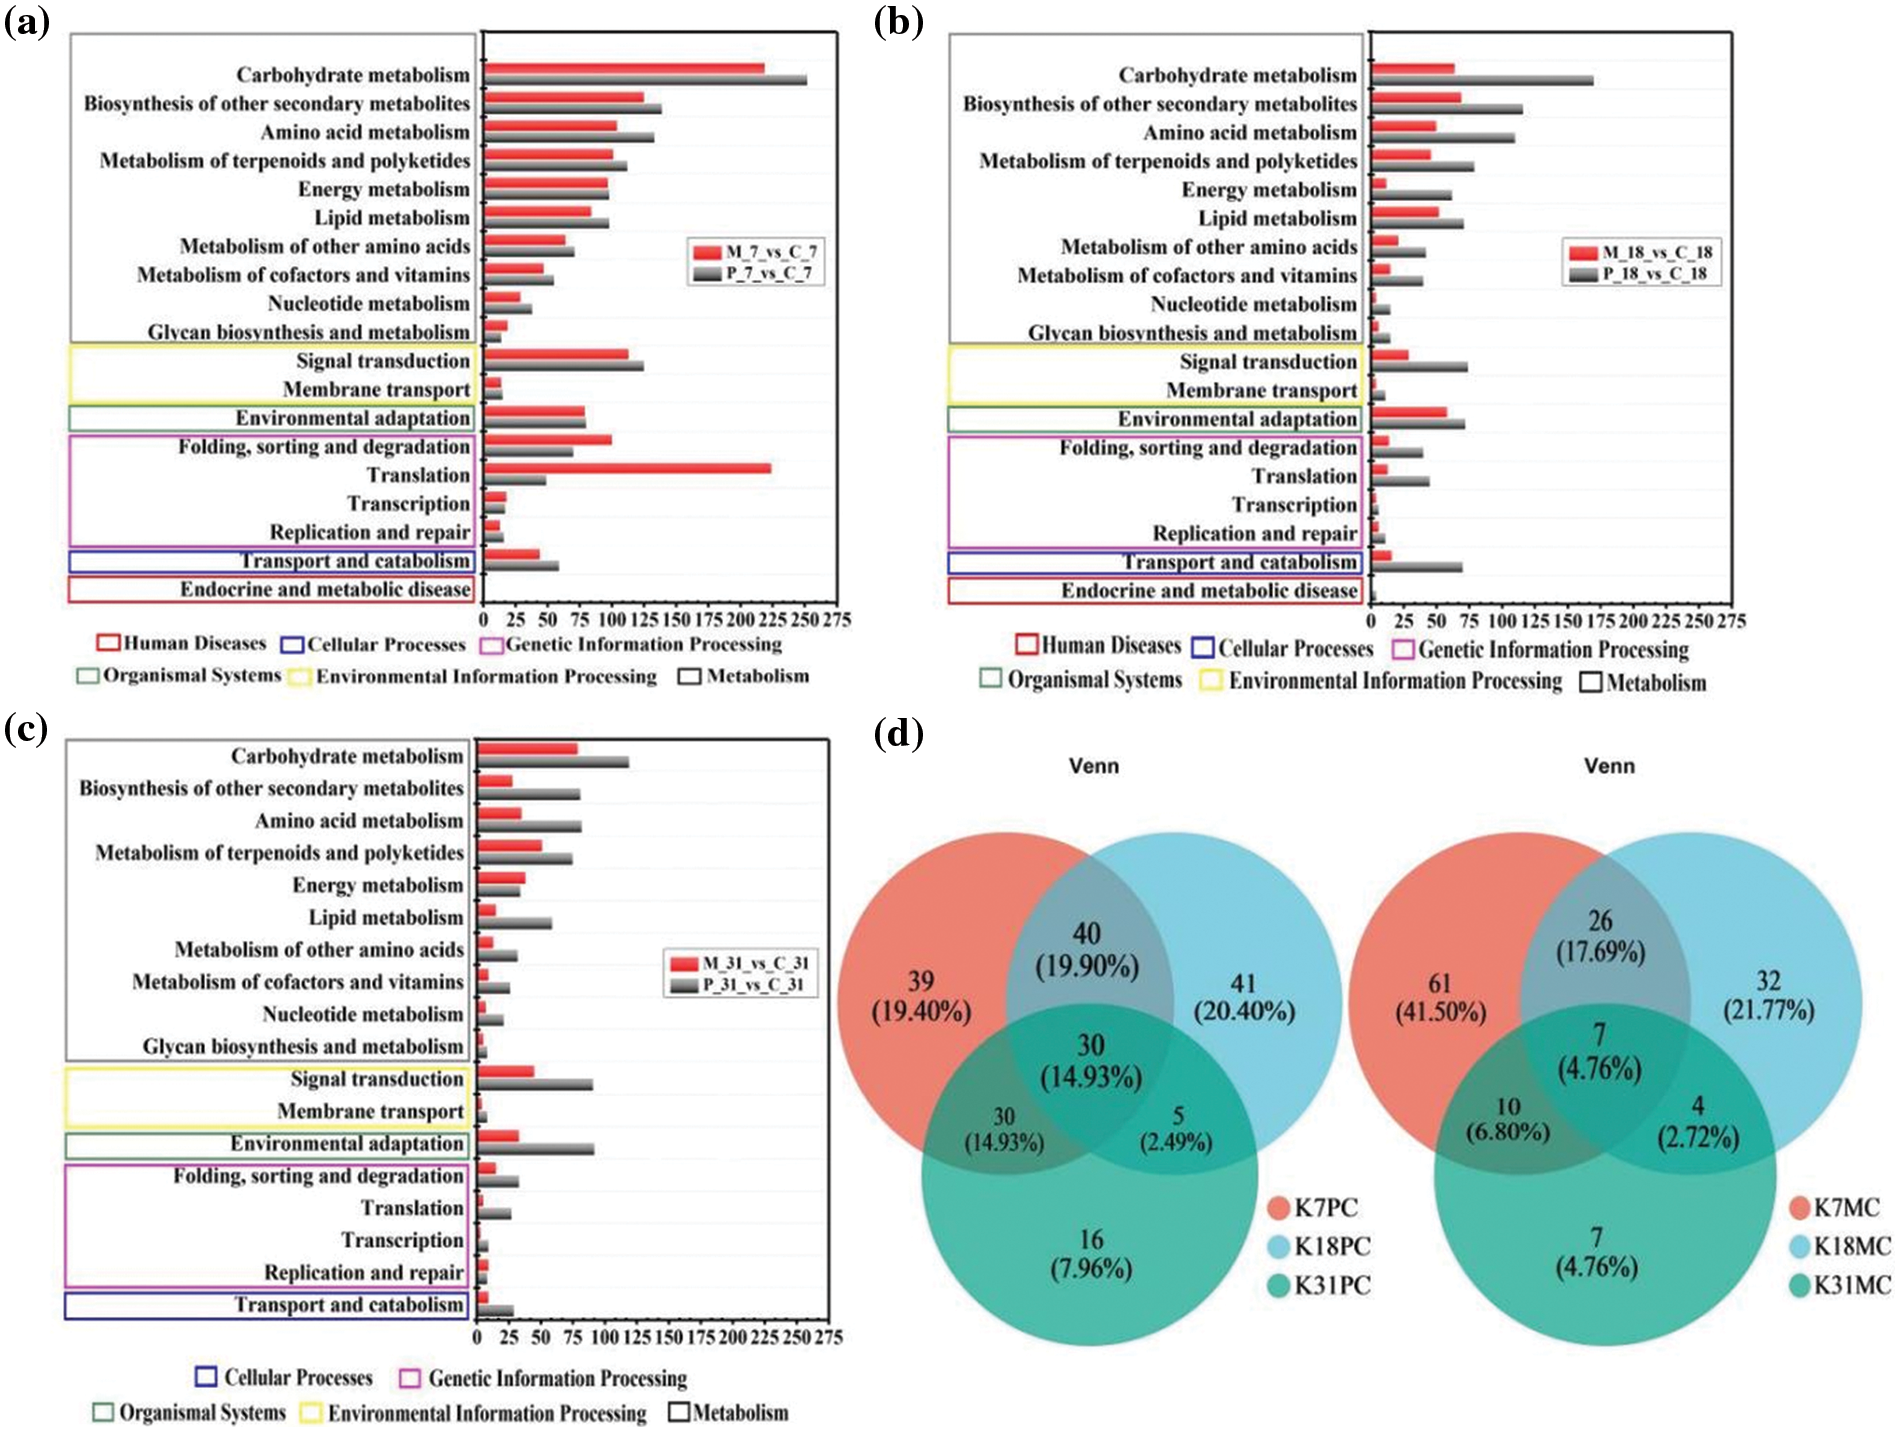
Figure 2: Differentially expression gene (DEGs) analysis in P. deltoides cl. ‘shalinyang’. (a) Between P-7 and C-7. (b) Between P-18 and C-18. (c) Between P-31 and C-31. The x axis represents the number of significantly regulated genes involved in secondary metabolism under different days of insect infestation (P treatment) or mechanical damage (M treatment). (d) Venn diagram analysis of significantly regulated DEGs which invoved in secondary metabolic pathways after different days (7 d, 18 d and 31 d) of ALB infestation (P treatment) or mechanical damage (M treatment). K7PC, K18PC, K31PC stand for the number of DEGs in between P-7 and C-7, between P-18 and C-18 d and between P-31 and M-31, and K7MC, K18MC, K31MC stand for the number of DEGs in between M-7 and C-7, between M-18 and C-18 d and between M-31 and C-31
Throughout all pathways and sampling periods, the number of phloem DEGs in response to ALB infestation was significantly higher than that observed after mechanical damage. Specifically, at both the 18th and 31st days, the DEGs in response to pest infestation were consistently greater than those responding to mechanical damage across all pathways. KEGG enrichment analysis for the P-18 and C-18 DEGs highlighted that carbohydrate metabolism, secondary metabolism biosynthesis, and amino acid metabolism pathways were particularly associated with responses to both ALB infestation and mechanical damage (Fig. 2b). The results of KEGG enrichment analysis for P-31 and C-31 group of DEGs showed that carbohydrate metabolism, Signal trnasduction, and Environmrntal adaptation metabolism pathway were associated with the response to ALB infestation and mechanical damage (Fig. 2c). In conclusion, the phloem of PdS had different response mechanisms to mechanical damage, and the response of poplar to newly hatched ALB larval was the strongest.
Secondary metabolites as a crucial component of plant defense against insect pests, play a significant role in PdS defenses against infestation by ALB. Therefore, we identified the intersections between genes in the three periods that were enriched in secondary metabolic pathways after ALB infestation or mechanical damage, respectively. Fig. 2 shows that there were 30 common DEGs in the three periods after ALB stimulation; the largest number of DEGs specific genes were between P-18 and C-18 group with the number of DEG being similar between P-7 and C7 at 39; there were only 7 common DEGs in the three periods after mechanical damaged, with the largest number of DEGs specific genes being between M-7 and C-7 at 61(Fig. 2d). Therefore, the phloem of PdS has different levels of response to ALB infestation and mechanical damage, and the number of genes enriched in secondary metabolic pathways and responding to the former being much greater than in response to the latter.
3.4 Analysis of the KEGG Enrichment Pathway of Differentially Expressed Genes (DEGs)
To ascertain the functions of the 37 identified genes, we conducted a KEGG functional enrichment analysis. The differentially expressed genes (DEGs) related to the biosynthesis of secondary metabolites in response to ALB stimulation showed significant enrichment (p < 0.05) in various pathways, including isoquinoline alkaloid biosynthesis, tyrosine metabolism, phenylpropanoid biosynthesis, stilbenoid, diarylheptanoid, gingerol biosynthesis, and flavonoid biosynthesis (Fig. 3a). In contrast, only six DEGs were significantly enriched (p < 0.05) in response to mechanical damage, all related to the phenylpropanoid biosynthesis pathway (Fig. 3b).
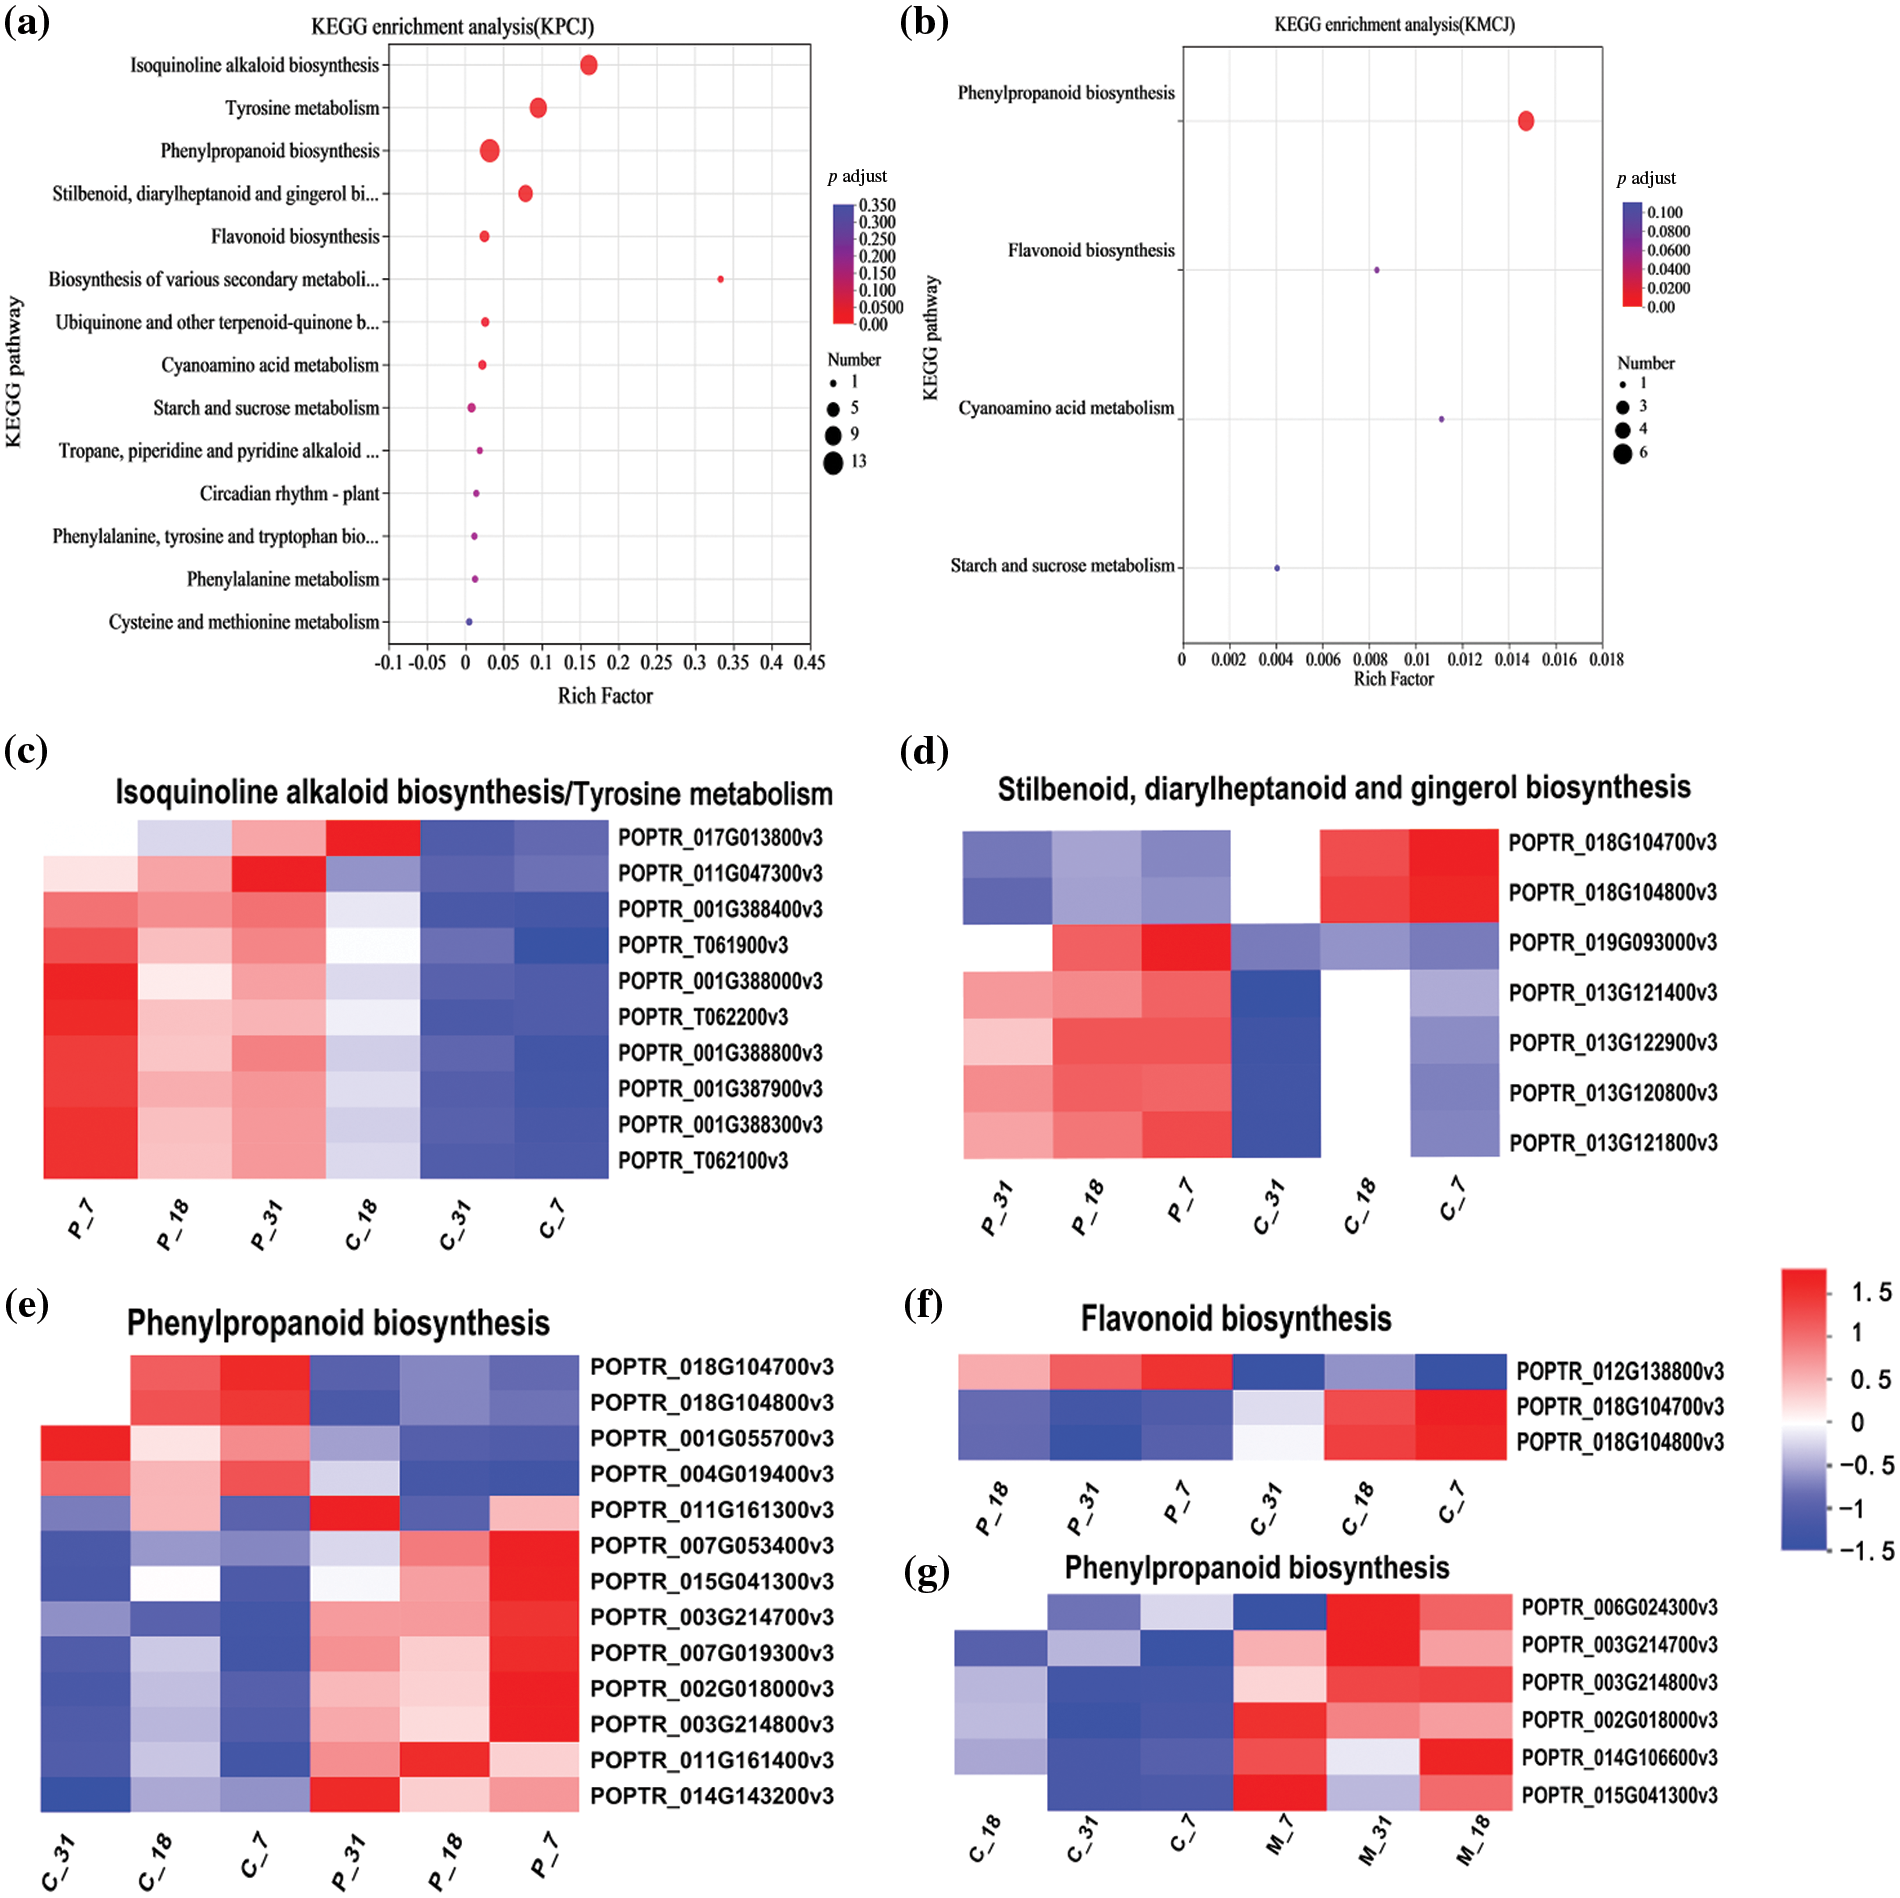
Figure 3: The analysis of differentially expressed genes (DEGs) in PdS following infestation by ALB and mechanical damage focused on the biosynthetic pathways of various secondary metabolites across three distinct phases. (a) A scatter plot illustrating the KEGG pathways in PdS after ALB infestation reveals the distribution of DEGs. (b) Another scatter plot displays the KEGG pathways enriched by DEGs in PdS following mechanical damage. In these plots, the “Rich factor” represents the ratio of the number of enriched genes in a specific pathway to the total number of annotated genes or transcripts in the background. A larger Rich factor indicates a higher level of enrichment. The size of the dots corresponds to the number of genes within each pathway, while the color indicates different ranges of significance. The results shown are limited to the top 20 pathways with an adjusted p-value (p adjust) of less than 0.05. (c–g) A heatmap illustrates gene expression levels, where each column corresponds to a sample and each row to a gene. The color gradient indicates standardized expression values: red indicates higher expression levels, while blue indicates lower expression levels
When comparing the P and C groups, ten DEGs were identified that were enriched in the isoquinoline alkaloid biosynthesis and tyrosine metabolism pathways. Notably, the gene POPTR-017G013800v3 was up-regulated on the 7th and 31st days but down-regulated on the 18th day (Fig. 3c). Additionally, 13 enriched genes were linked to phenylpropanoid biosynthesis; apart from POPTR-011G0161300v3, which exhibited an up-regulation on the 7th and 31st days and a down-regulation on the 18th day, eight of the 13 genes were consistently up-regulated, while four were down-regulated across the three time points (Fig. 3d). 7 enriched genes were involved in the stilbenoid, diarylheptanoid and gingerol biosynthesis pathway, of which 5 genes were up-regulated and 2 genes were down-regulated (Fig. 3e). 3 enriched genes were involved in the flavonoid biosynthesis pathway (Fig. 3f), of which gene POPTR-012G138800v3 was up-regulated and the other 2 genes were down-regulated on all dates after infestation by insects. There were 6 genes involved in the phenylpropanoid biosynthesis pathway (Fig. 3g), of which 5 genes were up-regulated on three dates and POPTR-006G024300v3 was up-regulated on the 18th day and 31st day and down-regulated on the 7th day after mechanical damage.
Furthermore, the 10 up-regulated genes were verified by real-time PCR, and the results showed that the trend of POPTR-T061900v3, POPTR-001G388000v3, POPTR-013G121400v3, POPTR-013G122900v3, POPTR-013G121800v3 and POPTR-013G120800v3 in expression levels was consistent with that of transcriptome expression levels (Fig. 4a–c). Overall, these genes were involved in regulation of defense by PdS against ALB and response to mechanical damage at all three stages.
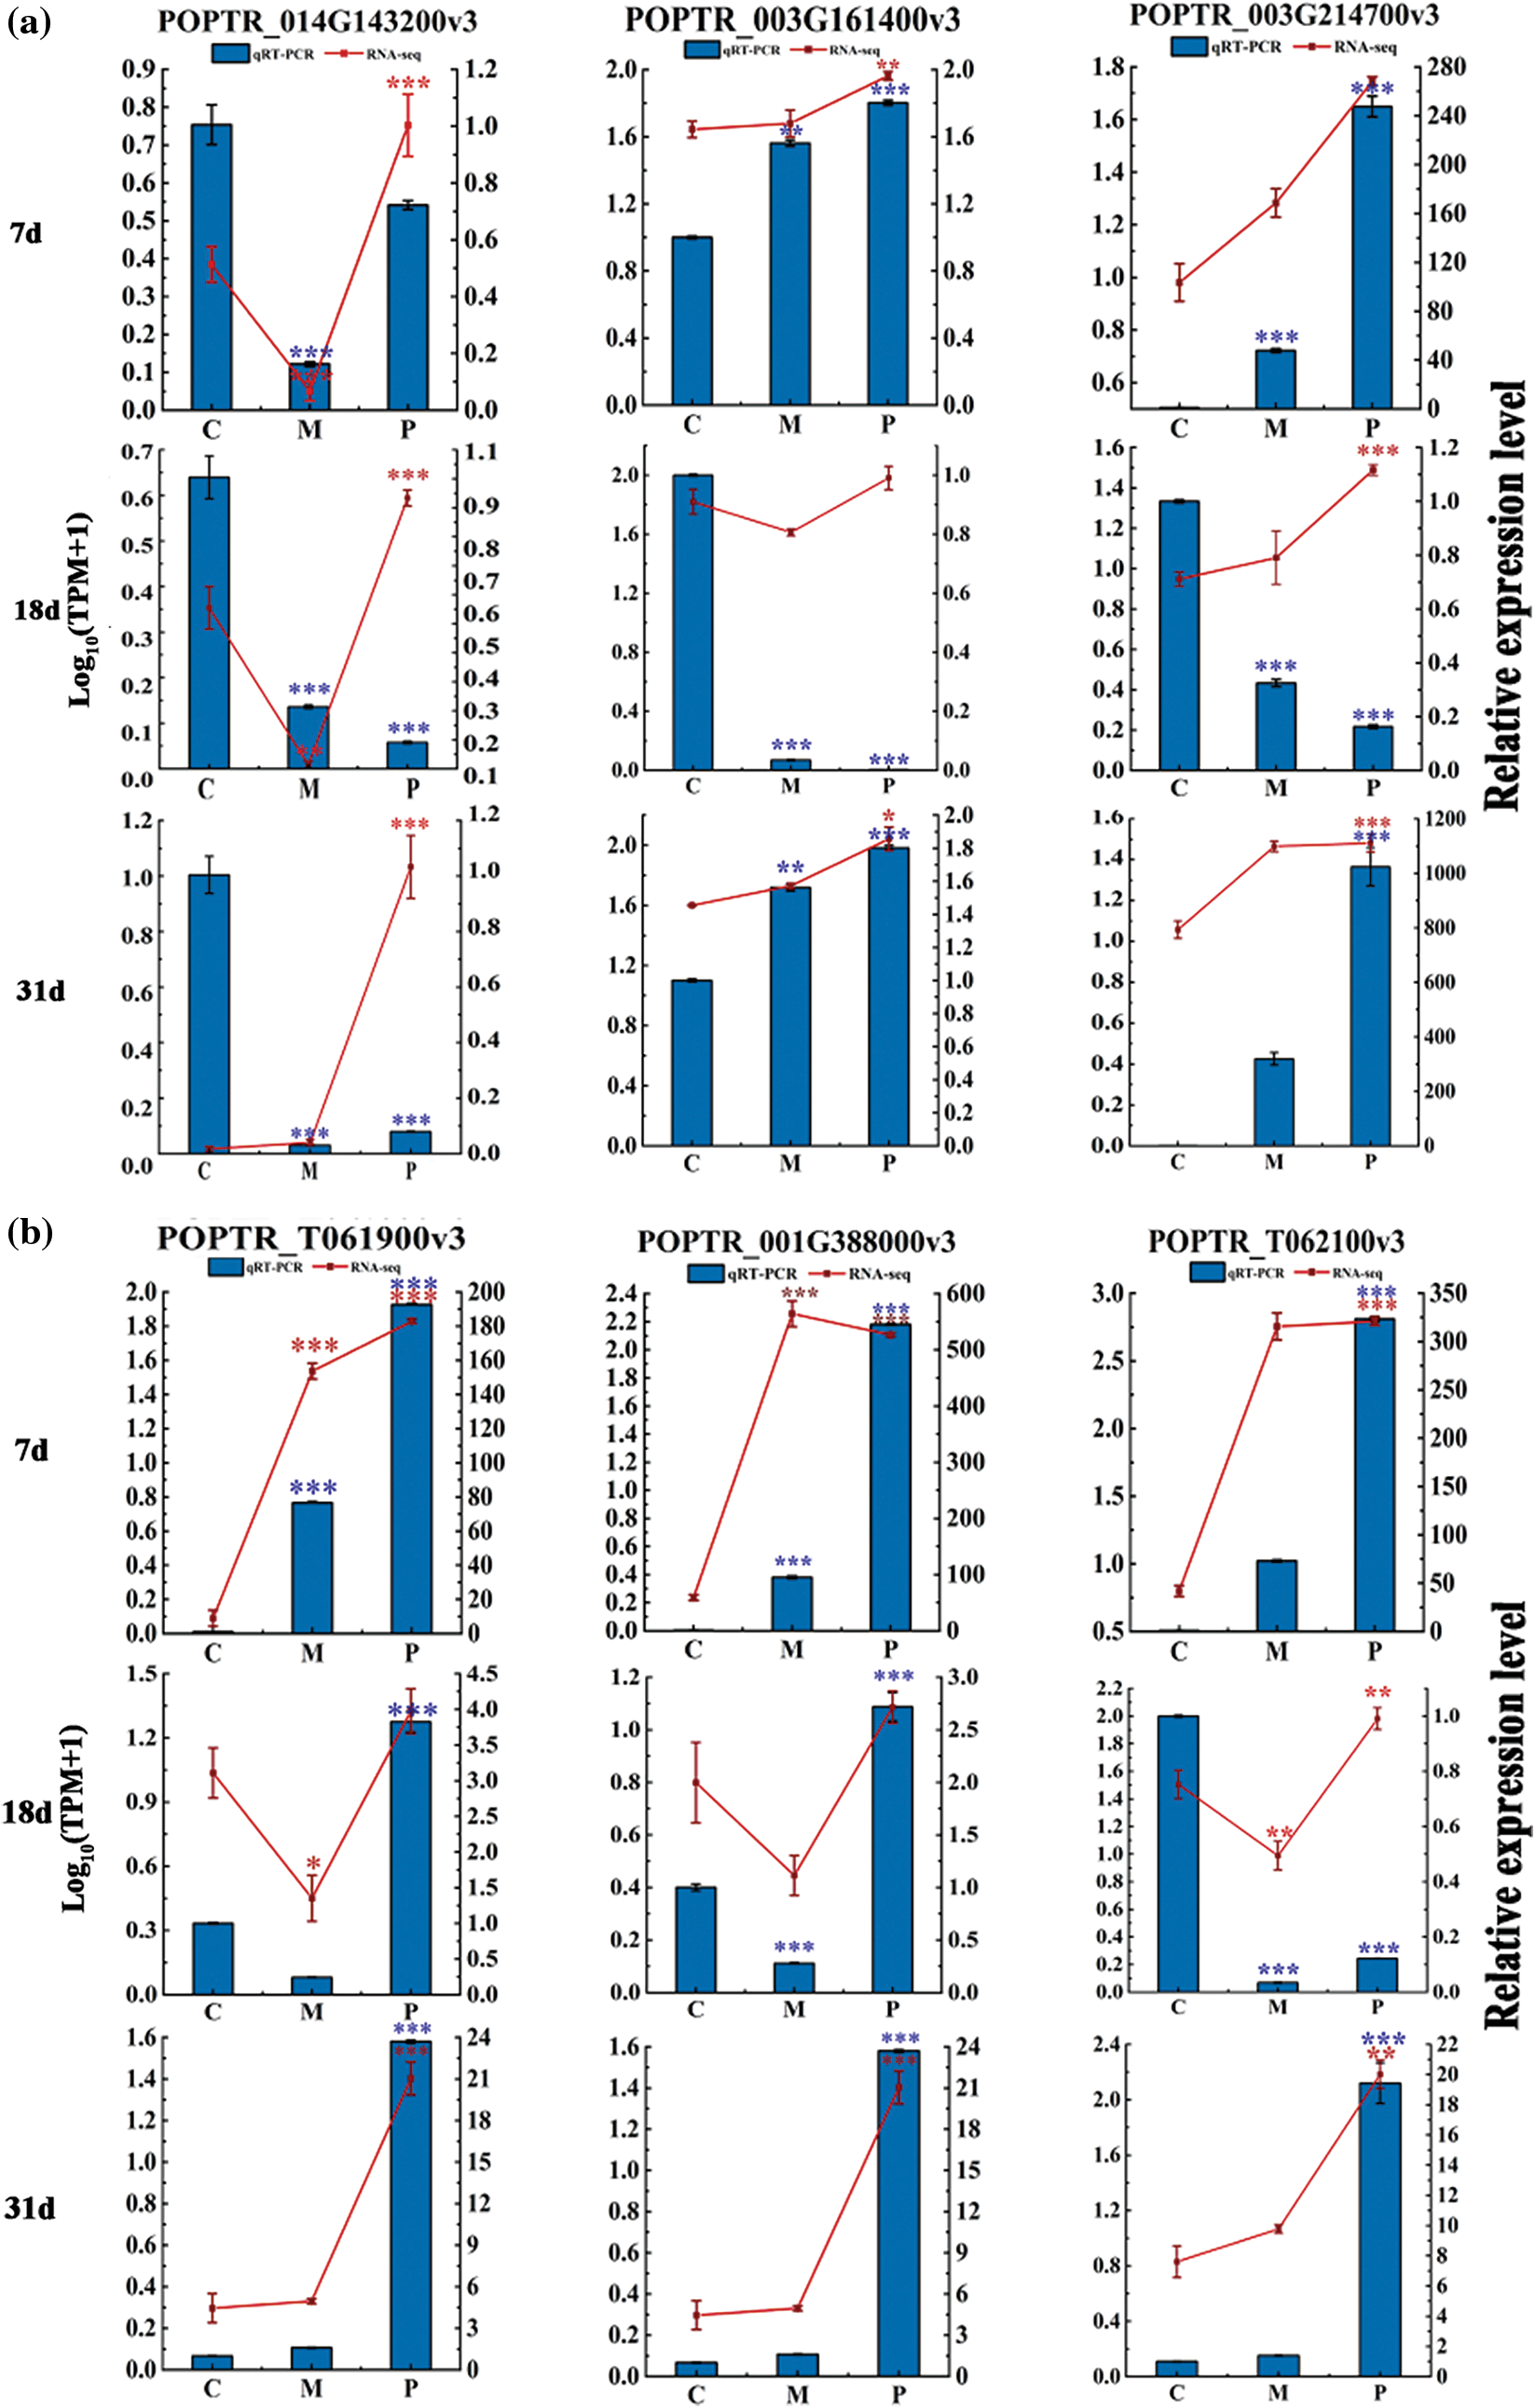
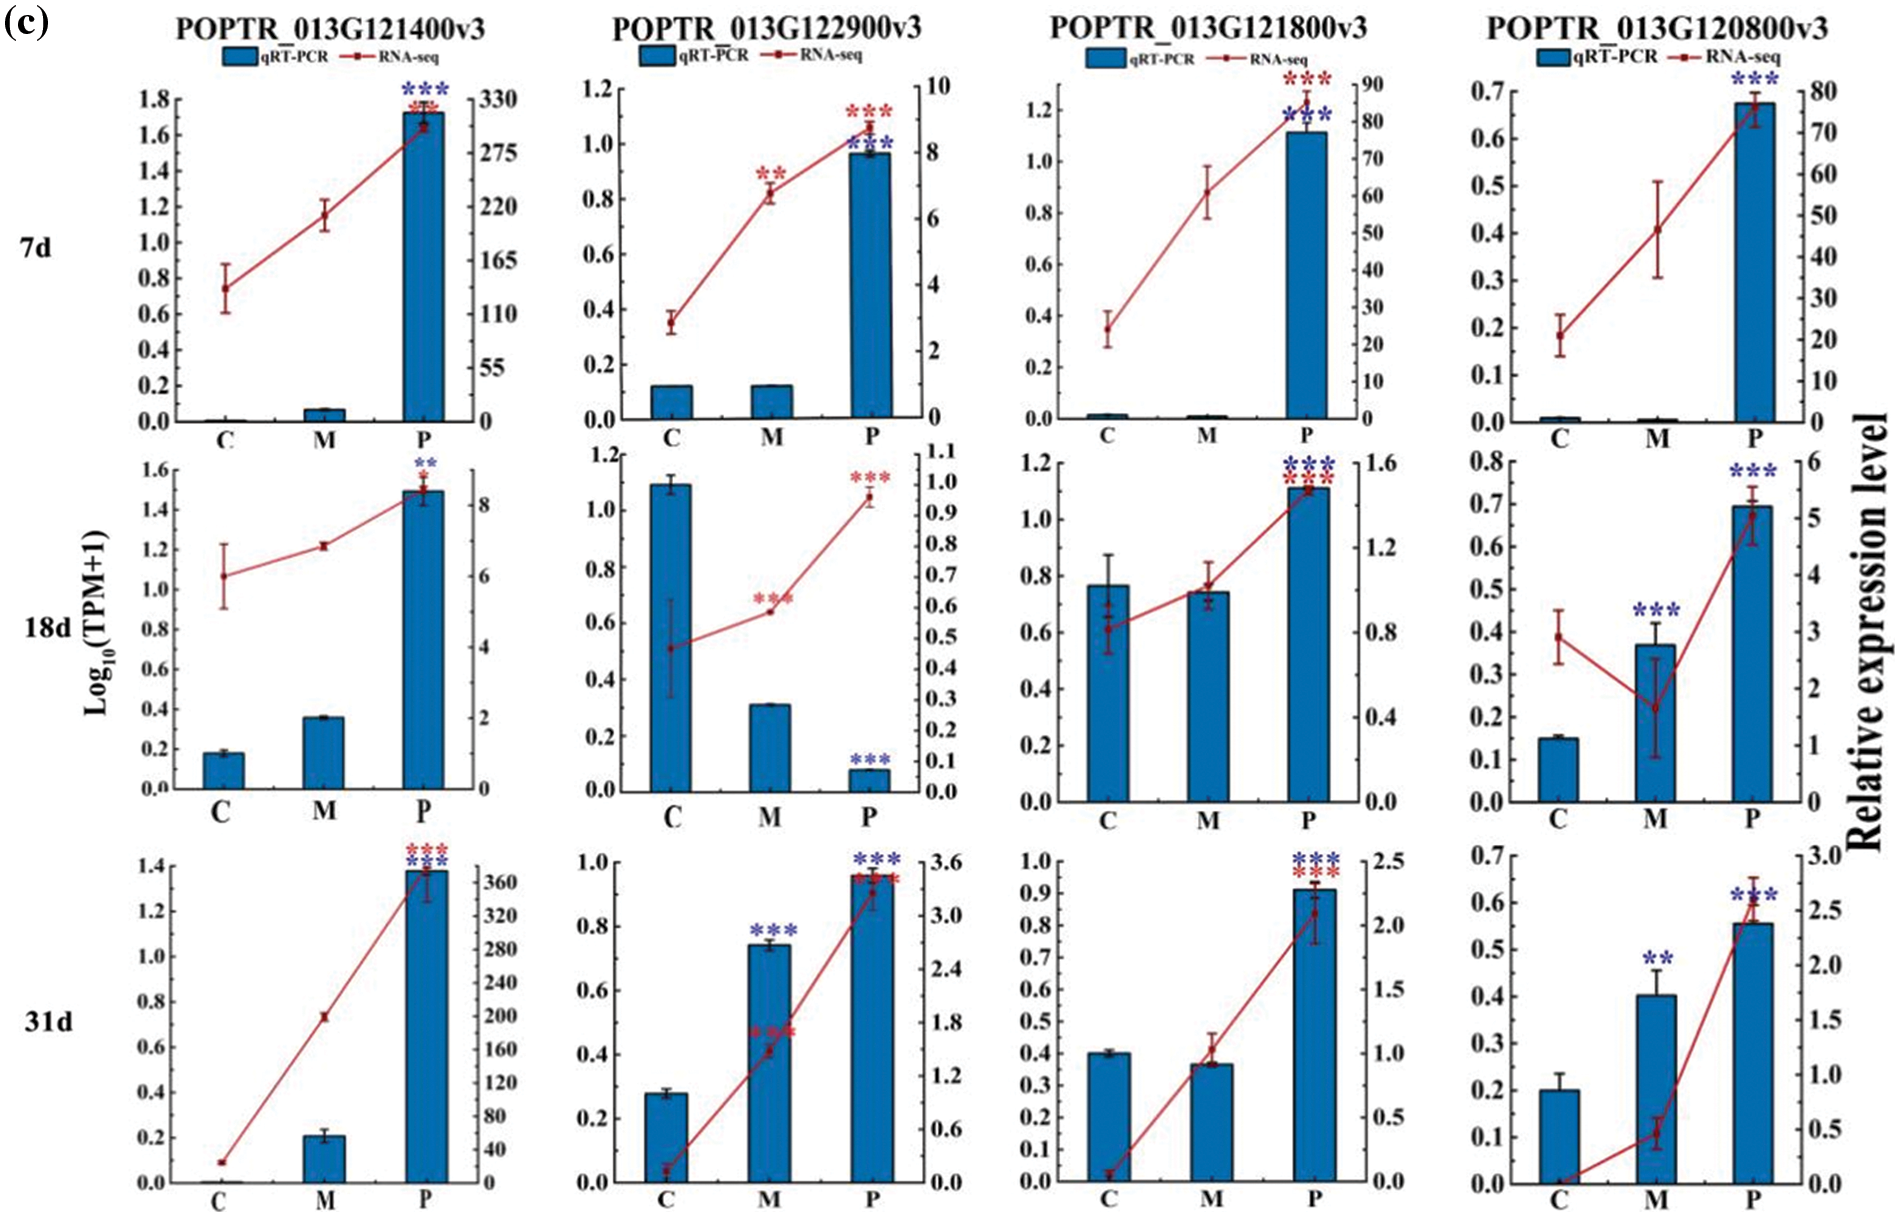
Figure 4: The expression level of ten up-regulated genes. (a) Phenylpropanoid biosynthesis pathway. (c) Isoquinoline alkaloid biosynthesis pathway. (b) Biosynthesis pathways of stilbenoid, diarylheptanoid and gingerol. Error bars represent means ± SE (n = 3), t-test: *p < 0.05, **p < 0.01 and ***p < 0.001
3.5 Analysis of Differentially Accumulated Metabolites (DAMs) Related to the PdS Response to ALB Infestation
Based on transcriptome analysis, we know the poplar is the most responsive to newly hatched larval, in this shtage, the number of DEGs in between P-18 and C-18 were significantly more than in between M-18 and C-18. Therefore, to determine the main metabolic pathways of phloem in response to the initial hatching of ALB larvae, based on further metabolome analysis of the phloem on the 18th day, the correlation and gene expression differences of phloem samples from three groups were analyzed (Fig. 5a). The results showed that the correlation between phloem samples of three groups was low, ranging from 0.87 to 0.88, while the correlation between biological replicates was relatively high, all of which were higher than 0.99. Principal component analysis (PCA) of DAMs demonstrated that component 1 with contribution of 53.3% could explain a distinct separation among treatments (Fig. 5b). These results indicated that the experimental design that divided tested phloem into three groups (healthy, mechanical damage, infestation) and the number of repetitions were reasonable.
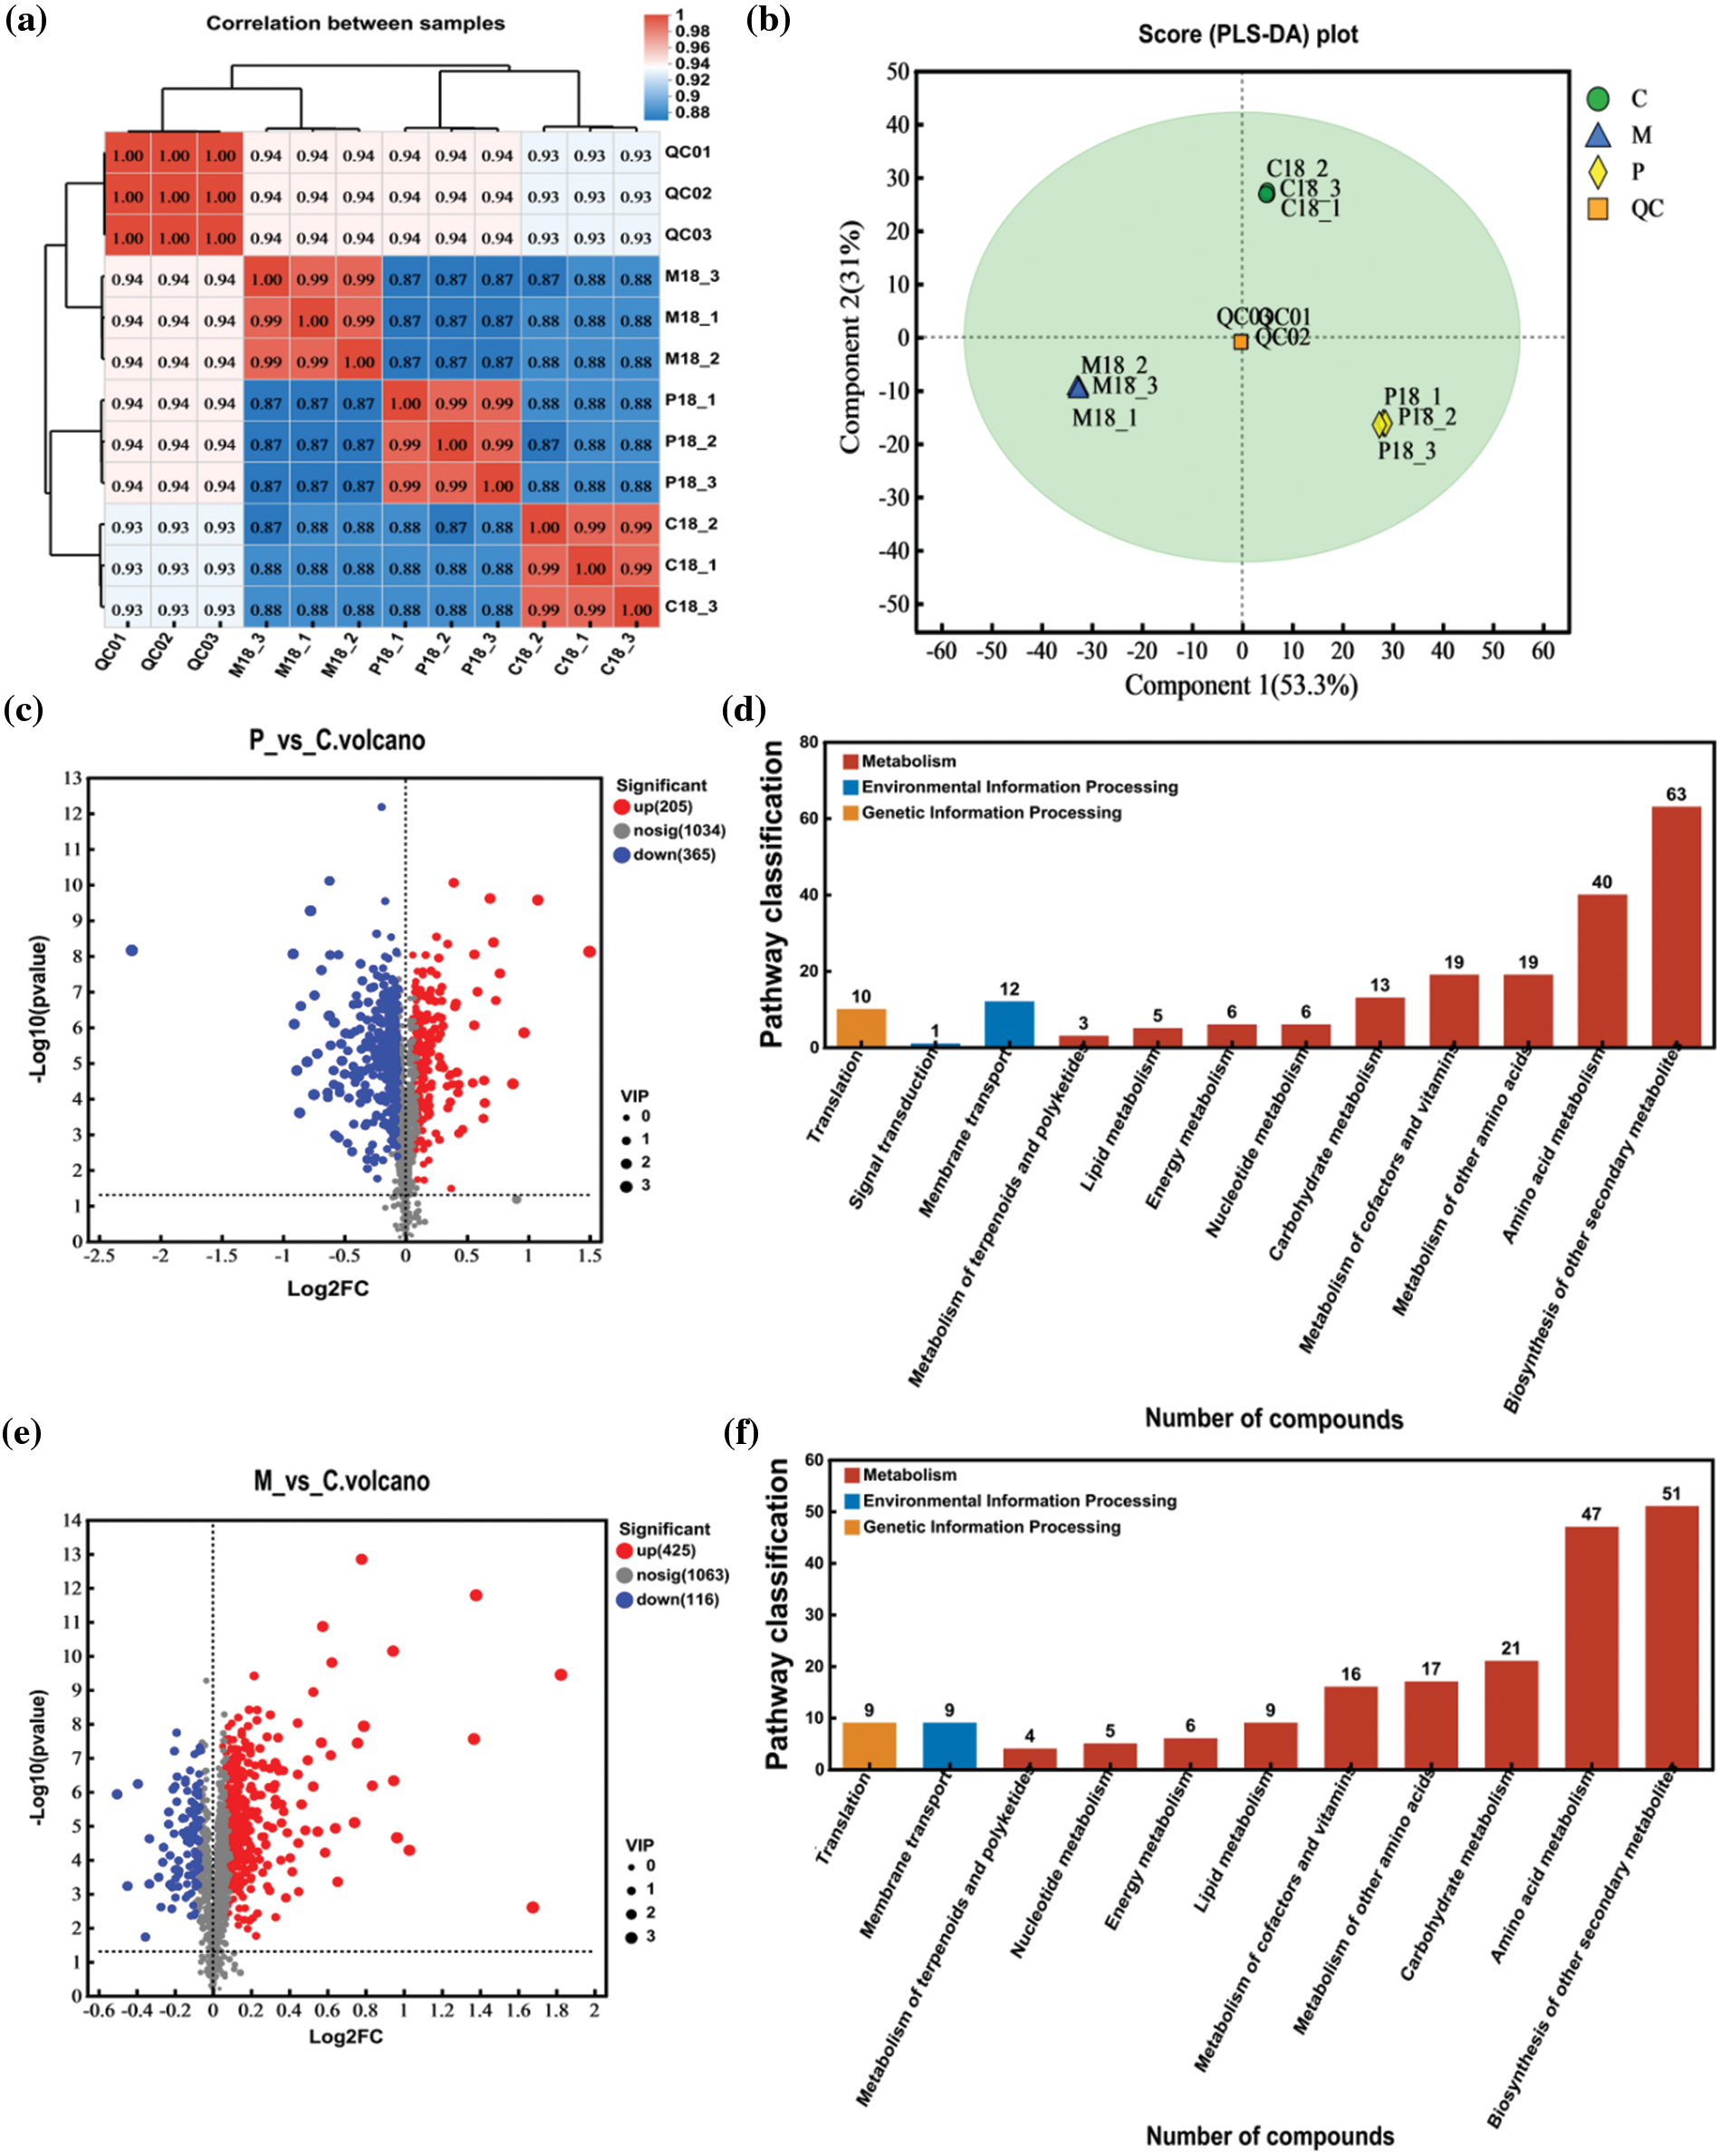
Figure 5: Regarding differential accumulation of metabolites (DAMs) and enrichment pathways. (a) A correlation heatmap depicts relationships among the DAMs. (b) Partial least squares discriminant analysis (PLS-DA) is presented to visualize sample differentiation. (c) and (e) Volcano plots for DAMs (C18_vs_P18; C18_vs_M18) are provided, with each dot representing a metabolite. The x-axis reflects the logarithm of the quantitative differences in metabolites between the two samples, while the y-axis shows the VIP (Variable Importance in Projection) value. Samples are color-coded and shaped based on cultivar and ALB infestation status: green dots indicate down-regulated DAMs, red dots indicate up-regulated DAMs, and gray dots represent metabolites detected without significant differential accumulation. (d) and (f) display the KEGG pathway classifications of DAMs in PdS after mechanical and control damage comparisons (P_18 vs C_18 and M_18 vs C_18)
Of the total number of DAMs, 205 were up-regulated and 365 were down-regulated, and there were 570 metabolites in the phloem of PdS in response to ALB infestation (Fig. 5c). After mechanical damage there were 425 up-regulated and 116 down-regulated DAMs and a total of 541 metabolites in the phloem (Fig. 5e). Most of these DAMs were found enriched in the secondary metabolite synthesis pathway, with 61 metabolites and 54 metabolites enriched in the pathway after treatment for ALB infestation and mechanical damage, respectively (Fig. 5d,f). In addition, the kinds of metabolites enriched in secondary metabolite synthesis in pest infestation group was much larger than that in mechanical damage group. In conclusion, phloem of PdS rsponese to stimulation mainly by regulating secondary metabolite synthesis pathways, and the number of DAMs after ALB infestation was more than that after mechanical damage.
3.6 Combined Transcriptome and Metabolome Analysis
To investigate the genes and metabolites of PdS involved in the induced resistance against newly hatched ALB larvae on the 18th day, we performed a co-joint KEGG pathway analysis of the translatome and metabolome. The analysis revealed that the same pathways for differentially abundant metabolites (DAMs) and DEGs were enriched for tyrosine metabolism, phenylpropanoid biosynthesis, and flavonoid biosynthesis when comparing the P_18 and C_18 groups (Fig. 6a) as well as the M_18 and C_18 groups (Fig. 6b), based on the overlap of metabolites and genes with a p-value < 0.05. However, there were 41 DAMs and 102 DEGs in plants involved in the response to newly hatching larvae, and 36 DAMs and 64 DEGs involved in mechanical damage.
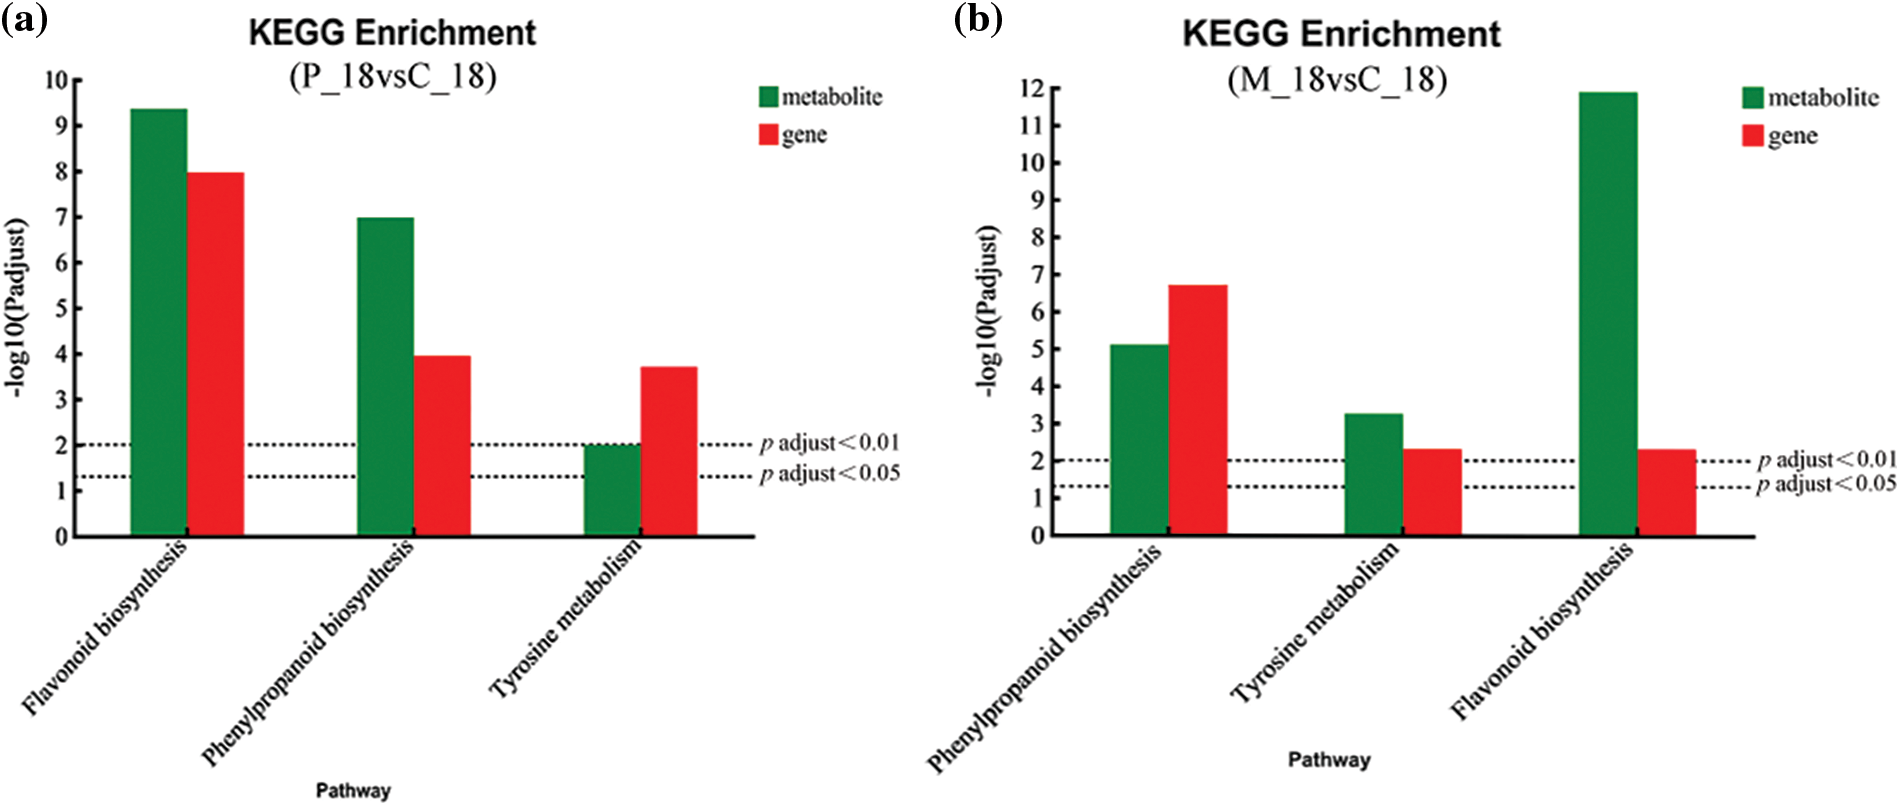
Figure 6: Differentially expressed genes (DEGs) and differentially accumulated metabolites (DAMs) were jointly analyzed. (a) Between the P_18 and _C_18 groups. (b) Between the M_18 and _C_18 groups (Note: The upper dotted line represents the selected genes and metabolic pathway at p < 0.05, and the lower dotted line represents the selected genes and metabolic pathway at p < 0.01)
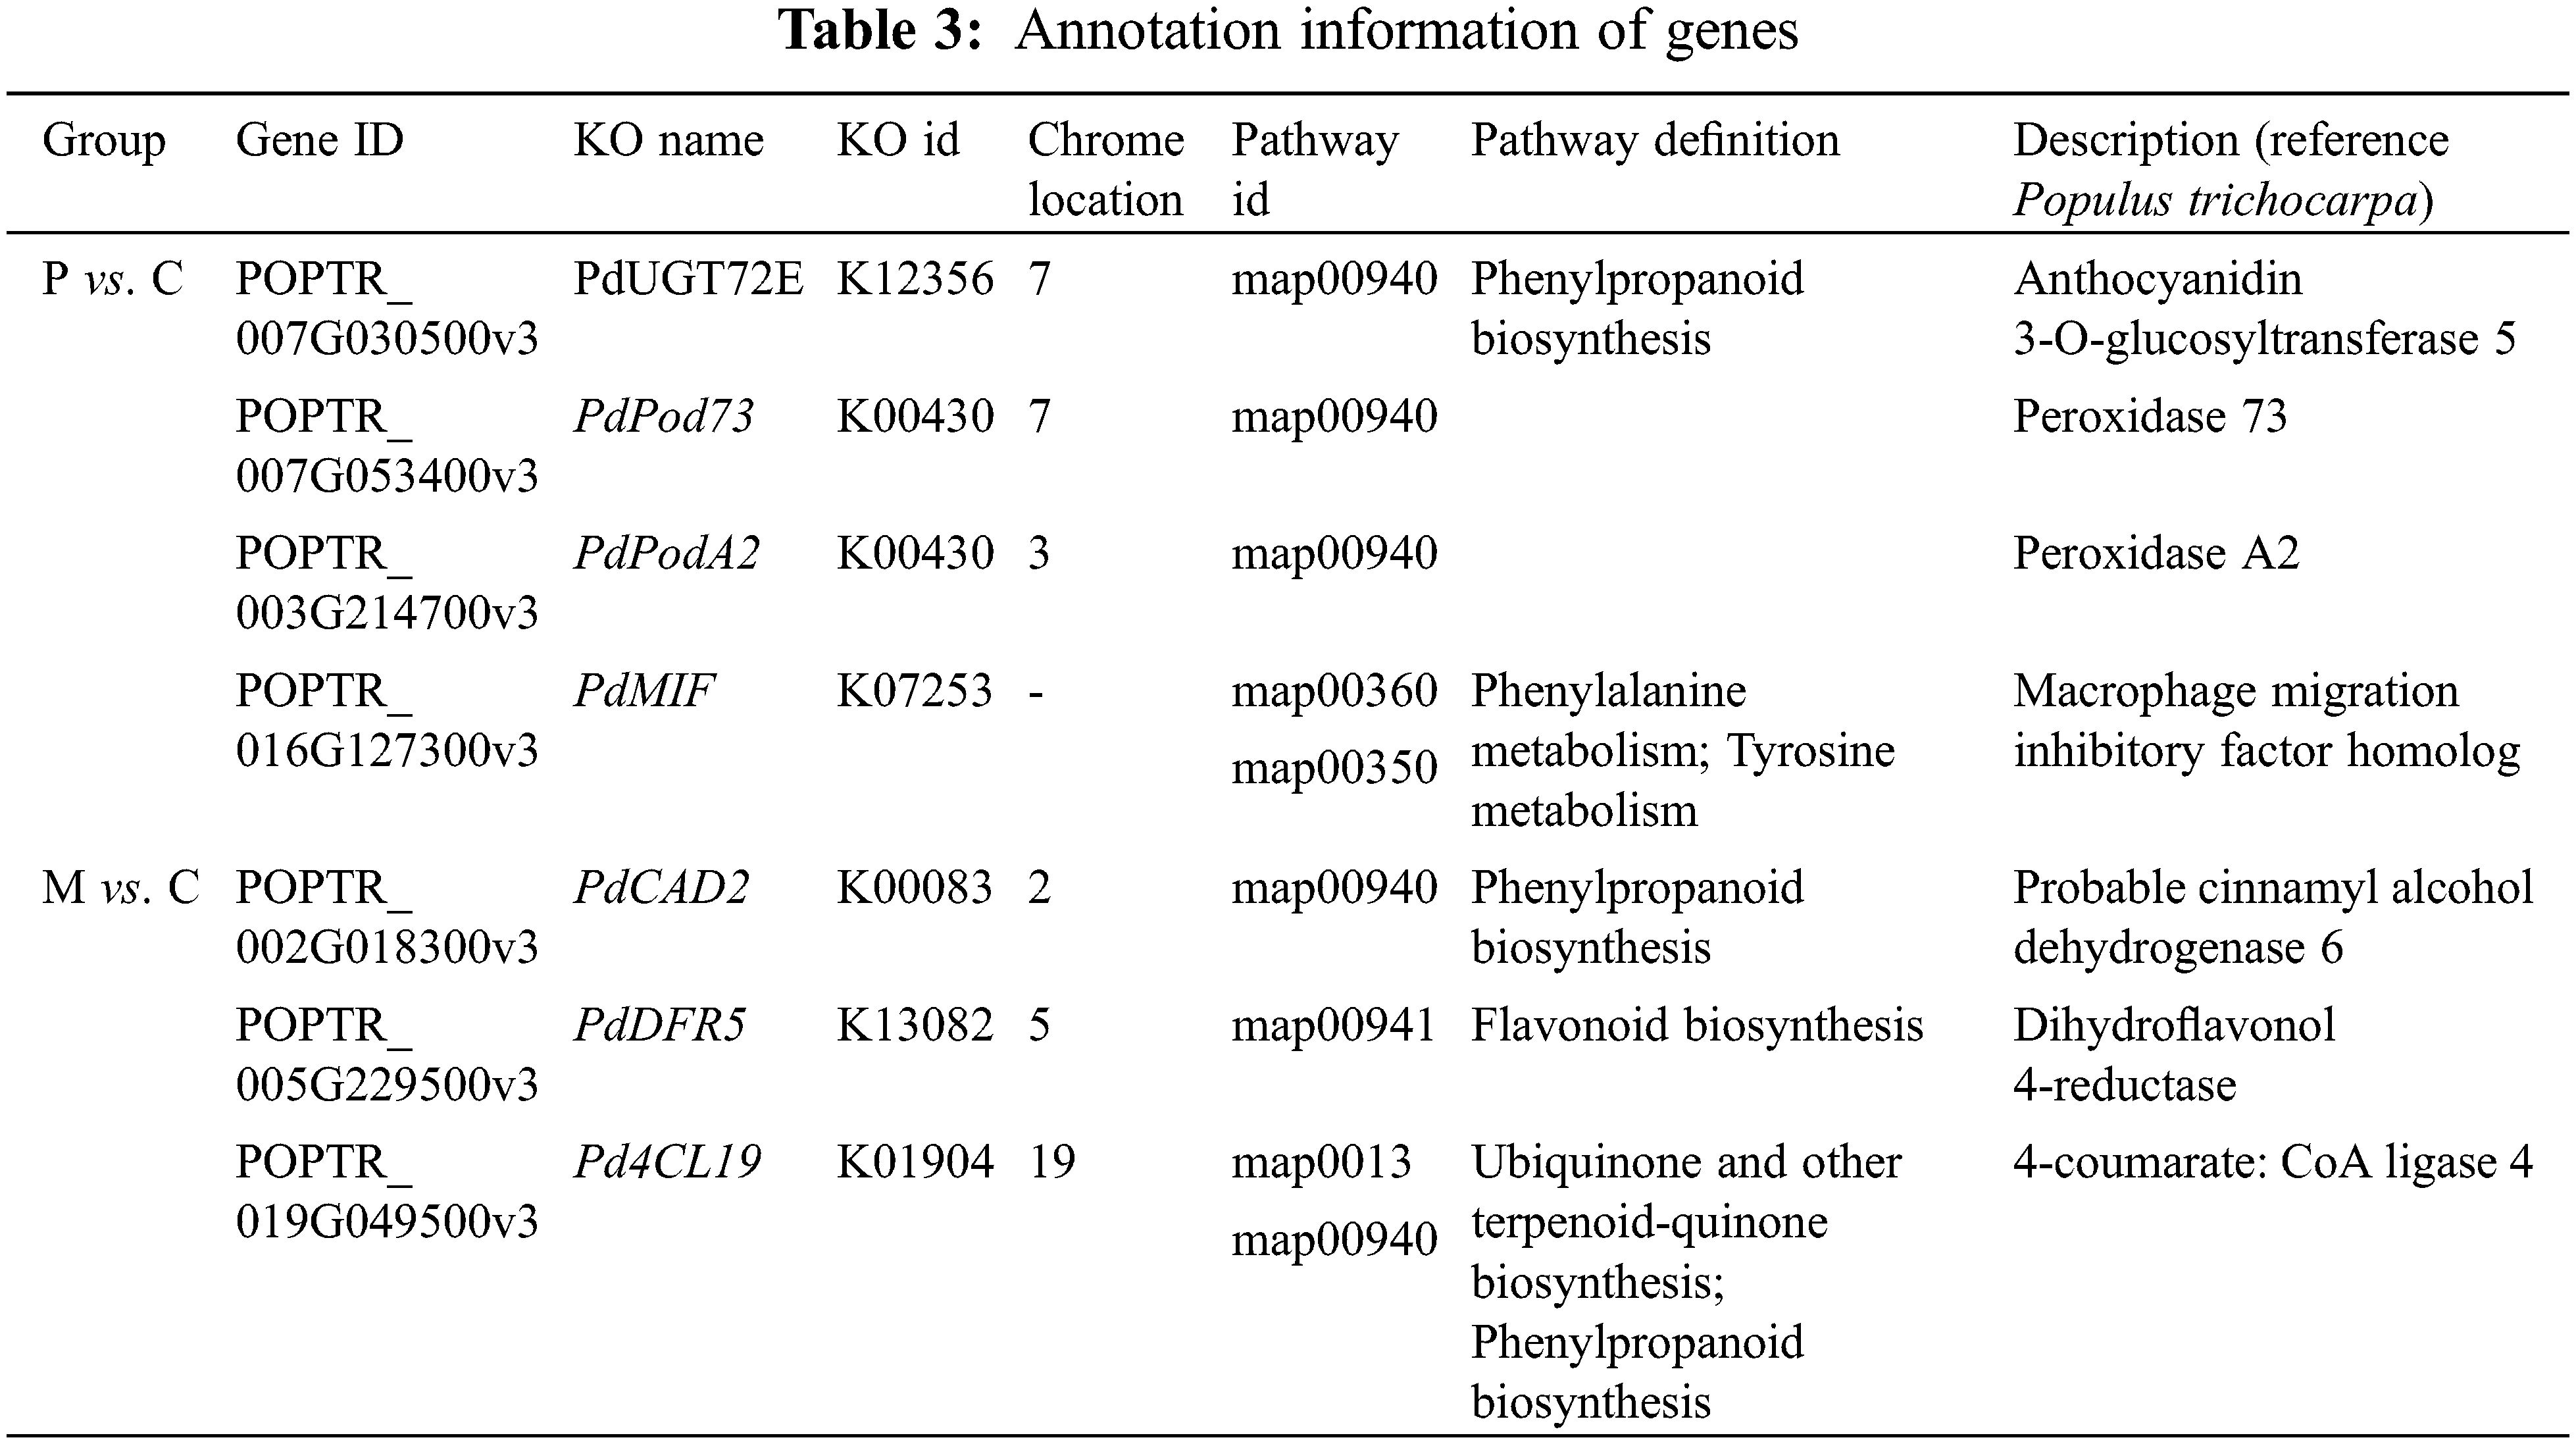
To further elucidate the relationship between genes and metabolites, we conducted a network correlation analysis of the DEGs and DAMs associated with these three pathways using the Pearson correlation algorithm. The top 200 relationship pairs were identified after applying the BH multiple test correction. Selected pairs with a p-value < 0.05 and an absolute correlation value greater than 0.9 are presented in Fig. 7. There were 15 DEGs and 40 DAMs in phloem of PdS responding to larval infestation. Among them, UGT72E (POPTR_ 007G030500v3), PdPod73 (POPTR_003G214700v3), PdPodA2 (POPTR_ 007G053400v3) and PdMIF (POPTR_ 016G127300v3) regulated the number of DAMs which were 39, 36, 34 and 30, respectively (Fig. 7a and Table 3). At this time, 14 DEGs and 36 DAMs in the phloem were mainly in response to mechanical damage, among them, Pd4CL (POPTR_019G049500v3), PdDFR (POPTR_005G229500v3) and PdCAD (POPTR_002G018300v3) regulated the number of DAMs which were 32, 35 and 36, respectively (Fig. 7b and Table 3). In conclusion, when newly hatcted larvaes infect phloem of the poplar, there are mainlly these genes to respond, including UGT72E, PdPod73, PdPodA2 and PdMIF, at this time, there are genes including Pd4CL, PdDFR and PdCAD in response to mechanical damage.
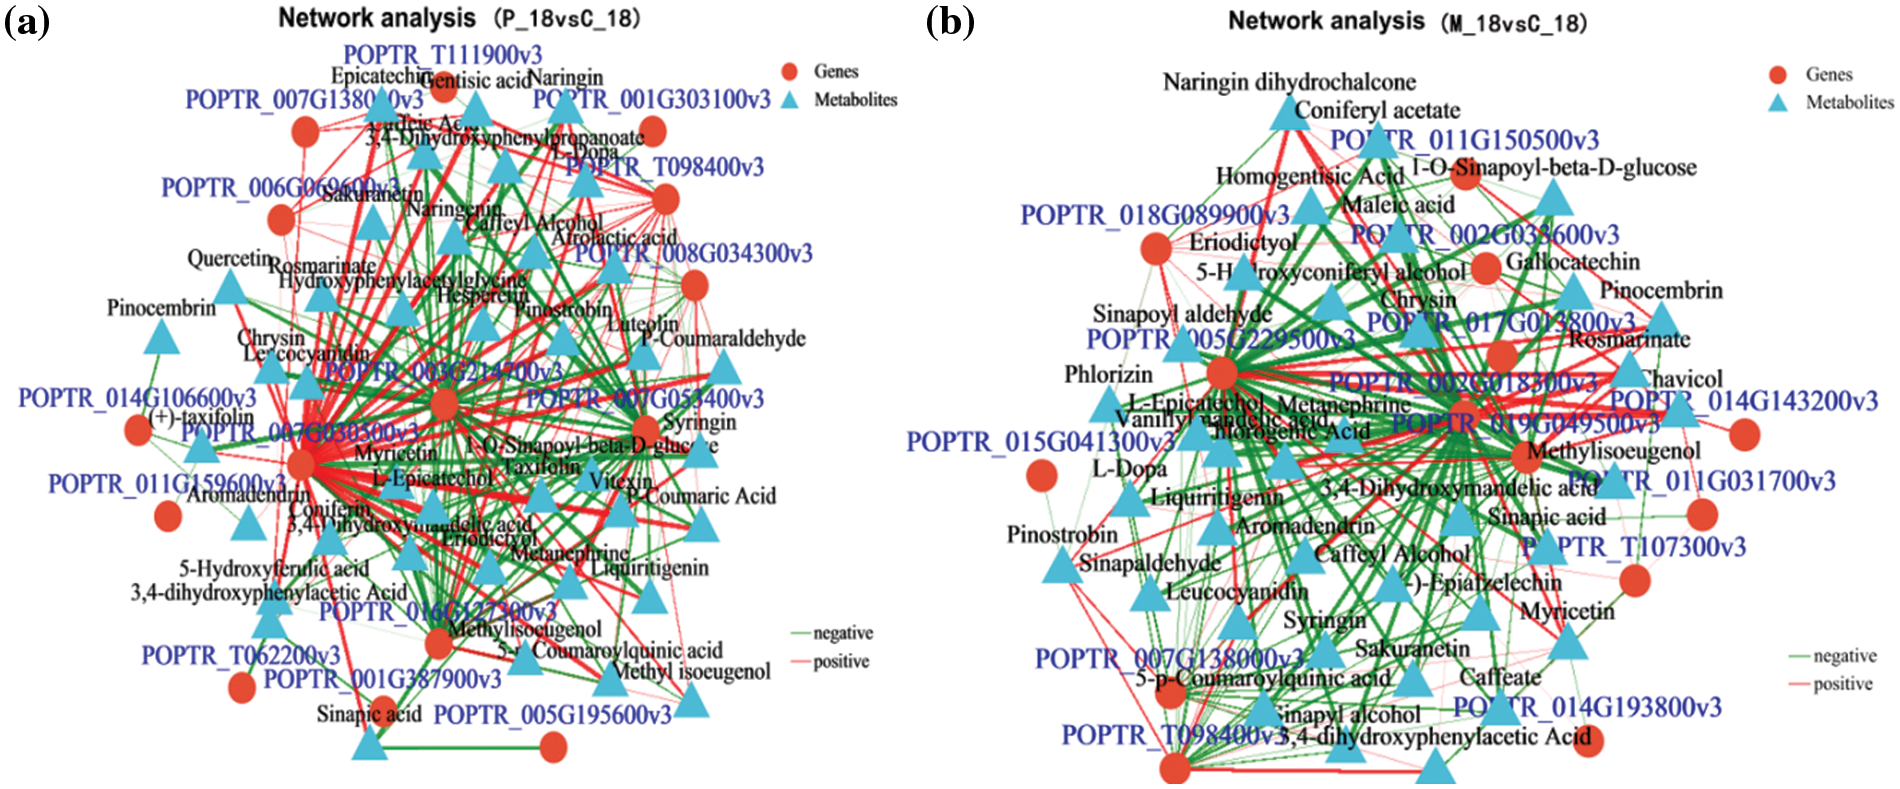
Figure 7: Correlation network. (a) shows correlations between the P_18 and C_18 groups. (b) illustrates correlations between the M_18 and C_18 groups. In these networks, triangles represent metabolites and red circles represent genes. Lines indicate correlation coefficients; red lines indicate positive correlations (corr > 0) and green lines indicate negative correlations (corr < 0). The thickness of the lines correlates with the absolute value of the correlation coefficient, with thicker lines signifying stronger correlations
After larval emergence, the expression levels of UGT72E (POPTR_007G030500v3) in PdS were down-regulated and PdPod73 (POPTR_007G053400v3), PdPodA3 (POPTR_003G214700v3) and PdMIF (POPTR_003G214700v3) were up-regulated, which influenced downstream metabolites (Fig. 8a); while in the mechanical damage group over the same period, expression levels of all three genes PdCAD2 (POPTR_002G018300v3), PdDFR5 (POPTR_005G229500v3) and Pd4CL19 (POPTR_019G049500v3) were down-regulated in response to stimulation (Fig. 8b).
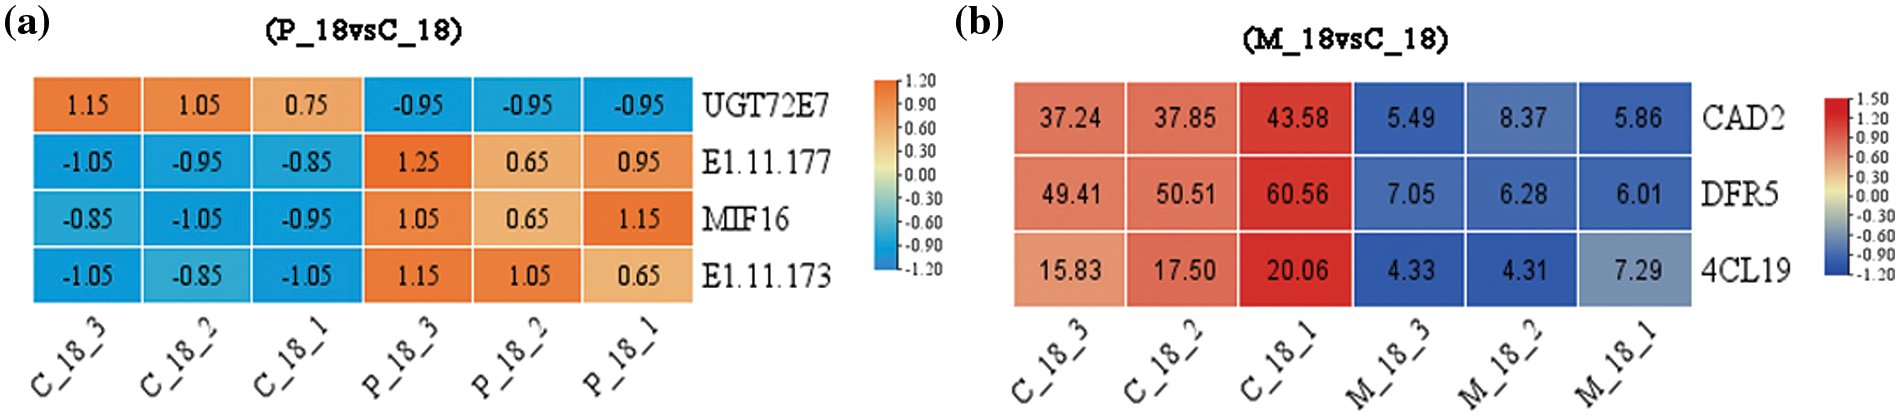
Figure 8: Expression levels of DEGs. (a) Between P_18 and C_18 groups. (b) Between M_18 and C_18 groups
When plants are attacked, there ‘bleeding sap’ due to root pressure and quickly respond by synthesizing proteins and secondary metabolites [26]. Therefore, the metabolites around plant wounds at this time are extremely rich and can be used as samples for analysis. As an important organic compound, secondary metabolites are essential for plant defense and reproduction [27]. Coincidentally, this phenotype of PdS is particularly prominent, and previous studies also showed that the eclosion rate of ALB adult from it was very low [4]. Whether resistance to ALB is related to the abundance of inclusions produced is unclear. To explore the interaction between PdS and ABL, we characterized the comprehensive response of PdS to groove production, incubation and drilling down into the phloem by ALB, and also the reaction of PdS to hatching larvae. We found that the number of DEGs of PdS responses to ALB was nearly some as responses to mechanical injury in the early stage (7 d), while the number of DEGs of PdS responses to ALB was a llittle more than mechanical injury (Fig. 1b,c), and on the 18th day, the number of difference of DEGs between P-18 and M-18 was become largest, which indicted that the poplar had the most similar intense responses to ALB gnawing grooves and mechanical injury in the early stage, but as time went on, the reaction gradually weakened due to the plants self-healing systems, when larvae were hatched (the 18th day), the PdS stems produced wound flow again, but no bleeding appeared in mechanically damaged stems. Whether were the mechanisms of plants respond to mechanical injury and insects attack different. It has been reported that herbivory damage generally led to more intense changes in Amaranthus cruentus [28], which confirms our suspicion. Taken together, the three key periods of sample collection in this study are reasonable and feasible, which can be used for the subsequent screening and identification of differential genes and metabolites.
During the long-term co-evolution of plants and insects, plants have developed sophisticated defense mechanisms. When subjected to stress, plants can produce primary metabolites that facilitate physiological and biochemical responses, enhancing their defense capabilities. These include essential amino acids and carbohydrates vital for growth, development, and reproduction [29]. Additionally, plants can bolster their resistance by synthesizing secondary metabolites (Fig. 2a–c), such as phenols, terpenoids [30], and nitrogen-containing compounds. Alkaloids, for instance, exhibit toxicity to herbivores by disrupting neuronal signal transduction, hindering DNA replication, protein synthesis, and enzyme activity. This interference can deter feeding, inhibit growth, or even poison the insects [31]. In our analysis, we focused on differentially expressed genes (DEGs) that are enriched in pathways related to secondary metabolite synthesis. We identified DEGs responsive to pest stimulation that were involved in biosynthetic pathways for isoquinoline alkaloids, phenylpropanoids, tyrosine metabolism, stilbenoid, diarylheptanoid, gingerol, and flavonoids.
Our research revealed that poplar trees exhibited a stronger response to insect infestation compared to mechanical damage, particularly evident on the 18th day when newly hatched Asian longhorned beetle (ALB) larvae invaded the host plant. We conducted a metabolome analysis of phloem metabolites following larval incubation and performed metabolic pathway enrichment analysis. The results indicated that the pathways for secondary metabolite synthesis were most significantly enriched, aligning with our transcriptome analysis findings (Fig. 5d,f). Furthermore, a combined analysis of phloem transcriptome and metabolome data post-larval incubation revealed that the differentially abundant metabolites (DAMs) and DEGs related to the infestation primarily participated in phenylpropanoid biosynthesis, flavonoid biosynthesis, and tyrosine metabolism. Unlike other studies that focus on specific developmental time points, our research examined three critical developmental stages, allowing for a more comprehensive understanding of tree responses to insect threats.
Tyrosine (Tyr) serves as a precursor for various specialized metabolites that function as electron carriers, antioxidants, attractants, and defense compounds [32]. For example, tyrosine-derived cyanogenic glycosides like dhurrin play a significant role in deterring herbivores by releasing toxic hydrogen cyanide (HCN) upon ingestion [33]. Flavonoids produced via the phenylpropanoid pathway are involved in numerous physiological and biochemical processes, such as responses to high UV light levels [34], low temperatures, and oxidative stress [35]. Flavonoids can deter herbivore feeding, development, and oviposition; for instance, vitexin inhibits larval growth in Spodoptera litura, while schaftoside restricts growth in Brown planthoppers by interacting with the native NICDK1 protein [36]. Rutin, isolated from Arabidopsis thaliana, has been shown to increase mortality in S. litura and Helicoverpa armigera when fed to larvae in an artificial diet [37].
Quantitative levels and chemical diversity of plant metabolites play crucial roles for herbivorous insects [38]. We found that there were differences in the number of genes and metabolic outcomes in response to insect infestation and mechanical damage in PdS. There were 41 MADs and 102 DEGs in PdS responding to newly hatching larvae, and 36 DAMs and 64 DEGs involving in the mechanical damage response. Amongst these, we found four genes (PdUGT72E, PdPod73, PdPodA2 and PdMIF) that played a major role in plant responses to larval hatching and three genes (Pd4CL19, PdDFR5 and PdCAD2) that played a major role in plant response to mechanical damage. Previous research showed that glycosyltransferases (GTs) can affect phenylpropanoids pathways [39]. UGT72E2 is a glycosyltransferase (GT) that can regulate the glycosylation of compounds such as coniferyl and sinapyl alcohols, along with coniferaldehyde, sinapaldehyde, ferulic, and sinapic acids. This glycosylation may play a crucial role in rapid wound-induced defense responses [40]. Class III secretory peroxidases (POD) catalyze the reduction of hydrogen peroxide (H2O2) through electron transfer to various donor molecules, which are involved in a wide range of physiological processes [41]. The enzyme 4-coumarate-CoA ligase (4CL) has been characterized in various plants for its role in plant physiology and responses to biotic and abiotic stresses. Specific isoforms of this enzyme are differentially regulated under diverse stimuli, leading to a metabolic shift toward the production of particular metabolites [42]. Cinnamyl alcohol dehydrogenase (CAD) proteins are integral to lignin biosynthesis and are critical for plant defense against stresses; their expression is induced by herbivore damage alongside CAD/CAD-like and PdPLR1 gene expression [43].These indicate that the PdUGT72E, PdPod73, PdPodA2 and PdMIF genes identified play an important role in regulation of pest resistance in poplar, this is the first time we have obtained these genes from PdS based on transcriptome data, which provides a new target for molecular breeding of forest trees.
From the transcriptome and metabolome levels in our study, we demonstrate that regulating secondary metabolic synthesis pathways is one of the main pathways of PdS in response to external stimulation, the mechanisms for responses to mechanical damage and insect infestation were different, and the mechanisms of responses to adult grooves production, larval incubation, and larval frass production were not identical. Finally, the potential genes with an anti-insect function were identified. This work has laid a foundation for further studies to locate the target pathway of pest resistance in poplar and further explore the mechanisms of pest resistance in trees. However, the mechanism by which the interaction between related genes and metabolome pathways influence the insect resistance of PdS still requires further investigation.
Acknowledgement: None.
Funding Statement: This work was supported by the National Natural Science Foundation of China (Nos. 32271891 and 32171798).
Author Contributions: Study conception and design: Jianrong Wei, Dandan Cao; data collection: Jiayu Luo, Jianfeng Liu, Zuoxiang Sun, Pengpeng Shao, Binzhou Li; analysis and interpretation of results: Jiayu Luo, Jianfeng Liu, Lijun Dong, Danyang Wang; writing original draft preparation: Jiayu Luo, Jianfeng Liu; draft manuscript preparation: Jiayu Luo, Jianrong Wei, Jianzhong Yao. All authors reviewed the results and approved the final version of the manuscript.
Availability of Data and Materials: The data that support the findings of this study are available from the corresponding author upon reasonable request.
Ethics Approval: Not applicable.
Conflicts of Interest: The authors declare that they have no conflicts of interest to report regarding the present study.
References
1. Zhang Y, Zhou YY, Zhang D, Tang XL, Li Z, Shen C, et al. PtrWRKY75 overexpression reduces stomatal aperture and improves drought tolerance by salicylic acid-induced reactive oxygen species accumulation in poplar. Envir Experi Bot. 2020;176:104117. doi:10.1016/j.envexpbot.2020.104117. [Google Scholar] [CrossRef]
2. Zhang K, Ma ZJ, Wang YC, Wang Q. Caues and countermeasures of poplar driftwood. Anhui Agricul Sci Bull. 2022;28(1):65–6 (In Chinese). doi:10.16377/j.cnki.issn1007-7731.01.033.4. [Google Scholar] [CrossRef]
3. Ren Y, Zhou X, Dong Y, Zhang J, Wang J, Yang M. Exogenous gene expression and insect resistance in Dual Bt Toxin Populus × euramericana ‘Neva’ Transgenic plants. Front Plant Sci. 2021;12:660226. doi:10.3389/fpls.2021.660226. [Google Scholar] [PubMed] [CrossRef]
4. Wang ZG, Su Z, Liu MH, Zhao YM, Zhang G, Cui ZR, et al. Comparison of the resistant characteristics of Populus alba var. pyramidalis and Populus deltoides cl. Beikang to damages against Anoplophora glabripennis. Coleoptera: Cerambycidae. Sci Silvae Sin. 2018;54:89–96. doi:10.11707/j.1001-7488.20180911. [Google Scholar] [CrossRef]
5. Golec JR, Li F, Cao L, Wang X, Duan JJ. Mortality factors of Anoplophora glabripennis (Coleoptera: Cerambycidae) infesting Salix and Populus in central, northwest, and northeast China. Biol Control. 2018;126:198–208. doi:10.1016/j.biocontrol.2018.05.015. [Google Scholar] [CrossRef]
6. Haack RA, Hérard F, Sun J, Turgeon JJ. Managing invasive populations of Asian longhorned beetleand citrus longhorned beetle: a worldwide perspective. Annu Rev Entomol. 2010;55(1):521–46. doi:10.1146/annurev-ento-112408-085427. [Google Scholar] [PubMed] [CrossRef]
7. Howe GA, Jander G. Plant immunity to insect herbivores. Annu Rev Plant Biol. 2012;59:41–66. doi:10.1146/annurev.arplant.59.032607.092. [Google Scholar] [CrossRef]
8. Li JG, Jin YJ, Luo YQ, Xu ZC, Chen HJ. Leaf volatiles from host tree Acer negundo: diurnal rhythm and behavior responses of Anoplophora glabripennis to volatiles in field. Acta Bot Sin. 2003;45:177–82. [Google Scholar]
9. Lopez-Goldar X, Villari C, Bonello P, Borg-Karlson AK, Zas GD, Sampedro L. Inducibility of plant secondary metabolites in the stem predicts genetic variation in resistance against a key insect herbivore in Maritime Pine. Front Plant Sci. 2018;9:1651. doi:10.3389/fpls.2018.01651. [Google Scholar] [PubMed] [CrossRef]
10. Thawabteh A, Juma S, Bader M, Karaman D, Scrano L, Bufo SA, et al. The biological activity of natural alkaloids against herbivores. Cancerous cells and pathogens. Toxins. 2019;11:656. doi:10.3390/toxins11110656. [Google Scholar] [PubMed] [CrossRef]
11. Postel S, Kemmerling B. Plant systems for recognition of pathogen-associated molecular patterns. Semi Cell Dev Bio. 2009;20(9):1025–31. doi:10.1016/j.semcdb.2009.06.002. [Google Scholar] [PubMed] [CrossRef]
12. Yang XJ, Zhou YY, Peng XY, Fu XH, Ma JQ, Liu JF, et al. Comparative transcriptome analysis provides insights into the molecular mechanism of the anti-nematode role of Arachis hypogaea (Fabales: fabaceae) against Meloidogyne incognita (Tylenchida: heteroderidae). BIOCELL. 2023;47:2101–13. doi:10.32604/biocell.2023.029581. [Google Scholar] [CrossRef]
13. Fu XH, Zhao J, Cao DD, He CX, Wang ZY, Jiang YB, et al. Characteristics and expression of the TCP transcription factors family in Allium senescens reveal its potential roles in drought stress responses. BIOCELL. 2023;47:905–17. doi:10.32604/biocell.2023.026930. [Google Scholar] [CrossRef]
14. Müller NA, Kersten B, Fladung M, Schroeder H. RNA-seq of eight different poplar clones reveals conserved up-regulation of gene expression in response to insect herbivory. BMC Genom. 2019;20:673. doi:10.1186/s12864-019-6048-8. [Google Scholar] [PubMed] [CrossRef]
15. Zhang LX, Bao HB, Meng FL, Ren Y, Tian CM. Transcriptome and metabolome reveal the role of flavonoid in poplar resistance to poplar anthracnose. Ind Crop Prod. 2023;197:116537. doi:10.1016/j.indcrop.2023.116537. [Google Scholar] [CrossRef]
16. Filichkin SA, Hamilton M, Dharmawardhana PD, Singh SK, Sullivan C, Ben-Hur A, et al. Abiotic stresses modulate landscape of Poplar transcriptome via alternative splicing. differential intron petention. and isoform ratio switching. Front Plant Sci. 2018;9:5. doi:10.3389/fpls.2018.00005. [Google Scholar] [PubMed] [CrossRef]
17. Rinschen MM, Ivanisevic J, Giera M, Siuzdak G. Identification of bioactive metabolites using activity metabolomics. Nat Rev Mol Cell Biol. 2019;20:353–67. doi:10.1038/s41580-019-0108-4. [Google Scholar] [PubMed] [CrossRef]
18. Chen S, Zhou Y, Chen YR, Guo J. Fastp: an ultra-fast all-in-one FASTQ preprocessor. Bioinformatics. 2018;34:884–90. doi:10.1093/bioinformatics/bty560. [Google Scholar] [PubMed] [CrossRef]
19. Kim D, Langmead B, Salzberg SL. HISAT: a fast spliced aligner with low memory requirements. Nat Methods. 2015;12(4):357–60. doi:10.1038/nmeth.3317. [Google Scholar] [PubMed] [CrossRef]
20. Pertea M, Pertea GM, Antonescu CM, Chang TC. StringTie enables improved reconstruction of a transcriptome from RNA-seq reads. Nat Bio. 2015;33(3):290–5. doi:10.1038/nbt.3122. [Google Scholar] [PubMed] [CrossRef]
21. Li B, Dewey CN. RSEM: accurate transcript quantification from RNA-Seq data with or without are ference genome. BMC Bioinformatics. 2011;12:323. doi:10.1186/1471-2105-12-323. [Google Scholar] [PubMed] [CrossRef]
22. Love MI, Huber W, Anders S. Moderated estimation of fold change and dispersion for RNA-seq data with DESeq2. Genome biol. 2014;15(12):550. doi:10.1186/s13059-014-0550-8. [Google Scholar] [PubMed] [CrossRef]
23. Wang L, Feng Z, Wang X, Wang X, Zhang X. DEGseq: an R package for identifying differentially expressed genes from RNA-seq data. Bioinformatics. 2009;26:136–8. doi:10.1093/bioinformatics/btp612. [Google Scholar] [PubMed] [CrossRef]
24. Xie C, Mao X, Huang J, Ding Y, Wu J, Dong S, et al. KOBAS 2.0: a web server for annotation and identification of enriched pathways and diseases. Nucleic Acids Res. 2011;39:316–22. doi:10.1093/nar/gkr483. [Google Scholar] [PubMed] [CrossRef]
25. Livak KJ, Schmittgen TD. Analysis of relative gene expression data using real-time quantitative PCR and the 2−ΔΔCT method. Methods. 2001;25:402–8. doi:10.1006/meth.2001.1262. [Google Scholar] [PubMed] [CrossRef]
26. Jacobo-Velázquez D, González-Agüero M, Cisneros-Zevallos L. Cross-talk between signaling pathways: the link between plant secondary metabolite production and wounding stress response. Sci Rep. 2015;5:8608. doi:10.1038/srep08608. [Google Scholar] [PubMed] [CrossRef]
27. Dobler S, Petschenka G, Pankoke H. Coping with toxic plant compounds-the insect’s perspective on iridoid glycosides and cardenolides. Phytochemistry. 2011;72:1593–1604. doi:10.1016/j.phytochem.2011.04.015. [Google Scholar] [PubMed] [CrossRef]
28. Castrillón-Arbeláez PA, Martínez-Gallardo N, Arnaut HA, Tiessen A, Délano-Frier JP. Metabolic and enzymatic changes associated with carbon mobilization. utilization and replenishment triggered in grain amaranth. Amaranthus cruentus. in response to partial defoliation by mechanical injury or insect herbivory. BMC Plant Biol. 2012;12:163. doi:10.1186/1471-2229-12-163. [Google Scholar] [PubMed] [CrossRef]
29. Abidallha E, Li Y, Li H, Chen Y, Tambel LIM, Hu D, et al. Amino acid composition and level affect Bt protein concentration in Bt cotton. Plant Growth Regul. 2017;82:439–46. doi:10.1007/s10725-017-0270-7. [Google Scholar] [CrossRef]
30. Wouters FC, Blanchette B, Gershenzon J, Vassão DG. Plant defense and herbivore counter-defense: benzoxazinoids and insect herbivores. Phytochemistry Rev. 2016;15:1127–51. doi:10.1007/s11101-016-9481-1. [Google Scholar] [PubMed] [CrossRef]
31. Li C, Zha W, Li W, Wang J, You A. Advances in the biosynthesis of terpenoids and their ecological functions in plant resistance. Int J Molr Sci. 2023;24:11561. doi:10.3390/ijms241411561. [Google Scholar] [PubMed] [CrossRef]
32. Schenck CA, Maeda HA. Tyrosine biosynthesis. metabolism. and catabolism in plants. Phytochemistry. 2018;149:82–102. doi:10.1016/j.phytochem.2018.02.003. [Google Scholar] [PubMed] [CrossRef]
33. Yadav M, Singh IK, Singh A. Dhurrin: a naturally occurring phytochemical as a weapon against insect herbivores. Phytochem Jan. 2023;205:113483. doi:10.1016/j.phytochem.2022.113483. [Google Scholar] [PubMed] [CrossRef]
34. Bharti P, Mahajan M, Vishwakarma AK, Bhardwaj J, Yadav SK. AtROS1 overexpression provides evidence for epigenetic regulation of genes encoding enzymes of flavonoid biosynthesis and antioxidant pathways during salt stress in transgenic tobacco. J Exp Bot. 2015;66:5959–69. doi:10.1093/jxb/erv304. [Google Scholar] [PubMed] [CrossRef]
35. Razzaq MK, Hina A, Abbasi A, Karikari B, Karikari B, Ashraf H, et al. Molecular and genetic insights into secondary metabolic regulation underlying insect-pest resistance in legumes. Funct Integr Genom. 2023;23:217. doi:10.1007/s10142-023-01141-w. [Google Scholar] [PubMed] [CrossRef]
36. Hao PY, Feng YL, Zhou YS, Song XM, Li HL, Ma Y. Schaftoside interacts with NlCDK1 protein: a mechanism of rice resistance to brown planthopper. Nilaparvata lugens. Front Plant Sci. 2018;9:710. doi:10.3389/fpls.2018.00710. [Google Scholar] [PubMed] [CrossRef]
37. Prashant M. Modulation of transcriptome and metabolome of tobacco by Arabidopsis Transcription factor. AtMYB12. leads to insect resistance. Plant Physiol. 2010;152:2258–68. doi:10.1104/pp.109.150979. [Google Scholar] [PubMed] [CrossRef]
38. Wetzel WC, Whitehead SR. The many dimensions of phytochemical diversity: linking theory to practice. Ecol Lett. 2020;23:16–32. doi:10.1111/ele.13422. [Google Scholar] [PubMed] [CrossRef]
39. Lanot A, Hodge D, Lim EK, Vaistij FE, Vaistij FE. Redirection of flux through the phenylpropanoid pathway by increased glucosylation of soluble intermediates. Planta. 2008;228:609–16. doi:10.1007/s00425-008-0763-8. [Google Scholar] [PubMed] [CrossRef]
40. Lim EK, Jackson RG, Bowles DJ. Identification and characterisation of Arabidopsis glycosyltransferases capable of glucosylating coniferyl aldehyde and sinapyl aldehyde. FEBS Lett. 2005;579:2802–6. doi:10.1016/j.febslet.2005.04.016. [Google Scholar] [PubMed] [CrossRef]
41. Hiraga S, Sasaki K, Ito H, Ohashi Y, Matsui H. A large family of class III plant peroxidases. Plant and Cell Physiol. 2008;42:462–8. doi:10.1093/pcp/pce061. [Google Scholar] [PubMed] [CrossRef]
42. Lavhale SG, Kalunke RM, Giri AP. Structural. functional and evolutionary diversity of 4-coumarate-CoA ligase in plants. Planta. 2018;248:1063–78. doi:10.1007/s00425-018-2965-z. [Google Scholar] [PubMed] [CrossRef]
43. Luo JY, Shao PP, Sun ZX, Shuang Li, Cao DD, Dong LJ, et al. PdPLR1 effectively enhances resistance of Populus deltoides ‘shalinyang’ to Anoplophora glabripennis by positive regulation of lignan synthesis. Plant Physiol Biochem. 2024;214:108944. doi:10.1016/j.plaphy.2024.108944. [Google Scholar] [PubMed] [CrossRef]
Appendix A
Cite This Article
 Copyright © 2024 The Author(s). Published by Tech Science Press.
This work is licensed under a Creative Commons Attribution 4.0 International License , which permits unrestricted use, distribution, and reproduction in any medium, provided the original work is properly cited.
 Downloads
 Citation Tools