
 Submit a Paper
 Propose a Special lssue
 Open Access
ARTICLE

Comparative Transcriptomic Analysis of Two Tomato Cultivars with Different Shelf-Life Traits
1 Anhui Province Key Laboratory of Horticultural Crop Quality Biology, School of Horticulture, Anhui Agricultural University, Hefei, 230036, China
2 Anhui Academy of Agricultural Sciences, Hefei, 230001, China
3 Anhui Province Key Laboratory of Soybean Molecular Breeding and Crop Quality Biology, School of Agronomy, Anhui Agricultural University, Hefei, 230036, China
4 Department of Horticulture, Ghazni University, Ghazni, 2301, Afghanistan
5 State Key Laboratory of Crop Genetics and Germplasm Enhancement, College of Horticulture, Nanjing Agricultural University, Nanjing, 210095, China
* Corresponding Authors: Yajing Liu. Email: ; Songhu Wang. Email:
(This article belongs to the Special Issue: Plant Secondary Metabolism and Functional Biology)
Phyton-International Journal of Experimental Botany 2024, 93(8), 2075-2093. https://doi.org/10.32604/phyton.2024.054641
Received 03 June 2024; Accepted 26 July 2024; Issue published 30 August 2024
 View Full Text
 Download PDF
Abstract
Tomato (Solanum lycopersicum) is a perishable fruit because of its fast water loss and susceptibility to pathogens in the post-harvest stage, which leads to huge economic losses every year. In this study, firstly from 19 tomato cultivars, we screened out two cultivars, Riogrand and SalarF1, having long and short shelf-life spans, respectively. Secondly, shelf-life analysis was carried out for both cultivars at room temperature. Results exhibited that Riogrand showed higher firmness and less weight loss than SalarF1. The ethylene production was higher in SalarF1, compared with Riogrand during post-harvest storages. We performed transcriptomic analysis of both cultivars in different storage stages. We discovered 2913, 2188, and 11,119 differentially expressed genes (DEGs) for three post-harvest stages (0, 20, and 40 Days Post-Harvest (DPH)), respectively. These genes are enriched in ethylene biosynthesis and response, as well as cell wall-related genes. Ethylene response factor (ERF) ERF2 and ERF4 were highly expressed in SalarF1 with a short shelf life in 40 DPH, and the ethylene biosynthetic genes ACO1, ACO4, ACS6, and ACS2 were significantly upregulated in SalarF1. Regarding cell wall loosening and cell wall-related genes XTH3, XTH7, XTH23, 1,3;1,4-β-D-Gluc-like, pGlcT1, Cellulase, PGH1, PL5, PL-like 1, PL-like 2 exhibited the highest levels of significance, being notably upregulated in the last stage of SalarF1. The quantitative real-time polymerase chain reaction (qRT-PCR) analysis validated these gene expressions, which is in line with the transcriptome analysis. The findings suggested that the extension of tomato fruit shelf life is mostly dependent on ethylene biosynthesis, signaling pathway genes, cell wall loosening, and cell wall-associated genes.Keywords
Supplementary Material
Supplementary Material FileTomato is a Solanaceae family member and is notable for being an economically significant food crop. There are many health benefits linked to eating tomatoes in a consumption diet. Tomatoes are a great source of minerals, vitamins C and K, lycopene, and folate. According to several research, eating more tomatoes may lower one’s risk of developing cancer and heart disease [1,2]. The unique flavor of tomatoes and their valuable health advantages render them appealing and in great demand among consumers. Despite this, tomato is a seasonal and perishable fruit that makes up a sizable number of crops that are classified as vegetables. The global yearly production of tomatoes is estimated to be around 160 million tons [3,4].
It is grown worldwide for industrial processing and consumption as fresh vegetables [5,6]. Despite the development of numerous solutions, preserving the freshness and extending the shelf life of fresh tomatoes remain a crucial difficulty in the food sector [7,8]. Numerous scholars have made significant efforts to extend shelf life through diverse postharvest technologies [9–13]. The categorization of fruits into climacteric and non-climacteric types can be determined by examining their respiration patterns and the peak of ethylene assembly during the ripening process. Tomatoes, bananas, apples, and mangoes are examples of climacteric fruits, while strawberries, grapes, and watermelon are non-climacteric fruits [9]. The tomato ripening process depends on effective softening activated by a brief period of ethylene biosynthesis, increased respiration, and up-regulation of the expression of essential genes associated with fruit ripening [14].
Postharvest storage life is crucial for tomato commercial success [9]. The processes of overripening (OR) and susceptibility to diseases like Botrytis cinerea determine how long tomatoes can be stored for keeping for storage life [15]. Deterioration after harvest is one of the main problems facing the fruit and vegetable industry [16]. The main element affecting fruit’s postharvest decline is how quickly it softens. This shortens the fruit’s shelf life and affects things like waste, vulnerability to illnesses caused by postharvest pathogens, and how often the fruit is harvested [17]. Hence, there is potential value in developing fruit products with enhanced resistance to postharvest spoilage and diseases. Fruit softening during storage might result in a significant loss of quality [18]. Changes in cell wall structure during the development and ripening phases are directly linked to fruit texture [19]. Fruit softening is largely dependent on a few cell wall-related enzymes, including β-Galactosidase (β-GAL), polygalacturonase (PG), pectinesterase (PE), and cellulase (Cel) [20]. Additionally, these enzymes’ activity rises with ripening and positively correlates with cell wall modifications [21]. As tomato undergoes ripening, numerous varieties tend to soften rapidly, rendering them vulnerable to damage and decay when transported and stored at room temperature [22,23]. Tomatoes are a good model plant for studying the growth and ripening of fleshy fruits since they are representative climacteric plants.
The accessible genome data for tomatoes offers a valuable opportunity to conduct comprehensive transcriptome analysis, enabling the study of gene expression patterns under diverse conditions [24]. Next-generation RNA sequencing (RNA-seq) has been used to identify all expressed genes at the transcriptome level to fully comprehend the hormonal regulation mechanism of tomato fruit ripening [25,26]. Next-generation sequencing is used to sequence cDNA in RNA-seq directly. The number of reads repeated indicates the transcription levels from a particular genomic region [27]. This technique is the most advanced and effective instrument available for transcriptome research [28]. There is now much transcriptomics and metabolomics research on grape, pear, and strawberry fruit, but not much on tomato fruit [24,25].
In the current work, firstly, we have conducted shelf-life screening for 19 different tomato cultivars with different sources from Afghanistan to identify the longest and shortest shelf-life of tomato cultivars according to visual screening; after that, in the second year, we have compared the shelf-life of the two cultivars namely Riogrand and SalarF1. Riogrand, the regulated tomato cultivar, was shown to have a superior shelf life than SalarF1. We conducted a thorough transcriptome study of the Riogrand and SalarF1 throughout storage periods of 0 (Day Post-Harvest) DPH, 20 (DPH), and 40 (DPH) to investigate the underlying regulation of the two cultivars. Differential gene expression patterns were found, and transcription changes at various developmental phases were examined. The genes responsible for cell wall loosening and ethylene production were also assessed.
2.1 Plant Materials and Growing Conditions
Seeds of 19 different tomato (Solanum lycopersicon) cultivars from various sources were collected from Afghanistan and grown in the open field condition using an RCBD experimental design with three replications. Information on nineteen tomato cultivars is given in Table S1. All Good Agricultural Practices (GAP) were typically done until the fruits were harvested. Flowers of every cultivar were tagged during anthesis for storage screening. In the second-year trial, two lines having the highest and lowest shelf life, namely Riogrand and SalarF1, have been selected for the next shelf-life screening from firmness and shelf-life observations that were first cultivated under typical greenhouse conditions (16/8 h, 25°C Day and night, and roughly 80% humidity) and watered daily and later on moved to the open field condition. For transcriptome analysis, the tissues of fresh fruits and samples during storage at 0 (DPH), middle point 20 (DPH), and last point 40 (DPH), were collected from both Riogrand and SalarF1 cultivars. Samples were collected, liquid nitrogen-frozen immediately, and stored at −80°C for RNA extraction and further analysis. In the studies, fresh fruit material was used to evaluate other experiments.
In order to determine the shelf life initially, ripe fruits from all 19 cultivars were separated and surface sterilized with 70% ethanol. Following this, 6–10 fruits were put in a carton box and kept between 23°C to 25°C and 55% to 60% relative humidity at room temperature. Fruits’ visual weakening and collapse were evaluated. In the second year of the trial, two lines with the highest and lowest shelf life, Riogrand and SalarF1, were chosen for the following shelf-life screening based on firmness and shelf-life observations harvested at the red ripe stage [29]. At least four fruits from each of the two cultivars were placed in a carton box and maintained in a growth chamber with a daily average temperature of 25°C and 70% relative humidity. At least fifteen fruits were chosen from different plants for study.
Fruit firmness was measured using the skin puncture strength and compression mass of fresh, undamaged fruit at different storage stages. A GY-4 digital fruit sclerometer (Hangzhou, Zhejiang, China) was used for this assessment. A circular probe was included with the equipment, and newtons (N) were used to record the data. At each stage, fruits from different plants were chosen, and each fruit was tested twice at locations evenly spaced throughout the fruit’s equatorial plane. The values (n = 15) are the means of Standard Error (SE). At least three fruits were measured for each storage stage in the postharvest fruit firmness analysis.
After being collected from both plant cultivars, tomatoes were measured, sealed, and placed on a lab table in a 2300 mL airtight container for a duration of 2 h, this sealed jar was subjected to room temperature settings ranging from 22°C to 24°C. To measure ethylene generation, 50 μL of gas was drawn out of the jar using an airtight syringe. A Flame Ionization Detector (FID)-equipped Gas Chromatograph (GC) (Agilent 7890B) was used for the analysis, and samples were injected in a sterile manner. The detector was set to run at 300°C, while the GC was configured to function at a column temperature of 60°C. With a known amount of ethylene, the amount generated was computed in relation to a standard curve created with the same instrument and operating settings.
2.5 Isolation of RNA and Library Preparation
As directed by the manufacturer, total RNA was extracted using the TRIzol reagent (Invitrogen, Carlsbad, CA, USA). RNA purity and quantity were evaluated using the Fast pure universal plant total RNA isolation kit (Vazyme Biotech, Nanjing, China) and NanoDrop 2000 spectrophotometer (Thermo Fisher Scientific Inc., Waltham, MA, USA). The RNA’s integrity was assessed using the Agilent 2100 Bioanalyzer (Agilent Technologies, Santa Clara, CA, USA). The libraries were then constructed using the VAHTS Universal V6 RNA-seq Library Prep Kit, following the guidelines provided by the manufacturer. OE Biotech Co., Ltd. (Shanghai, China) conducted the transcriptome sequencing and analysis.
2.6 RNA Sequencing and Analysis of Differentially Expressed Genes
The libraries were sequenced using a llumina Novaseq 6000 platform, producing 150 bp paired-end reads. For every sample, raw readings were produced. Fastp1 was first used to process the raw reads in the fastq format, eliminating low-quality reads to provide clean reads. After that, each sample’s clean readings were saved for later analysis. The clean reads were mapped to the reference genome using HISAT2 [30]. FPKM [31] of each gene was determined, and each gene’s read counts were acquired using HTSeq-count [32]. PCA analysis was performed using R (v3.2.0) to evaluate sample biological duplication. DESeq2 was utilized for the examination of differential expression [33]. A hierarchical cluster analysis of DEGs was performed using R (v3.2.0) to display the gene expression pattern in different samples and groups. The criterion for genes with significantly differential expression (DEGs) was set at Q value < 0.05 and foldchange > 2 or foldchange < 0.5. Using R packet grader, a radar map of the top 30 genes was created to display the expression of DEGs that were up- or down-regulated. Based on the hypergeometric distribution, GO [34], KEGG [35], R (v3.2.0) was used to conduct enrichment analysis of DEGs based on the hypergeometric distribution, GO, KEGG pathway, Reactome, and WikiPathways, to identify the relevant enriched word. The important enrichment term’s bubble, chord, and column diagram were created using R (v 3.2.0). Software for Gene Set Enrichment Analysis (GSEA) was used [36,37]. A predetermined gene set was employed for the analysis, and the genes were rated based on how Differentially they were expressed in the two types of samples. Next, the predefined gene set is evaluated to see if it was enriched at the top or bottom of the ranking list.
2.7 RNA Extraction and Quantitative Polymerase Chain Reaction (qPCR)
To confirm distinct gene expressions in the RNA-seq data, qRT-PCR was used by Using the FastPure Universal Plant Total RNA Isolation Kit (Vazyme Biotech, Nanjing, China), we isolated RNA from six different treatments: 0 (DPH), 20 (DPH), and 40 (DPH) for Riogrand and 0 (DPH), 20 (DPH), and 40 (DPH) for SalarF1 with three replication. Yeasen Biotechnology (Shanghai, China) produced the Hiffair® III 1st Strand cDNA Synthesis Kit (gDNA digest plus) for the synthesis of the first cDNA, and Hieff® qPCR SYBR Master Mix was utilized for qRT-PCR. The typical PCR amplification process involved five minutes of pre-denaturation at 95°C, 40 cycles of 10 s at 95°C and 30 s at 60°C. After being created on NCBI, the primers were delivered to General BIOL Company in Anhui, China, for synthesis. Relative expression level is determined using the 2−ΔΔCt technique [38]. The primers (forward and reverse) sequences and reference genes are mentioned in Table S2.
Every experiment was run independently three times, and the results can be repeated. Statistics are shown using the means of standard error. When comparing group differences using GraphPad Prim 9 software and the multiple t-test, p-values less than 0.05 were deemed significant.
Fruits of SalarF1 and Riogrand cultivars were picked when they were red and ripe and then were kept at 25°C and 70% relative humidity until they completely degraded. SalarF1 fruits exhibited wrinkling after 8–9 days of storage, while Riogrand did not display similar signs of senescence until 20 days in storage. When SalarF1 fruits experienced juice effusion and loss of texture and integrity, Riogrand fruits retained their texture and firmness. Comparative images examination of fruit stored for 0, 20, and 40 Days Post Harvest (DPH) were compared, and the results showed that Riogrand fruit had fewer wrinkles than SalarF1 fruit (Fig. 1A). After 40 days of storage, Riogrand fruit lost less weight than SalarF1, but the weight loss was the same during the first few days (Fig. 1B). Additionally, it was observed that Riogrand fruits maintained their overall appearance and firmness for a longer duration compared to SalarF1, indicating a superior shelf life. This was evident not only through weight loss measurements but also through visual phenotypic characteristics such as wrinkling. The results clearly indicate a significant difference between the two cultivars regarding their shelf life, with Riogrand demonstrating prolonged preservation over SalarF1. It revealed that Riogrand fruits exhibited delayed onset and slower deterioration rates compared to SalarF1. These findings further underscored Riogrand’s superior shelf life, indicating its ability to withstand environmental stressors and maintain quality attributes for an extended period.
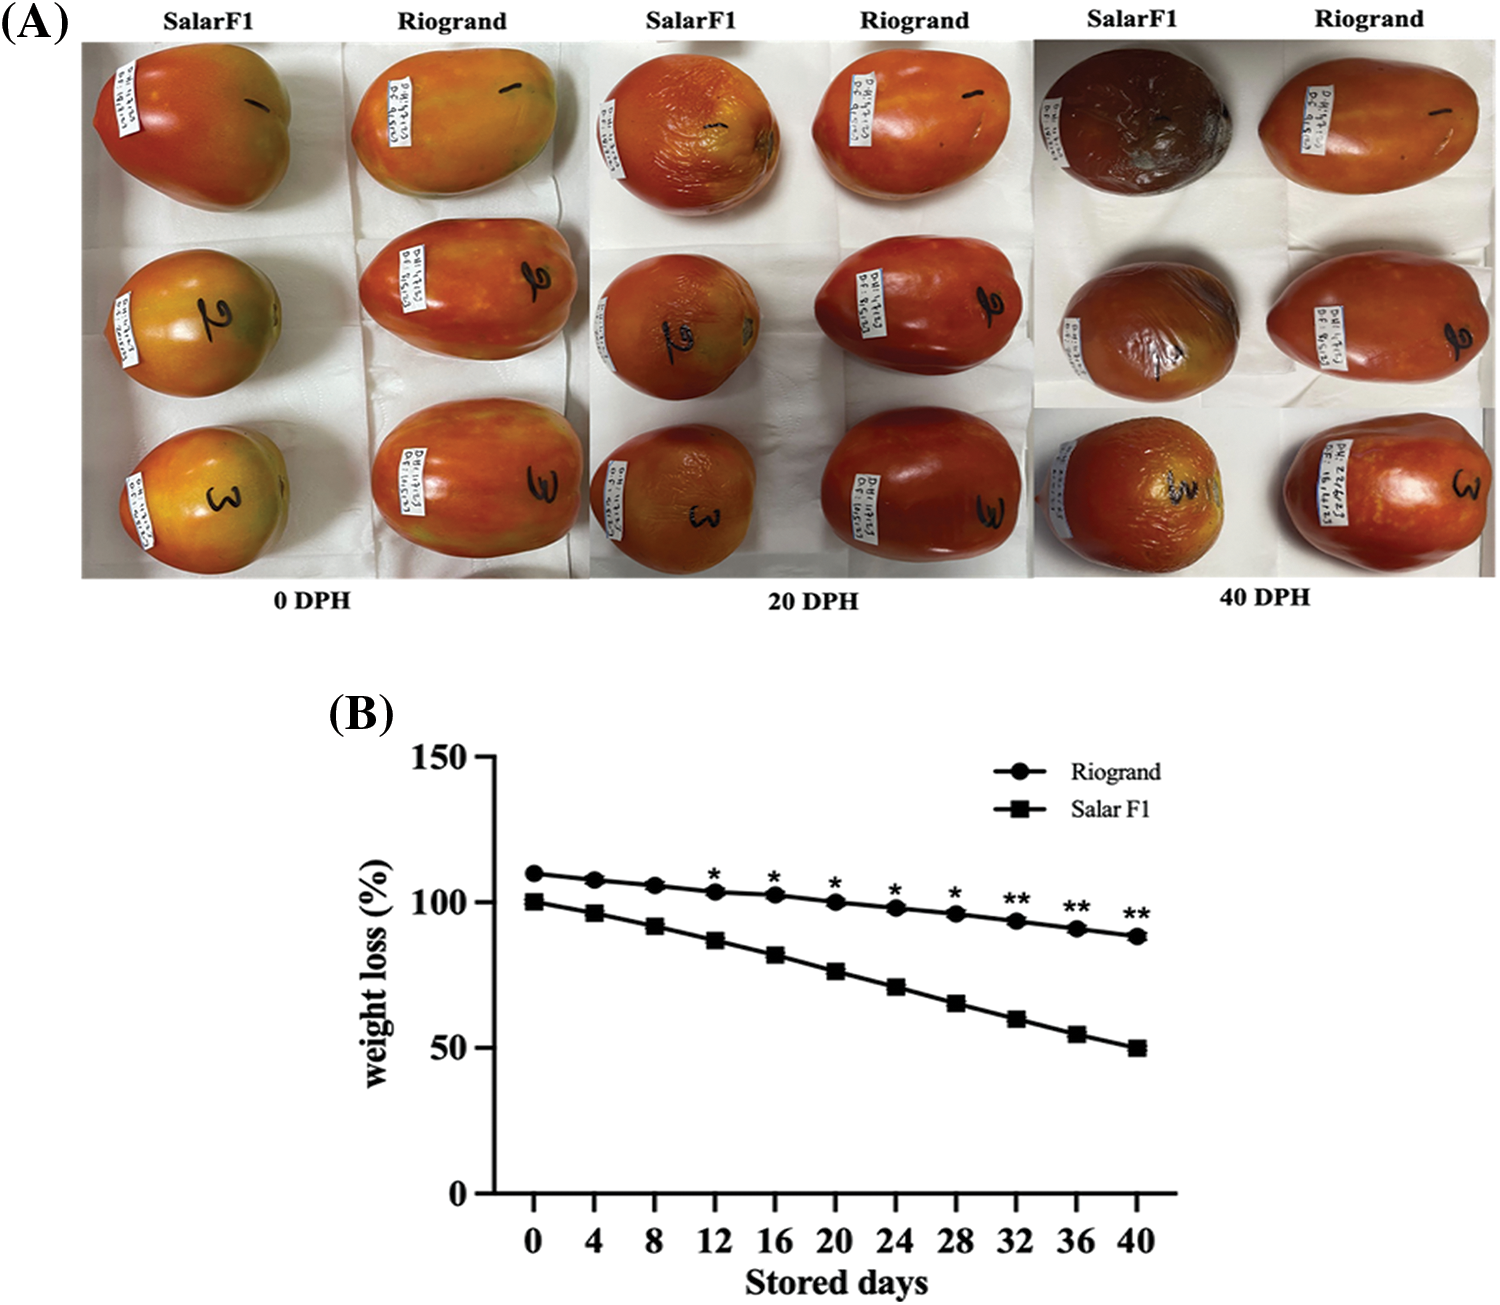
Figure 1: Riogrand and SalarF1 shelf-life analysis. (A) Riogrand showed a significantly enhanced shelf life compared to SalarF1. Red Ripe (RR) fruit from both cultivars is stored at room temperature (25°C and 70% relative humidity) for 40 Days Post Harvest (DPH). (B) Weight loss in both fruit cultivars. The weight loss per fruit was calculated every 4 days during 0–40 days after storage. Values represent means SE (n = 15). The asterisk indicates significant differences between fruit with p < 0.05 and p < 0.01, as determined by multiple t-test
By evaluating the compression mass and skin pierce strength of fresh, undamaged fruit at different points during the storage period, fruit firmness for both cultivars was evaluated. As the fruit ripened, the firmness of SalarF1 fruit rapidly decreased, with mean values of 26.8, 22, 16.1, 11.4 and 5.8 newtons (N) for 0, 10, 20, 30, and 40 days respectively while the mean values of fruit firmness in Riogrand is 29.4, 26.9, 23.5, 20.7, and 17.94 N for 0, 10, 20, 30, and 40 days, respectively. As seen in Fig. 2, Riogrand demonstrated minimal losses in firmness during the storage experiment. There is a significant difference between the two cultivars concerning firmness. The result clearly showed that Riogrand had high firmness, which indicates long shelf life compared to SalarF1.
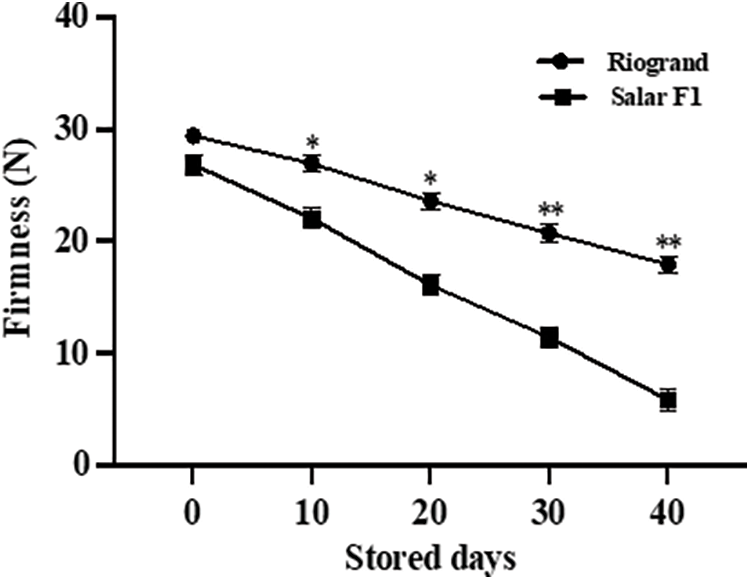
Figure 2: Change of fruit firmness in Riogrand and SalarF1. The fruit firmness per fruit was measured after storage of 0, 10, 20, 30 and 40 days. Average values were calculated for 15 individual fruits. Values represent means SE (n = 15). Asterisk indicates significant differences between both fruit cultivars with p < 0.05 and p < 0.01 respectively as determined by multiple t-test
3.3 RNA Sequencing Analysis of Riogrand and SalarF1 Tomato Fruits in Different Storage Stage
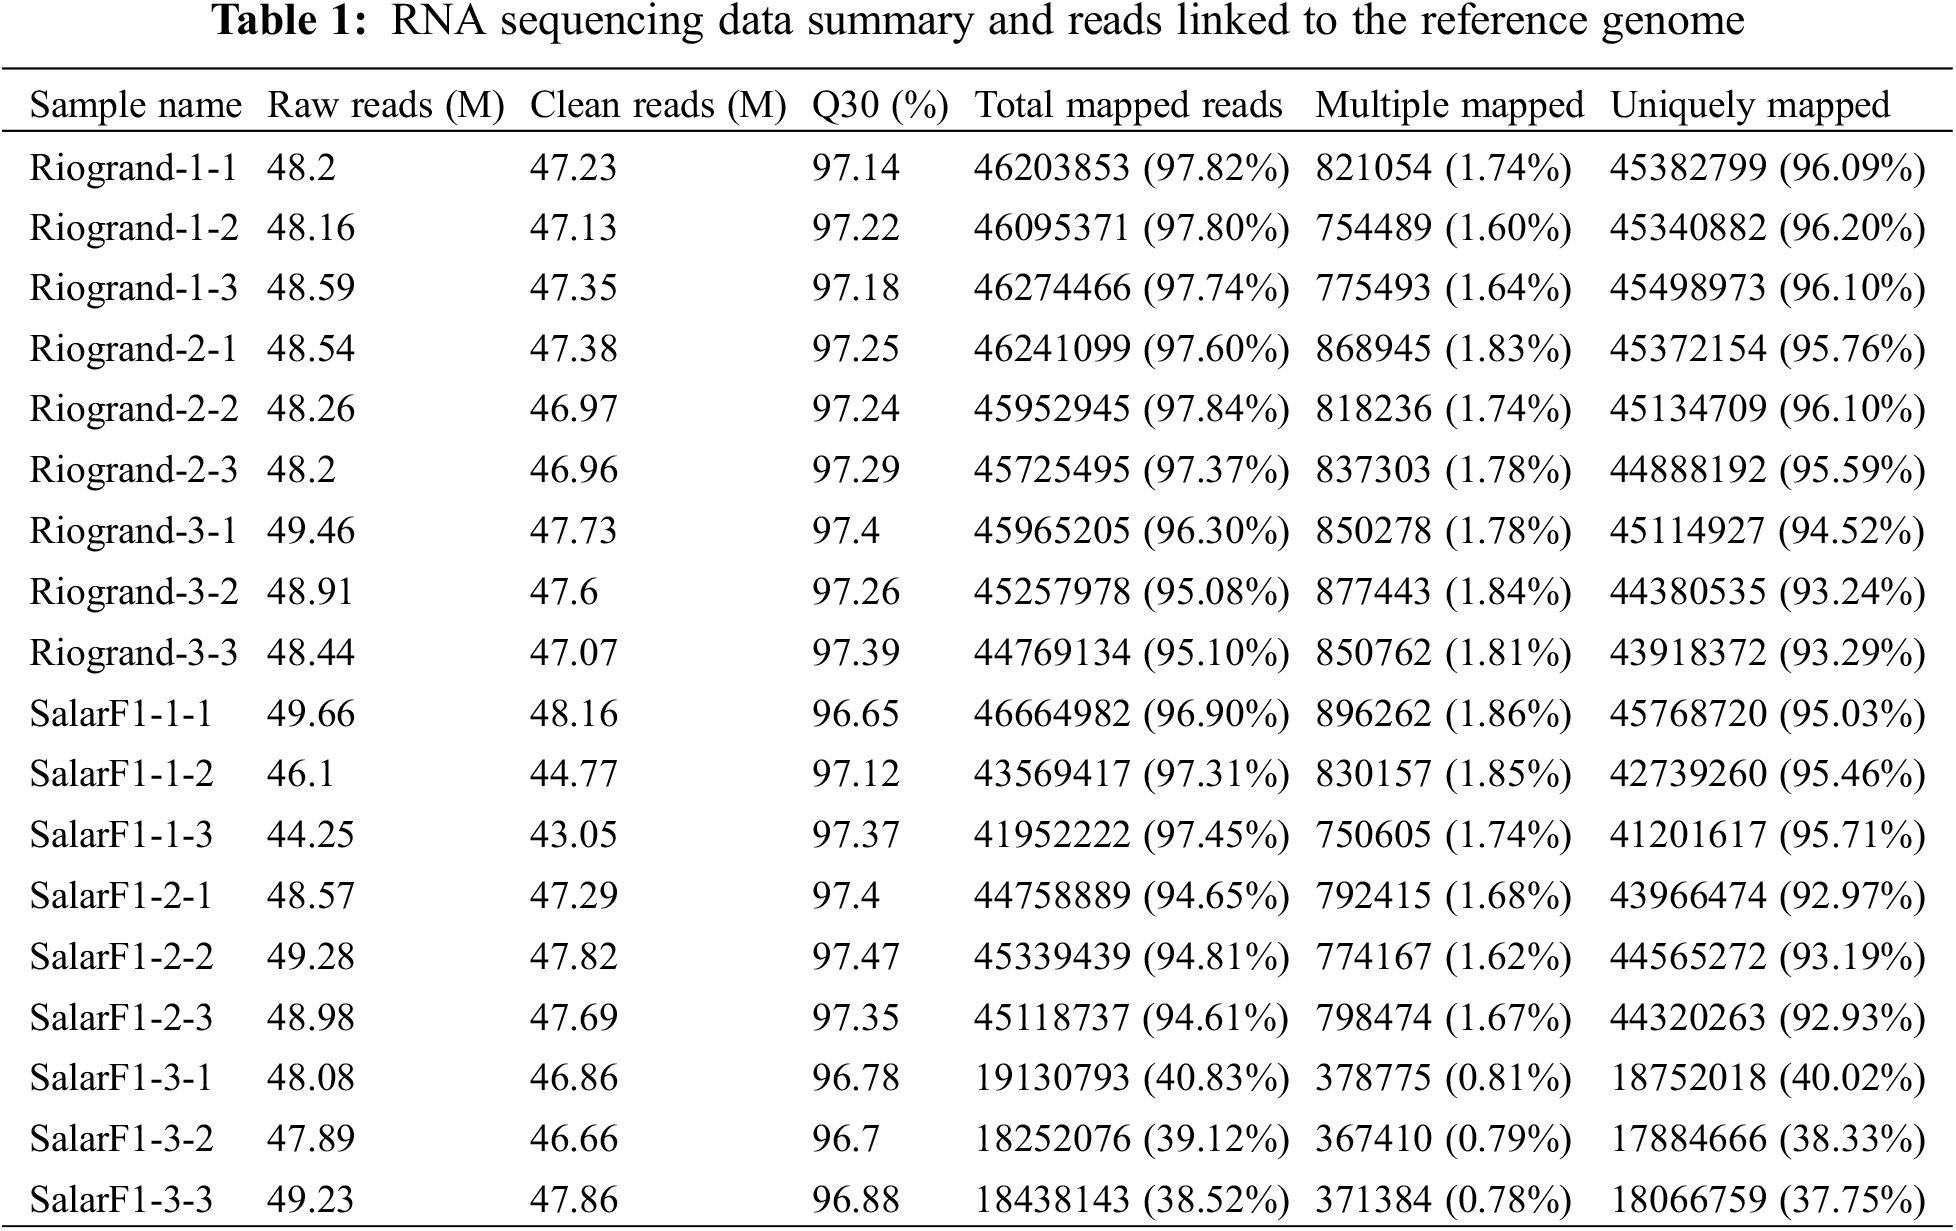
This analysis completes the sequencing of the reference transcription group of 18 samples, including six different treatments namely Riogrand 0 (DPH), Riogrand 20 (DPH), Riogrand 40 (DPH), SalarF1 0 (DPH), SalarF1 20 (DPH), and SalarF1 40 (DPH) with three replications for each, and obtained a total of 124.33 G of clean data. Each sample’s effective data was distributed at 6.33~7.06 G, with an average GC of 96.65%~97.47% in the Q30 base distribution. The genome comparison of each sample is produced by comparing reads to the reference genome, yielding a comparison rate of 38.52%~97.84% (Table 1). The analysis of the protein-coding gene’s expression was done based on the comparison results. Based on the expression of protein-coding genes in various samples, both cultivars have three primary storage stages, with three replications for each group. The number of distinct genes found are 2913, 2188, and 11,119, respectively. The findings showed that, for the most part, the sequencing data satiated the quality requirements needed for further research.
3.4 Differentially Expressed Genes Discovered by Contrasting Two Cultivars under Various Conditions
The gene expression patterns of Riogrand and SalarF1 fruit were compared at 0 DPH (Riogrand-1-vs.-SalarF1-1), 20 DPH (Riogrand-2-vs.-SalarF1-2), and 40 DPH (Riogrand-3-vs.-SalarF1-3) using the DESeq2 program to standardize the counts number of each sample gene (using Base Mean value to estimate expression). The differences between Riogrand-1 vs. SalarF1-1 (0 DPH) significantly differentially expressed genes (DEGs). Overall, 2913 genes were found in Riogrand-2-vs.-SalarF1-2 (20 DPH), 2188 genes total, of which 1159 were up-regulated and 1029 were down-regulated, and 11119 genes total, of which 5693 were up-regulated and 5426 were down-regulated, were found in Riogrand-3-vs.-SalarF1-3 (40 DPH). In all three comparisons, there were varying numbers of DEGs (Fig. 3A). Riogrand-3-vs.-SalarF1-3 (40 DPH) had the highest number of DEGs and appeared to express Differentially in the SalarF1 and Riogrand cultivars. It was observed that each cultivar exhibited distinct responses to the treatment. Among all the genes that showed upregulation and downregulation, 50 were consistently identified in all groups. The number of shared genes identified in Riogrand-vs.-SalarF1 in the three 0, 20, and 40 (DPH) stages were 301, 821, and 1107, respectively. Among all groups, the third stage has shown a significant number of genes compared to others (Fig. 3B). In several comparison groups, a large number of genes were particularly identified, indicating notable differences in the regulation processes of fruit under various storage conditions. The PCA result also shows the deferent expressions for both cultivars and the PCA result is shown In the Figs. S1 and S2. This result suggested that the two cultivars’ fundamental mechanisms differed significantly. These findings clearly show the general patterns of gene expression in different comparisons.
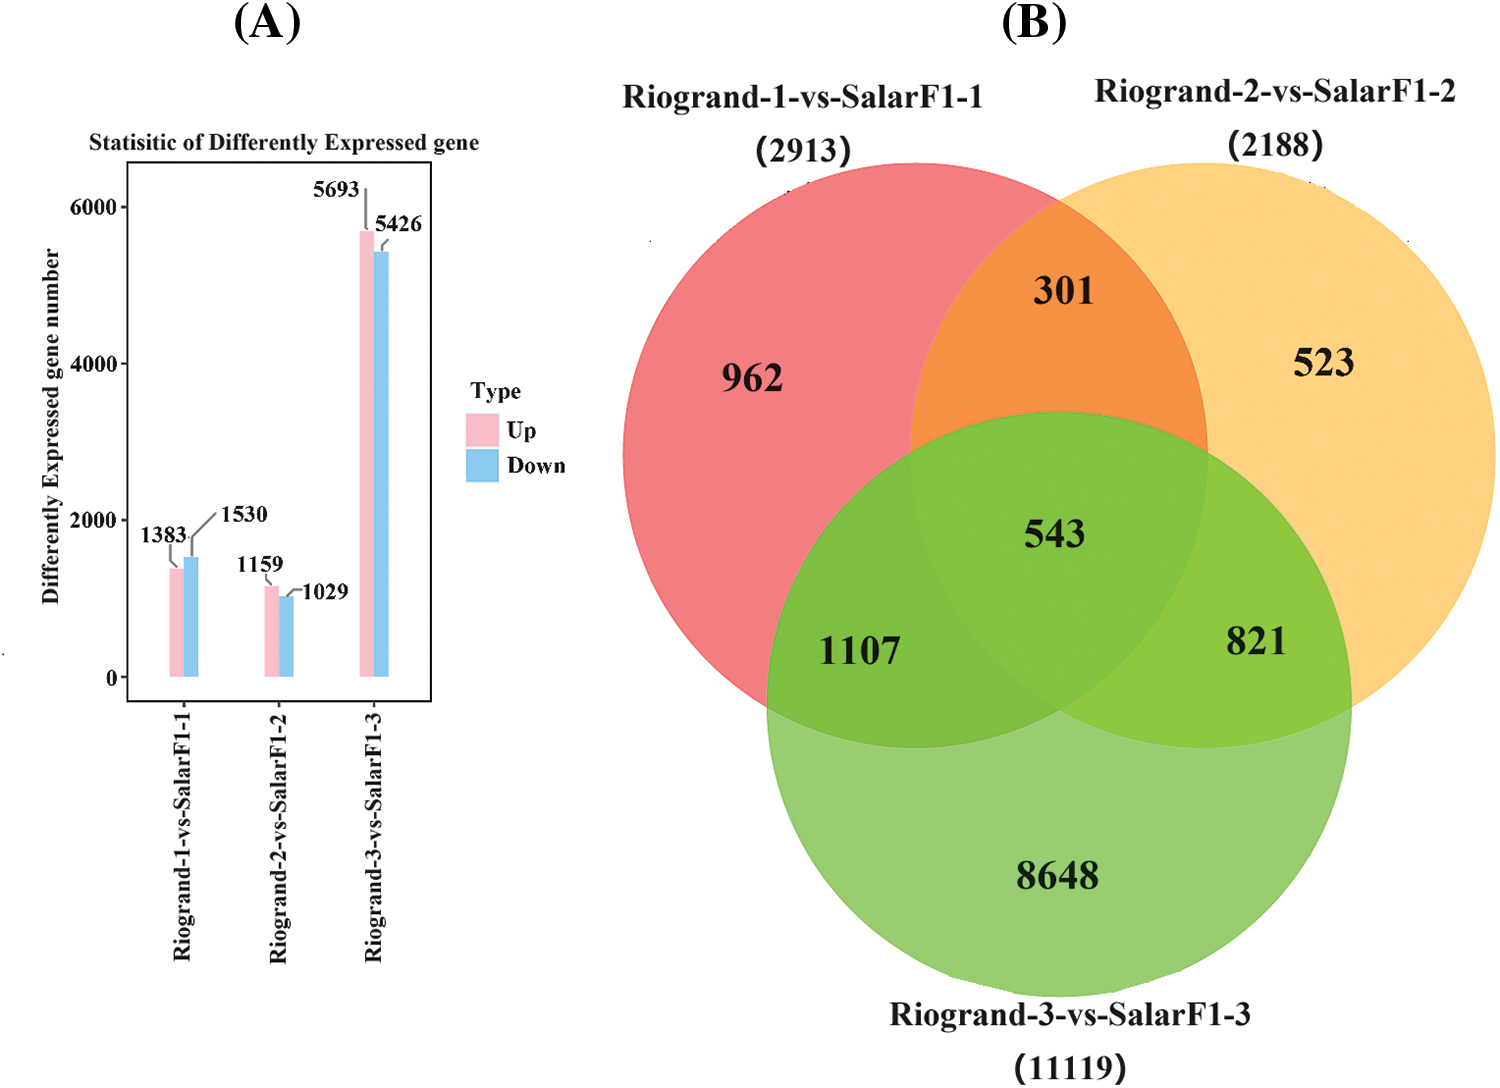
Figure 3: Statistical histogram of differential expression genes. (A) The horizontal axis is the three stages of storage of both cultivars in the comparison group, and the vertical axis is the number of different genes in the comparison group, where up is the number of up-adjusted genes with significant differences, and down is the number of down-adjusted genes with significant differences. (B) Common and unique differential expression genes between different comparison groups
3.5 GO Enrichment Analysis of DEGs
After obtaining the differential expression genes, DEGs were analyzed by GO enrichment. GO enrichment analysis of the top 30 (filter the GO entries corresponding to PopHits ≥ 5 in the three categories and sort each ten items according to the –log10 p-value from large to small corresponding to each entry) was identified. The bar chart is shown in Fig. 4. Various comparisons displayed analogous distribution patterns concerning the quantity and category of the top 30 enriched Gene Ontology (GO) terms. These terms could be categorized into three primary functional groups: ten biological processes, ten cellular components, and 10 molecular functions (Fig. 4). The biological process terms that best describe the high expression of DEGs were “plant cell wall losing,” “defence response,” “reaction to chitin,” and “reaction to the abscisic acid process.” These processes account for most DEGs, particularly in the 20 DPH storage (Riogrand-2-vs.-SalarF1-2). The bulk of DEGs were connected to the extracellular space, cell wall, plasma membrane, and chloroplast in terms of cellular components. Iron ion binding, lipid binding transcription factor, and heme binding were among the other highly prevalent molecular function names. However, for every functional comparison, there were variations in the enrichment level (p-value). Notably, additional functional comparisons that were significantly enriched involved various biological process pathways, including the response to chitin, the cell wall losing related genes, and the plant hormone signal transduction pathway (further details regarding totals up and down GO term are provided in Table S3). The findings indicated that these genes most significantly influence the tomato’s shelf life.
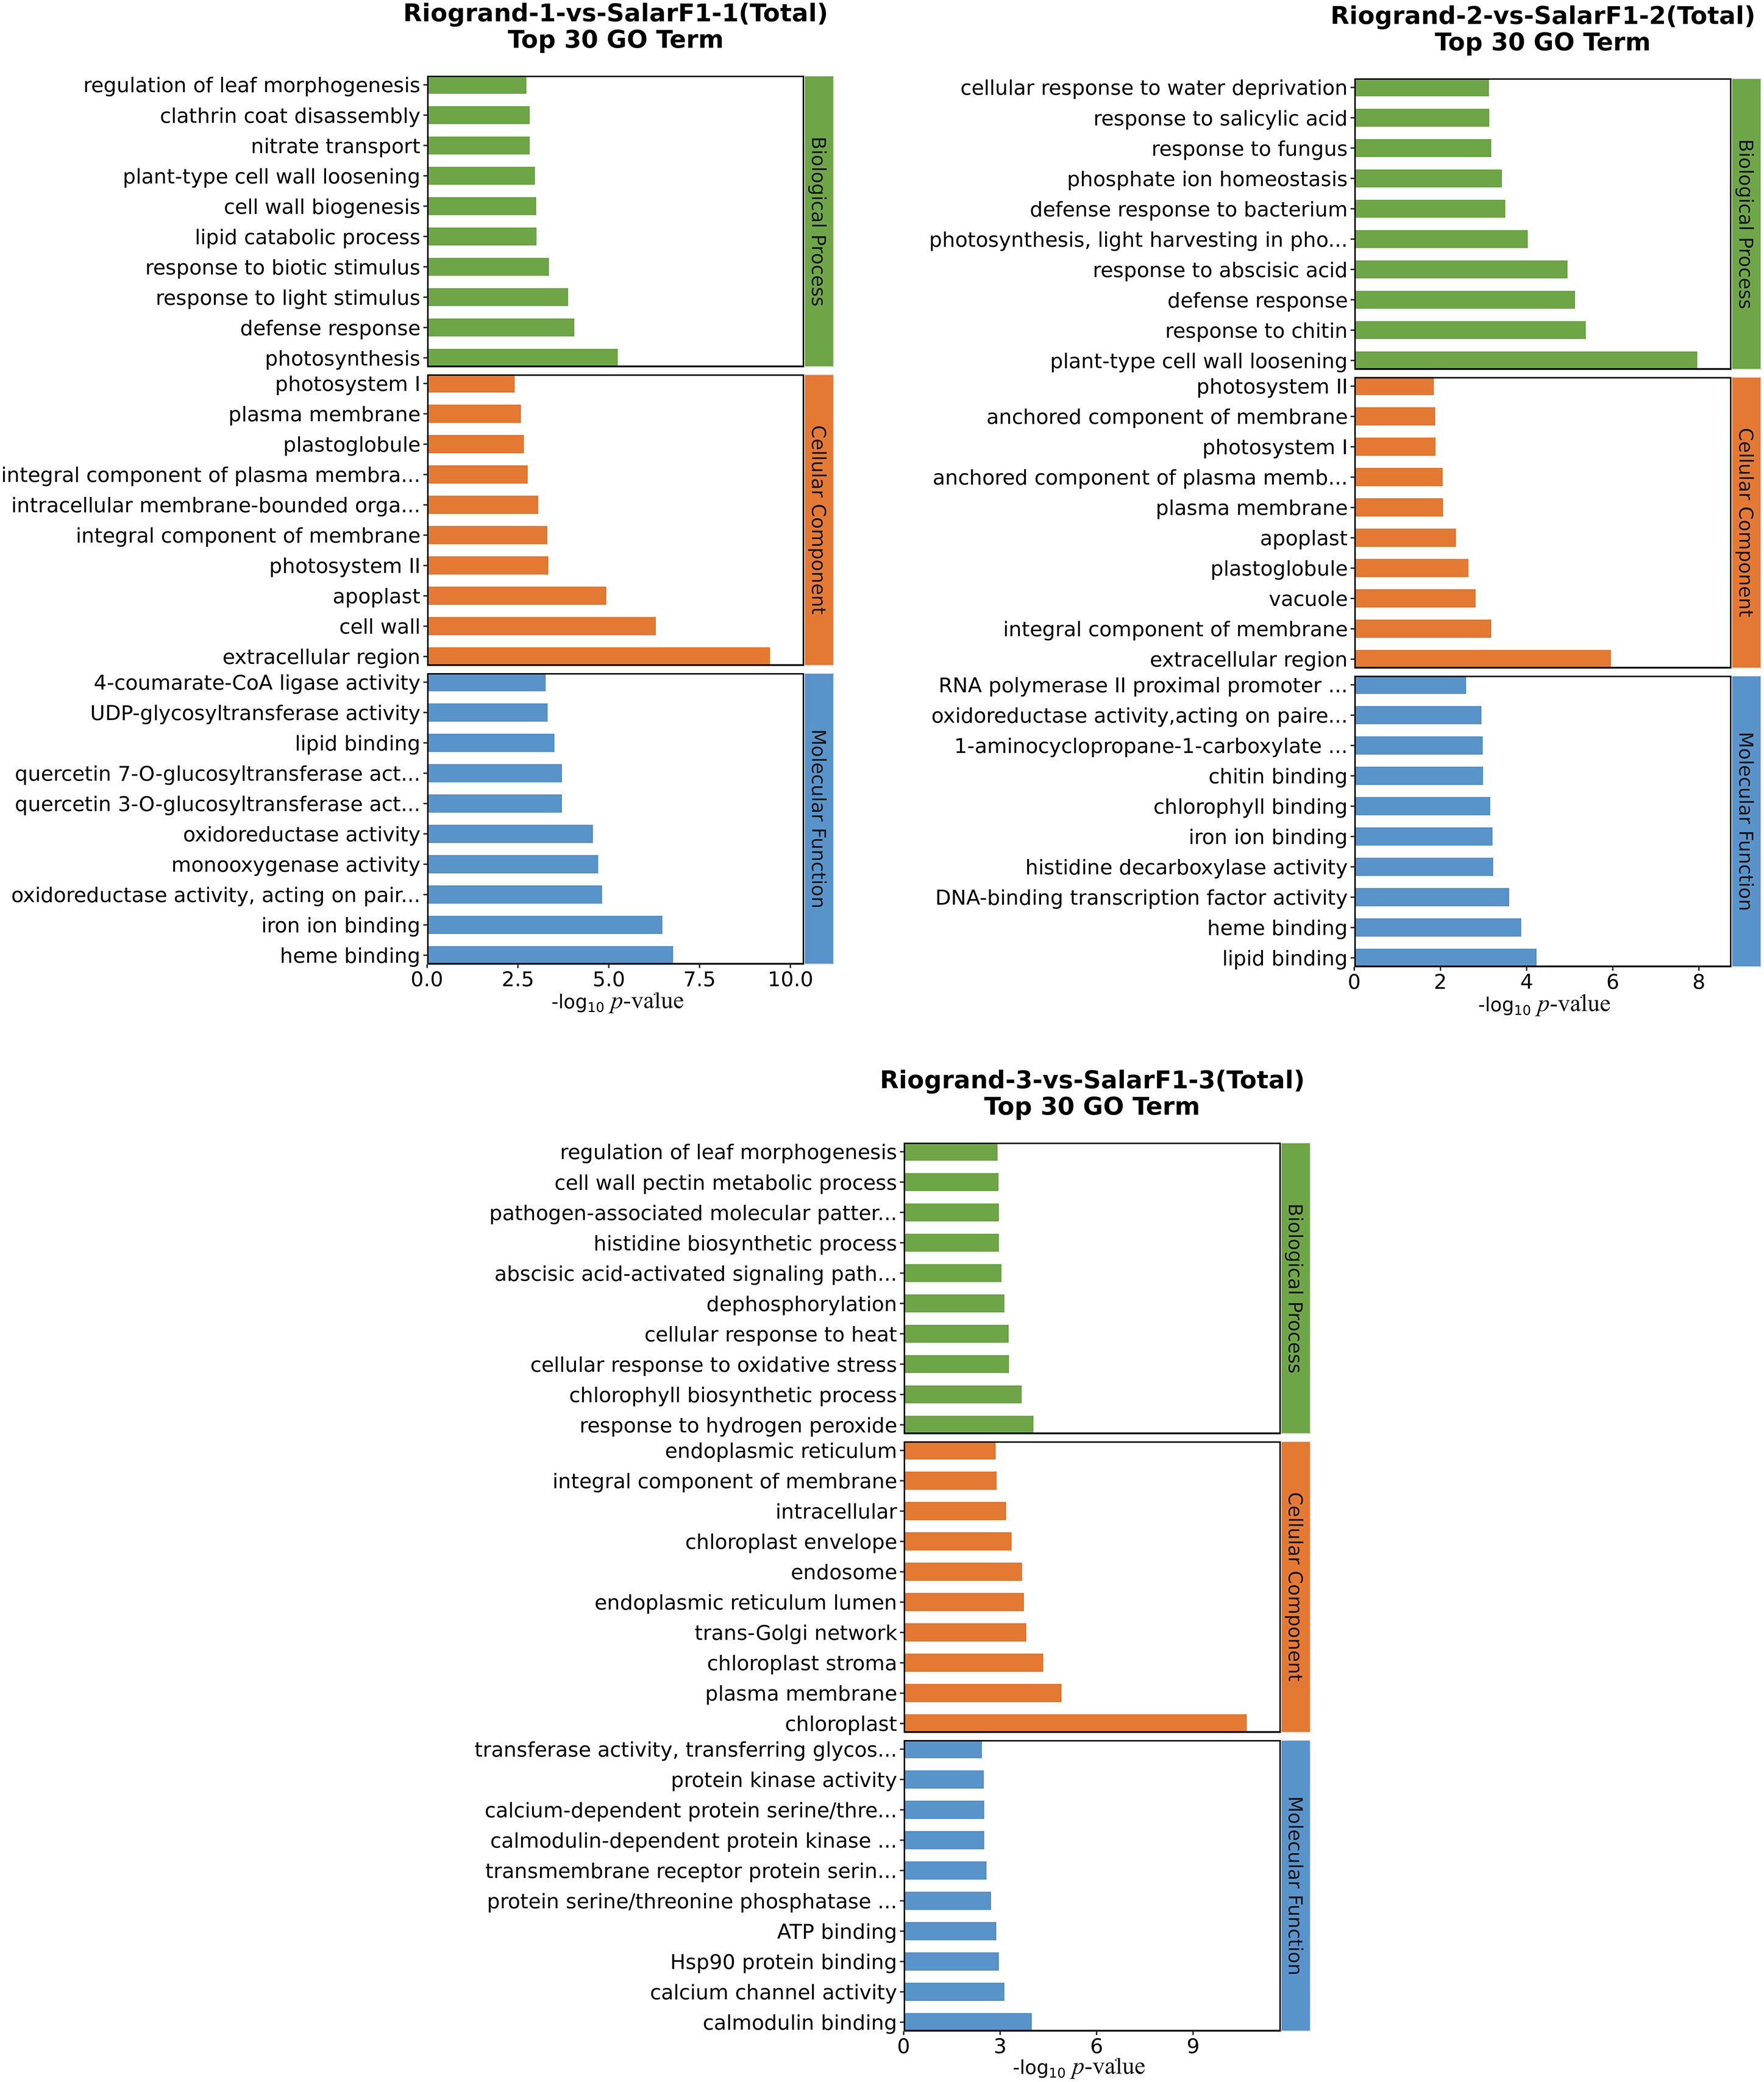
Figure 4: GO enrichment analysis results display of Riogrand vs. SalarF1 in the three stages of the storage with, total top 30 GO term. The vertical axis in the figure is the name of the GO item, and the horizontal axis is –log10 p-value
3.6 KEGG Pathway Analysis of DEGs
Using the Kyoto Encyclopaedia of Genes and Genomes (KEGG) for pathway enrichment analysis, we investigated the roles played by these two tomato cultivars in biological processes during room temperature storage, ultimately identifying specific Differentially Expressed Genes (DEGs). The pathways enriched by DEGs varied between the two cultivars with different shelf life in each comparison group. In Riogrand-1-vs.-SalarF1-1 (0 DPH), the most enriched pathways for total DEGs were phenylpropanoid biosynthesis (40 DEGs) and plant hormone signal transduction (38 DEGs). The two pathways with the highest total DEG enrichment in Riogrand-2-vs.-SalarF1-2 (20 DPH) were the MAPK signalling pathway–plant (24 DEGs) and phenylpropanoid biosynthesis (27 DEGs). In Riogrand-3-vs.-SalarF3-1 (40 DPH), the most enriched pathways for total DEGs were Protein processing in the endoplasmic reticulum (118), and plant-pathogen interaction (118) were enriched. Details and information for every KEGG pathway, including total, up, and down, are given in Table S4. These findings indicate that plants adapt to various metabolic pathways at distinct stages of the storage period for the two tomato cultivars. It was demonstrated, meanwhile, that the different comparison groups shared a few induced pathways. These pathways are linked to several processes, such as the generation of phenylpropanoid, the transmission of plant hormones, interactions between plants and pathogens, and adaptation to different storage durations. Fig. 5 illustrates our enrichment experiments, focusing on the top 20 KEGG pathways with the lowest p-values to assess the significance of pathway variations between DEGs. The two cultivars are very different in terms of the various storage times. These data demonstrated that the three comparison groups’ most significant enrichment channels differed significantly, and it is plausible that these pathways are essential to the shelf life of two tomato cultivars.
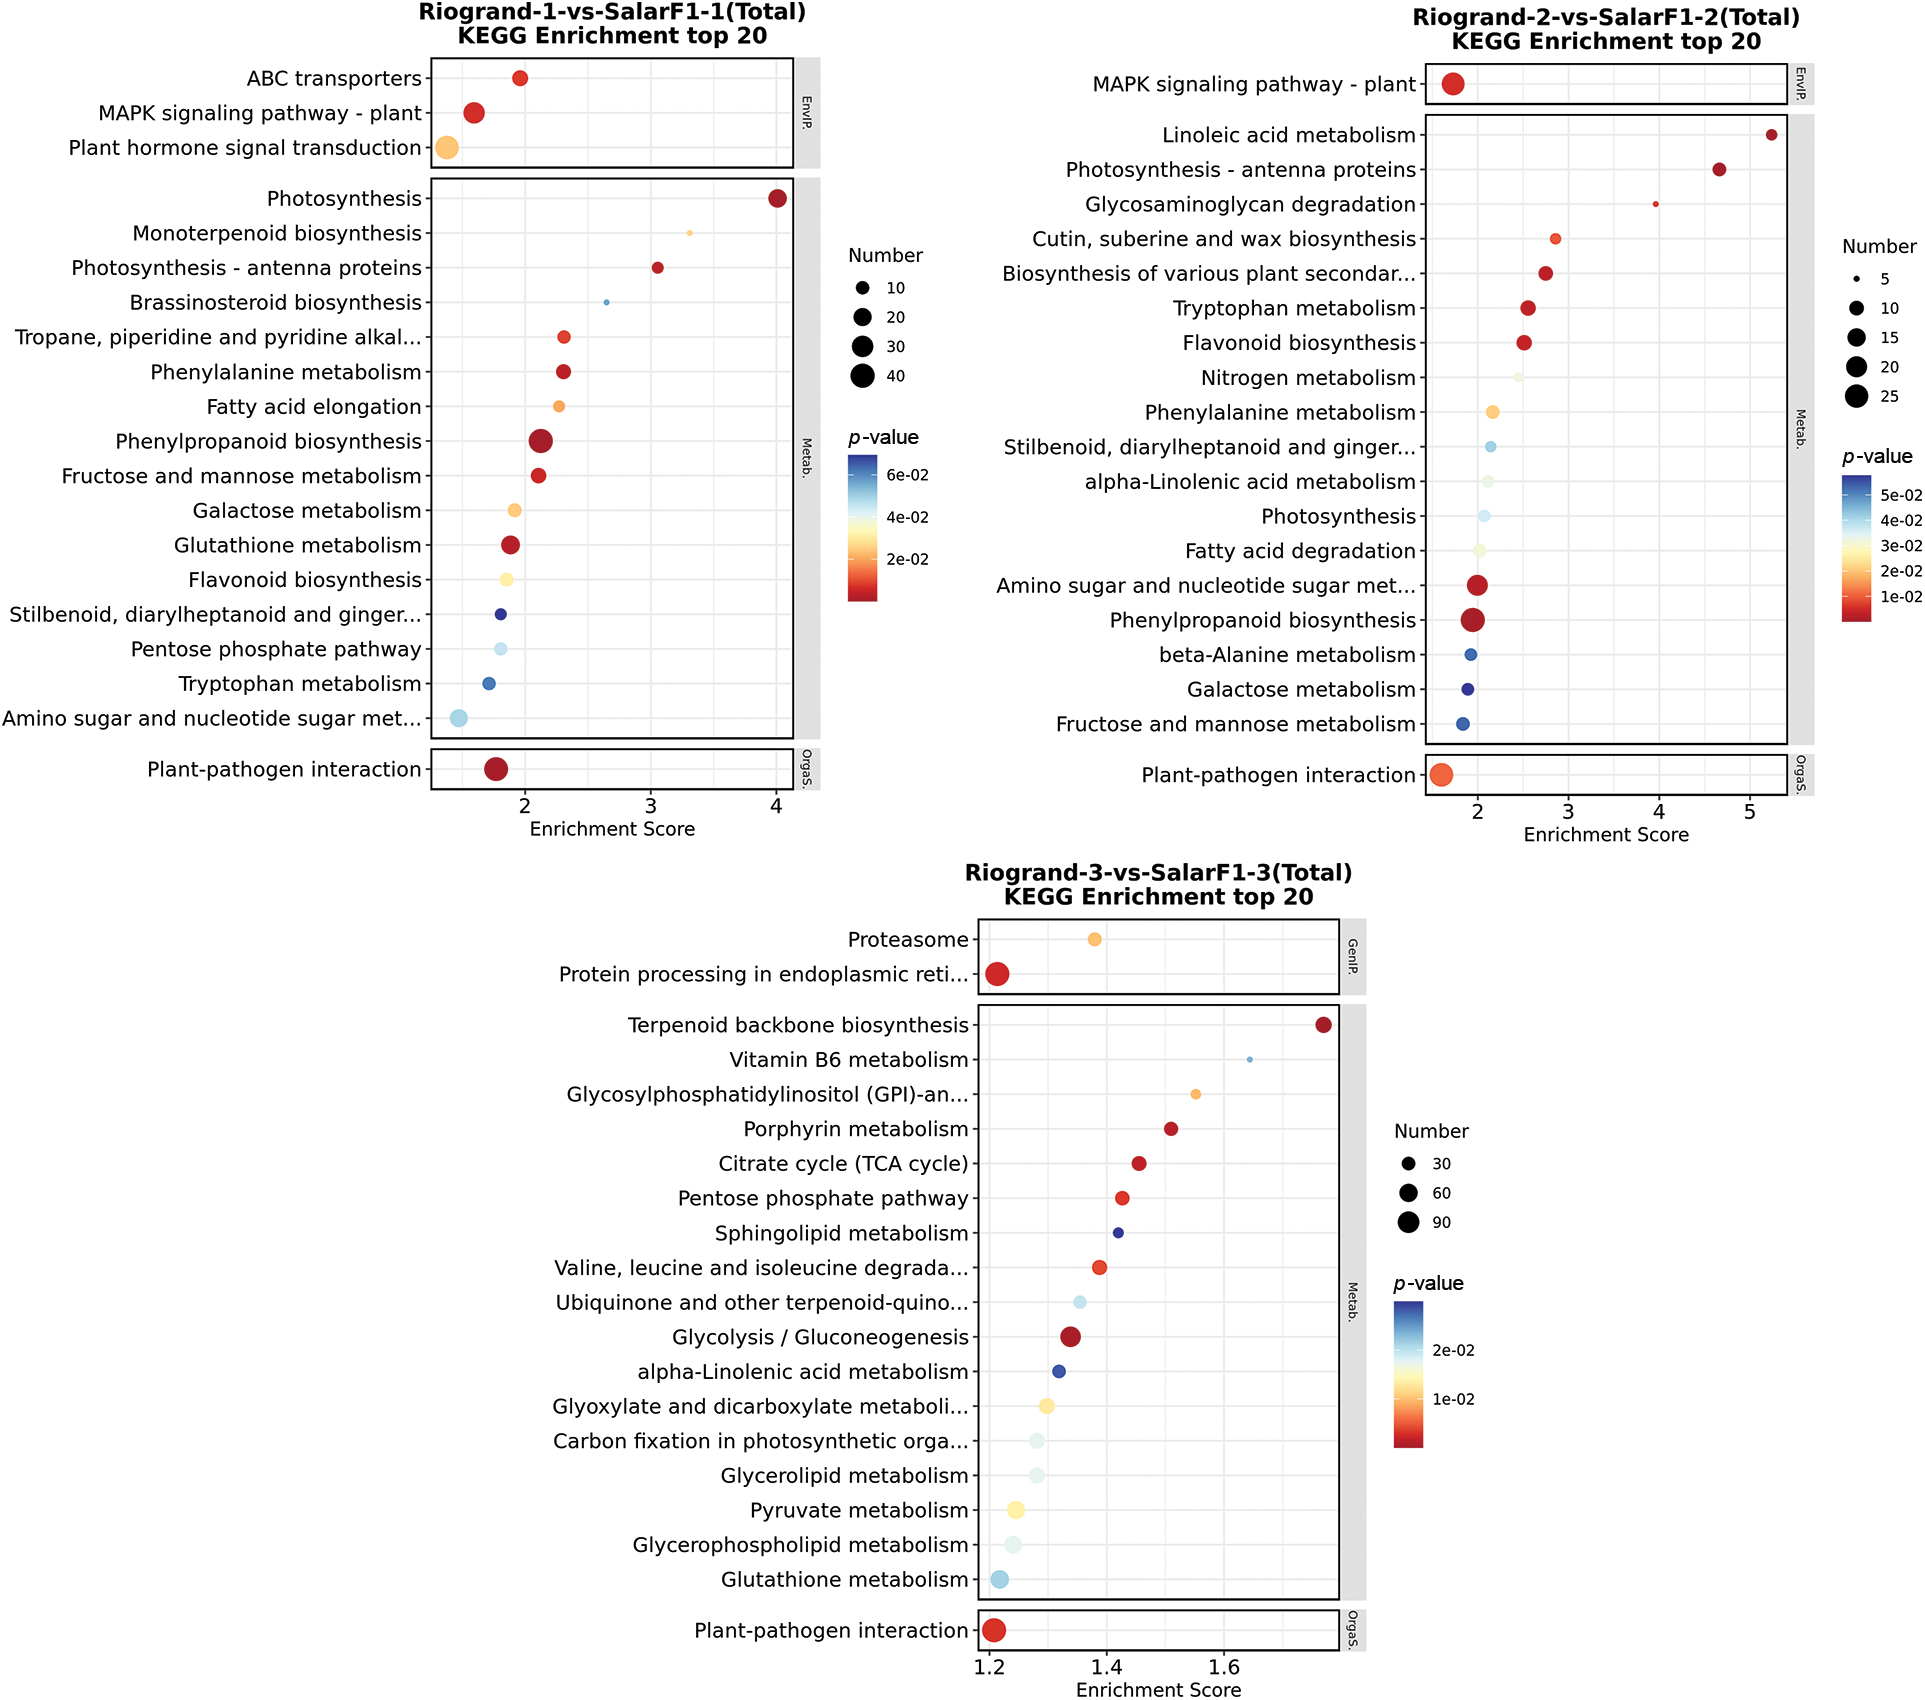
Figure 5: KEGG enrichment top20 bubble diagram of Riogrand vs. SalarF1 in the three storage stages. The horizontal axis enrichment score in the figure is the enrichment score, where the vertical axis in the figure is the name of the KEGG pathway term. The larger the bubble, the more different protein-coding genes it contains. The bubble colour changes from blue-white-yellow-red. The smaller the enrichment p-value value, the greater the significance
3.7 The Genes and Expression Profiles Involved in Ethylene Biosynthesis and Signalling Pathway
In this extensive investigation, we carefully assessed the expression patterns of 11 genes known to be differentially regulated in both cultivars in response to differing storage times, emphasizing the genes related to ethylene biosynthesis signalling pathways. We created a matching heat map to illustrate how the length of storage affected the varied gene expression in tomato fruit from both cultivars. Our findings, depicted in the heat map (refer to Fig. 6), revealed notable discrepancies between the two cultivars across different storage periods regarding the expression levels of relevant genes, with distinct patterns of upregulation and downregulation observed. Among all the genes examined, ERF2 emerged as the most significantly upregulated gene, followed closely by ERF4. The ethylene biosynthetic genes ACO1, ACO4, and ACS2 in SalaF1 are all upregulated at 40 DPH (Fig. 6). Based on these findings, we hypothesize that the ethylene biosynthesis and response likely play fundamental functions in determining the shelf life of tomato fruit. However, further in-depth investigation is warranted to elucidate the precise mechanisms by which these genes influence tomato fruit shelf life and to unravel their potential applications in enhancing fruit storage and preservation strategies.
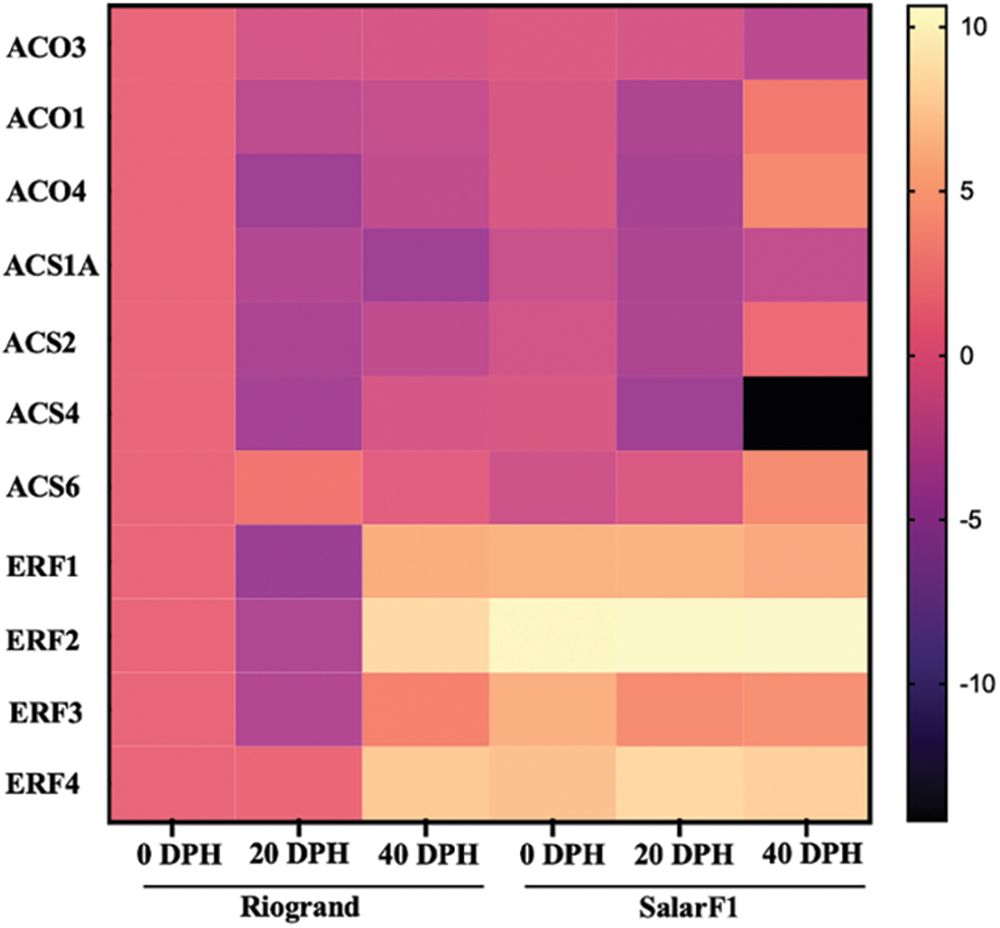
Figure 6: A Hierarchical clustering and heat map of expression levels of different ethylene synthesis and signalling genes. The heat map yellow is associated with a high expression level, and blue is associated with a low expression level. Data represented the average of three biological replications of both cultivars with 0, 20, and 40 Days Post Harvest (DPH)
3.8 Expression Profiles of Genes Involved in Cell Wall Loosening and Cell Wall-Related Pathway
After thoroughly analyzing the SalarF1 and Riogrand cultivars, 30 Differentially Expressed Genes (DEGs) linked to cell wall-related softening mechanisms and cell wall breakdown were found. We created an appropriate heat map to clarify how the length of storage affected the varied gene expression profiles in tomato fruit from both cultivars. Fig. 7 shows the heat map, and the results indicate significant differences in the expression levels of upregulated and downregulated genes between the two cultivars at different storage times. Among the selection of genes examined, XTH3, XTH7, XTH23, 1,3;1,4-β-D-Gluc-like, pGlcT1, Cellulase, PGH1, PL5, PL-like 1, PL-like 2 exhibited the highest levels of significance, being notably upregulated in the last stage of SalarF1 as highlighted in Fig. 7. We hypothesized that these discovered genes significantly influence the shelf life of tomato fruit. Their clarification provides insightful information and stimulates additional research to clarify the fundamental mechanisms controlling tomato fruit shelf life.
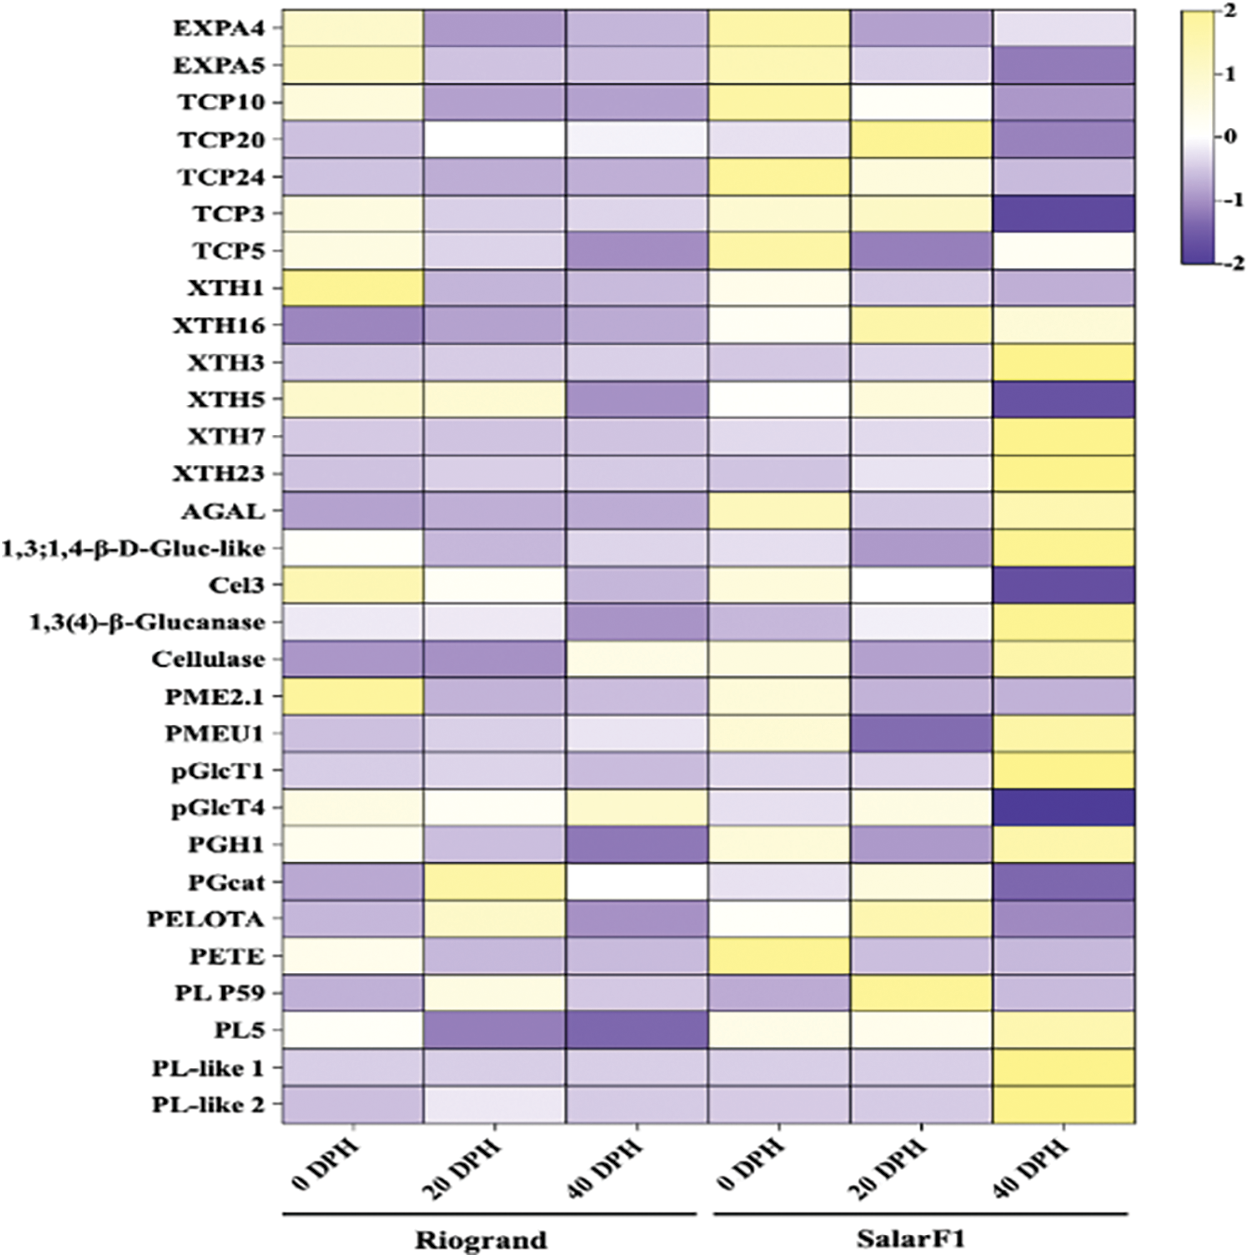
Figure 7: Hierarchical clustering and heat map of expression levels of differentially cell wall losing and cell wall-related expressed genes. In the heat map, yellow is associated with high expression level, and blue is associated with a low expression level. Data represented the average of three biological replicates of both cultivars with 0, 20, and 40 Days Post Harvest (DPH)
3.9 qRT-PCR Analysis for RNA-seq Data Validation
To confirm the accuracy and reliability of the RNA-seq data, we carried out quantitative Reverse-Transcription Polymerase Chain Reaction (qRT-PCR) analysis on 11 chosen differential genes associated with ethylene production and signalling pathways. These genes were selected following the findings of the RNA-seq analysis of their differential expression patterns. For every qRT-PCR study, three biological duplicates were employed to ensure the consistency and reliability of the results. To reduce variances, these chosen genes’ expression levels were normalized to those of a constitutively expressed control gene. Fig. 8 shows the verification results derived from the qRT-PCR analysis. The qRT-PCR experiment primers are listed in Table S2. Overall, consistent regulatory tendencies were seen across the chosen genes when the qRT-PCR data and the RNA-seq results were compared. The alignment of the two independent techniques provides a strong indication that the RNA-seq data accurately reflect the gene expression profiles under inquiry. The consistency between the RNA-seq and qRT-PCR results highlights the validity and reliability of the RNA-seq methodology used in this investigation. The reliability of the gene expression data produced by RNA-seq analysis is increased by this verification procedure, which supports the validity of the research project’s findings and conclusions.
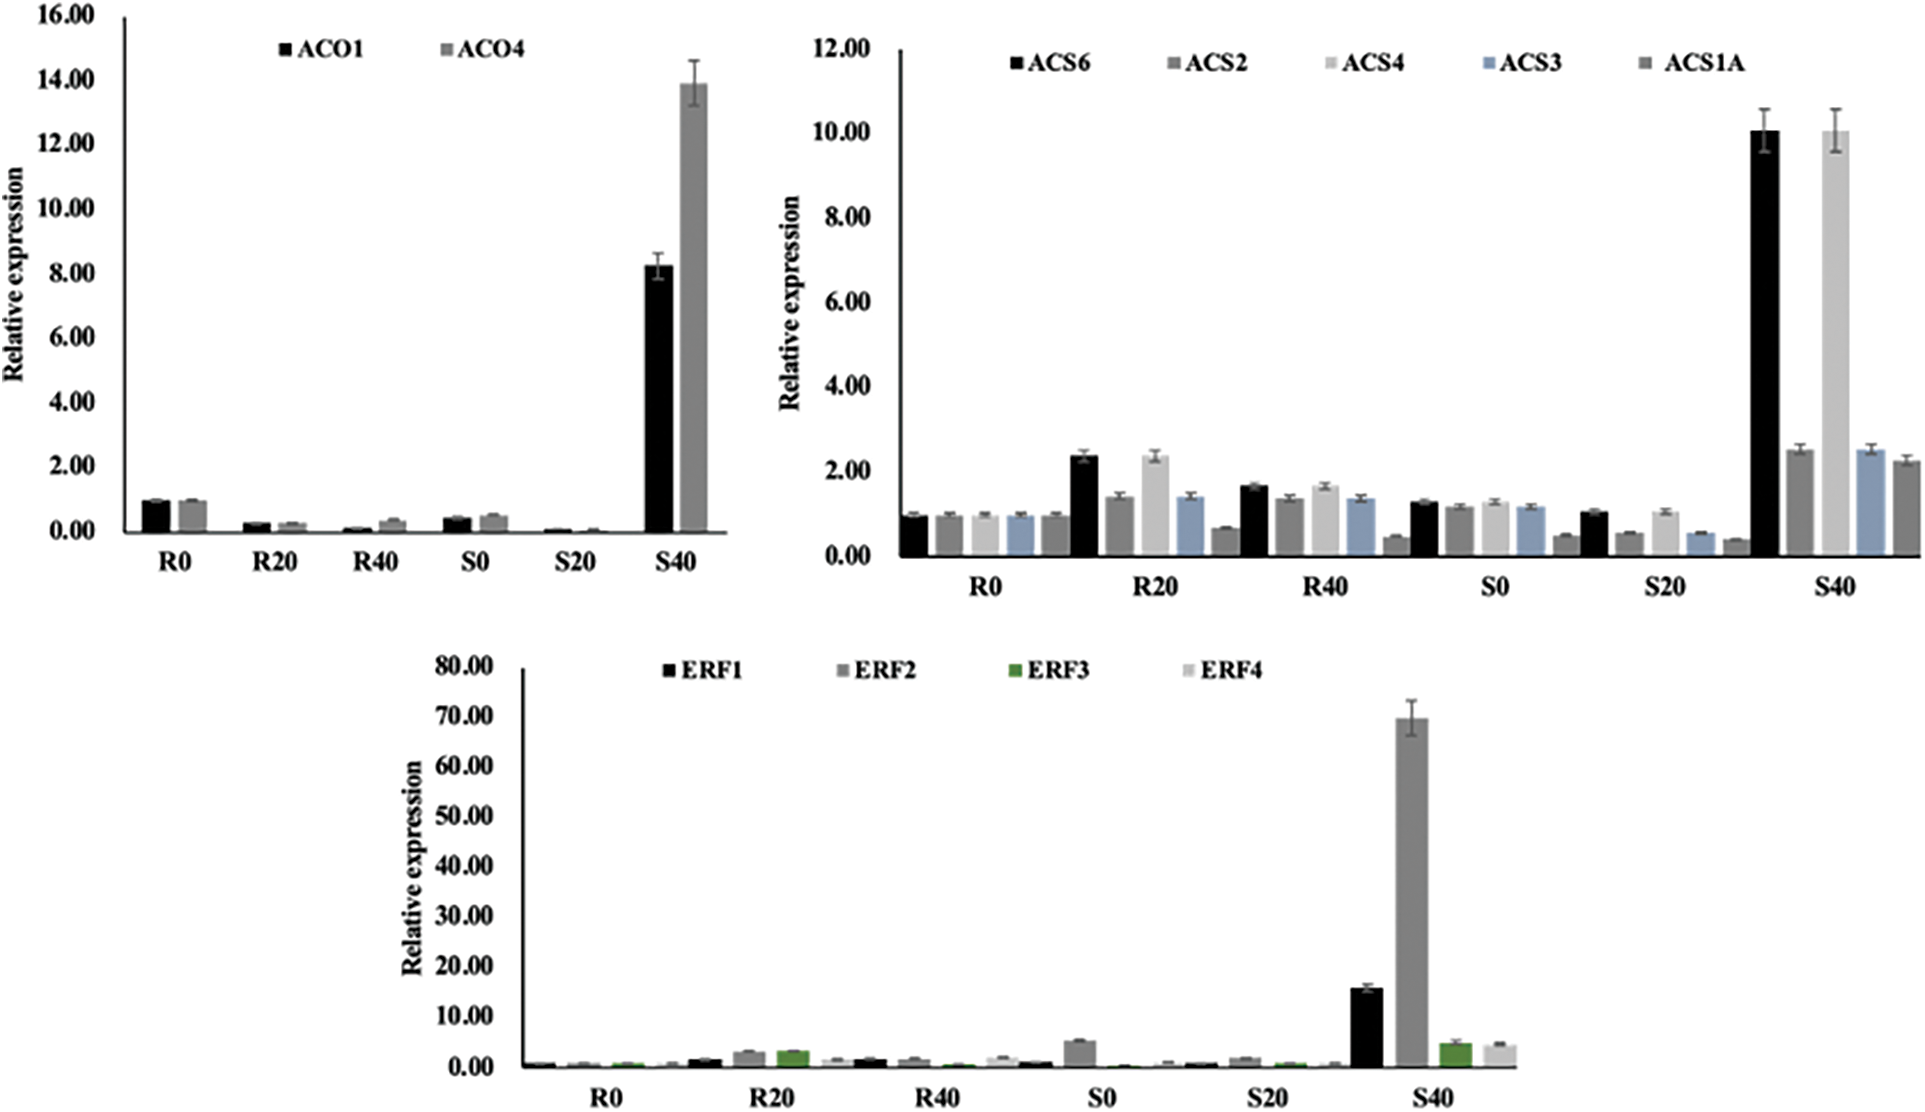
Figure 8: Expression validation of 11 selected ethylene synthesis and signalling genes. The qRT-PCR was utilized to ascertain the relative expression levels in both Riogrand (R) and SalarF1 (S) with 0, 20, and 40 Days Post Harvest (DPH). Relative expression levels were calculated by log2 2−ΔΔCt method. The Y-axis indicates relative expression levels, and X-axis indicates each cultivar with three storage periods. An empty histogram suggests that the expression level was low
We hypothesize that SalaF1 fruits had more ethylene production because the genes involved in ethylene biosynthesis were increased in SalarF1 fruits. Therefore, we monitored the ethylene production from fruits in both Riogrand and SalarF1 cultivars using the gas chromatograph (GC) method. All fruits exhibited progressive ethylene production during ripening with significant differences between Riogrand and SalarF1 fruits, as shown in Fig. 9. Compared to Riogarnd during shelf-life screening, SalarF1 had a far shorter shelf life due to its much higher ethylene production. These findings indicated that the SalarF1 cultivar’s ethylene production may have been the primary factor in its decreased shelf life, as it was shorter than Riogrand’s.
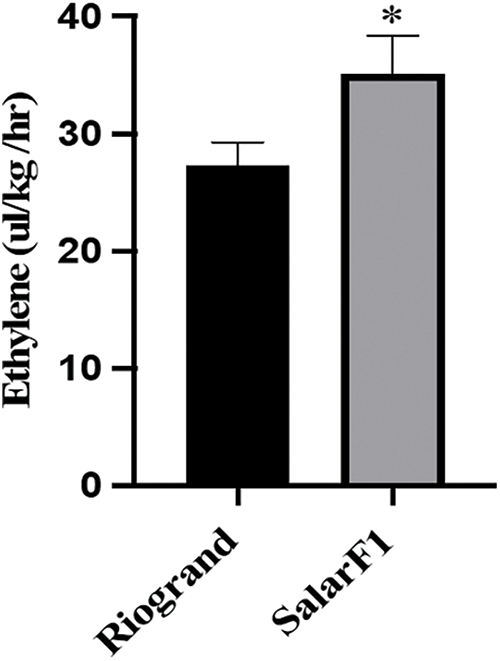
Figure 9: Ethylene production in fruits of Riogrand and SalarF1 cultivars. Data represent mean values for three independent biological replicates (n = 3). * represents significant differences between Riogrand and SalarF1 cultivars by multiple t-test with p < 0.05
Tomato fruits boast a wealth of vitamins, fibre, minerals, and antioxidants, all of which play crucial roles in human nutrition. Reducing post-harvest losses caused by fruit softening and increased vulnerability to post-harvest infections by different pathogens is one of the tomato industry’s most considerable difficulties. Biotechnology methods have been used to increase tomato’ shelf life, frequently at the sacrifice of texture, flavour, and scent [39]. Fruit softening results from cell wall-associated hydrolases breaking down or changing the cell wall polymers [17,40]. However, it is impossible to use a lot of enzymes to regulate how soft fruit gets genetically. RNA-seq technology, also known as “whole transcriptome shotgun sequencing,” is a powerful approach for thoroughly analyzing the complete transcriptome using high-throughput sequencing [41]. Unlike conventional hybridization techniques, RNA-seq technology can analyze the complete transcription data for any species at the single-nucleotide level and doesn’t require complex probe design. This technology has increasingly emerged as a new tool in genome and transcriptome research due to its advantages, including high throughput, user-friendly operation, quantitative capabilities, and cost-effectiveness. It finds widespread application in differential gene detection, identifying new genes, and analyzing gene functions. RNA-seq technology, as a next-generation sequencing method, has made significant advancements in investigating post-harvest mechanisms in fruits. Lately Guo et al. [42] conducted investigations on the tomato cultivars “JF308” and “YS006” for metabolomic analysis, transposase accessible chromatin sequencing (ATAC-seq), and a thorough transcriptome study while they were in storage. The results showed that extending the shelf life of tomato (Solanum lycopersicum) fruit requires the phenylpropanoid pathway, carbohydrate metabolism, and cell wall metabolism. In this study, two tomato cultivars with different shelf-life properties were investigated for their shelf life using RNA-seq analysis. Through the use of this method, we were able to gather accurate data that basic genome sequence analysis is unable to provide regarding the process and mechanisms at the molecular and genetic levels. After being picked when they were fully ripe, tomatoes were kept for 40 days at room temperature, during this time shelf-life analysis were done for measuring different shelf-life parameters like weight loss, firmness and production of ethylene after that samples were chosen from 0, 20 and 40 DPH stages of the storage from both cultivars. Respiration is the main means of maintaining biological activity in fruit during postharvest storage. Through our analysis, we discovered that the shelf life of tomato kept at room temperature was significantly influenced by genes linked to ethylene biosynthetic signaling. Interestingly, compared to Riogrand, the SalarF1 cultivar showed increased expression of these genes, especially during the last storage stage. The role that ethylene plays in the ripening of fruit is well established.
The two steps in the production of ethylene from S-adenosyl-L-methionine are catalyzed by 1-aminocyclopropane-1-carboxylic acid (ACC) synthase (ACS) and ACC oxidase (ACO) [43]. The rate-limiting stage in the production of ethylene is the ACS-mediated process. The transcriptional regulation of ACS genes is primarily responsible for the precise regulation of ethylene production. According to our findings, the final stage of SalarF1 had considerably higher levels of ACO1, ACO4, ACS2, and ACS6 (Fig. 6). As a result, the SalarF1’s ethylene production increased (Fig. 9). These findings suggested that the increased ethylene synthesis is the primary factor causing SalarF1’s shortened shelf life. It is also possible that the increased ERF genes are influencing SalarF1’s shelf life because they are also involved in fruit ripening and softening [44].
Fruit softening usually accompanies increased expression levels of necessary cell wall enzymes such as PG, PE, β-galactosidase (β-GAL), and β-(1,4)-glucanase and changes in other cell wall components. These factors ultimately lead to the senescence of the fruit [21]. Research indicates that in caramstar fruit kept at LT, the expression levels of PG, PE, β-galactosidase (β-GAL), and β-(1,4)-glucanase are blocked, which delays the fruit’s softening process [45,46]. A thorough investigation into how genes related to cell walls affect fruit senescence has been carried out [47,48]. Research supports the hypothesis that fruit senescence and cell wall deterioration occur simultaneously [49,50]. Complex changes in elemental texture are associated with changes in cell adhesion, turgor, and wall remodeling [51,52]. Increased enzymatic activity, such as those produced by β-Gal, CESA, PL, EXPA, and XTH encoding products, may affect textural alterations. Recent extracellular enzymology experiments have shown that CesA can promote cellulose accumulation in the presence of UDP-glucose, suggesting that no additional conditions are required for CesA activity [53].
Furthermore, additional enzymes that break down cell walls have been found, including PL [13,52], XTH [54,55], and EXPA [56,57], all of which encourage textural alterations and the thinning of cell walls. The current findings indicate that SalarF1 fruit longevity may be attributed to the up-regulated expression of fruit softening-related genes, as seen in Fig. 8, compared to Riogrand fruit longevity. We identified hundreds of DEGs linked to both cultivars across three comparison groups using RNA-seq techniques. The obtained data demonstrated the involvement of these DEGs in signal transduction, secondary metabolite synthesis, self-immunity, ethylene biosynthesis, signalling genes, cell wall loosening and related genes, signal transduction, and other biological activities. The outcomes demonstrated that the transcriptome sequencing output and assembly quality we achieved satisfy transcriptome analysis criteria. We can get much transcriptional data using RNA-seq technology, which opens up a wealth of resources and directions for future study. Most of these genes showed increased expression, suggesting that a considerable fraction of Differentially Expressed Genes (DEGs) actively prolong the tomato’ shelf life. Significantly, fewer DEGs were found in Riogrand than in SalarF1, indicating that SalarF1 is more susceptible to deterioration in the shelf life at room temperature than Riogrand. According to KEGG analysis, plant hormone signal transduction was the most enriched pathway. One of the most crucial factors in preserving tomatoes for an extended period is their shelf life, which may be extended by preventing deterioration. Research has shown that ethylene production, weight loss, and firmness contribute to this. Therefore, finding related genes through RNA-seq technology is the best way to identify the associated genes and alter those genes through biotechnological approaches. In this study, we found different genes that may play an essential role in tomato shelf life, which can be useful for further research.
The differences in transcriptomic analysis between Riogrand and SalarF1 tomato fruits with different shelf-life parameters were investigated. This study showed that Riogrand, with a firmer structure, maintaining less weight loss during storage, and producing a low level of ethylene, had a much longer shelf life than SalarF1. SalarF1 had greater expression levels of genes linked to cell wall loss, signaling, ethylene production, and cell wall loss. By the final stage of storage in SalarF1, compared to Riogrand, the expression of genes linked to ethylene production, signaling, cell wall losses, and cell wall-related genes increased. The findings proposed a theoretical foundation for delaying quality degradation during post-harvest storage. This indicates that ethylene production and signaling genes, cell wall losses, and cell wall-related genes are involved in tomato fruit shelf-life during storage. Thus, the unique genes found in this study may be helpful for further research aiming at comprehending the mechanisms controlling tomato shelf life.
Acknowledgement: None.
Funding Statement: This research was supported by the National Natural Science Foundation of China (Grant No. U23A20204) and the “Wanjiang Scholar Program (Anhui Province)”.
Author Contributions: The authors confirm their contribution to the paper: Songhu Wang and Yajing Liu planned and designed the research. Abdul Karim Amin, Mohammad Alem Amin, Ahmad Shah Ahmadzai, Pengwei Li, Yan He, Xianglong Wang, Muhammad Ahmad Hassan Mohammad, Mohammad Yousof Soltani and Yiling Zhang performed the experiments and analyzed data. Abdul Karim Amin, Yajing Liu and Songhu Wang wrote the manuscript. All authors reviewed the results and approved the final version of the manuscript.
Availability of Data and Materials: The original data presented in the study are openly available in the NCBI repository at https://www.ncbi.nlm.nih.gov/bioproject/PRJNA1100749 (accessed on 16 August 2024) or accession number: PRJNA1100749.
Ethics Approval: Not applicable.
Conflicts of Interest: The authors declare that they have no conflicts of interest to report regarding the present study.
Supplementary Materials: The supplementary material is available online at https://doi.org/10.32604/phyton.2024.054641.
References
1. Story EN, Kopec RE, Schwartz SJ, Harris GK. An update on the health effects of tomato lycopene. Annu Rev Food Sci Technol. 2010;1(1):189–210. doi:10.1146/annurev.food.102308.124120. [Google Scholar] [PubMed] [CrossRef]
2. Raiola A, Rigano MM, Calafiore R, Frusciante L, Barone A. Enhancing the health-promoting effects of tomato fruit for biofortified food. Mediators Inflamm. 2014;2014:139873. doi:10.1155/2014/139873. [Google Scholar] [PubMed] [CrossRef]
3. Lee CG, Iida T, Uwagaki Y, Otani Y, Nakaho K, Ohkuma M. Comparison of prokaryotic and eukaryotic communities in soil samples with and without tomato bacterial wilt collected from different fields. Microbes Environ. 2017;32(4):376–85. doi:10.1264/jsme2.ME17131. [Google Scholar] [PubMed] [CrossRef]
4. Singh VK, Singh AK, Kumar A. Disease management of tomato through PGPB: current trends and future perspective. 3 Biotech. 2017;7(4):255. doi:10.1007/s13205-017-0896-1. [Google Scholar] [PubMed] [CrossRef]
5. Li Y, Niu W, Dyck M, Wang J, Zou X. Yields and nutritional of greenhouse tomato in response to different soil aeration volume at two depths of subsurface drip irrigation. Sci Rep. 2016;6:39307. doi:10.1038/srep39307. [Google Scholar] [PubMed] [CrossRef]
6. Zheng X, Zhu Y, Wang J, Wang Z, Liu B. Combined use of a microbial restoration substrate and avirulent Ralstonia solanacearum for the control of tomato bacterial wilt. Sci Rep. 2019;9(1):20091. doi:10.1038/s41598-019-56572-y. [Google Scholar] [PubMed] [CrossRef]
7. Kapotis G, Passam HC, Akoumianakis K, Olympios CM. Storage of tomatoes in low oxygen atmospheres inhibits ethylene action and polygalacturonase activity. Russ J Plant Physiol. 2004;51(1):112–5. doi:10.1023/B:RUPP.0000011310.84965.74. [Google Scholar] [CrossRef]
8. Kim JY, Kim SK, Jung J, Jeong MJ, Ryu CM. Exploring the sound-modulated delay in tomato ripening through expression analysis of coding and non-coding RNAs. Ann Bot. 2018;122(7):1231–44. doi:10.1093/aob/mcy134. [Google Scholar] [PubMed] [CrossRef]
9. Brumos J. Gene regulation in climacteric fruit ripening. Curr Opin Plant Biol. 2021;63:102042. doi:10.1016/j.pbi.2021.102042. [Google Scholar] [PubMed] [CrossRef]
10. Jiménez-Bermúdez S, Redondo-Nevado J, Muñoz-Blanco J, Caballero JL, López-Aranda JM, Valpuesta V, et al. Manipulation of strawberry fruit softening by antisense expression of a pectate lyase gene. Plant Physiol. 2002;128(2):751–9. doi:10.1104/pp.010671. [Google Scholar] [PubMed] [CrossRef]
11. Song J-S, Yoo S-K, Kim D-S. The effect of 1-(3-phenyl-propyl)cyclopropene versus 1-MCP on the quality and storage life of tomato (Solanum lycopersicum) fruit. Postharvest Biol Tec. 2018;145:20–6. doi:10.1016/j.postharvbio.2018.05.021. [Google Scholar] [CrossRef]
12. Uluisik S, Chapman NH, Smith R, Poole M, Adams G, Gillis RB, et al. Genetic improvement of tomato by targeted control of fruit softening. Nat Biotechnol. 2016;34(9):950–2. doi:10.1038/nbt.3602. [Google Scholar] [PubMed] [CrossRef]
13. Yang L, Huang W, Xiong F, Xian Z, Su D, Ren M, et al. Silencing of SlPL, which encodes a pectate lyase in tomato, confers enhanced fruit firmness, prolonged shelf-life and reduced susceptibility to grey mould. Plant Biotechnol J. 2017;15(12):1544–55. doi:10.1111/pbi.2017.15.issue-12. [Google Scholar] [CrossRef]
14. Carrasco-Valenzuela T, Muñoz-Espinoza C, Riveros A, Pedreschi R, Arús P, Campos-Vargas R, et al. Expression QTL (eQTLs) analyses reveal candidate genes associated with fruit flesh softening rate in peach [Prunus persica (L.) Batsch]. Front Plant Sci. 2019;10:1581. doi:10.3389/fpls.2019.01581. [Google Scholar] [PubMed] [CrossRef]
15. Cantu D, Blanco-Ulate B, Yang L, Labavitch JM, Bennett AB, Powell AL. Ripening-regulated susceptibility of tomato fruit to Botrytis cinerea requires NOR but not RIN or ethylene. Plant Physiol. 2009;150(3):1434–49. doi:10.1104/pp.109.138701. [Google Scholar] [PubMed] [CrossRef]
16. Meli VS, Ghosh S, Prabha TN, Chakraborty N, Chakraborty S, Datta A. Enhancement of fruit shelf life by suppressing N-glycan processing enzymes. Proc Natl Acad Sci U S A. 2010;107(6):2413–8. doi:10.1073/pnas.0909329107. [Google Scholar] [PubMed] [CrossRef]
17. Brummell DA, Harpster MH. Cell wall metabolism in fruit softening and quality and its manipulation in transgenic plants. Plant Mol Biol. 2001;47(1–2):311–40. [Google Scholar] [PubMed]
18. Giongo L, Poncetta P, Loretti P, Costa F. Texture profiling of blueberries (Vaccinium spp.) during fruit development, ripening and storage. Postharvest Biol Tec. 2013;76:34–9. doi:10.1016/j.postharvbio.2012.09.004. [Google Scholar] [CrossRef]
19. Zhou Q, Zhang F, Ji S, Dai H, Zhou X, Wei B, et al. Abscisic acid accelerates postharvest blueberry fruit softening by promoting cell wall metabolism. Sci Hortic. 2021;288:110325. doi:10.1016/j.scienta.2021.110325. [Google Scholar] [CrossRef]
20. Ma L, Wang Q, Li L, Grierson D, Yuan S, Zheng S, et al. UV-C irradiation delays the physiological changes of bell pepper fruit during storage. Postharvest Biol Tec. 2021;180:111506. doi:10.1016/j.postharvbio.2021.111506. [Google Scholar] [CrossRef]
21. Ali ZM, Chin L-H, Marimuthu M, Lazan H. Low temperature storage and modified atmosphere packaging of carambola fruit and their effects on ripening related texture changes, wall modification and chilling injury symptoms. Postharvest Biol Tec. 2004;33(2):181–92. doi:10.1016/j.postharvbio.2004.02.007. [Google Scholar] [CrossRef]
22. Huan C, An X, Yu M, Jiang L, Ma R, Tu M, et al. Effect of combined heat and 1-MCP treatment on the quality and antioxidant level of peach fruit during storage. Postharvest Biol Tec. 2018;145:193–202. doi:10.1016/j.postharvbio.2018.07.013. [Google Scholar] [CrossRef]
23. Wang X, Fu X, Chen M, Huan L, Liu W, Qi Y, et al. Ultraviolet B irradiation influences the fruit quality and sucrose metabolism of peach (Prunus persica L.). Environ Exp Bot. 2018;153:286–301. doi:10.1016/j.envexpbot.2018.04.015. [Google Scholar] [CrossRef]
24. Zhang Z, Zhao P, Zhang P, Su L, Jia H, Wei X, et al. Integrative transcriptomics and metabolomics data exploring the effect of chitosan on postharvest grape resistance to Botrytis cinerea. Postharvest Biol Tec. 2020;167:111248. doi:10.1016/j.postharvbio.2020.111248. [Google Scholar] [CrossRef]
25. Duan W, Shao W, Lin W, Yuan L, Lu Q, Chen L, et al. Integrated metabolomics and transcriptomics reveal the differences in fruit quality of the red and white Fragaria pentaphylla morphs. Food Biosci. 2021;40:100896. doi:10.1016/j.fbio.2021.100896. [Google Scholar] [CrossRef]
26. Xu J, Zhang Y, Qi D, Huo H, Dong X, Tian L, et al. Metabolomic and transcriptomic analyses highlight the influence of lipid changes on the post-harvest softening of Pyrus ussurian Max. ‘Zaoshu Shanli’. Genomics. 2021;113(1):919–26. doi:10.1016/j.ygeno.2020.10.025. [Google Scholar] [PubMed] [CrossRef]
27. Mortazavi A, Williams BA, McCue K, Schaeffer L, Wold B. Mapping and quantifying mammalian transcriptomes by RNA-Seq. Nat Methods. 2008;5(7):621–8. doi:10.1038/nmeth.1226. [Google Scholar] [PubMed] [CrossRef]
28. Wang L, Zhao S, Gu C, Zhou Y, Zhou H, Ma J, et al. Deep RNA-Seq uncovers the peach transcriptome landscape. Plant Mol Biol. 2013;83(4–5):365–77. [Google Scholar] [PubMed]
29. Nambeesan S, Datsenka T, Ferruzzi MG, Malladi A, Mattoo AK, Handa AK. Overexpression of yeast spermidine synthase impacts ripening, senescence and decay symptoms in tomato. Plant J. 2010;63(5):836–47. doi:10.1111/tpj.2010.63.issue-5. [Google Scholar] [CrossRef]
30. Kim D, Langmead B, Salzberg SL. HISAT: a fast spliced aligner with low memory requirements. Nat Methods. 2015;12(4):357–60. doi:10.1038/nmeth.3317. [Google Scholar] [PubMed] [CrossRef]
31. Roberts A, Trapnell C, Donaghey J, Rinn JL, Pachter L. Improving RNA-Seq expression estimates by correcting for fragment bias. Genome Biol. 2011;12(3):R22. doi:10.1186/gb-2011-12-3-r22. [Google Scholar] [PubMed] [CrossRef]
32. Anders S, Pyl PT, Huber W. HTSeq—a Python framework to work with high-throughput sequencing data. Bioinformatics. 2015;31(2):166–9. doi:10.1093/bioinformatics/btu638. [Google Scholar] [PubMed] [CrossRef]
33. Love MI, Huber W, Anders S. Moderated estimation of fold change and dispersion for RNA-seq data with DESeq2. Genome Biol. 2014;15(12):550. doi:10.1186/s13059-014-0550-8. [Google Scholar] [PubMed] [CrossRef]
34. Carbon S, Douglass E, Dunn N, Good B, Harris NL, Lewis SE, et al. The gene ontology resource: 20 years and still GOing strong. Nucleic Acids Res. 2019;47(D1):D330–8. doi:10.1093/nar/gky1055. [Google Scholar] [PubMed] [CrossRef]
35. Kanehisa M, Araki M, Goto S, Hattori M, Hirakawa M, Itoh M, et al. KEGG for linking genomes to life and the environment. Nucleic Acids Res. 2008;36:D480–4. doi:10.1093/nar/gkm882. [Google Scholar] [PubMed] [CrossRef]
36. Subramanian A, Tamayo P, Mootha VK, Mukherjee S, Ebert BL, Gillette MA, et al. Gene set enrichment analysis: a knowledge-based approach for interpreting genome-wide expression profiles. Proc Natl Acad Sci U S A. 2005;102(43):15545–50. doi:10.1073/pnas.0506580102. [Google Scholar] [PubMed] [CrossRef]
37. Mootha VK, Lindgren CM, Eriksson KF, Subramanian A, Sihag S, Lehar J, et al. PGC-1α-responsive genes involved in oxidative phosphorylation are coordinately downregulated in human diabetes. Nat Genet. 2003;34(3):267–73. doi:10.1038/ng1180. [Google Scholar] [PubMed] [CrossRef]
38. Livak KJ, Schmittgen TD. Analysis of relative gene expression data using real-time quantitative PCR and the 2−ΔΔCT method. Methods. 2001;25(4):402–8. doi:10.1006/meth.2001.1262. [Google Scholar] [PubMed] [CrossRef]
39. Baldwin E, Plotto A, Narciso J, Bai J. Effect of 1-methylcyclopropene on tomato flavour components, shelf life and decay as influenced by harvest maturity and storage temperature. J Sci Food Agric. 2011;91(6):969–80. doi:10.1002/jsfa.4281. [Google Scholar] [PubMed] [CrossRef]
40. Fischer RL, Bennett AB. Role of cell wall hydrolases in fruit ripening. Annu Rev Plant Biol. 1991;42(1):675–703. doi:10.1146/arplant.1991.42.issue-1. [Google Scholar] [CrossRef]
41. Wang Z, Gerstein M, Snyder M. RNA-Seq: a revolutionary tool for transcriptomics. Nat Rev Genet. 2009;10(1):57–63. doi:10.1038/nrg2484. [Google Scholar] [PubMed] [CrossRef]
42. Guo S, Ji Y, Zheng Y, Watkins CB, Ma L, Wang Q, et al. Transcriptomic, metabolomic, and ATAC-seq analysis reveal the regulatory mechanism of senescence of post-harvest tomato fruit. Front Plant Sci. 2023;14:1142913. doi:10.3389/fpls.2023.1142913. [Google Scholar] [PubMed] [CrossRef]
43. Pattyn J, Vaughan-Hirsch J, Van de Poel B. The regulation of ethylene biosynthesis: a complex multilevel control circuitry. New Phytol. 2021;229(2):770–82. doi:10.1111/nph.v229.2. [Google Scholar] [CrossRef]
44. Chung MY, Vrebalov J, Alba R, Lee J, McQuinn R, Chung JD, et al. A tomato (Solanum lycopersicum) APETALA2/ERF gene, SlAP2a, is a negative regulator of fruit ripening. Plant J. 2010;64(6):936–47. doi:10.1111/tpj.2010.64.issue-6. [Google Scholar] [CrossRef]
45. Chen Y, Zhang X, Luo Z, Sun J, Li L, Yin X, et al. Effects of inside-out heat-shock via microwave on the fruit softening and quality of persimmon during postharvest storage. Food Chem. 2021;349:129161. doi:10.1016/j.foodchem.2021.129161. [Google Scholar] [PubMed] [CrossRef]
46. Win NM, Yoo J, Naing AH, Kwon J-G, Kang I-K. 1-Methylcyclopropene (1-MCP) treatment delays modification of cell wall pectin and fruit softening in “Hwangok” and “Picnic” apples during cold storage. Postharvest Biol Tec. 2021;180:111599. doi:10.1016/j.postharvbio.2021.111599. [Google Scholar] [CrossRef]
47. Forlani S, Masiero S, Mizzotti C. Fruit ripening: the role of hormones, cell wall modifications, and their relationship with pathogens. J Exp Bot. 2019;70(11):2993–3006. doi:10.1093/jxb/erz112. [Google Scholar] [PubMed] [CrossRef]
48. Posé S, Paniagua C, Matas AJ, Gunning AP, Morris VJ, Quesada MA, et al. A nanostructural view of the cell wall disassembly process during fruit ripening and postharvest storage by atomic force microscopy. Trends Food Sci Technol. 2019;87:47–58. doi:10.1016/j.tifs.2018.02.011. [Google Scholar] [CrossRef]
49. Shi Z, Yang H, Jiao J, Wang F, Lu Y, Deng J. Effects of graft copolymer of chitosan and salicylic acid on reducing rot of postharvest fruit and retarding cell wall degradation in grapefruit during storage. Food Chem. 2019;283:92–100. doi:10.1016/j.foodchem.2018.12.078. [Google Scholar] [PubMed] [CrossRef]
50. Kim JS, Lee J, Ezura H. SlMBP3 knockout/down in tomato: normal-sized fruit with increased dry matter content through non-liquefied locular tissue by altered cell wall formation. Plant Cell Physiol. 2022;63(10):1485–99. doi:10.1093/pcp/pcac110. [Google Scholar] [PubMed] [CrossRef]
51. Zhai R, Liu J, Liu F, Zhao Y, Liu L, Fang C, et al. Melatonin limited ethylene production, softening and reduced physiology disorder in pear (Pyrus communis L.) fruit during senescence. Postharvest Biol Tec. 2018;139:38–46. doi:10.1016/j.postharvbio.2018.01.017. [Google Scholar] [CrossRef]
52. Shi L, Liu Q, Qiao Q, Zhu Y, Huang W, Wang X, et al. Exploring the effects of pectate and pectate lyase on the fruit softening and transcription profiling of Solanum lycopersicum. Food Control. 2022;133:108636. doi:10.1016/j.foodcont.2021.108636. [Google Scholar] [CrossRef]
53. Purushotham P, Cho SH, Díaz-Moreno SM, Kumar M, Nixon BT, Bulone V, et al. A single heterologously expressed plant cellulose synthase isoform is sufficient for cellulose microfibril formation in vitro. Proc Natl Acad Sci USA. 2016;113(40):11360–5. doi:10.1073/pnas.1606210113. [Google Scholar] [PubMed] [CrossRef]
54. Speicher TL, Li PZ, Wallace IS. Phosphoregulation of the plant cellulose synthase complex and cellulose synthase-like proteins. Plants. 2018;7(3):52. doi:10.3390/plants7030052. [Google Scholar] [PubMed] [CrossRef]
55. Ezquer I, Salameh I, Colombo L, Kalaitzis P. Plant cell walls tackling climate change: insights into plant cell wall remodeling, its regulation, and biotechnological strategies to improve crop adaptations and photosynthesis in response to global warming. Plants. 2020;9(2):212. doi:10.3390/plants9020212. [Google Scholar] [PubMed] [CrossRef]
56. Mohanty SK, Arthikala M-K, Nanjareddy K, Lara M. Plant-symbiont interactions: the functional role of expansins. Symbiosis. 2018;74(1):1–10. doi:10.1007/s13199-017-0501-8. [Google Scholar] [CrossRef]
57. Ilias IA, Negishi K, Yasue K, Jomura N, Morohashi K, Baharum SN, et al. Transcriptome-wide effects of expansin gene manipulation in etiolated Arabidopsis seedling. J Plant Res. 2019;132(2):159–72. doi:10.1007/s10265-018-1067-0. [Google Scholar] [PubMed] [CrossRef]
Cite This Article
 Copyright © 2024 The Author(s). Published by Tech Science Press.
This work is licensed under a Creative Commons Attribution 4.0 International License , which permits unrestricted use, distribution, and reproduction in any medium, provided the original work is properly cited.
 Downloads
 Citation Tools